Embed Size (px)
DESCRIPTION
CAT Modelling Insurance
Citation preview
1
11
Fundamentals of Catastrophe Modeling
CAS Ratemaking & Product Management Seminar
Catastrophe Modeling Workshop
March 15, 2010
22
The Casualty Actuarial Society is committed to adhering strictlyThe Casualty Actuarial Society is committed to adhering strictlyto the letter and spirit of the antitrust laws. Seminars to the letter and spirit of the antitrust laws. Seminars conducted under the auspices of the CAS are designed solely to conducted under the auspices of the CAS are designed solely to provide a forum for the expression of various points of view on provide a forum for the expression of various points of view on topics described in the programs or agendas for such meetings. topics described in the programs or agendas for such meetings.
Under no circumstances shall CAS seminars be used as a means Under no circumstances shall CAS seminars be used as a means for competing companies or firms to reach any understanding for competing companies or firms to reach any understanding ––expressed or implied expressed or implied –– that restricts competition or in any way that restricts competition or in any way impairs the ability of members to exercise independent business impairs the ability of members to exercise independent business judgment regarding matters affecting competition. judgment regarding matters affecting competition.
It is the responsibility of all seminar participants to be awareIt is the responsibility of all seminar participants to be aware of of antitrust regulations, to prevent any written or verbal antitrust regulations, to prevent any written or verbal discussions that appear to violate these laws, and to adhere in discussions that appear to violate these laws, and to adhere in every respect to the CAS antitrust compliance policy.every respect to the CAS antitrust compliance policy.
ANTITRUST NOTICE
33
Fundamentals of Cat Modeling
Example of cat modeling terminology:
“The Company’s 100‐year return period loss shall be derived from results produced by Version 6.0 catastrophe modeling software, using near term perspective, but no demand surge or secondary uncertainty.”
“It would be so nice if something made sense for a change.”
– Alice, from Lewis Carroll’s, Alice’s Adventures in Wonderland
2
44
Agenda
• What is a catastrophe model?
• Why use cat models?
• How cat models work
• Cat model inputs
• Cat model outputs & analytics
• Considerations/adjustments
“Prediction is very hard – especially when it’s about the future”– Yogi Berra
Fundamentals of Cat Modeling
55
What Is a Catastrophe Model?
A computerized system that generates a robust set of simulated events and:
• Estimates the magnitude/intensity and location• Determines the amount of damage • Calculates the insured loss
Cat models are designed to answer:• Where future events can occur• How big future events can be• Expected frequency of events• Potential damage and insured loss
66
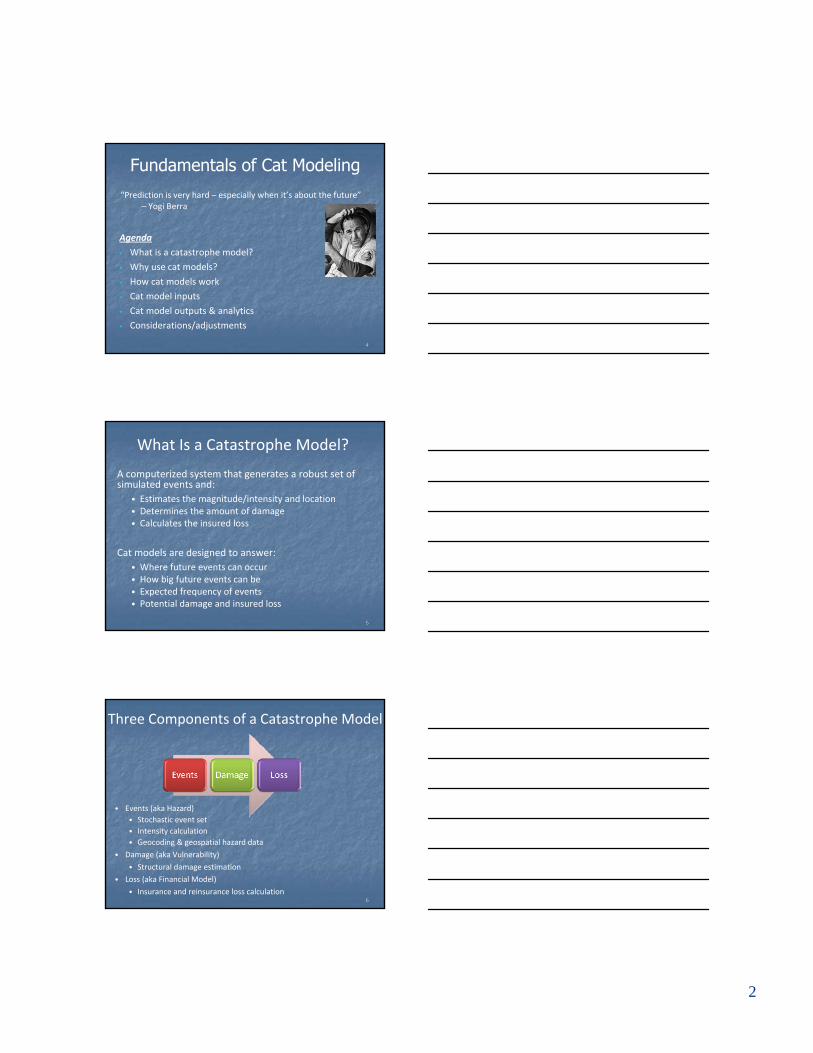
• Events (aka Hazard)• Stochastic event set• Intensity calculation• Geocoding & geospatial hazard data
• Damage (aka Vulnerability)
• Structural damage estimation• Loss (aka Financial Model)
• Insurance and reinsurance loss calculation
Three Components of a Catastrophe Model
3
77
Types of Perils Modeled within the P&C Industry
Natural Catastrophes:• Hurricane• Earthquake – Shake & Fire Following• Tornado / Hail• Winter storms (snow, ice, freezing rain)• Flood• Wild Fire
Man‐Made Catastrophes:• Terrorism
88
99
Types of Losses Modeled• Direct
• Physical damage to buildings, outbuildings, and contents (coverages A, B, C)
• Work Comp; deaths, injuries
• Indirect• Loss of use
• Additional Living Expense• Business Interruption
• Loss Amplification / Demand Surge• For large events, higher materials,
labor and repair delays• Residual demand surge
4
1010
Uses of Catastrophe Models
Primary Metrics:• Average Annual Loss (AAL): Expected Loss• Probable Maximum Loss (PML)/Exceedance Probability (EP)
Potential Uses:• Ratemaking (rate level and rating plans)• Portfolio management & optimization• Underwriting/risk selection• Loss mitigation strategies• Allocation of cost of capital, cost of reinsurance• Reinsurance/risk transfer analysis• Enterprise risk management• Financial & capital adequacy analysis (rating agency)
1111
Advantage of Cat ModelsCatastrophe models provide comprehensive information on current and future loss potential.
Modeled Data:• Large number of simulated years creates a comprehensive distribution of potential events
• Use of current exposures represents the latest population, building codes and replacement values
Historical Data:• Historical experience is not complete or reflective of potential due to limited historical records, infrequent events, and potentially changing conditions
• Historical data reflects population, building codes, and replacement values at time of historical loss.
• Coastal population concentrations and replacement costs have been rapidly increasing.
1212
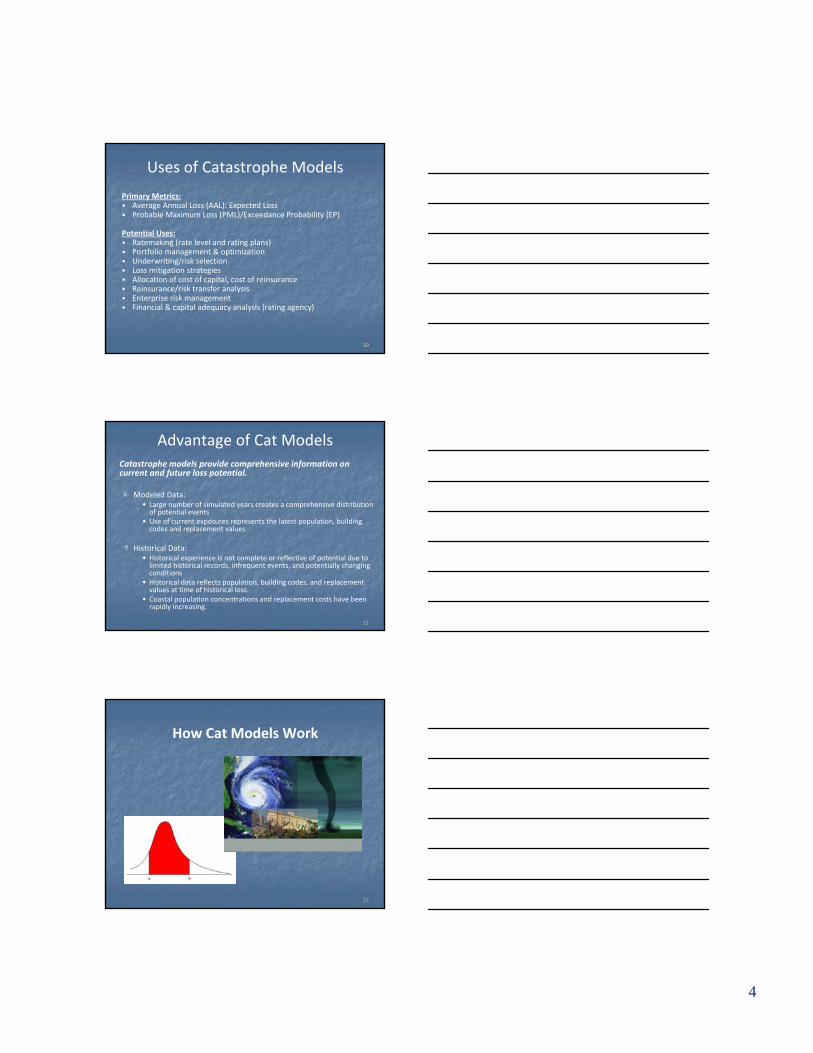
How Cat Models Work
5
1313
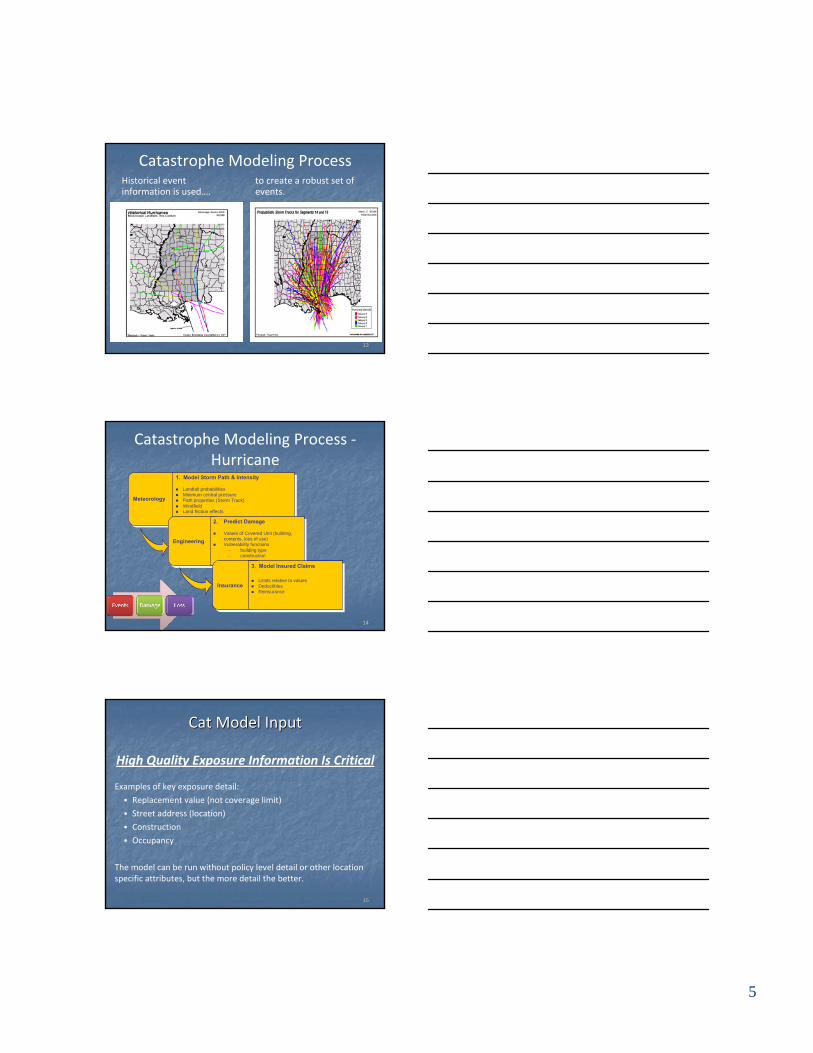
Catastrophe Modeling ProcessHistorical event information is used….
to create a robust set of events.
1414
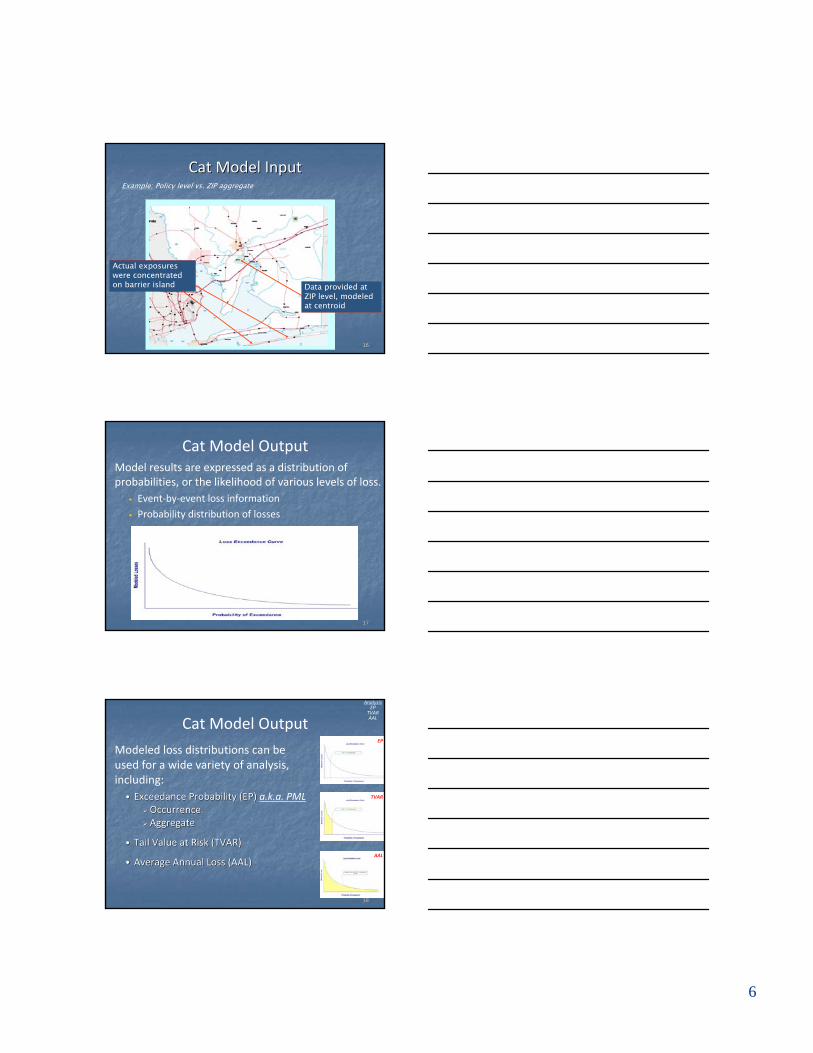
Catastrophe Modeling Process ‐Hurricane
MeteorologyMeteorology
1. Model Storm Path & Intensity
Landfall probabilitiesMinimum central pressurePath properties (Storm Track)WindfieldLand friction effects
1. Model Storm Path & Intensity
Landfall probabilitiesMinimum central pressurePath properties (Storm Track)WindfieldLand friction effects
EngineeringEngineering
2. Predict Damage
Values of Covered Unit (building, contents, loss of use)Vulnerability functions⎯ building type⎯ construction
2. Predict Damage
Values of Covered Unit (building, contents, loss of use)Vulnerability functions⎯ building type⎯ construction
InsuranceInsurance
3. Model Insured Claims
Limits relative to valuesDeductiblesReinsurance
3. Model Insured Claims
Limits relative to valuesDeductiblesReinsurance
1515
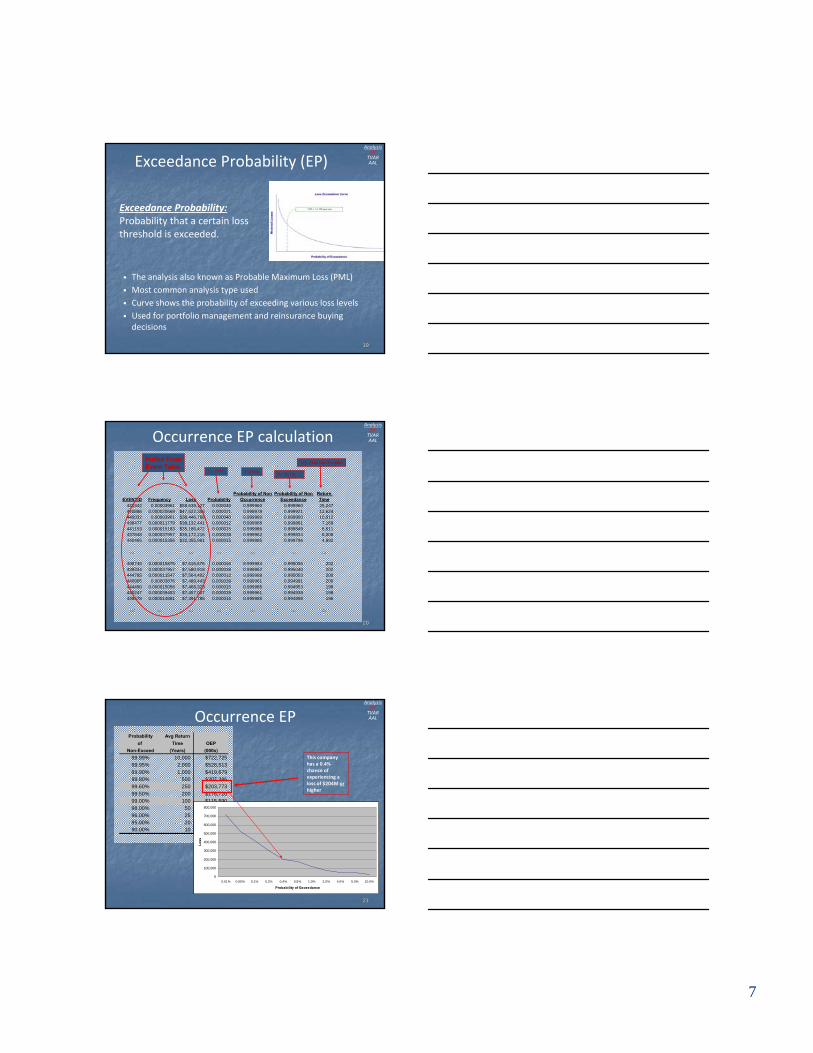
Cat Model InputCat Model Input
High Quality Exposure Information Is Critical
Examples of key exposure detail:
• Replacement value (not coverage limit)
• Street address (location)
• Construction
• Occupancy
The model can be run without policy level detail or other location specific attributes, but the more detail the better.
6
1616
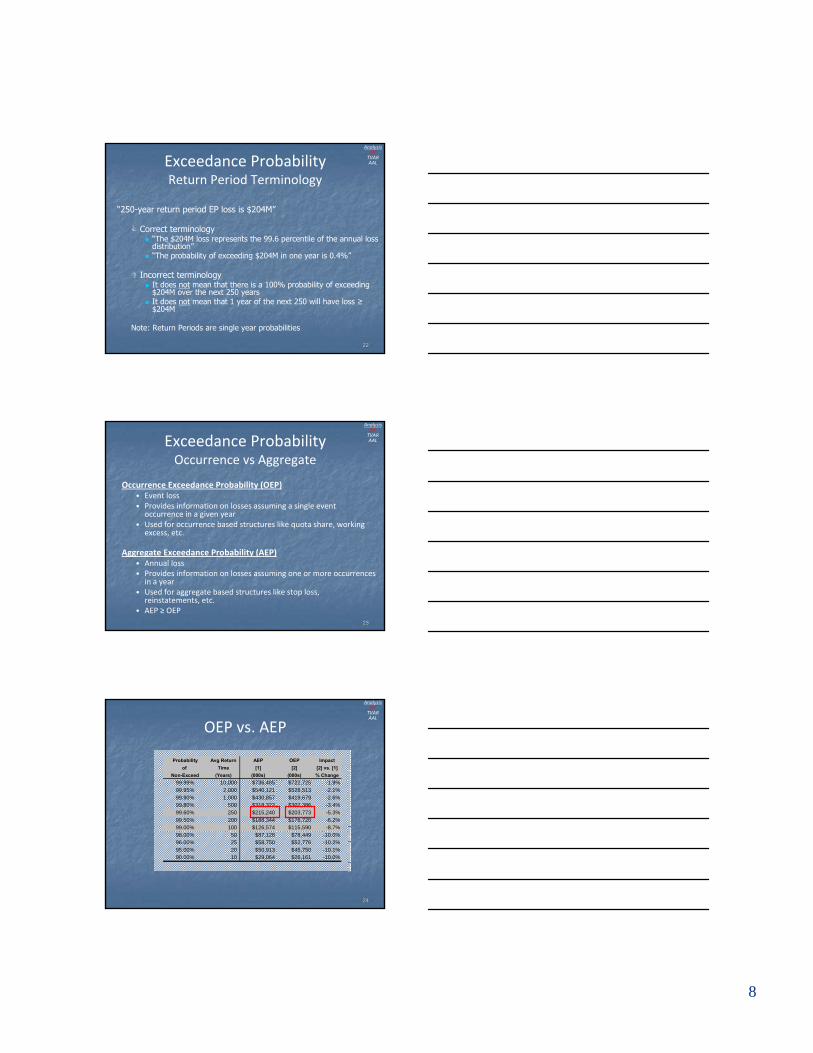
Data provided at ZIP level, modeledat centroid
Actual exposures were concentrated on barrier island
Example: Policy level vs. ZIP aggregate
Cat Model InputCat Model Input
1717
Cat Model OutputModel results are expressed as a distribution of probabilities, or the likelihood of various levels of loss.
• Event‐by‐event loss information
• Probability distribution of losses
1818
Cat Model Output
Modeled loss distributions can be used for a wide variety of analysis, including:
•• ExceedanceExceedance Probability (EP) Probability (EP) a.k.a. PMLOccurrenceOccurrenceAggregateAggregate
•• Tail Value at Risk (TVAR)Tail Value at Risk (TVAR)
•• Average Annual Loss (AAL)Average Annual Loss (AAL)
AnalysisEP
TVARAAL
EP
TVAR
AAL
7
1919
Exceedance Probability (EP)
• The analysis also known as Probable Maximum Loss (PML)• Most common analysis type used• Curve shows the probability of exceeding various loss levels• Used for portfolio management and reinsurance buying decisions
AnalysisEP
TVARAAL
Exceedance Probability:Probability that a certain loss threshold is exceeded.
2020
Pulled FromEvent Table
1 - ℮(-Rate)P1 * P2 * P3 …
1/(1- Prob Non-Exceed)
1 - Prob
EVENTID Frequency Loss ProbabilityProbability of Non
OccurrenceProbability of Non
ExceedanceReturn Time
440342 0.00003961 $58,639,127 0.000040 0.999960 0.999960 25,247440886 0.000020668 $47,522,356 0.000021 0.999979 0.999921 12,624440032 0.00003961 $38,446,768 0.000040 0.999960 0.999900 10,012438477 0.000011779 $38,132,441 0.000012 0.999988 0.999861 7,169441153 0.000015183 $35,186,472 0.000015 0.999985 0.999849 6,611437848 0.000037957 $35,172,216 0.000038 0.999962 0.999834 6,008440465 0.000015356 $32,355,961 0.000015 0.999985 0.999796 4,892
… … … … … … …
438740 0.000015875 $7,615,676 0.000016 0.999984 0.995056 202439334 0.000037957 $7,580,918 0.000038 0.999962 0.995040 202444785 0.000011547 $7,564,402 0.000012 0.999988 0.995003 200440905 0.00003876 $7,489,443 0.000039 0.999961 0.994991 200444490 0.000015056 $7,468,328 0.000015 0.999985 0.994953 198440247 0.000039453 $7,457,007 0.000039 0.999961 0.994938 198439578 0.000014681 $7,391,786 0.000015 0.999985 0.994898 196
… … … … … … …
Occurrence EP calculationAnalysis
EPTVARAAL
2121
Probability Avg Returnof Time OEP
Non-Exceed (Years) (000s)99.99% 10,000 $722,72599.95% 2,000 $528,51399.90% 1,000 $419,67999.80% 500 $307,38699.60% 250 $203,77399.50% 200 $176,72099.00% 100 $115,59098.00% 50 $78,44996.00% 25 $52,77695.00% 20 $45,75090.00% 10 $26,161
Occurrence EP
0
100,000
200,000
300,000
400,000
500,000
600,000
700,000
800,000
0.01% 0.05% 0.1% 0.2% 0.4% 0.5% 1.0% 2.0% 4.0% 5.0% 10.0%
Probability of Exceedance
Loss
This company has a 0.4% chance of experiencing a loss of $204M orhigher
AnalysisEP
TVARAAL
8
2222
Exceedance ProbabilityReturn Period Terminology
“250-year return period EP loss is $204M”
Correct terminology“The $204M loss represents the 99.6 percentile of the annual lossdistribution”“The probability of exceeding $204M in one year is 0.4%”
Incorrect terminologyIt does not mean that there is a 100% probability of exceeding $204M over the next 250 yearsIt does not mean that 1 year of the next 250 will have loss ≥$204M
Note: Return Periods are single year probabilities
AnalysisEP
TVARAAL
2323
Exceedance ProbabilityOccurrence vs Aggregate
Occurrence Exceedance Probability (OEP)• Event loss• Provides information on losses assuming a single event
occurrence in a given year• Used for occurrence based structures like quota share, working
excess, etc.
Aggregate Exceedance Probability (AEP)• Annual loss• Provides information on losses assuming one or more occurrences
in a year• Used for aggregate based structures like stop loss,
reinstatements, etc.• AEP ≥ OEP
AnalysisEP
TVARAAL
2424
Probability Avg Return AEP OEP Impactof Time [1] [2] [2] vs. [1]
Non-Exceed (Years) (000s) (000s) % Change99.99% 10,000 $736,485 $722,725 -1.9%99.95% 2,000 $540,121 $528,513 -2.1%99.90% 1,000 $430,857 $419,679 -2.6%99.80% 500 $318,322 $307,386 -3.4%99.60% 250 $215,240 $203,773 -5.3%99.50% 200 $188,344 $176,720 -6.2%99.00% 100 $126,574 $115,590 -8.7%98.00% 50 $87,128 $78,449 -10.0%96.00% 25 $58,750 $52,776 -10.2%95.00% 20 $50,913 $45,750 -10.1%90.00% 10 $29,064 $26,161 -10.0%
OEP vs. AEP
AnalysisEP
TVARAAL
9
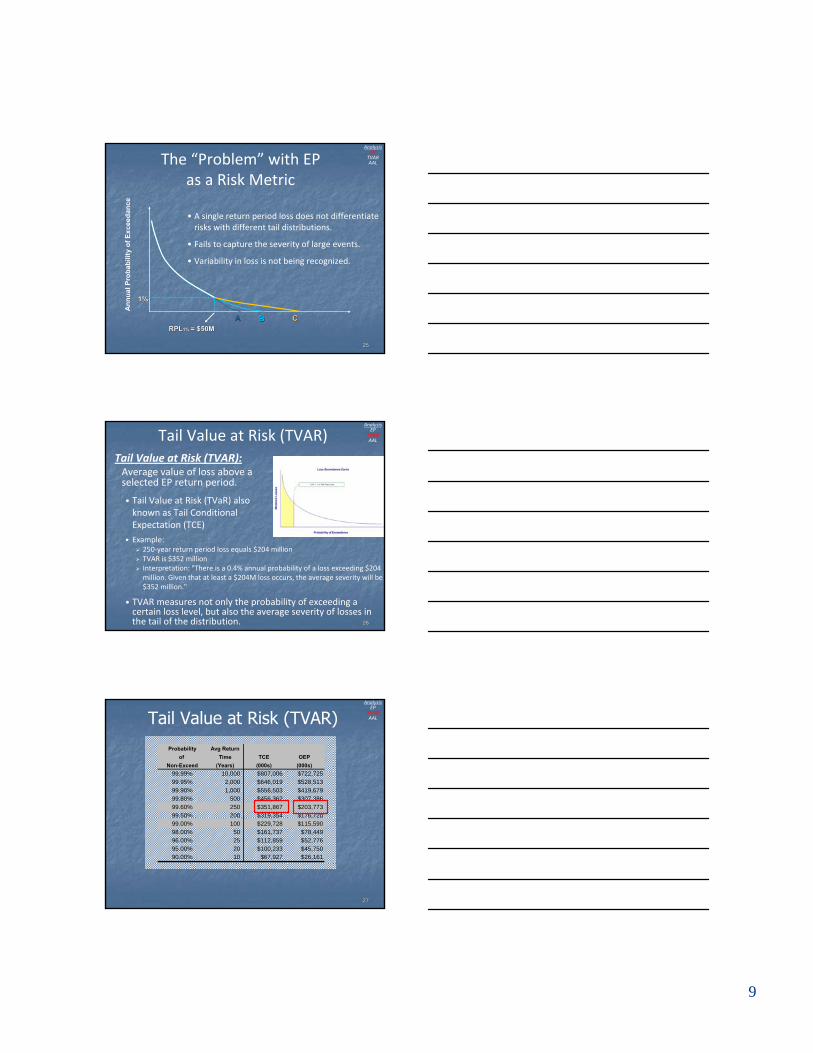
2525
• A single return period loss does not differentiate risks with different tail distributions.
• Fails to capture the severity of large events.
• Variability in loss is not being recognized.
AA BB CC
1%1%
RPLRPL1% 1% = $50M= $50M
Ann
ual P
roba
bilit
y of
Exc
eeda
nce
The “Problem” with EPas a Risk Metric
AnalysisEP
TVARAAL
2626
Tail Value at Risk (TVAR)
• Example:250‐year return period loss equals $204 millionTVAR is $352 millionInterpretation: "There is a 0.4% annual probability of a loss exceeding $204 million. Given that at least a $204M loss occurs, the average severity will be $352 million."
• TVAR measures not only the probability of exceeding a certain loss level, but also the average severity of losses in the tail of the distribution.
AnalysisEP
TVARAAL
Tail Value at Risk (TVAR):Average value of loss above a selected EP return period.
• Tail Value at Risk (TVaR) also known as Tail Conditional Expectation (TCE)
2727
Probability Avg Returnof Time TCE OEP
Non-Exceed (Years) (000s) (000s)99.99% 10,000 $807,006 $722,72599.95% 2,000 $646,019 $528,51399.90% 1,000 $556,503 $419,67999.80% 500 $456,362 $307,38699.60% 250 $351,867 $203,77399.50% 200 $319,354 $176,72099.00% 100 $229,728 $115,59098.00% 50 $161,737 $78,44996.00% 25 $112,859 $52,77695.00% 20 $100,233 $45,75090.00% 10 $67,927 $26,161
AnalysisEP
TVARAALTail Value at Risk (TVAR)
10
2828
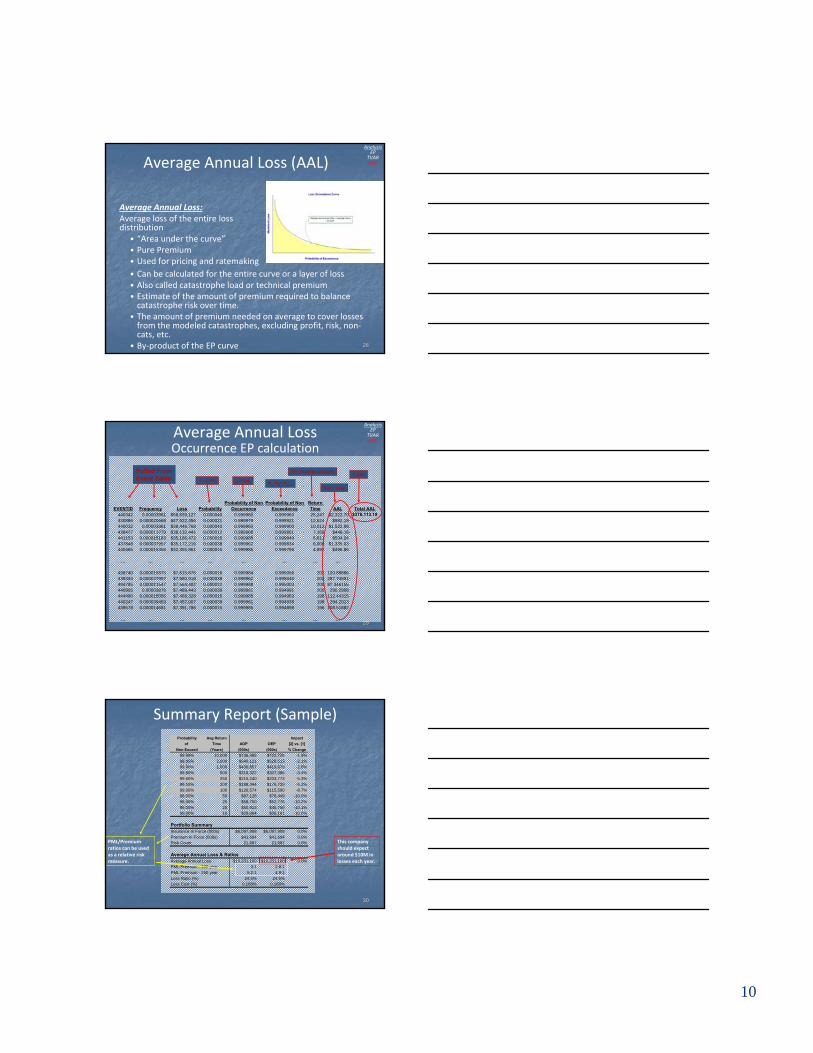
• Can be calculated for the entire curve or a layer of loss• Also called catastrophe load or technical premium• Estimate of the amount of premium required to balance catastrophe risk over time.
• The amount of premium needed on average to cover losses from the modeled catastrophes, excluding profit, risk, non‐cats, etc.
• By‐product of the EP curve
AnalysisEP
TVARAALAverage Annual Loss (AAL)
Average Annual Loss:Average loss of the entire loss distribution
• “Area under the curve”• Pure Premium• Used for pricing and ratemaking
2929
EVENTID Frequency Loss ProbabilityProbability of Non
OccurrenceProbability of Non
ExceedanceReturn Time AAL Total AAL
440342 0.00003961 $58,639,127 0.000040 0.999960 0.999960 25,247 $2,322.70 $376,113.19440886 0.000020668 $47,522,356 0.000021 0.999979 0.999921 12,624 $982.19440032 0.00003961 $38,446,768 0.000040 0.999960 0.999900 10,012 $1,522.88438477 0.000011779 $38,132,441 0.000012 0.999988 0.999861 7,169 $449.16441153 0.000015183 $35,186,472 0.000015 0.999985 0.999849 6,611 $534.24437848 0.000037957 $35,172,216 0.000038 0.999962 0.999834 6,008 $1,335.03440465 0.000015356 $32,355,961 0.000015 0.999985 0.999796 4,892 $496.86
… … … … … … … …
438740 0.000015875 $7,615,676 0.000016 0.999984 0.995056 202 120.89886439334 0.000037957 $7,580,918 0.000038 0.999962 0.995040 202 287.74891444785 0.000011547 $7,564,402 0.000012 0.999988 0.995003 200 87.346155440905 0.00003876 $7,489,443 0.000039 0.999961 0.994991 200 290.2908444490 0.000015056 $7,468,328 0.000015 0.999985 0.994953 198 112.44315440247 0.000039453 $7,457,007 0.000039 0.999961 0.994938 198 294.2013439578 0.000014681 $7,391,786 0.000015 0.999985 0.994898 196 108.51882
… … … … … … … …
Average Annual LossOccurrence EP calculation
1 - ℮(-Rate)P1 * P2 * P3 …
1/(1- Prob Non-Exceed)
Rate * Loss
∑ AAL1 - Prob
AnalysisEP
TVARAAL
Pulled FromEvent Table
3030
Probability Avg Return Impactof Time AOP OEP [2] vs. [1]
Non-Exceed (Years) (000s) (000s) % Change99.99% 10,000 $736,485 $722,725 -1.9%99.95% 2,000 $540,121 $528,513 -2.1%99.90% 1,000 $430,857 $419,679 -2.6%99.80% 500 $318,322 $307,386 -3.4%99.60% 250 $215,240 $203,773 -5.3%99.50% 200 $188,344 $176,720 -6.2%99.00% 100 $126,574 $115,590 -8.7%98.00% 50 $87,128 $78,449 -10.0%96.00% 25 $58,750 $52,776 -10.2%95.00% 20 $50,913 $45,750 -10.1%90.00% 10 $29,064 $26,161 -10.0%
Portfolio SummaryInsurance In Force (000s) $6,097,908 $6,097,908 0.0%Premium In Force (000s) $41,694 $41,694 0.0%Risk Count 21,697 21,697 0.0%
Average Annual Loss & RatiosAverage Annual Loss $10,231,100 $10,231,100 0.0%PML:Premium - 100 year 3:1 2.8:1PML:Premium - 250 year 5.2:1 4.9:1Loss Ratio (%) 24.5% 24.5%Loss Cost (%) 0.168% 0.168%
This company should expect around $10M in losses each year.
Summary Report (Sample)
PML/Premium ratios can be used as a relative risk measure.
11
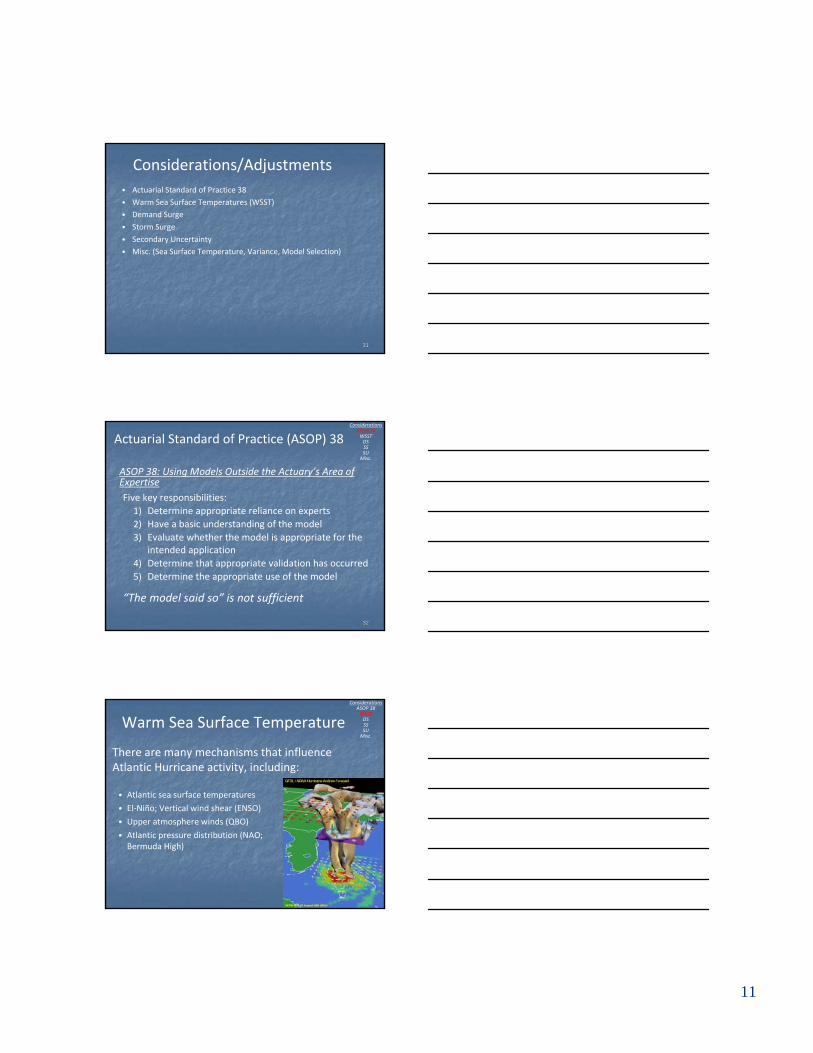
3131
Considerations/Adjustments• Actuarial Standard of Practice 38
• Warm Sea Surface Temperatures (WSST)• Demand Surge
• Storm Surge
• Secondary Uncertainty• Misc. (Sea Surface Temperature, Variance, Model Selection)
3232
Actuarial Standard of Practice (ASOP) 38
ASOP 38: Using Models Outside the Actuary’s Area of ExpertiseFive key responsibilities:
1) Determine appropriate reliance on experts2) Have a basic understanding of the model3) Evaluate whether the model is appropriate for the
intended application4) Determine that appropriate validation has occurred5) Determine the appropriate use of the model
“The model said so” is not sufficient
ConsiderationsASOP 38WSSTDSSSSU
Misc.
3333
Warm Sea Surface Temperature
There are many mechanisms that influence Atlantic Hurricane activity, including:
ConsiderationsASOP 38WSSTDSSSSU
Misc.
• Atlantic sea surface temperatures
• El‐Niño; Vertical wind shear (ENSO)
• Upper atmosphere winds (QBO)
• Atlantic pressure distribution (NAO; Bermuda High)
12
3434
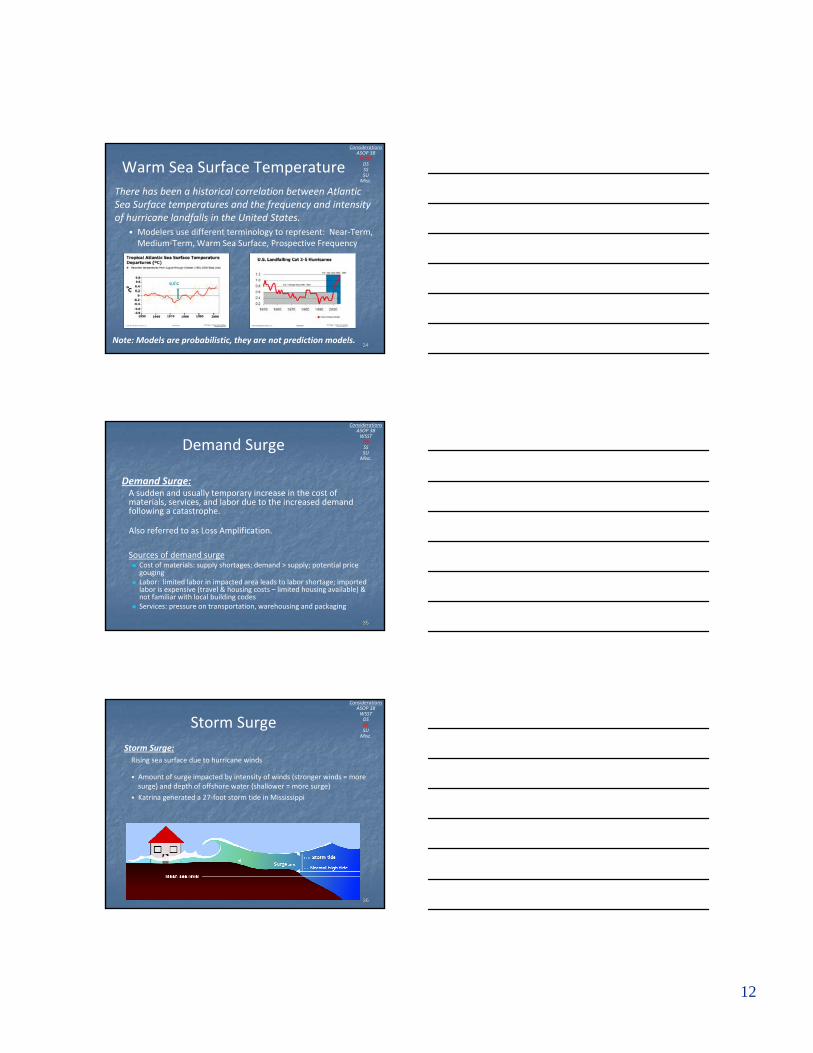
Warm Sea Surface TemperatureThere has been a historical correlation between Atlantic Sea Surface temperatures and the frequency and intensity of hurricane landfalls in the United States.
• Modelers use different terminology to represent: Near‐Term, Medium‐Term, Warm Sea Surface, Prospective Frequency
ConsiderationsASOP 38WSSTDSSSSU
Misc.
Note: Models are probabilistic, they are not prediction models.
3535
Demand SurgeConsiderations
ASOP 38WSSTDSSSSU
Misc.
Demand Surge:A sudden and usually temporary increase in the cost of materials, services, and labor due to the increased demand following a catastrophe.
Also referred to as Loss Amplification.
Sources of demand surgeCost of materials: supply shortages; demand > supply; potential price gougingLabor: limited labor in impacted area leads to labor shortage; imported labor is expensive (travel & housing costs – limited housing available) & not familiar with local building codesServices: pressure on transportation, warehousing and packaging
3636
Storm SurgeConsiderations
ASOP 38WSSTDSSSSU
Misc.
Storm Surge:Rising sea surface due to hurricane winds
• Amount of surge impacted by intensity of winds (stronger winds = more surge) and depth of offshore water (shallower = more surge)
• Katrina generated a 27‐foot storm tide in Mississippi
13
3737
Secondary UncertaintyConsiderations
ASOP 38WSSTDSSSSU
Misc.
Secondary Uncertainty:Uncertainty in the size of loss, given that a specific event has occurred.
Primary Uncertainty:Uncertainty around the occurrence or non‐occurrence of unknown events.
$80$90
$110
$0$120
Payout is $0 or a range between $80 and $120. The uncertainty in amount (given a payout) is the secondary uncertainty.
Identical events can cause different amounts of loss, resulting in a range of possible values with different probabilities.
3838
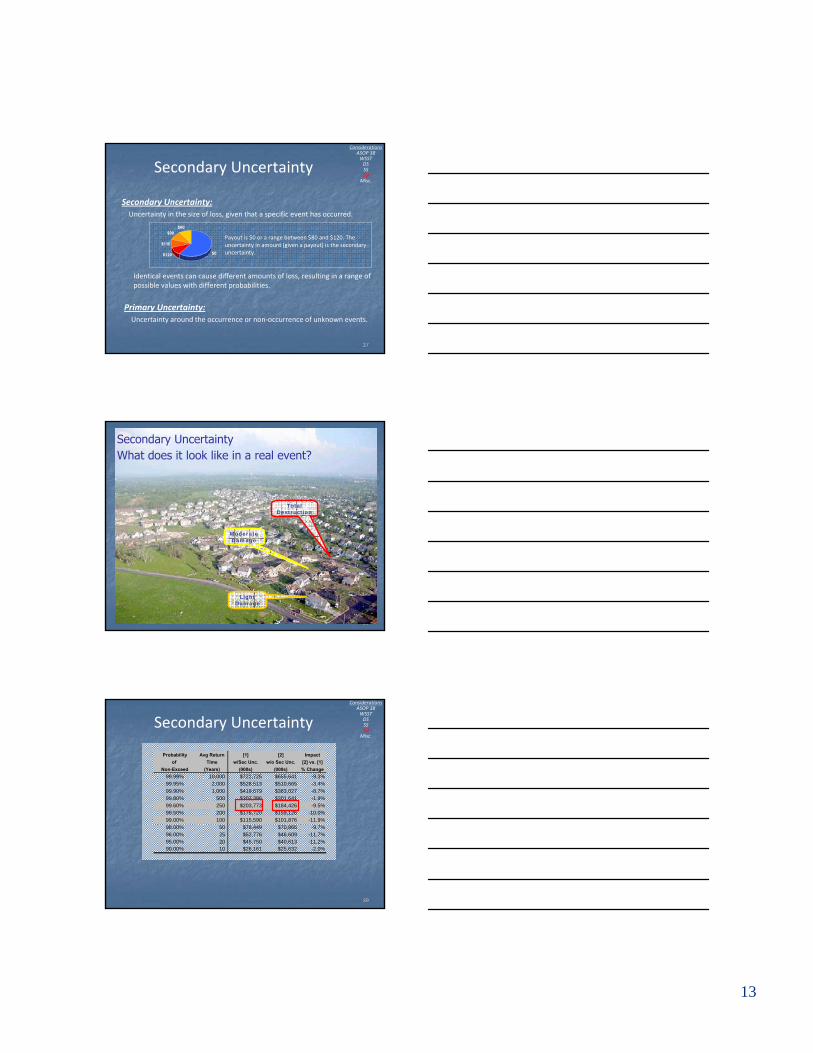
Total Destruction
Light Damage
Moderate Damage
Secondary UncertaintyWhat does it look like in a real event?
3939
Probability Avg Return [1] [2] Impactof Time w/Sec Unc. w/o Sec Unc. [2] vs. [1]
Non-Exceed (Years) (000s) (000s) % Change99.99% 10,000 $722,725 $655,641 -9.3%99.95% 2,000 $528,513 $510,665 -3.4%99.90% 1,000 $419,679 $383,027 -8.7%99.80% 500 $307,386 $301,641 -1.9%99.60% 250 $203,773 $184,426 -9.5%99.50% 200 $176,720 $159,126 -10.0%99.00% 100 $115,590 $101,876 -11.9%98.00% 50 $78,449 $70,866 -9.7%96.00% 25 $52,776 $46,609 -11.7%95.00% 20 $45,750 $40,613 -11.2%90.00% 10 $26,161 $25,632 -2.0%
Secondary UncertaintyConsiderations
ASOP 38WSSTDSSSSU
Misc.
14
4040
The amount of variance is important to consider in order to gauge the relative riskiness.
VarianceConsiderations
ASOP 38WSSTDSSSSU
Misc.
Measures:Standard Deviation (SD)
• Measure of volatility around a number• Measured in same currency• Example: 100‐year EP of $100M, SD of $300M• Cannot compare the SD of one analysis to the SD of another
Coefficient of Variation (CV or COV)• Standard Deviation ÷ Mean• The larger the CV, the greater the variability around the mean loss• CV has no “units” (better than using SD for comparison purposes)• “Secondary Uncertainty” in the size of a loss
4141
Missing pieces of loss estimates...• inconsistent claims adjusting (1 vs. 100s vs. 1000s of claims)• inconsistent claims paying practices (flood vs. surge, whole vs. part)
• loss adjustment expense• legal and regulatory environment
• others...
Other Considerations
ConsiderationsASOP 38WSSTDSSSSU
Misc.
4242
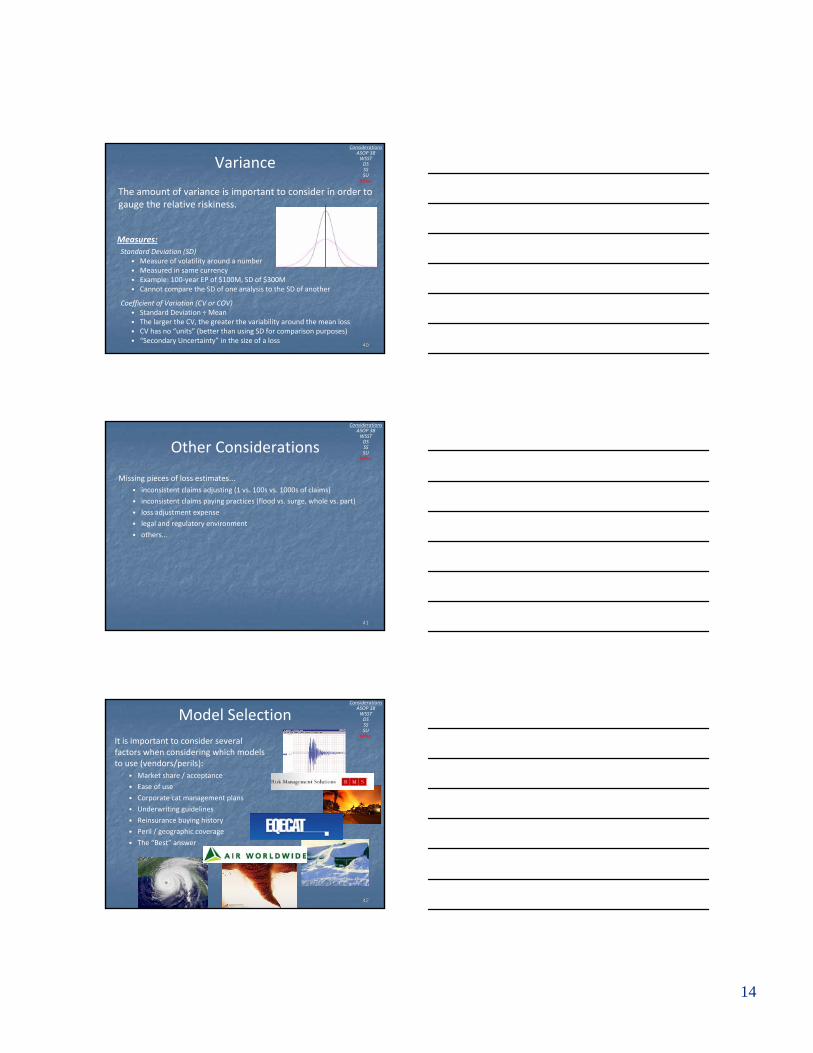
It is important to consider several factors when considering which models to use (vendors/perils):
• Market share / acceptance• Ease of use
• Corporate cat management plans• Underwriting guidelines
• Reinsurance buying history• Peril / geographic coverage
• The “Best” answer
Model SelectionConsiderations
ASOP 38WSSTDSSSSU
Misc.

15
4343
Modeling Terminology
“The Company’s 100‐year return period loss shall be derived from results produced by Version 6.0 catastrophe modeling software, using near term perspective, but no demand surge or secondary uncertainty.”
4444
Fundamentals of Cat ModelingSummary
• Cat models provide more comprehensive information on current and future loss potential than historical data.
• High quality exposure information is critical
• Modeled output can be used for a variety of metrics/analytics, including:
• EP/PML• TVAR• AAL
• Important to consider issues such as: projected sea surface temperature, demand surge, storm surge, secondary uncertainty, etc.