Embed Size (px)
Citation preview

CCP: JU/HF/ ST / 2012/1
الجـوت والتيـل والسـيزال واألباآــاوألياف جوز الهند واأللياف المماثلة
اإلحصاءات800
900
1 000
1 100
USD / tonne
Jute Export PricesBTD f.o.b. Bangladesh Port
اإلحصاءاتسبتمبر 2012
黄麻、槿麻、剑麻、蕉麻、椰壳及同类纤维200
300
400
500
600
700
800
900
1 000
2008 2009 2010 2011 2012
Indicative price
统计资料
2012年9月
J K f Si l Ab
2002008 2009 2010 2011 2012
1500
1700
3L UG
Sisal Price (f.o.b.) - East Africa: 3L and UG Brazil: No 3USD / tonne
Jute, Kenaf, Sisal, Abaca,Coir and Allied Fibres
STATISTICSSeptember 2012
500
700
900
1100
1300
1500
1700
Indicative price No 3
Indicative price UG
3L
No 3
UG
Jute, Kénaf, Sisal, Abaca,Coco et Fibres Apparentées
STATISTIQUESSeptembre 2012
500
700
Indicative price No 3No 3
320
S2
USD / bale
Abaca Prices - Philippines
Yute, Kenaf, Sisal, Abaca,Bonote y Fibras Afines
ESTADISTICASSeptiembre 2012
120
170
220
270
320
S2
JK
Indicator price
Max.Indicative price
G
Min. Indicative price
المتحدة لألمم والزراعة األغذية منظمة
70
120
2008 2009 2010 2011 2012
JKp
Min. Indicative price
联合国粮食及农业组织
FOOD AND AGRICULTURE ORGANIZATION OF THE UNITED NATIONS
ORGANISATION DES NATIONS UNIES POUR L'ALIMENTATION ET L'AGRICULTUREORGANIZACION DE LAS NACIONES UNIDAS PARA LA ALIMENTACION Y LA AGRICULTURA
منظمة األغذية والزراعة لألمم المتحدة


- 3 - The tables contained in this document bring together governments' replies to the Group's latest questionnaires, supplemented by other data available to the Secretariat at 30 September 2012. It is prepared in the Trade and Markets Division, FAO, Rome and it is available at the following FAO Web site: http://www.fao.org/economic/futurefibres/resources2/en/
Table of contents
Jute, Kenaf and Allied Fibres
Current Supply and Demand Situation Page Table 1 - Estimate of supplies, domestic requirements, exports and imports in major producing countries, 2010/11 13 Table 2 - Estimate of supplies, domestic requirements, exports and imports in major producing countries, 2011/12 14 Prices Table 3 - Prices of jute and competing crops at grower level in major producing countries 15 Table 4 - Representative monthly export and import prices of jute fibre and Indicative Price of BWD grade 16 Table 5 - Monthly export prices of jute products in India 17 Production Table 6 - World production of jute, kenaf and allied Fibres 18 Table 7 - Area, production and yield in major producing countries 19 Trade Table 8 - World exports of raw jute, kenaf and allied fibres 20 Table 9 - World exports of products of jute, kenaf and allied fibres 21 Table 10 - World imports of raw jute, kenaf and allied fibres 22 Table 11 - World imports of products of jute, kenaf and allied fibres. 23 Table 12 - Monthly exports of jute products by type from India 24 Manufacturing Table 13 - Monthly production and stocks of jute products by type in India 25 Table 14 - Monthly production and stocks of jute products by type in Myanmar 26 Special Information Table 15 - Closing stocks and mill consumption of jute, kenaf and allied fibres in the major producing countries 27 Table 16 - Prices of polypropylene, its base chemical, chemical feedstock and raw material, in Western Europe and United States 28 Table 17 - Comparative price position of jute fibre and polypropylene polymer in Western Europe 29 Table 18 - Comparative price position of jute and polypropylene yarn in United Kingdom 29 Table 19 - Comparative position of jute and polypropylene sacks in United Kingdom 29 Table 20 - Monthly export value of jute products by type from India 30 Table 21 - Monthly export value of jute products by type from Thailand 31 Table 22 - World apparent consumption of jute, kenaf and allied fibres 32 Table 23 - Exchange rates 33
***

- 4 -
Sisal Page Table 24 - Production of sisal, henequen and other similar hard fibres 34 Table 25 - Sisal and henequen fibres and manufactures: Exports from producing countries 35 Table 26 - Sisal: Prices of representative grades, 2005-2012 36 Table 27 - Estimated market price for agricultural twines made from sisal/henequen and polypropylene 36 Table 28 - Sisal: Imports of raw fibre 37 Table 29 - Sisal: Imports of manufactures 38
***
Abaca Table 30 - Production of abaca 39 Table 31 - Export of abaca: fibre and manufactures from producing countries 39 Table 32 - Abaca : Prices of representative grades, 2005-2012 40 Table 33 - Abaca: Imports of fibre and manufactures 41
***
Coir Table 34 - Production of coir fibre 42 Table 35 - Production of coir yarn 42 Table 36 - Exports of coir fibre 43 Table 37 - Exports of coir yarn 44 Table 38 - Exports of coir mats, matting and rugs from principal exporting countries 44 Table 39 - Sri Lanka: Prices of coir fibres and yarn 45 Table 40 - Imports of coir fibre 46 Table 41 - Imports of coir yarn into principal importing countries 47 Table 42 - Imports of coir mats, matting and rugs into principal importing countries 48
***
NOTES Arabic 49 Chinese 51 English 53 French 55 Spanish 57 Glossary 59

- 5 -
واردة داول ال يالج تكمله ف ة، وس تبيانات الجماع دث اس ى أح ات عل ردود الحكوم ا ل ة تتضمن تجميع ذه الوثيق ه
رى ات األخ يالبيان ى الت ة حت ت لألمان د . 30/09/2012أتيح دت وق يأع عبة ف ارة ش واق التج ة، واألس ، المنظموان الت ى العن ت عل بكة انترن ى ش ة عل ع المنظم ى موق ـا،وتتوافر عل /http://www.fao.org/economic/futurefibres/resources2/en :اليرومـــ
بيان المحتوياتالجوت والتيل واأللياف المماثلة
الصفحةالوقت الحاضرفيبأوضاع العرض والطل
د 13 ديرات اإلم واردات اداتتق ة والصادرات وال ات المحلي يواالحتياج دان ف البل2010/2011المنتجة الرئيسية،
- 1الجدول ات 14 داداتتوقع واردات اإلم ادرات وال ة والص ات المحلي يواالحتياج دان ف البل
2011/2012 المنتجة الرئيسية، - 2الجدول
عاراألس
ين 15 توى المنتج ى مس ه عل ة ل يل المنافس وت والمحاص عار الج يأس دان ف البلالمنتجة الرئيسية
- 3الجدول ارية 16 اف الجوت واألسعار االش تيراد ألي األسعار الشهرية التمثيلية لتصدير واس
للخام األبيض - 4الجدول
- 5الجدول األسعار الشهرية لصادرات منتجات الجوت في الهند 17 اإلنتاج
للجوت والتيل واأللياف المماثلةالعالمياإلنتاج 18 - 6الجدول - 7الجدول البلدان المنتجة الرئيسيةفيوالغالتواإلنتاجالمساحة 19 التجارة
- 8الجدول صادرات العالم من الجوت والتيل واأللياف المماثلة الخام 20 - 9الجدول ت العالم من الجوت والتيل واأللياف المماثلة الخامصادرا 21 - 10الجدول واردات العالم من الجوت والتيل واأللياف المماثلة الخام 22 - 11الجدول واردات العالم من منتجات الجوت والتيل واأللياف المماثلة 23 - 12الجدول هندالصادرات الشهرية من منتجات الجوت حسب النوع من ال 24 التصنيع
- 13الجدول الشهري والمخزونات من منتجات الجوت حسب النوع في الهنداإلنتاج 25 - 14الجدول اإلنتاج الشهري من منتجات الجوت حسب النوع في ميانمار 26 معلومات خاصة
ل مخزونات 27 ة نهاية المدة واستهالك المعامل من الجوت والتي اف المماثل واألليفى البلدان المنتجة الرئيسية - 15الجدول
واد 28 ة والم أسعار البوليبروبيلين، المادة الكيميائية األساسية، مادة التلقيح الكيميائيالخام فى أوروبا الغربية والواليات المتحدة - 16الجدول
ة أل 29 عار أاألوضاع المقارن وليبرو س ل الب وت مقاب اف الج ى لي وليمير ف بيلين البأوروبا الغربية - 17الجدول
- 18الجدول غزل الجوت مقابل البوليبروبيلين فىالمملكة المتحدةسعارألاألوضاع المقارنة 29 - 19الجدول األوضاع المقارنة ألآياس الجوت والبوليبروبيلين في المملكة المتحدة 29 - 20الجدول الجوت حسب النوع من الهندقيمة الصادرات الشهرية من منتجات 30 - 21الجدول قيمة الصادرات الشهرية من منتجات الجوت حسب النوع من تايلند 31 - 22الجدول االستهالك العالمي الظاهري للجوت والتيل واأللياف المماثلة 32أسعار الصرف 33 - 23الجدول ***

- 6 -
السيزال هنيكين واأللياف الصلبة المماثلةالانتاج السيزال و 34 - 24الجدول - 25الجدول الصادرات من البلدان المنتجة:نيكينهالالسيزال وألياف ومصنوعات 352005-2012 أسعار الرتب التمثيلية:السيزال 36 - 26الجدول - 27الجدول بوليبروبلينالن والهنيكي/تقديرات أسعار السوق للخيوط الزراعية من السيزال 36األلياف الخامالواردات من:السيزال 37 - 28الجدول الواردات من المصنوعات:السيزال 38 - 29الجدول
*** األباآا
انتاج األباآا 39 - 30الجدول - 31الجدول األلياف والمصنوعات من البلدان المنتجة:صادرات األباآا 392012-2005أسعار الرتب التمثيلية:باآااأل 40 - 32الجدول 41
المصنوعاتواألليافالواردات من:األباآا - 33الجدول
***
وز اف ج أليالهند
ألياف جوز الهندإنتاج 42 - 34الجدول غزل جوز الهندإنتاج 42 - 35الجدول صادرات ألياف جوز الهند 43 - 36الجدول ادرات غزل جوز الهندص 44 - 37الجدول ير و 44 ادرات الحص وادص درة م دان المص ن البل جاد م ير والس ناعة الحص ص
الرئيسية - 38الجدول
أسعار ألياف وغزل جوز الهند:سرى النكا 45 - 39الجدول ألياف جوز الهندواردات 46 - 40الجدول - 41الجدول مستوردة الرئيسيةواردات غزل ألياف جوز الهند فى البلدان ال 47توردة 48 دان المس ي البل جاد ف ير والس ناعة الحص واد ص ير وم واردات الحص
الرئيسية - 42الجدول
***
الحواشى
اللغة العربية 49اللغة الصينية 51اإلنكليزيةاللغة 53اللغة الفرنسية 55اللغة األسبانية 57تخدمةالمصطلحات المس 59
- 7 -
本文件中的表格是由各国政府对本小组的最新问卷调查表的答复汇总而成,并且用秘书处在2012年09月30日掌握的其他数据加以补充。文件由罗马粮农组织贸易及市场司汇编,可在如下粮农组织网站查阅:http://www.fao.org/economic/futurefibres/resources2/en/
目 录
黄麻、槿麻及同类纤维
当前的供应及需求情况 页 次
表 1- 主要生产国2010/2011年度的供应量、国内需求量、出口量和进口量的估计数 13 表 2- 主要生产国2011/2012年度的供应量、国内需求量、出口量和进口量的预报数 14
价 格 表 3- 主要生产国生产者一级的黄麻和竞争性作物产品的价格 15 表 4- 具有代表性的黄麻纤维每月进出口价格和BWD级指示性价格 16 表 5- 印度黄麻产品每月出口价格 17
产 量
表 6- 世界黄麻、槿麻及同类纤维的产量 18 表 7- 主要生产国的种植面积、产量及单产 19
贸 易
表 8- 世界未加工黄麻、槿麻及同类纤维出口量 20 表 9- 世界黄麻、槿麻及同类纤维产品出口量 21 表 10- 世界未加工的黄麻、槿麻及同类纤维进口量 22 表 11- 世界黄麻、槿麻及同类纤维产品进口量 23 表 12- 印度各类黄麻产品每月出口量 24
加 工
表 13- 印度各类黄麻产品每月产量和库存量 25 表 14- 缅甸各类黄麻产品每月产量 26
特别信息
表 15- 主要生产国黄麻、槿麻和同类纤维期末库存量和工厂消费量 27 表 16- 西欧和美国聚丙烯及其基本化学品、化学原料和其它原料的价格 28 表 17- 西欧黄麻纤维及聚丙烯聚合物的价格比较情况 29 表 18- 联合王国黄麻纤维及聚丙烯纱的价格比较情况 30 表 19- 联合王国黄麻纤维及聚丙烯袋的价格比较情况 30 表 20- 印度各类黄麻产品每月出口值 30 表 21- 泰国各类黄麻产品每月出口值 31 表 22- 世界黄麻、槿麻及同类纤维毛消费量 32 表 23- 兑换率 33 ***

- 8 -
剑 麻
表 24- 剑麻、黑纳金麻和其它类似硬纤维的产量 34 表 25- 剑麻和黑纳金麻纤维和制品:生产国的出口量 35 表 26- 剑麻:2005-2012年代表性等级的价格 36 表 27- 剑麻/黑纳金麻和聚丙烯农用绳索的估计市场价格 36 表 28- 剑麻:未加工纤维进口量 37 表 29- 剑麻:制品进口量
38
***
蕉 麻
表 30- 蕉麻产量 39 表 31- 蕉麻出口量:生产国的纤维和制品 39 表 32- 蕉麻:2005-2012年代表性等级价格 40 表 33- 蕉麻:纤维和制品进口量
41
***
椰壳纤维
表 34- 椰壳纤维产量 42 表 35- 椰壳纱产量 42 表 36- 椰壳纤维出口量 43 表 37- 椰壳纱出口量 44 表 38- 主要出口国椰壳地毯、编织物和小地毯出口量 44 表 39- 斯里兰卡: 椰壳纤维和椰壳纱价格 45 表 40- 椰壳纤维进口量 46 表 41- 主要进口国椰壳纱进口量 47 表 42- 主要进口国椰壳地毯、编织物和小地毯进口量 48
***
注 释
阿拉伯文 49 中 文 51 英 文 53
法 文 55
西班牙文 57
术 语 59

- 9 -
Les tableaux présentés ci-après récapitulent les réponses des gouvernements au dernier questionnaire du Groupe, complétées par les autres données dont disposait le secrétariat au 30 Septembre 2012. Ce bulletin d'information statistique, est préparé par la Division du commerce international et des marchés, FAO, Rome et il est disponible suivant au site FAO Web: http://www.fao.org/economic/futurefibres/resources2/fr/
Tables des matières
Jute, Kenaf et Fibres Apparentées Situation actuelle de l'offre et de la demande Page Tableau 1 - Estimation des disponibilités, des besoins intérieurs, des exportations et des importations des principaux pays producteurs, 2010/11 13 Tableau 2 - Estimation des disponibilités, des besoins intérieurs, des exportations et des importations des principaux pays producteurs, 2011/12 14 Prices Tableau 3 - Prix à la production du jute et des cultures concurrentielles dans les principaux pays producteurs 15 Tableau 4 - Prix d'exportation et d'importation mensuels représentatifs de la fibre et Prix Indicatif du jute BWD 16 Tableau 5 - Prix d'exportation mensuels des produits du jute en Inde 17 Production Tableau 6 - Production mondiale de jute, de kénaf et de fibre apparentées 18 Tableau 7 - Superficie, production et rendements dans les principaux pays producteurs 19 Commerce Tableau 8 - Exportations mondiales de jute, de kénaf et de fibres apparentées, à l'état brut 20 Tableau 9 - Exportations mondiales de produits du jute, du kénaf et de fibres apparentées 21 Tableau 10 - Importations mondiales de jute, de kénaf et de fibres apparentées: à l'état brut 22 Tableau 11 - Importations mondiales de produits de jute, de kénaf et de fibres apparentées 23 Tableau 12 - Exportations mensuelles de produits du jute en provenance de l'Inde 24 Industrie Tableau 13 - Production mensuelle et stocks d'articles de jute, par catégorie, en Inde 25 Tableau 14 - Production mensuelle et stocks d'articles de jute, par catégorie, en Myanmar 26 Reinseignements speciaux Tableau 15 - Stocks de fibres de jute et de kénaf et consommation industrielle dans les principaux pays producteurs 27 Tableau 16 - Prix du polypropylène, du produit chimique de base et des matières premières chimique et autres en Europe occidentale et en Etats-Unis 28 Tableau 17 - Europe occidental: Rapport prix de la fibre de jute/prix du polymère de polypropylène 29 Tableau 18 - Royaume-Uni: Rapport prix du fil de jute/prix du fil de polypropylène 29 Tableau 19 - Royaume-Uni: Rapport prix des sacs de jute/prix des sacs de polypropylène 29 Tableau 20 - Valeur des exportations mensuelles des produits du jute en provenance de l'Inde 30 Tableau 21 - Valeur des exportations mensuelles du jute à l'état brut et des produits du jute en provenance de la Thaïlande 31 Tableau 22 - Consommation mondiale apparente de jute, de kénaf et de fibres apparenteés 32 Tableau 23 - Cours de change 33
* * *

- 10 -
Sisal Page Tableau 24 - Production de sisal, hennequen et d'autres fibres dures similaires 34 Tableau 25 - Fibres et articles manufacturés de sisal et de hennequen: Exportations des pays producteurs 35 Tableau 26 - Sisal: Prix de qualités représentatives, 2005-2012 36 Tableau 27 - Prix estimatifs du marché des ficelles agricoles en sisal/henequen et en polypropylène 36 Tableau 28 - Sisal: Importations de la fibre 37 Tableau 29 - Sisal: Importations de manufactures 38
* * *
Abaca Tableau 30 - Production d'abaca 39 Tableau 31 - Abaca: Exportations de fibres et de produits manufactures des pays producteurs 39 Tableau 32 - Abaca: Prix de qualites representatives, 2005-2012 40 Tableau 33 - Abaca: Importations de la fibre et de manufactures 41
* * *
Coco Tableau 34 - Production de fibre de coco 42 Tableau 35 - Production de files de coco 42 Tableau 36 - Exportations de fibre de coco par les pays producteurs 43 Tableau 37 - Exportations de files de coco par les pays producteurs 44 Tableau 38 - Exportations de tapis brosses, nattes et passages et carpettes de coco par les principaux 44 pays exportateurs Tableau 39 - Sri Lanka : Prix de fibres et de fil/ficelle de coco 45 Tableau 40 - Importation de la fibre de coco 46 Tableau 41 - Importations de files de coco dans les principaux pays importateurs 47 Tableau 42 - Importations de tapis-brosses, nattes et passages et carpettes de coco dans les principaux 48 pays importateurs
* * * NOTES Arabe 49 Chinois 51 Anglais 53 Français 55 Espagnol 57 Glossaire 59

- 11 -
Los cuadros contenidos en este documento reúnen las respuestas de los Gobiernos al último cuestionario del Grupo, complementados concuestionario del Grupo, complementados con otros datos de que disponía la Secretaría al 30 de septiembre 2012. La presente hoja de información estadística, está preparada por la Dirección de Comercio y Mercados, FAO, Roma y está disponible en el siguiente FAO Web site http://www.fao.org/economic/futurefibres/resources2/es/
Indice
Yute, Kenaf y Fibras Afines Situación actual de la oferta y de la demanda Pagina Cuadro 1 - Estimación de los suministros, las necesidades internas, las exportaciones y las importaciones de los principales países productores, 2010/11 13 Cuadro 2 - Estimación de los suministros, las necesidades internas, las exportaciones y las importaciones de los principales países productores, 2011/12 14 Precios Cuadro 3 - Precios al productor del yute y los cultivos que compiten con el yute en los principales países productores 15 Cuadro 4 - Precios mensuales representativos de exportación de la fibra y precio Indicativo de yute BWD 16 Cuadro 5 - Precios mensuales de exportación de productos de yute, en la India 17 Producción Cuadro 6 - Producción mundial de yute, kenaf y fibras afines 18 Cuadro 7 - Superficie, producción y rendimientos en los principales países productores 19 Comercio Cuadro 8 - Exportaciones mundiales de yute, kenaf y fibras afines en bruto 20 Cuadro 9 - Exportaciones mundiales de productos de yute, kenaf y fibras afines 21 Cuadro 10 - Importaciones mundiales de yute, kenaf y fibras afines en bruto 22 Cuadro 11 - Importaciones mundiales de productos de yute, kenaf y fibras afines 23 Cuadro 12 - Exportaciones mensuales de productos de yute, por tipos, de la India 24 Manufacturas Cuadro 13 - Producción y existencias mensual de artículos de yute, por tipos, en la India 25 Cuadro 14 - Producción y existencias mensual de artículos de yute, por tipos, en Myanmar 26 Special Information Cuadro 15 - Existencias de fibra de yute y de kenaf y consumo en las fábricas de los principales países productores 27 Cuadro 16 - Precios de polipropileno, de sus productos químicos básicos y de sus materias primas en Europa occidental y en Estados Unidos 28 Cuadro 17 - Europa occidental: Situación comparativa de precios de la fibra del yute y del polímero de polipropileno 29 Cuadro 18 - Reino Unido: Situación comparativa de precios entre el hilo de yute y el de polipropileno 29 Cuadro 19 - Reino Unido: Situación comparativa de precios entre los sacos de yute y les de polipropileno 29 Cuadro 20 - Valor de las exportaciones mensuales de productos de yute, por tipos, de la India 30 Cuadro 21 - Valor de las exportaciones mensuales de yute en bruto y elaboradas, por tipos, de la Tailandia 31 Cuadro 22 - Consumo mundial aparente de yute, kenaf y fibras afines 32 Cuadro 23 - Tipo de cambio 33
* * *

- 12 -
Sisal Pagina Cuadro 25 - Producción de sisal, henequén y de otras fibras duras similares 34 Cuadro 25 - Fibras y manufacturas de sisal y de henequén: Exportaciones de los países productores 35 Cuadro 26 - Sisal: Precios de las calidades representativas, 2005-2012 36 Cuadro 27 - Precios de mercado estimados para los bramantes agricolas de sisal/henequén y de polipropileno 36 Cuadro 28 - Sisal : Importaciones de fibra 37 Cuadro 29 - Sisal : Importaciones de manufacturas 38
* * *
Abaca Cuadro 30 - Producción de abacá 39 Cuadro 31 - Abacá: Exportaciones de fibras y manufacturas de los países productores 39 Cuadro 32 - Abacá: Precios de las calidades representativas, 2005-2012 40 Cuadro 33 - Abacá: Importaciones de fibra y de manufacturas 41
* * *
Bonote Cuadro 34 - Producción de bonote 42 Cuadro 35 - Producción de hilo de bonote 42 Cuadro 36 - Exportaciones de bonote de los países productores 43 Cuadro 37 - Exportaciones de hilo de bonote de los países productores 44 Cuadro 38 - Sri Lanka: Precios de la fibra y de hilo/bramante del bonote 44 Cuadro 39 - India: Precios de exportación de los productos del bonote 45 Cuadro 40 - Importaciones de fibras de bonote 46 Cuadro 41 - Importaciones de esteras, material de esterado y alfombras de bonote en los países importadores 47 Cuadro 42 - Importaciones de hilo de bonote en los psíses importadores 48
* * *
Notas Arabe 49 Chino 51 Inglés 53 Francés 55 Español 57 Glosario 59
- 13 -
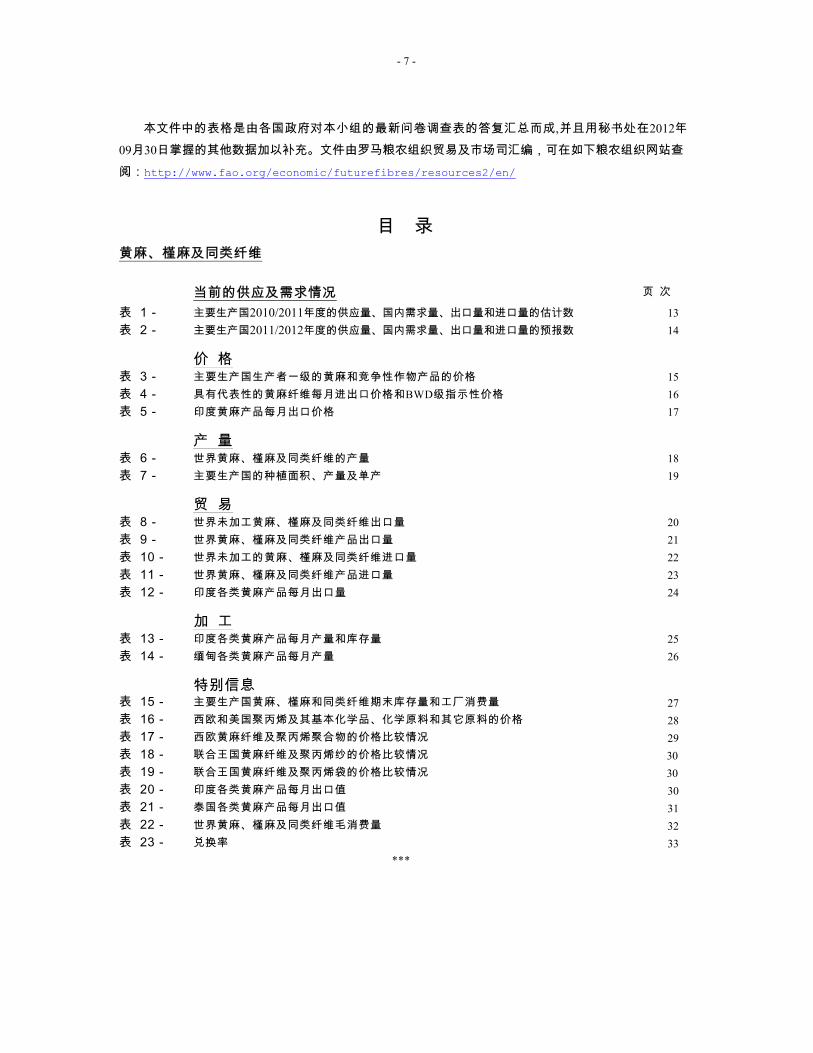
Table 1 - Jute/Kenaf: Estimate of supplies, domestic requirements, exports and imports in major producing countries, 2010/11 1/
Bangladesh India Myanmar Nepal Thailand Others TOTAL
( . . . . . . . . . . . . . . . . . . . . . . . . . . lakh bales . . . . . . . . . . . . . . . . . . . . . . . . . . . )
Opening stocks 0.59 13.81 2.46 2.87 7.80
Production 78.03 100.00 0.43 0.80 0.09 7.40 186.75
Imports 0.00 8.08 0.00 2.82 0.05
Total Supply 78.61 121.89 2.90 6.48 7.94
Mill Consumption 44.16 90.00 0.78 1.11 2.44
Village Consumption 2.78 9.00 0.33 0.00 0.00
Loss/Damage 0.00 0.00 0.00 0.00 0.00
Closing stocks 10.55 19.89 1.79 5.06 5.48
Total Domestic Requirements 57.49 119.89 2.90 6.17 7.92 Exports 21.13 2.00 0.00 0.31 0.01 0.46 23.91
( . . . . . . . . . . . . . . . . . . . . . thousand tonnes . . . . . . . . . . . . . . . . . . . . . . . . . . . )
Opening stocks 10.6 248.6 44.3 51.6 140.3
Production 1 404.5 1 800.0 7.8 14.4 1.7 133.2 3 361.6
Imports 0.0 145.5 0.0 50.7 0.9
Total Supply 1 415.1 2 194.1 52.1 116.7 142.9
Mill Consumption 794.9 1 620.0 14.0 20.0 44.0
Village Consumption 50.0 180.0 6.0 0.0 0.0
Loss/Damage 0.0 0.0 0.0 0.0 0.0
Closing stocks 189.9 358.1 32.1 91.1 98.6
Total Domestic Requirements 1 034.8 2 158.1 52.1 111.1 142.6
Exports 380.3 36.0 0.0 5.6 0.2 8.3 430.4

‐ 14 -
Table 2 - Jute/Kenaf: Estimate of supplies, domestic requirements, exports and imports in major producing countries, 2011/12 1/
Bangladesh India Myanmar Nepal Thailand Others TOTAL
( . . . . . . . . . . . . . . . . . . . . . . . . . . lakh bales . . . . . . . . . . . . . . . . . . . . . . . . . . . )
Opening stocks 10.55 19.89 1.79 5.06 5.48
Production 73.51 110.00 0.21 0.83 0.07 7.63 192.25
Imports 0.00 7.16 0.00 2.83 0.22
Total Supply 84.06 137.05 1.99 8.73 5.77
Mill Consumption 45.56 95.00 0.78 1.11 2.44
Village Consumption 2.78 9.00 0.33 0.00 0.00
Loss/Damage 0.00 0.00 0.00 0.00 0.00
Closing stocks 13.72 31.05 0.88 7.62 3.32
Total Domestic Requirements 62.05 136.05 1.99 8.73 5.77 Exports 22.00 1.00 0.00 0.00 0.00 0.58 23.58
( . . . . . . . . . . . . . . . . . . . . . thousand tonnes . . . . . . . . . . . . . . . . . . . . . . . . . . . )
Opening stocks 189.9 358.1 32.1 91.1 98.6
Production 1 323.1 1 980.0 3.8 15.0 1.3 137.3 3 460.5
Imports 0.0 128.8 0.0 51.0 3.9
Total Supply 1 513.0 2 466.9 35.9 157.1 103.9
Mill Consumption 820.0 1 710.0 14.0 20.0 44.0
Village Consumption 50.0 180.0 6.0 0.0 0.0
Loss/Damage 0.0 0.0 0.0 0.0 0.0
Closing stocks 247.0 558.9 15.9 137.1 59.8
Total Domestic Requirements 1 117.0 2 448.9 35.9 157.1 103.8
Exports 396.0 18.0 0.0 0.0 0.1 10.4 424.5

- 15 -
Table 3 - Prices of jute and competing crops at grower level in major producing countries
Jute Rice Jute 2/ Rice 3/
2005/06 Season 684.8 594.6 537.9 223.92006/07 Season 630.6 475.0 240.32007/08 Season 727.5 452.9 256.62008/09 Season 991.9 702.8 245.12009/10 Season 1 568.9 1 050.6 326.0
2010/11 Season 1 598.6 1 308.3 373.92010 July 1 432.0 1 159.3 368.0
August 1 571.0 1 078.6 373.2September 1 745.0 1 261.3 403.1October 1 655.0 1 366.1 403.1November 1 691.0 1 422.6 356.4December 1 716.0 1 415.3 358.3
2011 January 1 775.0 1 419.1 358.3February 1 780.0 1 380.6 395.6March 1 684.0 1 347.1 395.6April 1 411.0 1 355.5 395.6May 1 356.0 1 368.8 344.1June 1 367.0 1 125.8 334.8
2011/12 Season 1 153.5 910.3 349.42011 July 1 561.0 986.0 354.6
August 1 404.0 946.6 351.6September 1 148.0 966.3 347.1October 1 041.0 875.2 354.6November 1 007.0 832.2 358.3December 1 008.0 787.6 347.1
2012 January 1 010.0 854.1 347.1February 1 158.0 946.4 343.4March 1 247.0 960.2 354.6April 1 108.0 948.5 335.9May 997.0June
2008 Calendar Year 882.5 521.2 250.12009 Calendar Year 1 080.8 888.6 264.42010 Calendar Year 1 814.5 1 224.9 372.32011 Calendar Year 1 378.5 1 115.9 361.5
BANGLADESH 1/ INDIA
. . . Taka/maund . . . . . . Rupees/maund . . .

- 16 -
Table 4 - Representative monthly export prices of jute fibre and Indicative Price of BWD grade
Bangladesh Bangladesh Export Prices 1/ Indicative Price 2/
BWC* BWD** BWD
2006/07 Season 365.0 333.0 450 ± 302007/08 Season 422.9 382.9 420 5002008/09 Season 564.6 516.7 420 5002009/10 Season 831.3 788.1 420 500
2010/11 Season 830.8 741.72010 July 750.0 660.0
August 800.0 700.0September 900.0 820.0October 900.0 800.0November 880.0 800.0December 880.0 800.0
2011 January 880.0 800.0February 850.0 750.0March 840.0 720.0April 820.0 740.0May 750.0 670.0June 720.0 640.0
2011/12 Season 598.8 536.32011 July 700.0 600.0
August 730.0 650.0September 700.0 620.0October 570.0 520.0November 550.0 500.0December 500.0 450.0
2012 January 540.0 480.0February 600.0 540.0March 610.0 560.0April 600.0 540.0May 550.0 490.0June 535.0 485.0
2008 Calendar Year 520.0 467.52009 Calendar Year 606.7 568.82010 Calendar Year 927.9 863.12011 Calendar Year 717.5 638.3
* From 2006 BTC grade quoted due to scarcity of BWC** From 2006 BTD grade quoted due to scarcity of BWD
300300
630630630630630630
630
300300
630
300300
630630
630630
. . . . . . . . . . . . . . . . . . . . . . . . . . . USD / tonne . . . . . . . . . . . . . . . . . . . . . . . . . . . .
630
630630630630

- 17 -
Table 5 - Monthly export prices of jute products in India 1/
Rupees USD Rupees USD
2006/07 Season 1 077 24.4 3 085 69.82007/08 Season 1 026 25.4 2 757 68.32008/09 Season 1 182 24.8 3 189 66.82009/10 Season 1 546 33.3 2 914 62.7
2010/11 Season 1 802 39.8 3 349 73.92010 July 1 727 36.9 2 912 62.2
August 1 520 32.6 3 095 66.5September 1 622 35.2 3 126 67.9October 1 836 41.3 3 220 72.5November 1 921 42.7 3 394 75.4December 1 934 42.8 3 499 77.5
2011 January 1 909 42.1 3 563 78.5February 1 893 41.7 3 656 80.5March 1 810 40.2 3 450 76.7April 1 819 41.0 3 385 76.3May 1 844 41.1 3 413 76.0June 1 792 40.0 3 473 77.4
2011/12 Season 1 710 35.0 3 202 65.62011 July 1 682 37.9 3 264 73.5
August 1 676 37.0 3 180 70.2September 1 710 35.9 3 221 67.6October 1 706 34.6 3 159 64.1November 1 693 33.3 3 153 62.0December 1 698 32.2 3 117 59.2
2012 January 1 702 33.1 3 158 61.5February 1 766 35.9 3 287 66.9March 1 757 34.9 3 278 65.1AprilMayJune
2008 Calendar Year 1 065 24.5 2 990 68.62009 Calendar Year 1 352 27.9 2 955 61.02010 Calendar Year 1 701 37.3 3 127 68.52011 Calendar Year 1 769 37.9 3 336 71.8
. . . Per 100 metres . . .
Hessian (40" - 10 oz) Sacking (B - Twills)
. . . Per 100 bags . . .

- 18 -
Table 6 - World production of jute, kenaf and allied Fibres
2006/07 2007/08 2008/09 2009/10 2010/11 2011/12
Jute fibre:World 2 903.1 2 915.0 2 316.9 2 585.2 3 086.7 3 181.9 Developing countries 2 903.1 2 915.0 2 316.9 2 585.2 3 086.7 3 181.9 Far East 2 903.1 2 915.0 2 316.9 2 585.2 3 086.7 3 181.9 Bangladesh 1 186.4 1 236.8 931.0 1 070.1 1 404.5 1 323.1 India 1 656.0 1 642.3 1 356.0 1 488.8 1 660.0 1 840.0 Myanmar 43.6 19.1 12.9 8.6 7.8 3.8 Nepal 17.1 16.8 17.0 17.7 14.4 15.0
Kenaf and Allied fibres:World 325.6 332.9 280.5 285.3 274.9 278.6 Developing countries 318.8 326.2 273.8 278.5 268.2 271.9 Far East 250.3 260.9 220.9 226.0 221.5 225.3 China 86.8 86.8 84.3 75.2 69.0 70.0 India 144.0 139.7 120.0 131.2 140.0 140.0 Indonesia 3.1 4.7 4.1 3.8 4.0 4.0 Thailand 3.6 2.2 2.9 2.0 1.7 1.3 VietNam 10.6 25.7 7.8 12.1 5.0 8.2 Cambodia 0.6 0.3 0.3 0.2 0.3 0.3 Pakistan 1.6 1.5 1.5 1.5 1.5 1.5 Latin America and Caribbean 51.8 50.4 38.0 35.6 30.9 30.8 Brazil 26.0 25.7 13.4 14.9 14.2 14.2 Cuba 10.0 10.0 10.0 10.0 6.6 6.6 Other 15.8 14.8 14.6 10.7 10.1 10.1 Africa 13.1 11.2 11.3 13.3 12.4 12.4 Near East 3.7 3.6 3.6 3.6 3.5 3.5
Developed countries 6.8 6.7 6.7 6.7 6.7 6.7
Total Jute, Kenaf and Allied Fibres:World 3 228.7 3 247.8 2 597.4 2 870.5 3 361.6 3 460.5Developing countries 3 221.9 3 241.1 2 590.7 2 863.7 3 354.9 3 453.8 Far East 3 153.3 3 175.9 2 537.8 2 811.2 3 308.2 3 407.1 Bangladesh 1 186.4 1 236.8 931.0 1 070.1 1 404.5 1 323.1 China 86.8 86.8 84.3 75.2 69.0 70.0 India 1 800.0 1 782.0 1 476.0 1 620.0 1 800.0 1 980.0 Indonesia 3.1 4.7 4.1 3.8 4.0 4.0 Myanmar 43.6 19.1 12.9 8.6 7.8 3.8 Nepal 17.1 16.8 17.0 17.7 14.4 15.0 Thailand 3.6 2.2 2.9 2.0 1.7 1.3 VietNam 10.6 25.7 7.8 12.1 5.0 8.2 Other 2.2 1.8 1.8 1.7 1.8 1.8
Latin America and Caribbean 51.8 50.4 38.0 35.6 30.9 30.8
Africa 13.1 11.2 11.3 13.3 12.4 12.4
Near East 3.7 3.6 3.6 3.6 3.5 3.5
Developed countries 6.8 6.7 6.7 6.7 6.7 6.7
(.........................................thousand tonnes...........................................)
(provisional)

- 19 -
Table 7 - Area, production and yield of jute, kenaf and allied fibres in major producing countries
BANGLADESH CHINA INDIA MYANMAR NEPAL THAILAND
AREA (thousand ha)2007/08 500.0 33.0 952.0 20.4 11.7 1.2 2008/09 408.1 26.2 785.6 14.3 11.6 1.5 2009/10 485.8 24.0 773.7 9.6 11.7 1.5 2010/11 587.0 19.0 800.0 12.6 10.6 1.4 2011/12 620.2 19.0 790.0 8.2 10.6 1.4
(thousand acres)2007/08 1 235.5 81.5 2 352.5 50.4 29.0 3.0 2008/09 1 008.4 64.7 1 941.3 35.3 28.6 3.7 2009/10 1 200.5 59.3 1 911.9 23.6 28.9 3.7 2010/11 1 450.6 47.0 1 976.9 31.1 26.1 3.5 2011/12 1 532.7 47.0 1 952.2 20.2 26.1 3.5
Y I E L D (tonne / ha)2007/08 2.47 2.63 1.87 0.94 1.43 1.792008/09 2.28 3.22 1.88 0.90 1.47 1.932009/10 2.20 3.13 2.09 0.90 1.52 1.332010/11 2.39 3.63 2.25 0.62 1.36 1.212011/12 2.13 3.68 2.51 0.46 1.42 0.93
(bales / acre)2007/08 5.56 5.91 4.21 2.11 3.22 4.022008/09 5.13 7.23 4.22 2.03 3.30 4.352009/10 4.95 7.05 4.71 2.02 3.41 3.002010/11 5.38 8.16 5.06 1.40 3.07 2.722011/12 4.80 8.28 5.63 1.04 3.19 2.09
PRODUCTION (thousand tonnes)2007/08 1 236.8 86.8 1 782.0 19.1 16.8 2.2 2008/09 931.0 84.3 1 476.0 12.9 17.0 2.9 2009/10 1 070.1 75.2 1 620.0 8.6 17.7 2.0 2010/11 1 404.5 69.0 1 800.0 7.8 14.4 1.7 2011/12 1 323.1 70.0 1 980.0 3.8 15.0 1.3
(lakh bales)2007/08 68.71 4.82 99.00 1.06 0.93 0.122008/09 51.72 4.68 82.00 0.72 0.94 0.162009/10 59.45 4.18 90.00 0.48 0.98 0.112010/11 78.03 3.83 100.00 0.43 0.80 0.092011/12 73.51 3.89 110.00 0.21 0.83 0.07

- 20 -
Table 8 - World exports of raw jute, kenaf and allied Fibres 1/
2006/07 2007/08 2008/09 2009/10 2010/11 2011/12
Kenaf and Allied fibres:World 1.4 1.5 1.7 1.5 1.5 1.5
Developing countries 1.4 1.5 1.7 1.5 1.5 1.5 Far East 1.4 1.5 1.7 1.5 1.5 1.5 China 0.1 0.2 0.6 0.1 0.0 0.1 Thailand 0.0 0.0 0.1 0.0 0.2 0.1 Other 1.3 1.3 1.0 1.4 1.3 1.3 Other developing 0.0 0.0 0.0 0.0 0.0 0.0
Developed countries 0.0 0.0 0.0 0.0 0.0 0.0
Jute fibre:
World 461.0 529.4 324.5 330.4 428.9 423.0
Developing countries 451.4 519.9 316.5 324.6 422.3 414.4 Far East 450.9 519.1 316.2 323.8 421.8 413.9 Bangladesh 439.7 516.8 314.9 287.8 380.3 396.0 Myanmar 9.0 0.0 0.0 0.0 0.0 0.0 Other 2.2 2.3 1.3 36.0 41.5 17.9
Developed countries 9.6 9.5 8.0 5.8 6.6 8.6
Total Jute, Kenaf and Allied Fibres:
World 462.4 530.9 326.2 331.9 430.4 424.5
Developing countries 452.8 521.4 318.2 326.1 423.8 415.9
Far East 452.3 520.6 317.9 325.3 423.3 415.4 Bangladesh 439.7 516.8 314.9 287.8 380.3 396.0 China 0.1 0.2 0.6 0.1 0.0 0.1 Myanmar 9.0 0.0 0.0 0.0 0.0 0.0 Thailand 0.0 0.0 0.1 0.0 0.2 0.1 Other 3.5 3.6 2.3 37.4 42.8 19.2 Other Developing 0.5 0.8 0.3 0.8 0.5 0.5
Developed countries 9.6 9.5 8.0 5.8 6.6 8.6
(.........................................thousand tonnes...........................................)
(provisional)

- 21 -
Table 9 - World exports of products of Jute, Kenaf and Allied fibres 1/
2006/07 2007/08 2008/09 2009/10 2010/11 2011/12 (provisional)
WORLD 731.7 732.7 745.5 708.6 783.6 852.0
DEVELOPING 703.4 704.0 715.8 682.0 757.4 830.1
Africa 5.7 5.2 3.6 2.8 2.1 2.5
Latin America 2.2 1.5 0.5 0.6 0.7 1.1 El Salvador 1.5 1.4 0.3 0.2 0.4 0.5 Guatemala 0.0 0.0 0.1 0.2 0.1 0.1 Mexico 0.1 0.0 0.1 0.1 0.1 0.4
Near East 6.1 6.3 13.1 10.8 11.4 10.1 Egypt 0.0 0.0 1.6 2.0 0.1 1.2 Saudi Arabia 0.9 0.4 0.2 0.2 0.2 0.2 Syria 0.1 0.1 5.9 4.0 3.5 4.2 Turkey 4.6 5.7 5.1 4.4 7.4 4.2
Far East 689.4 691.0 698.6 667.8 743.2 816.4 Bangladesh 458.9 431.0 491.5 459.4 476.2 541.0 China 18.5 21.1 11.8 15.9 12.0 10.3 India 177.3 206.9 173.6 163.5 182.9 212.9 Nepal 13.0 13.0 13.0 19.8 57.6 40.0 Pakistan 17.1 15.1 6.1 6.9 12.0 10.5 Thailand 3.4 2.8 1.6 1.3 1.4 0.7
DEVELOPED 28.3 28.8 29.7 26.6 26.1 21.9
North America 1.8 2.2 2.3 3.5 5.2 4.3 USA 1.2 1.9 1.8 3.4 5.1 4.2
Europe 25.2 23.3 22.8 21.1 19.9 16.9 EU (27) 25.0 23.0 22.5 20.9 19.6 16.6
Belgium-Lux. 11.1 12.8 10.9 11.6 10.9 8.9 France 0.6 0.4 0.2 0.3 0.4 0.2 Germany 3.6 2.2 3.8 2.1 2.2 1.9 Netherlands 3.5 3.2 2.1 1.5 1.7 1.6 UK 2.7 1.9 1.7 1.5 0.7 0.4
Other EU 0.2 0.3 0.3 0.2 0.2 0.3
Former USSR 0.3 2.1 3.7 0.9 0.2 0.4
Oceania 0.2 0.3 0.2 0.2 0.2 0.1 Australia 0.2 0.3 0.2 0.2 0.2 0.1
Other Developed 0.8 0.8 0.7 0.9 0.7 0.2 Japan 0.5 0.4 0.2 0.1 0.3 0.0 South Africa 0.3 0.4 0.5 0.8 0.4 0.2
( . . . . . . . . . . . . . . . . . . . . . . . . thousand tonnes . . . . . . . . . . . . . . . . . . . . . . . . . )

- 22 -
Table 10 - World imports of raw jute, kenaf and allied fibres 1/
2006 2007 2008 2009 2010 2011 (provisional)
WORLD 355.1 508.3 436.1 376.8 477.1 471.3
DEVELOPING 335.5 473.0 395.0 354.7 456.4 446.9
Africa 17.7 13.0 20.2 14.5 22.3 13.1 Côte d'Ivoire 12.0 7.5 12.7 6.7 17.6 2.3 Ethiopia 3.8 3.0 5.6 3.7 3.5 4.6 Ghana 0.3 0.3 0.1 0.1 0.1 4.9 Nigeria 0.1 0.1 0.1 0.1 0.1 0.1 Tanzania 0.3 0.3 0.3 0.3 0.1 0.0 Tunisia 1.3 1.7 1.4 3.6 0.9 1.2
Latin America 6.3 4.0 20.0 5.7 15.3 13.9 El Salvador 0.8 0.7 0.9 0.8 1.2 2.4 Nicaragua 0.2 0.2 0.2 0.2 0.2 0.2 Cuba 3.2 2.9 2.9 2.9 3.0 3.0 Brazil 2.1 0.2 15.9 1.8 10.9 8.3
Near East 3.9 3.5 3.9 3.0 2.9 2.7 Egypt 1.6 0.3 0.8 0.4 0.3 0.3 Iran 1.0 1.1 1.0 0.4 0.3 0.1 Jordan 0.0 0.3 0.2 0.2 0.2 0.3 Saudi Arabia 0.8 1.0 0.9 1.1 1.0 2.0 Turkey 0.2 0.1 0.1 0.0 0.0 0.0
Far East 307.6 452.6 350.9 331.5 415.9 417.2 China 88.6 125.7 114.2 95.7 104.1 109.6 India 79.8 162.5 70.5 56.6 145.5 128.8 Indonesia 2.2 2.6 5.5 2.2 0.5 2.1 Pakistan 111.8 126.5 128.8 128.6 98.5 106.0 Thailand 15.6 23.3 8.2 15.8 0.9 3.9
DEVELOPED 19.6 35.3 41.1 22.1 20.7 24.4
North America 1.6 3.7 3.7 1.8 2.7 2.2 United States 1.6 3.6 3.5 1.7 2.4 2.2
Europe 12.4 20.1 22.6 15.3 13.9 15.2 EU (27) 10.8 18.4 20.9 14.0 12.6 13.8
Belgium-Lux. 0.7 1.8 1.0 1.0 1.5 0.5 Germany 1.4 3.4 1.7 2.0 2.5 3.2 Netherlands 1.2 0.2 0.1 0.1 0.0 0.1 Spain 1.4 1.4 1.3 0.8 1.3 2.0 United Kingdom 2.0 5.4 11.2 4.5 1.9 2.6 Other EU 4.1 6.1 5.4 5.7 5.4 5.3
Other Europe 1.6 1.7 1.7 1.3 1.3 1.4
Former USSR 3.2 9.0 11.7 2.6 2.8 5.4
Oceania 1.5 1.5 1.4 1.5 0.8 0.8 Australia 1.5 1.5 1.4 1.5 0.8 0.8 Other Developed 0.9 1.0 1.7 0.9 0.5 0.8 Japan 0.9 0.7 1.2 0.6 0.4 0.8
( . . . . . . . . . . . . . . . . . . . . . . . . thousand tonnes . . . . . . . . . . . . . . . . . . . . . . . . . )

- 23 -
Table 11 - World imports of products of Jute, Kenaf and Allied fibres 1/ 2/
2006 2007 2008 2009 2010 2011 (provisional)
WORLD 617.5 615.1 619.9 502.6 601.3 663.2DEVELOPING 370.4 372.0 386.2 336.9 416.3 489.4 Africa 57.0 56.7 48.2 44.9 45.0 71.5
Algeria 5.1 7.2 5.9 5.8 7.7 8.6 Cameroon 1.6 2.3 1.4 1.9 2.0 2.0 Ghana 19.8 14.2 12.8 12.8 6.9 24.3 Kenya 4.8 4.3 2.7 5.1 3.0 3.5 Morocco 3.6 5.8 5.2 3.8 4.0 4.1 Tanzania 3.4 2.7 3.8 2.3 5.3 5.6 Zimbabwe 4.8 6.0 3.5 2.2 3.0 11.5
Latin America 15.4 16.8 17.0 10.4 12.3 18.7 Argentina 2.8 3.2 1.5 1.2 1.2 1.2 Brazil 3.9 4.1 5.6 3.1 4.1 9.9 Costa Rica 1.2 1.0 1.4 0.6 0.8 0.9 Mexico 1.2 1.3 1.3 0.5 0.7 1.4 Uruguay 1.2 1.2 1.0 1.0 1.0 0.5
Near East 270.5 267.8 278.6 245.0 301.3 299.3 Egypt 5.4 4.6 19.5 8.8 21.8 15.8 Iran 59.1 74.0 57.5 56.4 66.1 61.5 Saudi Arabia 18.9 19.3 16.0 4.8 16.4 17.0 Sudan 3.2 2.1 1.0 1.0 1.0 1.0 Syria 53.7 39.7 33.4 32.0 32.3 34.0 Turkey 127.9 125.1 148.3 136.9 160.0 165.0
Far East 27.5 30.7 42.4 36.6 57.7 99.9 China 4.5 4.7 5.4 7.9 14.3 54.3 Indonesia 8.8 11.1 13.0 10.7 23.0 22.6 Korea Rep. 5.0 5.7 5.5 4.3 4.0 4.1 Malaysia 1.8 2.0 2.7 3.7 1.6 1.6 Pakistan 0.4 1.7 8.2 4.2 9.4 1.3 Sri Lanka 2.5 2.9 2.6 2.5 3.0 2.4 Thailand 0.6 0.5 2.9 1.0 0.5 10.7
DEVELOPED 247.1 243.0 233.7 165.7 185.0 173.8 North America 50.0 46.9 40.8 28.4 33.8 35.1
United States 46.5 42.4 37.2 25.1 30.9 31.6 Europe 136.5 133.4 128.9 86.2 99.9 89.6
EU (27) 134.4 131.3 126.8 84.7 98.2 88.0 Belgium-Lux. 59.0 56.2 50.5 38.6 46.3 33.5 Germany 13.5 15.4 12.4 9.7 10.6 11.9 Netherlands 12.0 14.4 15.9 9.9 12.2 14.0 Spain 8.5 5.9 4.9 3.7 3.9 4.7 United Kingdom 15.2 13.7 10.2 7.4 8.4 7.4
Other Europe 2.1 2.1 2.1 1.5 1.7 1.6 Former USSR 12.9 17.4 19.3 12.8 15.2 15.0
Russian Federation 10.8 15.0 17.4 10.5 12.7 15.0 Oceania 28.6 27.8 27.3 21.8 20.6 23.9
Australia 23.7 24.0 23.3 18.6 17.4 20.3 Other Developed 19.1 17.6 17.3 16.5 15.6 10.3
Israel 1.0 0.7 0.7 0.6 0.7 0.4 Japan 14.5 13.6 14.3 14.2 13.0 8.0 South Africa 3.5 3.3 2.3 1.7 1.9 1.9
( . . . . . . . . . . . . . . . . . . . . . . . thousand tonnes . . . . . . . . . . . . . . . . . . . . . . . . )

- 24 -
Table 12 - Monthly exports of jute products by type from India
Yarn Hessian Sacking TOTAL 1 /
2006/07 Season 81.8 53.6 31.1 177.32007/08 Season 90.5 71.6 30.2 206.92008/09 Season 70.8 45.7 47.8 173.62009/10 Season 75.1 45.3 32.3 163.5
2010/11 Season 71.5 52.5 50.2 183.82010 July 9.5 6.5 3.0 20.0
August 9.0 6.0 4.7 20.7September 8.8 4.5 3.6 17.8October 7.3 3.2 4.6 15.7November 6.7 3.7 4.4 15.8December 6.0 3.3 3.8 13.9
2011 January 4.8 4.5 3.3 13.4February 4.4 4.4 1.7 11.2March 5.4 4.0 2.7 13.0April 4.1 3.8 3.8 12.3May 2.6 3.8 6.7 13.8June 2.9 4.8 7.9 16.2
2011/12 Season 44.4 44.8 63.4 158.92011 July 2.2 5.6 7.3 15.9
August 3.9 6.4 7.1 18.0September 6.8 5.1 5.0 17.5October 4.7 4.5 4.3 14.1November 4.7 4.9 6.6 16.8December 5.7 5.4 8.7 20.4
2012 January 5.4 4.5 9.3 19.9February 5.3 4.4 6.9 17.6March 5.7 4.0 8.2 18.7AprilMayJune
2008 Calendar Year 89.5 59.0 46.9 207.62009 Calendar Year 50.8 38.4 35.1 134.02010 Calendar Year 98.8 51.4 41.4 202.42011 Calendar Year 52.2 57.2 65.1 182.6
( . . . . . . . . . . . . . . . . . . . . . . thousand tonnes . . . . . . . . . . . . . . . . . . . . . )
MANUFACTURES

- 25 -
Table 13 - Monthly production and stocks of jute products by type in India
PRODUCTION STOCKSHessian Sacking Carpet
backingTOTAL
1 / Hessian Sacking Carpet
backingTOTAL
1 / 2 /
2006/07 Season 262.3 936.1 3.2 1 442.7 22.5 32.8 0.5 71.02007/08 Season 340.3 1 117.5 6.1 1 733.8 18.2 42.2 0.4 72.82008/09 Season 280.9 1 066.7 3.3 1 593.6 13.0 29.4 0.6 52.02009/10 Season 218.7 930.6 2.4 1 423.2 19.2 42.6 0.6 76.2
2010/11 226.0 1 081.5 3.2 1 586.2
2010 July 18.8 95.1 0.3 147.0 17.8 50.7 0.4 82.2August 20.7 106.3 0.4 159.4 14.9 49.5 0.5 76.8September 21.1 89.3 0.4 142.2 16.3 48.1 0.4 77.6October 20.0 81.2 0.2 133.7 19.9 48.1 0.3 83.7November 18.1 75.7 0.3 119.9 19.8 52.9 0.2 87.9December 17.5 94.1 0.1 138.1 21.4 59.4 0.3 97.4
2011 January 18.6 101.5 0.0 144.1 20.1 56.4 0.4 93.8February 18.0 92.5 0.3 127.1 20.7 50.8 0.3 85.8March 18.5 94.3 0.3 130.0 19.7 45.6 0.3 79.0April 19.3 75.6 0.3 109.0 16.8 41.4 0.3 72.1May 18.2 78.0 0.3 108.5 15.9 55.1 0.3 83.7June 17.2 97.9 0.3 127.2 15.6 64.8 0.3 93.1
2011/12 Season 185.2 913.6 2.7 1 237.7
2011 July 19.8 103.9 0.3 137.6 16.8 52.8 0.3 83.5August 19.5 102.6 0.3 136.9 15.8 50.4 0.3 80.5September 21.3 109.3 0.3 146.9 16.1 54.2 0.3 83.1October 19.5 94.4 0.3 128.8 17.7 53.2 0.3 83.7November 18.5 88.1 0.3 122.8 16.1 46.2 0.3 75.4December 19.9 101.6 0.3 138.6 16.0 50.4 0.3 78.6
2012 January 22.6 101.5 0.3 138.9 17.3 45.6 0.3 74.8February 21.6 105.8 0.3 142.0 16.7 47.3 0.3 75.0March 22.5 106.4 0.3 145.2 16.9 40.7 0.3 68.4AprilMayJune
2008 Calendar Year 304.7 1 080.0 5.0 1 654.72009 Calendar Year 249.3 1 076.5 3.0 1 545.52010 Calendar Year 225.4 927.7 2.4 1 501.42011 Calendar Year 228.3 1 139.7 3.3 1 557.5
( . . . . . . . . . . . . . . . . . . . . . . . . . . . . . thousand tonnes . . . . . . . . . . . . . . . . . . . . . . . . . . . . . )

- 26 -
Table 14 - Monthly production of jute products by type in Myanmar
Yarn & Twine Hessian Gunny Bags TOTAL
2005/06 Season 1.58 0.02 1.77 3.372006/07 Season 1.80 0.02 1.33 3.152007/08 Season 1.14 0.00 1.12 2.262008/09 Season 1.83 0.02 1.42 3.27
2009/10 Season 1.76 0.01 1.10 2.882009 July 0.20 0.00 0.11 0.31
August 0.10 0.00 0.07 0.17September 0.25 0.00 0.12 0.37October 0.15 0.00 0.10 0.25November 0.01 0.00 0.09 0.10December 0.13 0.00 0.07 0.21
2010 January 0.17 0.00 0.10 0.27February 0.20 0.00 0.13 0.33March 0.23 0.00 0.13 0.36April 0.07 0.00 0.04 0.11May 0.11 0.00 0.07 0.18June 0.14 0.00 0.07 0.21
2010/11 Season 1.72 0.01 0.86 2.582010 July 0.15 0.00 0.10 0.25
August 0.15 0.00 0.08 0.23September 0.20 0.00 0.10 0.30October 0.14 0.00 0.08 0.22November 0.13 0.00 0.07 0.21December 0.14 0.00 0.06 0.21
2011 January 0.15 0.00 0.07 0.22February 0.15 0.00 0.07 0.22March 0.15 0.00 0.07 0.22April 0.08 0.00 0.03 0.11May 0.13 0.00 0.07 0.20June 0.15 0.00 0.07 0.22
2006 Calendar Year 1.79 0.04 1.79 3.622007 Calendar Year 1.66 0.00 1.07 2.732008 Calendar Year 1.04 0.01 1.26 2.312009 Calendar Year 1.98 0.02 1.22 3.212010 Calendar Year 1.83 0.01 1.04 2.87
( . . . . . . . . . . . . . . . . . . . thousand tonnes . . . . . . . . . . . . . . . . . . . . . )

- 27 -
Table 15 - Closing stocks and mill consumption of jute, kenaf and allied fibres in the major producing countries
2006/07 2007/08 2008/09 2009/10 2010/11 2011/12
(.......................................thousand tonnes......................................)
Stocks of fibre end of season
Bangladesh 104.1 68.0 16.3 10.5 189.9 247.0 India 389.7 393.5 166.3 248.6 358.1 558.9Myanmar 63 7 62 8 55 7 44 3 32 1 15 9
(.......................................thousand tonnes......................................)
Myanmar 63.7 62.8 55.7 44.3 32.1 15.9 Nepal 16.3 17.1 30.7 51.6 91.1 137.1 Thailand 218.0 199.5 166.6 140.3 98.6 59.8
TOTAL 791.9 741.0 435.6 495.4 769.9 1018.7
Mill Consumption
Bangladesh 626 2 696 1 617 8 738 0 794 9 820 0 Bangladesh 626.2 696.1 617.8 738.0 794.9 820.0 India 1427.6 1778.6 1611.7 1378.3 1620.0 1710.0 Myanmar 14.0 14.0 14.0 14.0 14.0 14.0 Nepal 15.0 16.0 17.0 20.0 20.0 20.0 Thailand 44.0 44.0 44.0 44.0 44.0 44.0TOTAL 2126.8 2548.7 2304.5 2194.3 2492.9 2608.0
Percent of stocks tomill consumption 37.2 29.1 18.9 22.6 30.9 39.1
500.0
600.0
700.0
Closing Stocks of Fibrein major producing countries
100.0
200.0
300.0
400.0
thou
sand
tonn
es
India
Thailand
Bangladesh
0.02006/07 2007/08 2008/09 2009/10 2010/11 2011/12
g des

- 28 -
Table 16 - Prices of Polypropylene, its base chemical, chemical feedstock and raw material,
in Western Europe and United States
2007 2008 2009 2010 2011
Jan Feb Mar Apr May Jun
WESTERN EUROPE :
Crude Oil - f.o.b. Dubai
USD/BBL 72.9 97.0 61.6 79.1 111.1 110.2 119.1 125.5 119.3 110.0 95.3
Naphtha - Spot price range
USD/tonne 668.9 819.0 500.0 716.5 934.1 922.0 944.0(jan-oct)
Propylene - Contract prices
USD/tonne 1141.2 1444.0 800.0 1378.0 1673.9 1235.0 1235.0
Euro/tonne 860.7 953.0 607.0 956.0 1118.4 1015.0 1015.0
Polypropylene- Raffia grade
USD/tonne 1523.7 n.a n.a n.a n.a n.a n.a n.a n.a n.a n.a
Euro/tonne 1168.3 n.a n.a n.a n.a n.a n.a n.a n.a n.a n.a
UNITED STATES :
Contract pricePropylene - Polymer
USD/tonne 1101.2 1307.0 787.0 1324.0 1628.2 1211.0 1394.0
Cents/pound 49.9 59.3 35.7 60.1 73.9 54.9 63.3 (jan-oct)
RAW JUTE - F.o.b Mongla
Calendar Year
BTD - USD/tonne 333.3 467.5 568.8 863.1 638.3 480.0 540.0 560.0 540.0 490.0 485.0
BTC - USD/tonne 364.2 520.0 606.7 927.9 717.5 540.0 600.0 610.0 600.0 550.0 535.0
2012
(jan-june)

- 29 -
Table 17 - Comparative price position (%) of jute fibre and polypropylene polymer in Western Europe 1/
2003 2004 2005 2006 2007 2008 2009
Quarter: First 26 24 26 30 22 n.a. n.a. Second 26 28 31 27 21 n.a. n.a. Third 30 26 30 26 n.a. n.a. n.a. Fourth 27 27 27 22 n.a. n.a. n.a.
Average 27 26 29 26 21 n.a. n.a.
Table 18 - Comparative price position (%) of jute and polypropylene yarn in United Kingdom 1/
2003 2004 2005 2006 2007 2008 2009
Quarter: First 43 47 36 42 38 39 52 Second 42 46 32 41 36 37 51 Third 42 46 34 41 35 41 45 Fourth 44 41 40 37 37 49 42
Average 43 45 35 40 36 41 47
Table 19 - Comparative price position (%) of jute and polypropylene sacks in United Kingdom 1/
2003 2004 2005 2006 2007 2008 2009
Quarter: First 263 238 157 172 155 135 166 Second 244 209 148 175 153 144 126 Third 228 196 153 166 153 153 135 Fourth 226 169 135 178 134 173 141
Average 240 203 148 173 149 151 142

- 30 -
Table 20 - Monthly export value of jute products by type from India
MANUFACTURES
Yarn Hessian Sacking TOTAL1 /
2006/07 Season 64.9 39.3 22.5 136.9 2007/08 Season 72.2 74.3 22.7 185.4 2008/09 Season 48.4 36.5 31.3 130.5 2009/10 Season 73.5 49.1 25.4 163.0
2010/11 Season 92.7 57.0 51.3 216.0 2010 July 10.1 7.1 2.4 20.9
August 11.1 7.0 3.9 23.3 September 11.4 4.7 3.4 20.7 October 9.8 3.2 4.6 18.6 November 9.2 3.7 4.4 18.8 December 8.2 3.3 3.7 16.5
2011 January 6.5 4.1 3.3 15.2 February 5.9 3.7 1.7 12.5 March 7.4 5.1 2.7 16.3 April 5.6 5.3 6.0 18.2 May 3.6 4.2 6.9 15.7 June 4.0 5.6 8.4 19.1
2011/12 Season 50.0 64.5 74.9 198.7 2011 July 2.9 20.6 9.4 33.8
August 5.0 7.5 7.5 21.7 September 8.3 5.8 5.1 20.1 October 5.1 5.5 5.9 17.3 November 4.9 5.8 8.7 20.4 December 5.8 6.2 11.1 24.0
2012 January 6.2 4.5 10.2 21.6 February 6.3 4.6 7.9 20.0 March 5.6 4.1 9.2 19.8 AprilMayJune
2008 Calendar Year 62.5 51.0 32.6 164.0 2009 Calendar Year 38.7 36.1 24.0 112.1 2010 Calendar Year 114.7 57.8 36.7 224.3 2011 Calendar Year 65.1 78.8 77.4 234.3
( . . . . . . . . . . . . . . . . . . . . . . . . . . . Million USD . . . . . . . . . . . . . . . . . . . . . . . . . . . . . . . )

- 31 -
Table 21 - Monthly export value of raw kenaf and products by type from Thailand
RAW FIBRE MANUFACTURES
Yarn & Twine Fabrics GunnyBags
TOTAL1 /
( . . . . . . . . . . . . . . . . . . . . . . . . . . . . Million USD . . . . . . . . . . . . . . . . . . . . . . . . . . . )
2000/01 Season 0.76 3.14 0.17 2.67 6.652001/02 Season 0.53 0.88 0.23 1.21 4.552002/03 Season 0.59 0.53 0.35 1.19 4.272003/04 Season 0.46 0.41 0.24 0.97 3.87
2004/05 Season 0.17 0.24 0.19 2.17 3.602004 July 0.03 0.02 0.02 0.16 0.40
August 0.04 0.01 0.01 0.33 0.10September 0.01 0.01 0.01 0.14 0.20October 0.01 0.01 0.01 0.06 0.18November 0.04 0.01 0.01 0.15 0.28December 0.04 0.00 0.01 0.20 0.25
2005 January 0.07 0.04 0.39 0.58February 0.01 0.04 0.44 0.59March 0.02 0.02 0.11 0.24April 0.04 0.01 0.14 0.29May 0.04 0.01 0.00 0.18June 0.00 0.00 0.05 0.31
2005/06 Season2005 July 0.00 0.01 0.20 0.47
August 0.07 0.03 0.31 0.49September 0.02 0.04 0.31 0.44October 0.02 0.08 0.16 0.34November 0.04 0.08 0.25 0.40December 0.03 0.07 0.50 0.66
2006 JanuaryFebruaryMarchAprilMayJune
2003 Calendar Year 0.70 0.34 0.32 1.22 3.932004 Calendar Year 0.34 0.35 0.16 1.42 3.632005 Calendar Year 0.36 0.43 2.86 4.99

- 32 -
Table 22 - World apparent consumption of jute, kenaf and allied fibres
2006 2007 2008 2009 2010 2011
WORLD 2731.0 3130.3 2973.0 2604.5 2858.6 3074.5
DEVELOPING 2481.1 2869.3 2713.7 2431.8 2666.8 2885.8Africa 85.7 78.5 78.9 72.5 80.2 99.0 Algeria 5.5 7.7 6.4 6.2 8.2 9.2 Ethiopia 3.8 3.0 5.6 3.7 3.5 4.6 Ghana 21.4 15.3 13.8 13.8 7.5 30.9 Kenya 1.4 2.2 1.0 3.6 1.6 2.1 Morocco 4.0 6.3 5.6 4.1 4.3 4.4 Tanzania United Rep 3.9 2.4 3.2 2.2 5.4 5.6 Zimbabwe 5.1 6.4 3.8 2.4 3.2 12.3Latin America and Caribbean 72.1 70.8 76.0 51.7 58.6 63.5 Argentina 3.0 3.4 1.6 1.3 1.3 1.3 Brazil 32.3 30.2 35.3 20.0 29.4 33.0 Mexico 1.2 1.4 1.3 0.4 0.6 1.1 Cuba 12.6 12.9 12.9 12.9 9.6 9.6Near East 290.0 286.9 291.5 256.7 316.4 315.4 Egypt 7.8 5.5 20.3 7.6 23.5 16.0 Iran Islamic Rep. of 63.5 80.3 62.5 60.7 71.0 65.9 Sudan 6.8 5.4 4.3 4.3 4.3 4.3 Syrian Arab Republic 57.3 42.6 30.0 28.9 30.9 31.9 Turkey 131.9 127.9 153.3 141.7 163.3 172.1Far East 2033.3 2433.0 2267.3 2050.9 2211.7 2407.8 Bangladesh 167.0 219.6 142.1 213.5 228.0 210.6 China (Mainland) 160.4 194.8 191.1 162.2 175.5 226.5 India 1473.1 1751.4 1653.7 1413.2 1580.4 1700.6 Indonesia 14.3 18.9 23.2 17.3 29.0 30.3 Pakistan 122.0 134.4 145.2 132.1 111.7 112.0 Myanmar 20.0 20.0 20.0 20.0 20.0 20.0 Thailand 40.9 41.5 45.4 39.7 39.0 50.7 Viet Nam 10.6 24.9 7.2 11.1 4.0 7.2
DEVELOPED 249.9 261.0 259.3 172.7 191.8 188.7North America 58.4 55.2 49.4 33.2 37.6 39.5 United States 55.3 51.0 45.8 29.7 34.4 35.9 Canada 3.1 4.1 3.5 3.5 3.3 3.6Europe 122.8 130.8 132.0 82.0 96.3 87.9 EU 27 119.2 127.3 128.5 79.4 93.5 85.2 Belgium-Lux 47.0 43.2 39.1 26.5 35.4 22.1 France 4.1 4.4 4.0 1.7 1.9 1.9 Germany 10.6 14.0 9.2 8.1 8.9 10.7 Netherlands 9.1 11.9 14.8 9.1 11.3 13.3 Spain 8.6 5.8 5.1 3.2 3.3 4.3 United Kingdom 13.3 12.6 9.1 6.4 8.2 7.4 Other Europe 3.5 3.5 3.5 2.6 2.8 2.7Former USSR 16.6 25.3 28.1 15.1 18.7 23.2 Russian Federation 14.3 22.6 26.0 12.6 16.1 21.0 Other 2.3 2.7 2.1 2.5 2.7 2.1Oceania 31.9 30.9 30.4 24.7 22.7 26.3 Australia 26.7 26.9 26.1 21.2 19.3 22.4 New Zealand 5.2 4.1 4.3 3.4 3.4 3.9Other Developed 20.1 18.8 19.3 17.7 16.4 11.9 Japan 15.9 14.8 16.3 15.7 14.0 9.3 South Africa 4.2 4.0 3.0 2.0 2.4 2.5
( . . . . . . . . . . . . . . . . . . . . . . . . thousand tonnes . . . . . . . . . . . . . . . . . . . . . . . . . )

- 33 -
Table 23 - Exchange rates
Bangladesh India Thailand Myanmar Nepal
Taka/USD Rupees/USD Baht/USD Kyats/USD Rupees/USD
2005/06 Season 67.164 44.740 39.908 5.860 72.0772006/07 Season 69.056 44.190 36.090 5.700 70.8172007/08 Season 68.611 40.366 33.126 5.395 64.8762008/09 Season 68.803 47.777 34.649 5.571 76.6122009/10 Season 69.183 46.569 33.080 5.517 74.639
2010/11 Season 71.194 45.333 30.605 5.451 72.533
2010 July 69.435 46.836 32.277 5.657 74.962August 69.483 46.567 31.698 5.606 74.467September 69.703 46.059 30.787 5.572 73.774October 70.489 44.412 29.921 5.420 71.146November 70.402 45.017 29.990 5.318 71.748December 70.627 45.159 30.119 5.541 72.376
2011 January 71.043 45.395 30.580 5.501 72.558February 71.178 45.437 30.717 5.444 72.783March 71.983 44.990 30.369 5.385 71.985April 72.849 44.368 30.050 5.323 71.040May 73.224 44.905 30.240 5.327 71.791June 73.917 44.852 30.510 5.322 71.770
2011/12 Season 78.579 49.274 30.732 5.437 78.094
2011 July 74.485 44.420 30.080 5.340 71.520August 74.520 45.280 29.880 5.300 71.410September 74.680 47.640 30.420 5.400 73.920October 75.740 49.260 30.890 5.410 78.150November 76.520 50.840 30.950 5.430 79.280December 79.690 52.670 31.210 5.500 83.000
2012 January 83.410 51.350 31.580 5.540 82.100February 83.110 49.160 30.730 5.490 78.660March 81.800 50.320 30.690 5.520 80.350April 81.830 51.800 30.890 82.550MayJune
2007 Calendar Year 68.875 41.349 34.518 5.595 66.4152008 Calendar Year 68.598 43.506 33.313 5.388 69.7622009 Calendar Year 69.039 48.405 34.286 5.519 77.5452010 Calendar Year 69.649 45.643 31.686 5.578 73.1552011 Calendar Year 74.152 46.671 30.491 5.390 74.020

- 34 -
Table 24 - Production of sisal, henequen and other similar hard fibres
2006 2007 2008 2009 2010 2011
SISAL: Africa total (Continent) 69.5 70.6 67.0 52.4 69.9 73.9
Angola 0.5 0.5 0.5 0.3 0.4 0.4 Ethiopia 0.6 0.6 0.6 0.4 0.5 0.5 Kenya 25.5 24.6 22.2 21.5 22.8 28.1 Madagascar 9.2 9.1 8.3 6.9 9.1 8.0 Mozambique 0.6 0.6 0.6 0.4 0.5 0.5 South Africa 1.3 1.0 0.9 0.8 0.8 0.8 Tanzania 30.9 33.3 33.0 21.1 34.8 34.5 Others 1.0 1.0 1.0 1.0 1.0 1.0
Latin America 136.9 129.1 120.9 112.1 115.1 128.4 Brazil 125.5 113.3 105.6 94.9 98.0 111.2 Others 11.4 15.8 15.3 17.2 17.2 17.2
Other countries 60.9 100.3 53.0 46.9 47.3 39.0 China 60.9 100.3 53.0 45.9 46.3 38.0
TOTAL SISAL 267.2 300.0 240.9 211.4 232.3 241.3
Henequen : Cuba 1.4 1.4 1.4 1.4 1.4 1.4 Mexico 17.5 16.9 15.5 11.1 11.2 11.2 Other countries 1/ 3.5 3.5 3.5 3.5 3.5 3.5
Total Henequen 22.4 21.8 20.4 16.0 16.1 16.1
Total Sisal & Henequen 289.6 321.8 261.3 227.4 248.4 257.4
Other Hard Fibres: Fique (Colombia) 21.2 21.3 20.9 21.6 24.0 22.2 Phormium tenax 2/ 2.3 2.3 2.3 2.3 2.3 2.3 Other hard fibres 3/ 11.0 11.0 11.0 12.0 12.0 12.0 Total, Other Hard Fibres 34.5 34.6 34.2 35.9 38.3 36.5
Total Above Fibres 4/ 324.1 356.5 295.4 263.3 286.7 293.8
( . . . . . . . . . . . . . . . . . . . . . . . . thousand tonnes . . . . . . . . . . . . . . . . . . . . . . . )

- 35 -
Table 25 - Sisal and henequen fibres and manufactures: Exports from producing countries 1/
2006 2007 2008 2009 2010 2011
Brazilfibre 52.6 52.6 27.1 27.4 30.5 39.1cordage 38.4 33.0 43.0 31.1 24.6 31.1oth. manuf.(Yarn-Carpets) 16.5 11.7 10.3 9.1 11.2 9.9Total 107.5 97.3 80.4 67.5 66.3 80.2
Haitifibre 0.0 0.0 0.0 0.0 0.0 0.0cordage 1.5 3.0 3.0 3.5 3.5 3.5Total 1.5 3.0 3.0 3.5 3.5 3.5
Kenyafibre 19.6 21.8 19.8 18.7 20.0 23.9cordage 1.1 0.3 0.4 0.3 0.7 1.0Total 20.7 22.1 20.1 19.0 20.6 24.9
Madagascarfibre 7.8 7.3 6.6 5.9 7.8 6.5cordage 1.0 1.0 1.2 0.7 0.7 0.8Total 8.8 8.3 7.8 6.6 8.5 7.2
Mexicofibre 0.0 0.0 0.0 0.0 0.0 0.0cordage 1.8 1.5 1.7 1.2 1.5 1.7Total 1.8 1.5 1.7 1.2 1.5 1.7
Mozambiquefibre 0.5 0.5 0.5 0.5 0.5 0.5cordage 0.5 0.5 0.5 0.5 0.5 0.5Total 1.0 1.0 1.0 1.0 1.0 1.0
Tanzaniafibre 11.9 8.2 9.0 8.3 11.6 13.8cordage 3.1 3.6 2.4 5.3 3.3 6.0Total 15.0 11.7 11.4 13.6 14.9 19.8
Chinafibre 0.0 0.0 0.0 0.0 0.0 0.0cordage 5.5 6.7 7.5 7.7 10.0 8.0Total 5.5 6.7 7.5 7.7 10.0 8.0
Europefibre n.a. n.a. n.a. n.a. n.a. n.a.manufactures 14.1 15.0 11.8 10.0 11.9 12.7Total
Other countries 2/fibre n.a. n.a. n.a. n.a. n.a. n.a.cordage 13.9 14.1 13.6 12.1 11.8 13.1Total
WORLDFibre (from major exporters) 92.4 90.4 63.0 60.7 70.3 83.8Manufactures 97.4 90.3 95.4 81.5 79.7 88.4Total 189.8 180.7 158.4 142.2 150.1 172.2
( . . . . . . . . . . . . . . . . . . . . . thousand tonnes . . . . . . . . . . . . . . . . . . . . . . . . )

- 36 -
Table 26 - Sisal: Prices of representative grades, 2005-2012 1/
Brazil3L UG Indicative Price UG No.3 Indicative Price No.3
( . . . . . . . . . . . . . . . . . . . . . . . USD per tonne c.i.f. European ports . . . . . . . . . . . . . . . . . . . . )
Annual average2005 1 001 901 840 - 900 763 680 - 7402006 1 049 948 840 - 900 785 680 - 740From 2007 FOB prices2007 1 023 958 800 - 1000 656 620 - 6802008 1 159 1 087 800 - 1000 726 620 - 6802009 823 773 800 - 1000 676 620 - 6802010 1 111 1 010 800 - 1000 689 700 - 800
( . . . . . . . . . . . . . . . . . . . . . . USD per tonne f.o.b. European ports . . . . . . . . . . . . . . . . . . . . . . )
YEAR 2011 avg. 1 435 1 327 791January 1 250 1 150 800 - 1000 735 700 - 800February 1 270 1 170 800 - 1000 714 700 - 800March 1 300 1 200 800 - 1000 711 700 - 800April 1 300 1 200 800 - 1000 750 700 - 800May 1 300 1 200 800 - 1000 743 700 - 800June 1 350 1 250 800 - 1000 769 700 - 800July 1 550 1 450 800 - 1000 818 700 - 800August 1 550 1 450 800 - 1000 794 700 - 800September 1 550 1 450 800 - 1000 848 700 - 800October 1 600 1 450 800 - 1000 845 700 - 800November 1 600 1 475 800 - 1000 860 700 - 800December 1 600 1 475 800 - 1000 902 700 - 800
YEAR 2012 avg. 1 550 1 444 903January 1 600 1 475 900 - 1200 880 750 - 850February 1 600 1 475 900 - 1200 916 750 - 850M h 1 450 1 375 900 1200 907 750 850
East African
March 1 450 1 375 900 - 1200 907 750 - 850April 1 500 1 400 900 - 1200 903 750 - 850May 1 550 1 450 900 - 1200 907 750 - 850June 1 550 1 450 900 - 1200July 1 600 1 480 900 - 1200AugustSeptemberOctoberNovemberDecember
Table 27 - Estimated market prices for agricultural twines made from sisal/henequen and polypropylene
2005 2006 2007 2008 2009 2010 2011 2012
Sisal Baler Twine
Western Europe 16.75-18.25 19.00-20.00 24.22 24.00-26.00 25.00-27.00 26.81 United States 22.00-23.00 25.00-27.00 20.50-22.50 22.00-23.00 24.25-25.25 24.00-25.00 24.00-25.00
Indicative Price 23.00 23.00 24.00 24.00 24.00 25.00 25.00 29.00
PP Baler Twine
Western Europe 17.00-18.00 17.50-18.50 United States 22.27-26.01 23.00-24.00 24.00-25.00 25.00-33.00 30.00-33.00 28.25-34.00 28.25-33.50
( c.i.f. USD / Bale of 40 lbs or 18 kg) ( f.o.b. USD / Bale of 18 kg )
( . . . . . . . . . . . . . . . . . . . . c.i.f. USD / Bale of 10 kg . . . . . . . . . . . . . . . . . . . . )

- 37 -
Table 28 - Sisal : Imports of raw fibre
2001 2002 2003 2004 2005 2006
WORLD 77.5 83.3 100.2 101.0 89.1 92.6
DEVELOPED 45.1 36.3 39.1 38.8 25.8 23.2
North America 0.8 0.7 0.5 0.4 0.6 0.3 Canada 0.5 0.5 0.3 0.2 0.4 0.2 U.S.A. 0.3 0.2 0.1 0.2 0.2 0.1 Europe 39.3 31.4 34.5 34.6 21.9 19.5 EU (27) 39.3 31.4 34.5 34.6 21.9 19.5 EU (15) 38.0 30.4 33.2 33.2 20.1 17.1 Austria 0.9 0.6 0.6 0.6 0.7 0.3 Belgium-Lux 4.2 3.6 3.6 3.3 3.4 3.0 Denmark 0.0 0.0 0.0 0.0 0.0 0.0 Finland 0.0 0.1 0.1 0.0 0.0 0.0 France 0.6 0.5 0.6 0.5 0.5 0.3 Germany 0.9 1.4 1.4 0.8 0.7 0.6 Greece 0.1 0.0 0.1 0.1 0.1 0.2 Ireland 0.0 0.0 0.0 0.0 0.0 0.0 Italy 0.8 0.6 0.6 0.6 0.5 0.7 Netherlands 1.1 1.0 2.0 1.9 1.4 0.5 Portugal 18.9 11.2 12.9 11.9 2.4 3.4 Spain 9.7 10.9 11.1 13.5 10.3 7.9 Sweden 0.2 0.0 0.2 0.1 0.2 0.1 U.K. 0.6 0.4 0.1 0.1 0.0 0.1 Other EU 1.2 1.0 1.3 1.4 1.7 2.4
Other Europe 0.1 0.0 0.0 0.0 0.0 0.1
Former USSR 1.2 1.2 1.2 1.2 1.2 1.3
Oceania 0.7 0.8 0.4 0.5 0.5 0.4 Australia 0.2 0.1 0.1 0.0 0.0 0.0 New Zealand 0.5 0.7 0.3 0.5 0.5 0.3 Other Developed 3.0 2.2 2.6 2.0 1.6 1.7 Japan 1.5 1.3 1.3 0.7 0.6 0.5 South Africa 1.5 0.9 1.3 1.3 1.1 1.2
DEVELOPING 32.4 47.0 61.1 62.2 63.3 69.4 Africa 3.4 3.5 4.5 4.9 4.8 5.6 Morocco 2.2 2.6 3.2 3.2 3.6 3.7 Latin America 16.8 18.5 17.5 17.1 15.1 10.7 Chile 0.8 1.5 1.7 1.7 1.3 1.4 El Salvador 1.3 0.3 0.3 1.0 1.0 1.0 Mexico 12.2 12.0 11.8 11.9 11.3 7.1 Near East 2.9 3.3 3.8 4.7 5.4 5.4 Egypt 0.7 0.6 0.9 1.4 2.0 0.9 Saudi Arabia 1.7 2.1 2.4 2.4 2.9 1.8 Far East 9.3 21.7 35.4 35.5 38.0 47.7 China 6.6 18.2 31.6 31.2 34.1 43.2 India 0.8 1.1 1.1 1.6 1.8 2.0 Indonesia 0.7 1.3 1.2 1.5 1.0 1.1
( . . . . . . . . . . . . . . . . . . . . . . . . . thousand tonnes . . . . . . . . . . . . . . . . . . . . . . . . . . . )

- 38 -
Table 29 - Sisal : Imports of manufactures
2006 2007 2008 2009 2010 2011
WORLD 91.1 80.9 87.4 80.3 76.8 77.3
DEVELOPED 77.4 66.4 71.1 62.8 53.7 51.7 North America 54.5 43.5 50.2 45.5 35.5 34.0 Canada 4.7 4.3 4.1 3.0 2.6 2.8 U.S.A. 49.8 39.2 46.0 42.5 32.9 31.2 Europe 20.9 20.5 18.5 15.0 16.2 15.2 EU (27) 20.6 19.8 17.9 14.6 15.8 14.9 Austria 0.3 0.1 0.1 0.1 0.2 0.1 Belgium-Lux 3.4 4.8 4.1 2.4 3.0 2.9 Denmark 1.5 0.6 0.8 0.9 0.5 0.6 Finland 0.3 0.4 0.3 0.3 0.3 0.3 France 4.1 3.2 3.1 2.9 3.0 3.1 Germany 4.0 4.2 3.2 2.8 3.0 2.8 Greece 0.2 0.3 0.3 0.2 0.1 0.2 Ireland 0.3 0.2 0.2 0.1 0.1 0.0 Italy 1.3 1.1 1.0 0.9 1.1 1.1 Netherlands 1.2 1.1 1.2 0.8 0.9 0.6 Portugal 0.5 0.5 1.2 0.7 0.9 0.9 Spain 0.5 0.7 0.5 0.3 0.4 0.4 Sweden 0.3 0.3 0.4 0.3 0.4 0.3 U.K. 1.5 1.5 0.8 0.7 1.1 0.7 Other EU 1.1 0.9 0.9 1.3 0.8 1.0 Other Europe 0.4 0.7 0.6 0.4 0.4 0.3
Former USSR 0.0 0.1 0.0 0.0 0.1 0.1 Oceania 0.6 0.4 0.6 0.5 0.6 0.7 Australia 0.5 0.4 0.5 0.4 0.4 0.5 New Zealand 0.1 0.0 0.1 0.2 0.2 0.2 Other Developed 1.4 1.9 1.8 1.7 1.4 1.7 Japan 0.9 1.3 1.6 1.3 1.0 1.3 South Africa 0.5 0.6 0.3 0.5 0.4 0.4
DEVELOPING 13.7 14.5 16.3 17.5 23.0 25.6 Africa 1.7 1.3 1.7 5.6 7.1 7.4 Latin America and Caribbean 1.4 1.2 1.5 1.7 1.9 4.1 Argentina 0.2 0.2 0.2 0.1 0.2 0.1 Bahamas 0.8 0.5 1.0 1.4 1.5 3.7 El Salvador 0.2 0.2 0.1 0.1 0.1 0.1 Near East 1.3 1.9 1.3 1.2 2.5 2.5 Egypt 0.1 0.2 0.2 0.6 0.3 0.3 Iran 0.0 0.1 0.0 0.0 0.1 0.0 Jordan 0.2 0.3 0.1 0.1 0.1 0.1 Saudi Arabia 1.0 1.3 1.0 0.5 2.1 2.1 Far East 4.2 5.2 6.8 6.0 6.2 5.5 China 0.4 0.3 0.3 0.2 0.2 0.1 Indonesia 0.3 0.8 0.9 0.9 0.8 0.9 Thailand 1.0 0.9 0.9 0.9 1.0 0.7 VietNam 1.3 2.0 1.9 1.3 2.0 2.0 Other 5.0 5.0 5.0 3.0 5.3 6.0
( . . . . . . . . . . . . . . . . . . . . . . . . . thousand tonnes . . . . . . . . . . . . . . . . . . . . . . . . )

- 39 -
Table 30 - Production of abaca
2006 2007 2008 2009 2010 2011
Ecuador 10.4 10.1 12.0 10.4 10.2 9.6 Philippines 66.5 60.7 77.4 54.6 57.2 73.3 Other countries 2.0 2.0 1.9 1.9 1.8 2.0
Total Above Countries 78.8 72.8 91.3 66.9 69.2 84.8
Table 31 - Abaca: Exports of fibre and manufactures from producing countries
2006 2007 2008 2009 2010 2011
EcuadorFibre 10.4 10.1 12.0 10.4 10.2 9.6Cordage 1/ 0.0 0.0 0.0 0.0 0.0 0.0Total 10.4 10.1 12.0 10.4 10.2 9.6
PhilippinesFibre 12.9 13.7 13.4 7.4 11.3 9.8Cordage 1/ 8.3 9.9 7.5 5.3 7.0 7.5Pulp 1/ 22.5 18.3 18.1 12.0 20.9 29.8Other 1/ 3.3 2.4 1.7 1.3 1.6 1.4Total 47.0 44.2 40.7 26.1 40.8 48.5
TOTAL EXPORTS 57.3 54.3 52.6 36.4 50.9 58.1
Total Exports in Fibre equivalent Fibre 23.2 23.8 25.4 17.8 21.5 19.4Cordage 2/ 8.8 10.4 7.9 5.6 7.3 7.9Pulp 2/ 45.1 36.5 36.2 24.1 41.8 59.6Other 2/ 3.6 2.7 1.9 1.4 1.8 1.5TOTAL 80.7 73.4 71.3 48.9 72.3 88.5
Of which: Philippines 70.3 63.3 59.4 38.5 62.2 78.9 Ecuador 10.4 10.1 12.0 10.4 10.2 9.6
( . . . . . . . . . . . . . . . . . . . . . . . . . thousand tonnes . . . . . . . . . . . . . . . . . . . . . . . )
( . . . . . . . . . . . . . . . . . . . . . . . . . thousand tonnes . . . . . . . . . . . . . . . . . . . . . . . )

- 40 -
Table 32 - Abaca: Prices of representative grades, 2005-2012 1/
PHILIPPINES ECUADORAverage
Hand-cleaned non-Davao exportunit value
S2 G JK Indicator Price 2/ (all grades)
f.o.b. Manila port f.o.b. c.i.f. f.o.b. USD per 125 Kg. bale USD / bale USD / tonne USD / bale
Annual average2005 153.8 141.8 125.7 140.4 1 323.1 107.52006 166.9 150.8 147.3 155.0 1 440.2 101.42007 193.4 169.4 159.0 173.9 1 591.6 107.32008 267.6 243.3 225.7 245.5 2 164.2 117.72009 201.6 181.3 163.7 182.2 1 657.6 155.62010 193.7 176.8 154.8 175.1 1 600.7 148.7
2011 average 211.9 192.1 170.2 191.4 1 731.1 168.8
January 202.0 185.0 162.0 183.0 1 664.0 156.1February 202.0 185.0 162.0 183.0 1 664.0 150.0March 202.0 185.0 162.0 183.0 1 664.0 155.5April 204.0 187.0 163.0 184.7 1 677.3 162.0May 207.0 189.0 163.0 186.3 1 690.7 163.1June 211.0 192.0 163.0 188.7 1 709.3 172.0July 215.0 197.0 171.0 194.3 1 754.7 170.6August 220.0 197.0 177.0 198.0 1 784.0 170.4September 220.0 197.0 180.0 199.0 1 792.0 176.8October 220.0 197.0 181.0 199.3 1 794.7 178.9November 220.0 197.0 180.0 199.0 1 792.0 182.3December 220.0 197.0 178.0 198.3 1 786.7 187.9
2012 average 220.0 197.0 174.4 197.1 1 777.1
January 220.0 197.0 177.0 198.0 1 784.0February 220.0 197.0 174.0 197.0 1 776.0March 220.0 197.0 174.0 197.0 1 776.0April 220.0 197.0 174.0 197.0 1 776.0May 220.0 197.0 174.0 197.0 1 776.0June 220.0 197.0 174.0 197.0 1 776.0July 220.0 197.0 174.0 197.0 1 776.0AugustSeptemberOctoberNovemberDecember

- 41 -
Table 33 - Abaca : Imports of fibre and manufactures
2006 2007 2008 2009 2010 2011
FIBRE
WORLD 27.3 26.3 26.6 20.2 25.3 23.4
DEVELOPED 25.0 23.9 24.2 17.6 22.1 20.6
North America 0.9 0.0 0.0 0.0 0.0 0.0 Canada 0.1 0.0 0.0 0.0 0.0 0.0 U.S.A. 0.8 0.0 0.0 0.0 0.0 0.0 Europe 15.3 16.2 17.1 13.1 15.0 13.8 EU (27) 15.3 16.2 17.1 13.1 15.0 13.8
Other Developed 8.9 7.7 7.1 4.5 7.1 6.8 Japan 8.7 7.6 6.9 4.5 7.1 6.8
DEVELOPING 2.3 2.4 2.3 2.6 3.2 2.8
MANUFACTURES 1/
WORLD 36.5 30.5 29.3 20.9 31.4 41.0
DEVELOPED 30.8 24.3 22.8 15.5 25.9 33.2
North America 8.5 6.2 5.9 3.6 6.3 7.7 Canada 0.3 0.2 0.2 0.1 0.1 0.2 U.S.A. 8.3 5.9 5.8 3.4 6.2 7.5
Europe 17.9 13.7 12.5 8.6 14.8 20.4 EU (27) 17.9 13.7 12.5 8.6 14.8 20.4
Other developed 4.3 4.5 4.3 3.4 4.8 5.1Japan 4.1 4.2 4.0 3.1 4.5 4.5
DEVELOPING 5.7 6.2 6.5 5.4 5.5 7.7
Far East 5.0 5.4 4.3 4.0 4.9 6.4
1/ - Includes Pulp
( . . . . . . . . . . . . . . . . . . . . thousand tonnes . . . . . . . . . . . . . . . . . . . . . . . . )

- 42 -
Table 34 - Production of coir fibre
2006 2007 2008 2009 2010 2011
Brown fibre India * 314.0 335.0 340.8 394.0 415.5 425.0
Sri Lanka * 80.4 100.1 101.6 169.6 149.8 Thailand 41.1 53.7 55.5 64.6 63.7 49.9
VietNam 91.1 72.2 74.7 91.1 103.0 97.6
Other countries 8.9 11.0 11.0 9.0 9.0 9.0
Total Above Countries 535.5 572.1 583.6 728.3 741.0
White fibre India 96.0 95.0 97.0 97.0 100.0 100.0
* India and Sri Lanka production data does not include coir pith
Table 35 - Production of coir yarn.
2006 2007 2008 2009 2010 2011
India 270.0 295.0 290.0 292.9 296.5 299.5 Sri Lanka 1/ 5.6 6.0 6.4 6.5 6.5 Thailand 1.0 1.0 2.0 2.0 2.0 2.0
Total Above Countries 276.6 302.0 298.4 301.4 305.0
(provisional)
(provisional)
( . . . . . . . . . . . . . . . . . . . . thousand tonnes . . . . . . . . . . . . . . . . . . . . . . . . )
( . . . . . . . . . . . . . . . . . . . . thousand tonnes . . . . . . . . . . . . . . . . . . . . . . . . )

- 43 -
Table 36 - Exports of coir fibre
2006 2007 2008 2009 2010 2011
DEVELOPED 9.1 8.2 13.2 9.6 10.5 11.0
EU (27) 7.1 6.6 8.8 8.8 9.8 10.2
DEVELOPING 268.0 337.5 348.0 502.6 603.9 652.8
Far East 265.5 335.0 345.6 499.6 599.0 648.6
Sri Lanka 68.3 84.8 86.1 143.7 126.9 114.4 of which: bristle fibre 4.4 7.7 5.2 8.3 6.3 9.5
twisted fibre 24.6 22.9 28.9 51.5 36.9 26.8mattress fibre 39.3 54.3 52.1 83.9 83.7 78.2
China 0.2 0.2 1.0 1.0 1.1 1.0China,HongKong 0.1 0.1 0.1 0.1 0.2 0.1India* 64.8 97.4 103.5 158.7 259.5 321.0Indonesia 5.2 22.4 16.7 27.8 31.8 46.9Malaysia 4.4 7.3 13.2 22.4 22.6 11.9Philippines 5.4 12.4 10.8 9.2 10.2 9.2Thailand 34.2 44.7 46.2 53.8 53.1 55.0Singapore 0.1 0.1 0.1 0.1 0.1 0.4VietNam 82.8 65.7 67.9 82.9 93.6 88.8
Africa 0.4 0.4 0.3 0.3 0.3 0.3
Near East 0.1 0.1 0.1 0.1 0.1 0.1
Latin America 2.0 2.0 2.0 2.6 4.5 3.8
Mexico 1.0 1.0 1.0 1.3 3.2 2.6 Venezuela 0.5 0.5 0.5 1.0 1.0 1.0
Total Above Countries 277.1 345.7 361.3 512.2 614.4 663.9
Sri Lanka coir pith 98.6 97.0 105.1 82.8 119.5 131.9
Total including coir pith 375.7 442.7 466.4 595.0 734.0 795.8
* Includes Coir Pith
( . . . . . . . . . . . . . . . . . . . . . . . thousand tonnes . . . . . . . . . . . . . . . . . . . . . . . . . )

- 44 -
Table 37 - Exports of coir yarn from producing countries
2006 2007 2008 2009 2010 2011
DEVELOPED 1.5 4.1 1.7 1.0 0.8 0.9EU (27) 1.5 4.1 1.7 1.0 0.8 0.9
DEVELOPING 14.6 13.7 12.8 14.0 12.7 12.9 India 9.8 8.6 6.2 5.6 5.3 5.6 Sri Lanka 1/ 4.7 5.1 5.4 7.3 6.2 6.2
Others 0.0 0.0 1.1 1.1 1.1 1.1
Total Above Countries 16.1 17.8 14.4 15.0 13.5 13.7
Table 38 - Exports of coir mats, mattings and rugs from principal exporting countries 1/
2006 2007 2008 2009 2010 2011
DEVELOPED 3.4 8.7 3.6 2.5 4.8 4.3
EU (27) 3.4 8.7 3.6 2.5 4.8 4.3 Austria 0.4 0.9 0.3 0.1 0.1 0.1 Belgium/Lux 0.1 0.2 0.0 0.0 0.0 0.0 Denmark 0.1 0.1 0.0 0.1 0.1 0.1 France 0.0 0.0 0.0 0.0 0.0 0.0 Germany 1.2 4.2 1.7 1.0 0.5 0.3 Italy 0.2 0.1 0.0 0.0 0.3 0.3 Netherlands 0.5 1.0 0.3 0.5 3.1 2.8 Portugal 0.1 0.0 0.0 0.0 0.1 0.0 Spain 0.0 0.0 0.2 0.3 0.1 0.1 Sweden 0.5 1.1 0.3 0.1 0.1 0.1 United Kingdom 0.3 0.9 0.5 0.3 0.3 0.3 Other EU 0.1 0.2 0.1 0.1 0.2 0.1
DEVELOPING 64.0 63.6 55.9 50.9 49.6 48.9India 2/ 50.0 51.0 45.8 41.5 37.7 35.6Sri Lanka 2/ 9.1 7.2 4.8 4.1 6.6 7.4China 0.4 0.3 0.3 0.3 0.3 0.3Other 4.5 5.0 5.0 5.0 5.0 5.6
.Total Above Countries 67.5 72.2 59.5 53.5 54.4 53.2
2/ - Includes Coir Geo Fabrics
( . . . . . . . . . . . . . . . . . . . . . . . thousand tonnes . . . . . . . . . . . . . . . . . . . . . . . . . )
( . . . . . . . . . . . . . . . . . . . . . . . thousand tonnes . . . . . . . . . . . . . . . . . . . . . . . . . )

- 45 -
Table 39 - Sri Lanka: Prices of coir fibres and yarn
SRI LANKAExport Prices FOB Colombo
Mattress Fibre Bristle Fibre Coir Yarn Coir Twine Coir Fibre Pith
Annual average2005 197 451 663 892 2382006 212 516 613 916 2542007 253 441 576 1 027 2592008 280 481 757 975 2912009 264 499 731 1 035 253
2010 average 309 536 716 961 272January 293 507 780 1 064 256February 309 518 581 1 048 231March 284 548 705 1 048 233April 249 549 546 1 080 252May 306 610 764 1 028 276June 309 484 653 723 283July 305 462 583 881 281August 306 540 856 840 285September 312 638 705 1 032 272October 348 549 762 1 096 310November 342 561 812 743 295December 345 460 848 949 292
2011 average 392 605 793 1 058 298January 348 528 791 998 281February 340 552 773 791 296March 379 480 694 985 274April 401 580 851 939 261May 399 532 713 707 311June 410 536 714 1 332 310July 401 598 752 964 308August 409 651 810 1 030 306September 423 777 838 1 163 305October 400 633 863 1 181 332November 386 671 762 1 143 293December 403 726 950 1 461 296
( . . . . . . . . . . . . . . . . . . . . . . . . . . . . . . . . . USD / tonne. . . . . . . . . . . . . . . . . . . . . . . . . . . . . . . . . . )
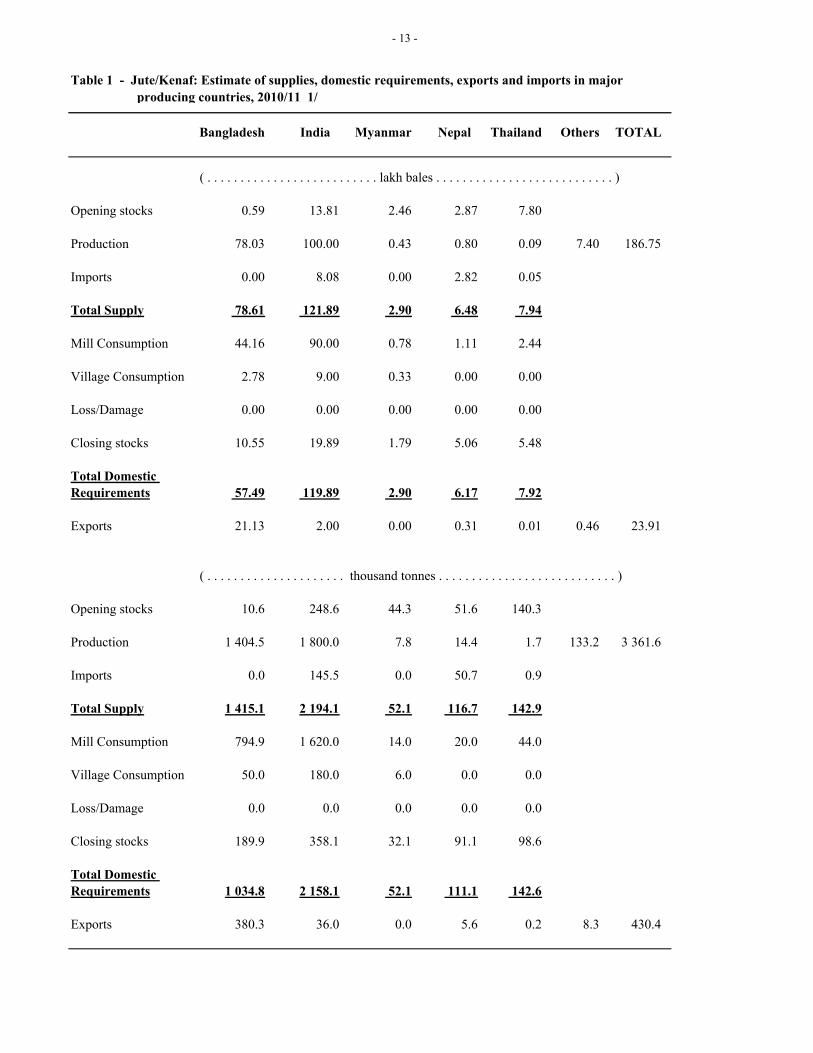
- 46 -
Table 40 - Imports of coir fibre
2006 2007 2008 2009 2010 2011
DEVELOPED 122.7 143.8 154.4 156.2 170.0 210.0
North America 30.2 31.1 32.0 41.0 58.0 85.2Canada 6.0 8.9 9.2 7.7 5.7 8.6USA 24.3 22.2 22.8 33.3 52.3 76.6
Europe 83.2 102.8 113.2 107.0 101.1 113.6
EU (27) 81.2 100.7 111.0 104.6 97.1 109.6Other Europe 2.0 2.1 2.2 2.4 4.0 4.0
Oceania 2.7 2.5 3.3 3.5 4.1 4.3Australia 1.8 1.4 1.9 2.0 2.4 2.5New Zealand 0.9 1.0 1.4 1.5 1.8 1.8
Other Developed 6.5 7.4 5.9 4.6 6.8 6.8Japan 4.3 4.8 3.4 2.2 3.5 3.3South Africa 2.2 2.7 2.5 2.4 3.3 3.5
DEVELOPING 194.0 281.8 254.0 396.7 430.7 470.9China 187.8 273.9 249.2 385.1 419.4 454.0Pakistan 1.0 0.7 1.4 3.6 4.8 11.4Saudi Arabia 1.4 3.0 1.4 4.0 3.1 3.1Malaysia 1.4 1.7 0.3 1.9 2.0 1.1Others 2.5 2.4 1.7 2.1 1.5 1.3
Total Above Countries 316.7 425.6 408.4 552.8 600.7 680.9
( . . . . . . . . . . . . . . . . . . . thousand tonnes . . . . . . . . . . . . . . . . . . . . . . . . )

- 47 -
Table 41 - Imports of coir yarn into principal importing countries
2006 2007 2008 2009 2010 2011
DEVELOPED 13.3 12.4 12.6 13.6 11.5 14.4
North America 4.7 3.8 4.9 5.5 3.0 2.6USA 4.7 3.8 4.9 5.5 3.0 2.6
Europe 8.1 7.8 6.4 6.8 7.1 10.0
EU (27) 7.9 7.5 5.2 5.1 5.5 5.3Belgium 0.7 0.9 1.4 0.8 0.6 0.7France 1.0 1.0 0.5 0.7 0.6 0.5Germany 1.3 1.3 0.6 0.3 0.3 0.4Italy 1.4 1.2 1.0 0.9 1.4 1.0Netherlands 2.4 1.8 1.0 1.4 1.7 1.9Portugal 0.4 0.4 0.0 0.1 0.1 0.0Spain 0.2 0.4 0.3 0.5 0.5 0.5United Kingdom 0.1 0.2 0.2 0.2 0.2 0.2
Other EU 0.1 0.2 0.0 0.1 0.0 0.1Other Developed 0.5 0.8 1.3 1.4 1.5 1.7
Australia 0.1 0.1 0.2 0.2 0.1 0.2Japan 0.3 0.7 1.2 1.2 1.4 1.6
DEVELOPING 1.8 2.2 2.1 1.9 1.6 1.8
Korea Rep 1.0 1.2 1.2 1.0 1.0 1.0Morocco 0.1 0.2 0.2 0.2 0.0 0.0Pakistan 0.6 0.6 0.5 0.6 0.6 0.4Saudi Arabia 0.0 0.1 0.1 0.0 0.0 0.0Turkey 0.0 0.1 0.0 0.0 0.0 0.0Other developing 0.0 0.1 0.0 0.1 0.0 0.3
Total Above Countries 15.2 14.6 14.7 15.5 13.1 16.2
( . . . . . . . . . . . . . . . . . . . thousand tonnes . . . . . . . . . . . . . . . . . . . . . . . . )

- 48 -
Table 42 - Imports of coir mats, matting and rugs into principal importing countries 1/
2006 2007 2008 2009 2010 2011
DEVELOPED 42.9 48.2 43.7 41.8 38.7 34.4
Europe 24.1 28.8 27.0 25.8 20.6 20.8
EU (27) 23.2 27.6 26.3 25.2 20.0 20.1 Austria 0.4 0.6 0.5 0.4 0.4 0.3 Belgium/Lux 0.4 0.3 0.6 1.2 0.7 0.1 Denmark 0.4 0.3 0.3 0.5 0.4 0.5 Finland 0.1 0.1 0.1 0.0 0.1 0.1 France 0.9 1.1 2.7 3.2 2.6 2.3 Germany 5.1 6.4 5.7 4.2 1.8 1.9 Greece 0.3 1.9 0.3 0.3 0.3 0.2 Ireland 0.0 0.0 0.0 0.0 0.0 0.1 Italy 3.9 3.9 3.3 3.7 3.6 3.5 Netherlands 1.3 1.2 1.4 1.3 1.6 1.7 Portugal 0.1 0.1 0.2 0.2 0.3 0.4 Spain 2.1 2.5 2.0 1.8 1.9 1.8 Sweden 0.9 0.9 0.7 0.4 0.2 0.4 United Kingdom 6.5 6.7 6.9 5.3 4.6 5.4 Other EU 0.7 1.7 1.5 2.9 1.5 1.6
Other Europe 0.9 1.2 0.7 0.6 0.6 0.7
North America 16.8 16.0 14.0 13.6 15.6 10.3 United States 15.3 13.7 11.7 11.9 13.6 8.6 Canada 1.5 2.3 2.3 1.7 2.0 1.7
Other Developed 2.1 3.4 2.8 2.4 2.5 3.3 Australia 0.9 1.9 1.4 1.4 1.2 2.1 Japan 0.5 0.7 0.7 0.5 0.6 0.4
DEVELOPING 2.7 2.9 2.9 2.7 2.7 2.8
Total Above Countries 45.6 51.1 46.6 44.5 41.4 37.2
( . . . . . . . . . . . . . . . . . . . thousand tonnes . . . . . . . . . . . . . . . . . . . . . . . . )
- 49 -
الحواشى
- 1الجدول )1( .)حزيران/يونيو-تموز/يوليو(السنة المحصولية
- 2الجدول )1( .)حزيران/يونيو-تموز/يوليو(السنة المحصولية
ة "الجوت السائب اف الجوت البيضاء والبني ألرز "ألي ) الخشن(، أسعار السوق الحرة ل).امآيلوغر37.324الماوند وحدة وزن تساوى(
- 3الجدول )1(
آلكتا”TD5“جوت )2(
عير وفمبر) الخشن(األرز الش ى ن انيتشرين /حت زين ( 1995 الث يمتوسط مرآ ال ف البنغ ).األصناف الممتازة( األرز الشعير1998الثانيآانون/، اعتبارا من يناير)الغربية
)3(
انون األول /اينة حتى ديسمبر خام أبيض بنغالديش فوب شيتاجونغ تشالنا، الدفع بعد المع آ .، فوب مونغال 1997الثانيآانون/، اعتبارا من يناير1996
- 4الجدول )1(
)2( أنشأتها الجماعة الحكومية الدولية المختصة بالجوت والتيل واأللياف المماثلة
- 5الجدول )1( .فوب سعر آلكتا ويشمل رسوم الميناء والجمارك
- 8الجدول )1( .)حزيران/يونيو-تموز/يوليو(السنة المحصولية
- 9الجدول )1( .)حزيران/يونيو-تموز/يوليو(السنة المحصولية
على أساس السنة التقويمية - 10الجدول )1(
.على أساس السنة التقويمية - 11الجدول )1(
.جميع األحجام محسوبة بوزن المنتج )2(
.ألقل أهميةويشمل بعض البنود األخرى ا - 12الجدول )1(
.ويشمل بعض البنود األخرى األقل أهمية - 13الجدول )1(
)2( )حزيران/يونيو–تموز/يوليو(مخزونات نهاية الموسم
ى درجة نغالديش البن ) D(تشير األرقام الى متوسط األسعار ربع السنوية أللياف جوت ب فوب مونغال
.ليبروبيلينآنسب مئوية من منتجات البو
-17 الجدول )1(
نوية لغزل الجوت ع الس وليبروبيلين 413تشير األرقام الى متوسط األسعار رب ولغزل الب .2250دنيرة
-18 الجدول )1(
وت اس الج نوية ألآي ع الس عار رب ط األس ى متوس ام ال ير األرق توردة ”7.5oz/40تش المس - 19الجدول )1( توردةالمسPP 70gr/m2مئوية من أآياس الجوتةآنسب
- 20الجدول )1( .ويشمل بعض البنود األخرى األقل أهمية
- 21الجدول )1( .ويشمل بعض البنود األخرى األقل أهمية
- 22الجدول )1( .المعادل من األلياف
ق على أساس السنة التقويمية لجميع البلدان، باستثناء بنغالديش والهند واستراليا حيث تتعل يانات بالسنة المحصولية التي تبدأ في العام المذآور الب
)2(
- 24الجدول )1( يشمل الجمهورية الدومينيكية وغواتيماال وهندوراس ونيكاراغوا )2( األرجنتين وشيلى وجنوب أفريقيا: تقديرات
لفادور ) الكابويا(وآوستاريكا ) اوالكار(تقديرات البرازيل ا (والس ا ) الليتون الموز ( وإثيوبي )الصبار(ورينيو ) األغاف(والفلبين)الصبار(وموريشيوس)والدوم
)3(
)4( باستثناء األباآا وألياف جوز الهند - 25الجدول )1( تشمل األلياف نسالة الكتان
- 50 -
)2( وجنوب أفريقيا وفنزويال روالسلفادو وآوبا آوستاريكابما في ذلك - 26الجدول )1( ء الرسوم لحساب المشترينمتوسط األسعار األسبوعية باستثنا
- 31الجدول )1( وزن المنتج )2( معادل األلياف
- 32الجدول )1( متوسط األسعار األسبوعية باستثناء الرسوم لحساب المشترينادل الطن c.i.fمع ن /ب ار م ب اعتب بحت تحس ي أص ارية الت عار اإلش ن األس دوالر م
فوبعلى أساس البالة1/1/1982)2(
- 35الجدول )1( تشمل الخيوط - 37الجدول )1( تشمل الخيوط - 38الجدول )1( وزن المنتج - 42الجدول )1( وزن المنتج

- 51 -
注 释
表 1- 1/ 作物年度(7月/6月)
表 2- 1/ 作物年度(7月/6月)
表 3- 1/ 散 装 黄 麻 : “ 白 色 和 托 萨 ” 黄 麻 混 合 价 格 , 大 米 ( 糙 米 ) 公 开 的 市 场 价 格(1maund=37.324公斤) 。
2/
3/
加尔各答“ TD5” 级黄麻。
稻谷(粗)截至1995年11月,(西孟加拉邦两个中心的平均价格)。从1998年1月起稻谷(精)。
表 4- 1/ 孟加拉国D级和C级白色黄麻,96年12月前吉大港-查尔纳离岸价格,见票即付。1997
年1月起蒙格拉离岸价。
2/ 由粮农组织政府间黄麻、槿麻和同类纤维小组确定。
表 5- 1/ 加尔各答离岸价格,包括港口费和关税。
表 8- 1/ 作物年度(7月/6月)
表 9- 1/ 作物年度(7月/6月)
表 10- 1/ 按日历年度计算。
表 11- 1/ 按日历年度计算。
2/ 总量以产品重量表示
表 12- 1/ 包括其他次要产品。
表 13- 1/
2/
包括其他次要产品。
期末库存量(7月/6月)。
表 17- 1/ 数字表示BWD级黄麻纤维蒙格拉离岸价季度平均价格相对聚丙烯价格的百分比。
表 18- 1/ 数字表示413进口特克斯黄麻纱和2250丹尼尔聚丙烯纱季度平均价格。
表 19- 1/ 数字表示7.5oz/40”进口黄麻麻袋季度平均价格相对70gr/m2进口聚丙烯袋价格的百分比。
表 20- 1/ 包括其它次要产品。
表 21- 1/ 包括其它次要产品。
表 22- 1/ 包括其它次要产品。
2/ 所有国家按日历年计算,不包括孟加拉国、印度和澳大利亚,它们的数据为所示年度开始的作物年度。
表 24- 1/ 包括多米尼加共和国、危地马拉、洪都拉斯和尼加拉瓜。
2/ 估计数:阿根廷、智利、南非。
3/ 估计数:巴西(卡罗阿叶纤维)、哥斯达黎加(卡布椰叶纤维)、萨尔瓦多(莱托纳纤维)、埃塞俄比亚(香蕉和姜果棕)、毛里求斯(芦荟)、菲律宾(龙舌兰)、留尼汪(芦荟)。
4/ 不包括蕉麻和椰壳纤维。
表 25- 1/ 纤维包括拖索。
2/ 包括哥斯达黎加、古巴、萨尔瓦多、南非和委内瑞拉。

- 52 -
表 26- 1/ 每周平均报价,不包括买方帐户附加费。
表 31- 1/ 产品重量
2/ 纤维当量
表 32- 1/ 每周平均报价,不包括买方帐户附加费。
2/ 相当于美元/吨指示价格的到岸价,从1982年1月1日起,表示为美元/包离岸价。
表 35- 1/ 包括麻线
表 37- 1/ 包括麻线
表 38- 1/ 产品重量
表 42- 1/ 产品重量

- 53 -
N O T E S
Table 1 - 1/ - Crop year (July/June)Table 2 - 1/ - Crop year (July/June)Table 3 - 1/ - Loose jute " White & Tossa combined ", Rice (Coarse)Open Market Price, (1 maund = 37.324 Kg.).
2/ - Jute " TD5 " at Calcutta. 3/ - Rice Paddy (Coarse) until Nov.1995 (average of two centres in West Bengal); From Jan. 1998 Rice Paddy (Fine Variety) .
Table 4 - 1/ - Bangladesh BWD and BWC f.o.b. Chittagong-Chalna, at sight until Dec. 96, from January 1997 f.o.b. Mongla.2/ - Established by FAO Intergovernmental Group (IGG) on Jute, Kenaf and Allied fibres.
Table 5 - 1/ - F.o.b. price Calcutta inclusive of port and customs charges.Table 8 - 1/ - Crop year (July/June)Table 9 - 1/ - Crop year (July/June)Table 10 - 1/ - Calendar year basis.Table 11 - 1/ - Calendar year basis.
2/ - All volumes are expressed in terms of product weight.Table 12 - 1/ - Includes other minor items. Table 13 - 1/ - Includes other minor items.
2/ - Stocks end of season (July/June)Table 17 - 1/ - Figures express quarterly average prices for jute fibre BWD F.o.b. Mongla as percentage
of those of polypropyleneTable 18 - 1/ - Figures express quarterly average prices for 413 Imported tex of jute yarn and 2250 denier of PP yarn.Table 19 - 1/ - Figures express quarterly average prices for imported sacks of Jute 7.5oz/40" as percentage
of those PP 70gr/m2 imported sacksTable 20 - 1/ - Includes other minor items. Table 21 - 1/ - Includes other minor items. Table 22 - 1/ - In fibre equivalent.
- 2/ - Calendar year basis for all countries excluding Bangladesh, India and Australia for which data relate to crop year beginning in the year shown.
Table 24 - 1/ - Includes Dominican Rep., Guatemala, Honduras and Nicaragua2/ - Estimates of : Argentina, Chile, South Africa3/ - Estimates of : Brazil (caroa), Costa Rica (cabuya), El Salvador (letona), Ethiopia (banana and doum), Mauritius (aloe), Philippines (maguey), Reunion (aloe)4/ - Excluding Abaca and Coir
- 54 -
N O T E S (cont'd)
Table 25 - 1/ - Fibre include tow2/ - Includes Costa Rica, Cuba, El Salvador, South Africa,Venezuela
Table 26 - 1/ - Average of weekly quotation, excluding surcharges for buyers' accountTable 31 - 1/ - Product weight
2/ - Fibre equivalentTable 32 - 1/ - Average of weekly quotation, excluding surcharges for buyers' account
2/ - C.i.f. equivalent in US$/tonne of the indicator price which, as of 1.1.1982, has been expressed in $/bale f.o.b.Table 35 - 1/ - Includes twineTable 37 - 1/ - Includes twineTable 38 - 1/ - Product weightTable 42 - 1/ - Product weight

- 55 -
N O T E S
Tableau 1 - 1/ - Campagne agricole (juillet/juin) Tableau 2 - 1/ - Campagne agricole (juillet/juin) Tableau 3 - 1/ - Jute en vrac "Mélange white & Tossa", Riz (grossier), ( 1 maund = 37,324 kg).
2/ - Jute "TD5" à Calcutta.3/ - Riz paddy, (moyenne de deux centres du Bengale occidental).
Tableau 4 - 1/ - Bangladesh BWD et BWC f.o.b. Chittagong-Chalna, à vue, jusq'à decembre 1996, de janvier 1997 f.o.b. Mongla.- 2/ - Prix fixé par le Groupe intergouvernemental sur le jute, le kénaf et les fibre apparentées.
Tableau 5 - 1/ - F.o.b. Calcutta, y compris droits portuaires et de douane. Tableau 8 - 1/ - Campagne agricole (juillet/juin) Tableau 9 - 1/ - Campagne agricole (juillet/juin) Tableau 10 - 1/ - Année civile.Tableau 11 - 1/ - Année civile.
2/ - Tous les volumes sont exprimées en poid produit.Tableau 12 - 1/ - Y compris d'autres produits peu importants.Tableau 13 - 1/ - Y compris d'autres produits peu importants.
2/ - Stocks en clôture de campagne (juillet/juin).
Tableau 17 - 1/ - Moyenne trimestrielle des prix de la fibre de jute BWD,f.o.b. Mongla en pourcentage de celle des prix du polypropylène.
Tableau 18 - 1/ - Moyenne trimestrielle des prix du fil de jute 413 Importeée tex en pourcentage de celle des prix du fil de PP 2250 denier.
Tableau 19 - 1/ - Moyenne trimestrielle des prix de sacs importés en jute 7,5onces/40" en pourcentage de ceux en PP 70g/m 2
Tableau 20 - 1/ - Y compris d'autres produits peu importants.Tableau 21 - 1/ - Y compris d'autres produits peu importants.Tableau 22 - 1/ - Equivalent fibre.
2/ - Année civile par tous les pays non compris Bangladesh, Inde et l'Australie pour lesquels les données portent sur la campagne agricole qui s'ouvre l'année indiquée.
Tableau 24 - 1/ - Y compris Dominican Rep., Guatemala, Honduras and Nicaragua2/ - Estimation de : Argentina, Chile, South Africa3/ - Estimation de: Brazil (caroa), Costa Rica (cabuya), El Salvador (letona), Ethiopia (banana et doum), Mauritius (aloe), Philippines (maguey), Reunion (aloe)4/ - Non compris l' abaca et les fibres de coco

- 56 -
N O T E S (cont'd)
Tableau 25 - 1/ - La fibre comprend l'étoupe2/ - Y compris Costa Rica, Cuba, El Salvador, South Africa,Venezuela
Tableau 26 - 1/ - Moyenne des cours hebdomadaires, non compris frais supplementaires au compte de l'acheteurTableau 31 - 1/ - Poids de produits
2/ - Equivalent de fibreTableau 32 - 1/ - Moyenne des cours hebdomadaires, non compris frais supplementaires au compte de l'acheteur
2/ - Equivalent c.a.f. en $/tonne du prix indicateur que, depuis 1.1.1982, est exprimé en $/balle f.o.b.Tableau 35 - 1/ - Y compris de ficelleTableau 37 - 1/ - Y compris de ficelleTableau 38 - 1/ - Poids de produitsTableau 42 - 1/ - Poids de produits

- 57 -
N O T A S
Cuadro 1 - 1/ - Año agrícola (julio/junio) Cuadro 2 - 1/ - Año agrícola (julio/junio) Cuadro 3 - 1/ - Yute suelto "Blanco y Tossa mezclados", Arroz (basto), (1 maund = 37,324 kg).
2/ - Jute "TD5" en Calcutta3/ - Arroz cáscara (promedio de los centros en Bengala Occidental). Desde Janero 1998 es Variedad fina
Cuadro 4 - 1/ - Bangladesh calidad BWD y BWC, f.o.b. Chittagong-Chalna, a la vista, hasta diciembre 1996, desde enero 1997 f.o.b. Mongla.2/ - Precio fijado por el Grupo Intergubernamental sobre el Yute, Kenaf y Fibras Afines
Cuadro 5 - 1/ - Calcutta f.o.b., incluidos gastos portuarios y de aduana.Cuadro 8 - 1/ - Año agrícola (julio/junio) Cuadro 9 - 1/ - Año agrícola (julio/junio) Cuadro 10 - 1/ - Año civil.Cuadro 11 - 1/ - Año civil.
2/ - Todos los volúmenes se expresan en términos de producto cargado.Cuadro 12 - 1/ - Se incluyen otros artículos menores.Cuadro 13 - 1/ - Se incluyen otros artículos menores.
2/ - Existencias al final de la temporada (julio/junio)Cuadro 17 - 1/ - Las cifras expresan los precios trimestrales medios de la fibra de yute BWD, f.o.b. Mongla
en porcentaje de los del polipropileno.Cuadro 18 - 1/ - Las cifras expresan los precios trimestrales medios del hilo de yute de 413 Importado tex en
porcentaje de los del hilo de PP de 2250 denier.Cuadro 19 - 1/ - Las cifras expresan los precios trimestrales medios de los sacos importados de yute 7,5oz/40" en
porcentaje de los sacos importados de PP 70g/m 2.Cuadro 20 - 1/ - Se incluyen otros artículos menores.Cuadro 21 - 1/ - Se incluyen otros artículos menores.Cuadro 22 - 1/ - Equivalente en fibra.
- 2/ - Año civil para todos los países, excluidos Bangladesh, India y Australia para los quales los datos corresponden al año agricola que comienza en el año indicado.
Cuadro 24 - 1/ - Se incluyen Dominican Rep., Guatemala, Honduras and Nicaragua.- 2/ - Estimación de : Argentina, Chile, South Africa.- 3/ - Estimación de: Brazil (caroa), Costa Rica (cabuya), El Salvador (letona), Ethiopia (banana y doum),
Mauritius (aloe), Philippines (maguey), Reunion (aloe).- 4/ - Excluyendo el abacá y el bonote.

- 58 -
N O T A S (cont'd)
Cuadro 25 - 1/ - La fibra encluye la estopa.2/ - Se incluyen Costa Rica, Cuba, El Salvador, South Africa,Venezuela.
Cuadro 26 - 1/ - Promedio de las cotizaciones semanales, excluidos recargos a cuenta del comprador.Cuadro 31 - 1/ - En peso del producto.
2/ - Equivalente en fibra.Cuadro 32 - 1/ - Promedio de las cotizaciones semanales, excluidos recargos a cuenta del comprador.
2/ - Equivalente c.i.f. en $/tonnes del precio indicador que, a partir del 1.1.1982, se ha expresado en $/bala, f.o.b.Cuadro 35 - 1/ - Se incluyen bramante.Cuadro 37 - 1/ - Se incluyen bramante.Cuadro 38 - 1/ - En peso del producto.Cuadro 42 - 1/ - En peso del producto.

- 59 -
GLOSSARY GLOSSAIRE GLOSARIO Jute, Kenaf, Sisal, Abaca, Coir Jute, Kénaf, Sisal, Abaca, Coco Yute, Kenaf, Sisal, Abaca, Bonote 1. Opening stocks 1. Stocks de report à l'ouverture 1. Existencias iniciales 2. Production 2. Production 2. Producción 3. Imports 3. Importations 3. Importaciones 4. Total Supply 4. Disponibilités totales 4. Disponibilidades totales 5. Mill Consumption 5. Consommation des filatures 5. Consumo fabril 6. Village Consumption 6. Consommation des villages 6. Consumo rural 7. Damage 7. Dégâts 7. Daños 8. Closing stocks 8. Stocks de reports en fin de campagne 8. Remanentes de cierre 9. Total Domestic requirements 9. Besoins intérieurs totaux 9. Necesidades internas totales 10. Exports 10. Exportations 10. Exportaciones 11. Carpet backing cloth 11. Tissu pour dossier de tapis 11. Entramado de fondo para alfombras 12. Fabrics 12. Tissu 12. Tejidos 13. Fibre 13. Fibre 13. Fibra 14. Gunny bags 14. Sacs en toile 14. Sacos de arpillera 15. Hessian 15. Hessian 15. Arpillera 16. Jute bag 16. Sac de jute 16. Saco de yute 17. Jute/Kenaf 17. Jute/Kénaf 17. Yute/Kenaf 18. Imported jute cloth 18. Toile de jute importée 18. Tela de yute importada 19. Imported jute bags 19. Sacs de jute importée 19. Sacos de yute importado 20. Mesta 20. Mesta (nom donné au kénaf en Inde et au Pakistan) 20. Mestas (kenaf) 21. Other sacking 21. Autres toiles à sacs 21. Otras telas de saco 22. Products 22. Produits dérivés du jute 22. Productos 23. Rice/sugar sacking 23. Toile à sacs pour riz/sucre 23. Tela de saco para arroz/azúcar 24. Sacking 24. Toile à sacs 24. Tela de saco 25. Sacking B-twills 25. Toile à sacs en croisé qualité B. 25. Tejidos cruzados calidad B. para tela de saco 26. Twine 26. Ficelle 26. Bramante 27. Yarn/twine 27. Fil/ficelle 27. Hilo/bramante 28. Yarn 28. Fil 28. Hilo 29. Area 29. Superficie 29. Superficie 30. Yield 30. Rendement 30. Rendimiento 31. Line Fibre 31. Filasse 31. Fibra linear 32. Tow 32. Étoupe 32. Estopa 33. Flume tow 33. Flume 33. Estopa de espadado 34. Agricultural twines 34. Ficelles agricoles 34. Bramantes para uso agricola 35. Ropes and cordage 35. Cordes et cables 35. Cuerdas y cables 36. Wall/Floor covering 36. Rêvetements de sol et muraux 36. Alfombra y esteras 37. Fine yarns 37. Fils fin 37. Hilos finos 38. Buffin cloth 38. Chiffon de polissage 38. Paños de pilir 39. Paper pulp 39. Pâte à papier 39. Pasta de papel 40. Geotextile 40. Géotextile 40. Geotextiles 41. Handicraft 41. Produits d'artisanat 41. Artesania 42. Mattress 42. Matelas 42. Colchón 43. Bristle 43. Brin 43. Cerda 44. Twisted 44. Torsées 44. Torcido 45. Carpets and rugs 45. Tapis et carpettes 45. Alfombras y mantas 46. Matting 46. Nattes et passages 46. Esteras
Polypropylene Polypropylène Polipropileno
47. Imported PP Woven 47. PP Importé tissu 47. Polipropileno PP importado tejido 48. Primary (carpet backing) 48. Primaire (dossier de tapis) 48. Entramado primario para alfombras 49. Secondary (carpet backing) 49. Secondaire (dossier de tapis) 49. Entramado secundario para alfombras 50. Standard PP (carpet backing) 50. Standard PP (dossier de tapis) 50. Polipropileno PP estándar para fondo de alfombra 51. Crude oil 51. Petrole brut 51. Petroleo crudo 52. Barrel 52. Baril 52. Barril 53. Naphtha 53. Naphte 53. Nafta 54. Spot price range 54. Fourchette cours du disponible 54. Escala de precios para entrega inmediata 55. Contract price 55. Prix contractuels 55. Precios contractuales 56. Raffia grade 56. Qualité raphia 56. Calidad rafia

GLOSSARY
���������� ����� �
������������
��
������������������������������������
��� ������ ������������ -1�� ���� ����� -2��� � �� ������� -3��� ����� ������������ -4��� ������ ����������� -5��� ������ � !"�������� -6��� ����� ��#���$����� -7��� ������ �����!%&���� -8��� !�"#�� ��'(������)������ -9�$��% �� ������ -10 ����&'()*� �*+�����,-�.�/ -11 ���+,*� ��+�� -12 ����+��,� 0��� -13 ����-./0� 1�2��3���4�����5�6� -14 ����12/*� 1�2� -15 ����./0� �7��5�6� -16 ����./34/� 8�������7� -17 ����� ./*� ����+�����.�/ -18 ����� ./0� ����+�����5�6� -19 $��4��/� 8���� -20 ���56/0*� 9!%��5�6� -21 ������ ���� -22 ���7839:;/0*� !#+����:�;���<=>?�5�6� -23 ���/0*� 5�6;���4�@����� -24 ���<=>?/0*� 8�"A���8 �����3���4������5�6;� -25 ���/��@� ��������B��2� -26 ���/A3/@� ��C����������B��2��� -17 ���/��A� ��C�� -28 ���B��C� ��+� -29 �$��D��� �'D -30 ����@+,� EF=?�0��� -31 ���E��F� G�#����'+��3��.�/ -32 ����G;EF� H��'I�.�/ -33 ����H;/@� ����J�!KKD;��HKKI����L�KK+���B��KK2���4����� -34
����I��F� �M�'C����=N����=N� -35 ����JB3&BKLM� ��O�;���G���7��P+6 -36 ����N��A� Q�����D -37 ����-��*� ��/����R�/� -38 ����O��P� Q������S� -39 �$��Q�?M� ��O�T����FD� -40 ����R�ST� � �� �)�CR� -41 ���)� ��*�?�.�/ -42 ����U��V� H=R%�U��/��V�0��� -43 ����WX@� ���� -44 ����&��'� W�'6���*X -45 ����Y?M� !�N���4�@����� -46
� � E'�Y�Z���=��
�
����� Z[\?M� ���������+�����K+����E��Y�ZK���=��[.�/\ -47
�����=&'()� ����;���*+�����,- -48 ����]=&'()� � ��A����*+�����,- -49 �$��^_`Z[\&'()� ���E��Y�ZK���=��–���]�4�[���,- �*+��\
-50
����a��b� U2��^ ��� -51 ���c� 8��!Y -52 ����deb� ��I� -53 ����fghi� �QF��!ON��Q�+����>X� -54 ����Wjhi� ]�/>����!>+�� -55 ����kl+,=� �>�I������ -56