Embed Size (px)
Citation preview

Chap. 9: Image Segmentation
Jen-Chang Liu, 2005

Motivation
Segmentation subdivides an image into its constituent regions or objects
Example: 生物細胞在影像序列中的追蹤

Basics of image segmentation
Input: image => Output: attributes Segmentation of nontrivial image is
one of the most difficult tasks in image processing Ex. Separate the sky, clouds, and
mountains

Two approaches
Based on intensity values discontinuity Partition an image based on abrupt
changes, such as edges
Based on intensity similarity in regions Partition an image into regions that are
similar according to some criteria

Outline Point, line detection Edge detection Thresholding Use of motion in
segmentation
Pixeldiscontinuity
Regionsimilarity

Detection of discontinuity
Three basic types of gray-level discontinuity Points, lines, and edges
Method: run a mask through the image
9
1iiizwR
Input: 3x3 region z1, z2 , … , z9
Output: z5 -> R
z1 z2 z3
z4 z5 z6
z7 z8z9
w1 w2 w3
w4 w5w6
w7 w8w9

Point detection
Point detection mask1. Mask operation over whole image2. Threshold: |R| T
渦輪葉片 X 光 thresholdingpoint mask

Problem with previous point detection
Assume single-pixel discontinuity Bigger region of point?
Assume simple background: homogeneous background Noisy environment ?
Selection of threshold T

Line detection
1. Line detection mask
2. Which orientation?
Thresholding: |Ri| |Rj| T
Ex. A thin line:0 0 01 2 10 0 0
Hori.R1=8
45o
R2=2-45o
R4=2Veri.R3=2

Example: single-line detection
Input: binary image absolute value after –45o mask |R| T
1Detect line that are one pixel thick
2 Isolated “line points”

Outline
Point, line detection Edge detection
Boundary with arbitrary shape Thresholding Use of motion in segmentation

Definition of edges?
Intuition of edge: set of connected pixels that line one the boundary between two regions
Model of digital edge

Two factors affects acquired edges
Blur 模糊化 Sampling rate, illumination condition
zoom
Noise 雜訊

Method of edge detection: derivatives
Edge detectionmethod
Magnitude of 1st
derivatives T
1. Sign determinesDark or light region
2. Zero-crossing
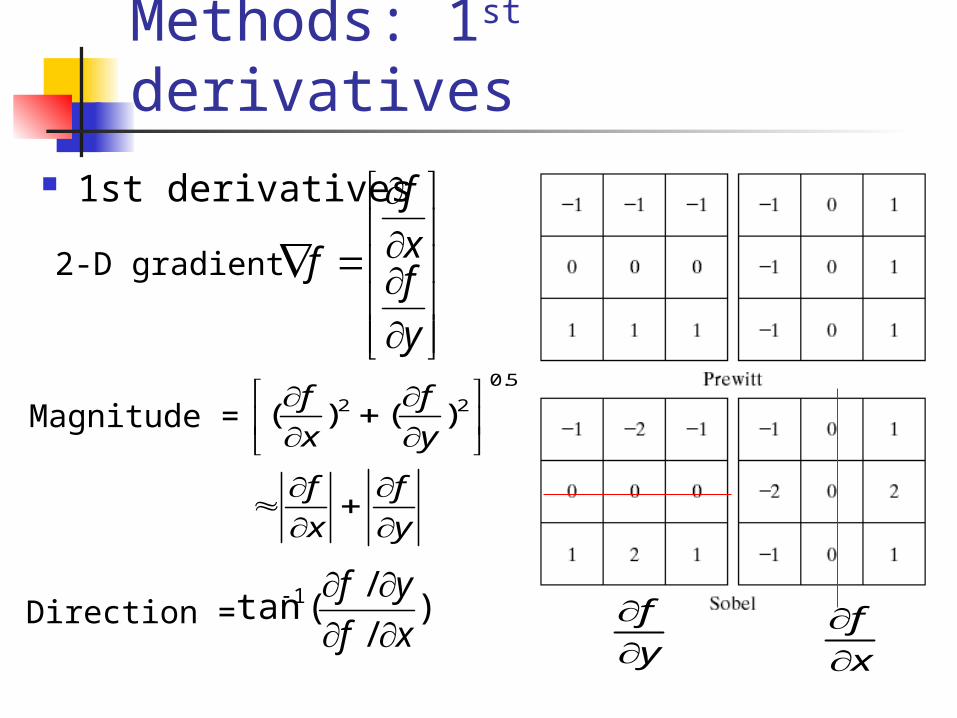
Methods: 1st derivatives 1st derivatives
2-D gradient
y
fx
f
f
Magnitude =
y
f
x
f
y
f
x
f
5.0
22 )()(
Direction = )/
/(tan 1
xf
yf
x
f
y
f

Example: Sobel filterOriginal: 1200x1600
Ver.
Hor.
abs
+abs

Effects of noise
Unwanted Detailed Structure !

1st 2nd
Noisyedges Fail to detect

Reduce noise: SmoothingSmooth with 5x5 average filter
Ver.
Hor.
abs
+abs

Review 2nd derivative
f(x)f(x-1)
1stderivative
2ndderivative
f(x)-f(x-1)
f(x+1)-2f(x)+f(x-1)

Method: 2nd derivative
Edge detectionmethod
Magnitude of 1st
derivatives T
1. Sign determinesDark or light region
2. Zero-crossing
2nd derivative mask
Laplacian

Example: 2nd derivativeoriginal Sobel
GaussianSmoothing
Laplacian(2nd derivative)
LoG Threshold(LoG)Zero-crossing of LoG
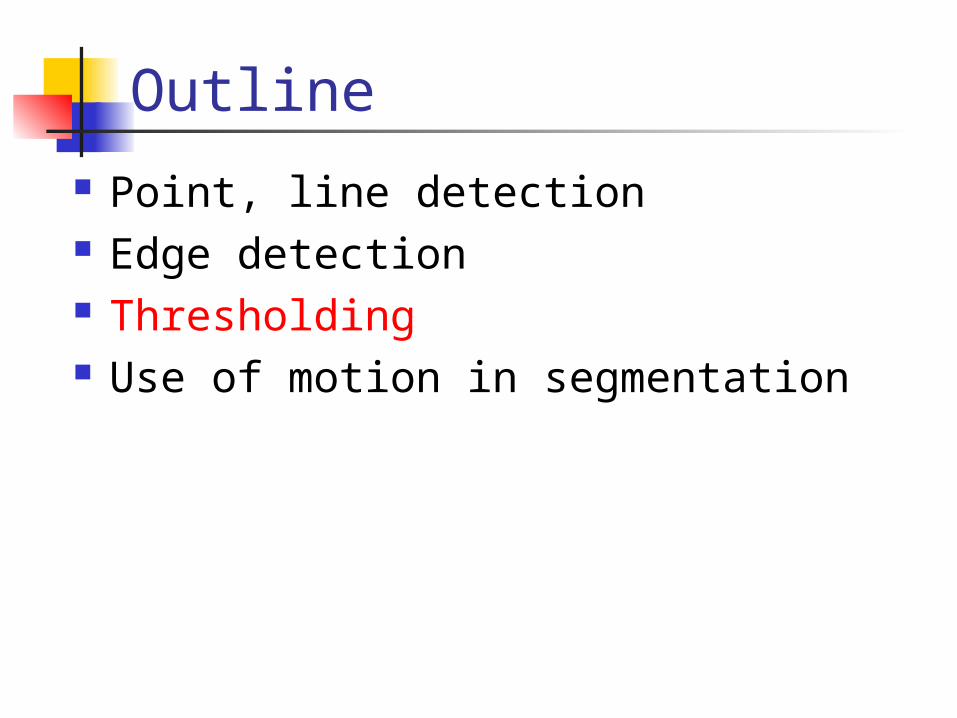
Outline
Point, line detection Edge detection Thresholding Use of motion in segmentation

Foundation of thresholding
Idea: object and background pixels have gray levels grouped into two dominant modes
Original image histogram

Foundation of thresholding
Input f(x,y), given threshold T
Tyxf
Tyxfyxg
),( if 0
),( if 1),(

Issues of thresholding
Selection of threshold T ? Complex environment – illumination Multiple thresholds – more than one
object Global threshold Local threshold
Thresholding as a multi-variable function:
g(x,y) = T[ f(x,y), x, y, p(x,y) ]
Adaptive: Depend onposition
Local: local property func.

1. Automatic selection of T
1. Select an initial T Average gray level Mean of max. and min. gray level
2. Segment the image using T T
G1G2
3. Calculate mean of G1 and G2
4. New threshold: T2 = 0.5( + )T2
5. Repeat steps 2~4 until difference in successive T is small

Example: automatically select T
fingerprint
Initial: gray level mean3 iterationsT = 125.4

2. Effects of illumination
Recall: f(x,y)=i(x,y) r(x,y)
Illumination source
scene
reflection
illumination: reflectance:

Example: illumination
Original image
histogram
Illuminationsource
x
histogram

Example: bad histogram
* The gray levels of the object is mixed with background

4. Motivation for adaptive thresholding
histogram
A singleGlobal threshold

Adaptive local thresholding
Subdivide image into blocks
Q: Improperly segmented subimages !

Iterative subdivisionhistogram
subdivision

Outline
Point, line detection Edge detection Thresholding Use of motion in segmentation

Motion as a clue to extract object
Spatial technique
Reference imagef(x,y,1)
next imagef(x,y,2)
time index
Thresholdeddifference image
1 if |d(x,y)| > T0 otherwise

Use more than one images in time: eliminate noise
Reference imageR(x,y)
Image f(x,y,2)
Accumulativedifference image
counter + 1,
Image f(x,y,3)
…
counter
a. if d(x,y) > T positive ADIb. if d(x,y) < -T negative ADIc. if |d(x,y)| > T absolute ADI
d(x,y)=R(x,y)-f(x,y,t)

Example:
Absolute ADI Positive ADI Negative ADI
* Object shape* Location in ref. image


![Image Segmentation based on Deformable Models · Segmentation system Rules • static rules [selection] – lateral ventricles high contrast ⇒good texture map ⇒increase texture](https://img.pdfslide.tips/doc/110x75/5f805e616050b07370169abb/image-segmentation-based-on-deformable-models-segmentation-system-rules-a-static.jpg)