Embed Size (px)
DESCRIPTION
Chap AOM
Citation preview
©The McGraw-Hill Companies, Inc., 2004
1
©The McGraw-Hill Companies, Inc., 2004
2
Chapter 3
Project Management
©The McGraw-Hill Companies, Inc., 2004
3
• Definition of Project Management• Work Breakdown Structure• Project Control Charts• Structuring Projects• Critical Path Scheduling
OBJECTIVES
©The McGraw-Hill Companies, Inc., 2004
4
Project Management Defined
• Project is a series of related jobs usually directed toward some major output and requiring a significant period of time to perform
• Project Management are the management activities of planning, directing, and controlling resources (people, equipment, material) to meet the technical, cost, and time constraints of a project
©The McGraw-Hill Companies, Inc., 2004
5
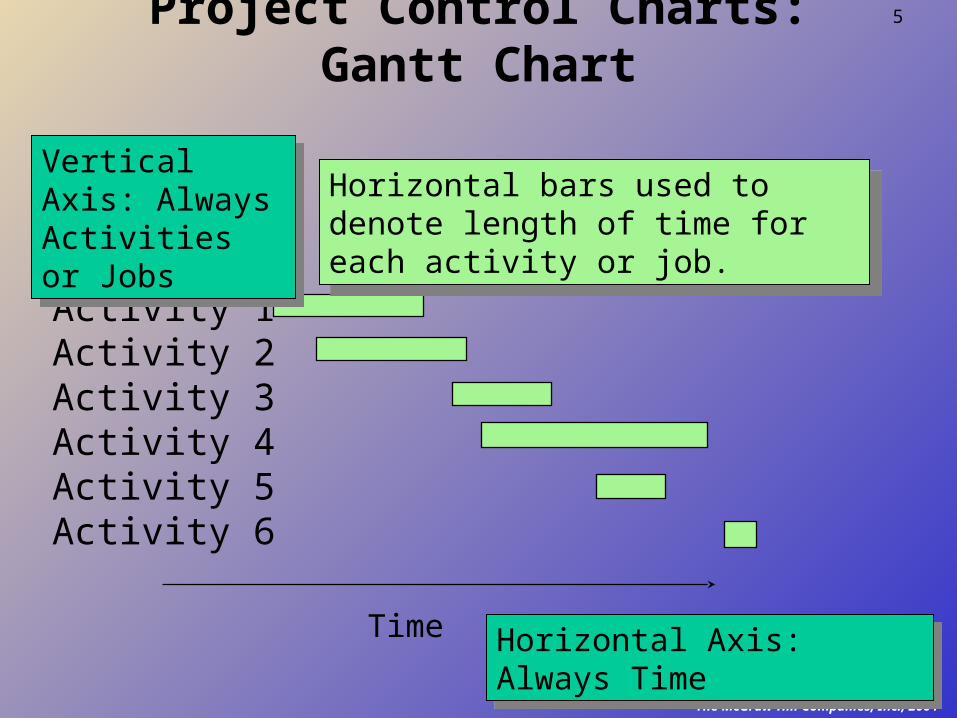
Project Control Charts: Gantt Chart
Activity 1Activity 2Activity 3Activity 4Activity 5Activity 6
Time
Vertical Axis: Always Activities or Jobs
Horizontal Axis: Always Time
Horizontal bars used to denote length of time for each activity or job.
©The McGraw-Hill Companies, Inc., 2004
6
Structuring Projects Pure Project: Advantages
Pure ProjectDefinedA pure project is where a self-contained team works full-time on the project
• The project manager has full authority over the project
• Team members report to one boss• Shortened communication lines• Team pride, motivation, and
commitment are high
©The McGraw-Hill Companies, Inc., 2004
7
Structuring Projects Pure Project: Disadvantages
• Duplication of resources• Organizational goals and policies are ignored• Lack of technology transfer• Team members have no functional area
"home"
©The McGraw-Hill Companies, Inc., 2004
8
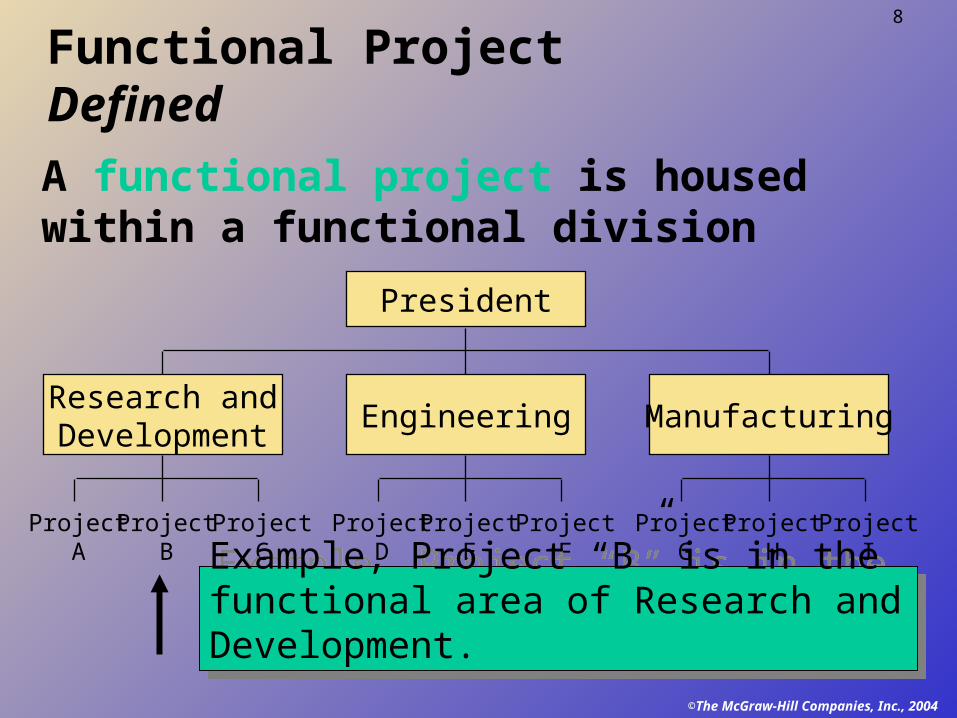
Functional ProjectDefined
President
Research andDevelopment Engineering Manufacturing
ProjectA
ProjectB
ProjectC
ProjectD
ProjectE
ProjectF
ProjectG
ProjectH
ProjectI
A functional project is housed within a functional division
Example, Project “B” is in the functional area of Research and Development.
©The McGraw-Hill Companies, Inc., 2004
9
Structuring Projects Functional Project: Advantages
• A team member can work on several projects
• Technical expertise is maintained within the functional area
• The functional area is a “home” after the project is completed
• Critical mass of specialized knowledge
©The McGraw-Hill Companies, Inc., 2004
10
Structuring Projects Functional Project: Disadvantages
• Aspects of the project that are not directly related to the functional area get short-changed
• Motivation of team members is often weak
• Needs of the client are secondary and are responded to slowly
©The McGraw-Hill Companies, Inc., 2004
11
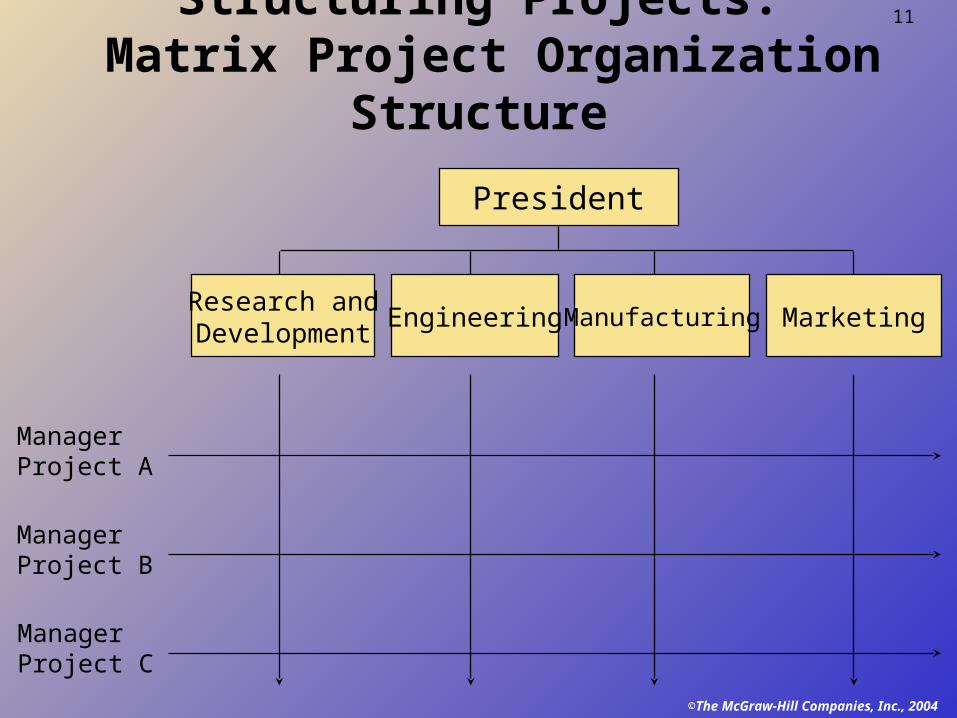
Structuring Projects: Matrix Project Organization Structure
President
Research andDevelopment Engineering Manufacturing Marketing
ManagerProject A
ManagerProject B
ManagerProject C
©The McGraw-Hill Companies, Inc., 2004
12
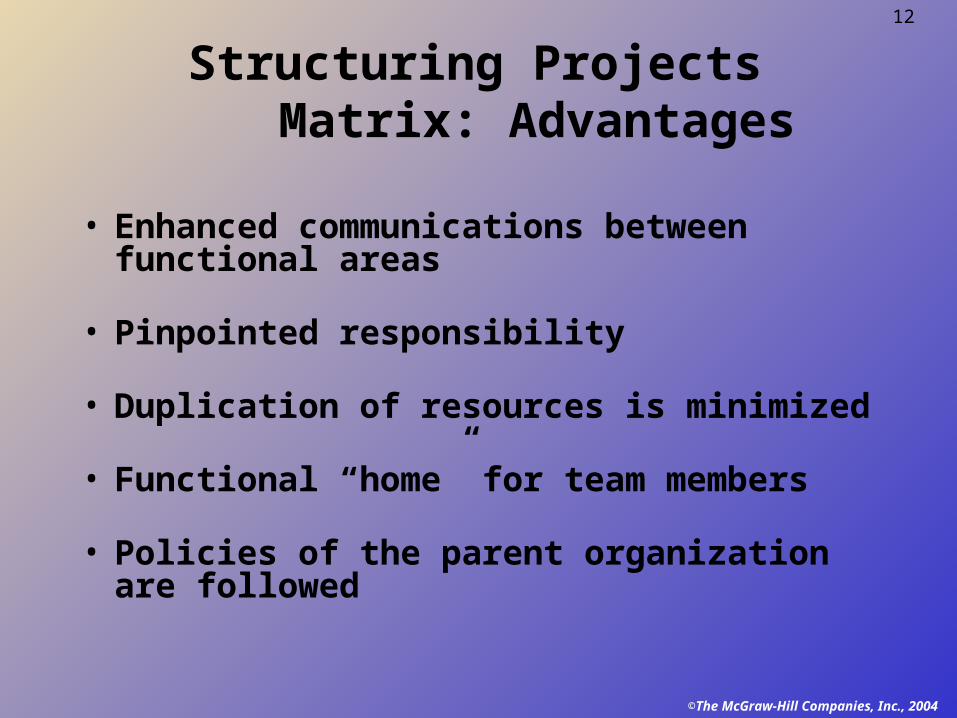
Structuring Projects Matrix: Advantages
• Enhanced communications between functional areas
• Pinpointed responsibility
• Duplication of resources is minimized
• Functional “home” for team members
• Policies of the parent organization are followed
©The McGraw-Hill Companies, Inc., 2004
13
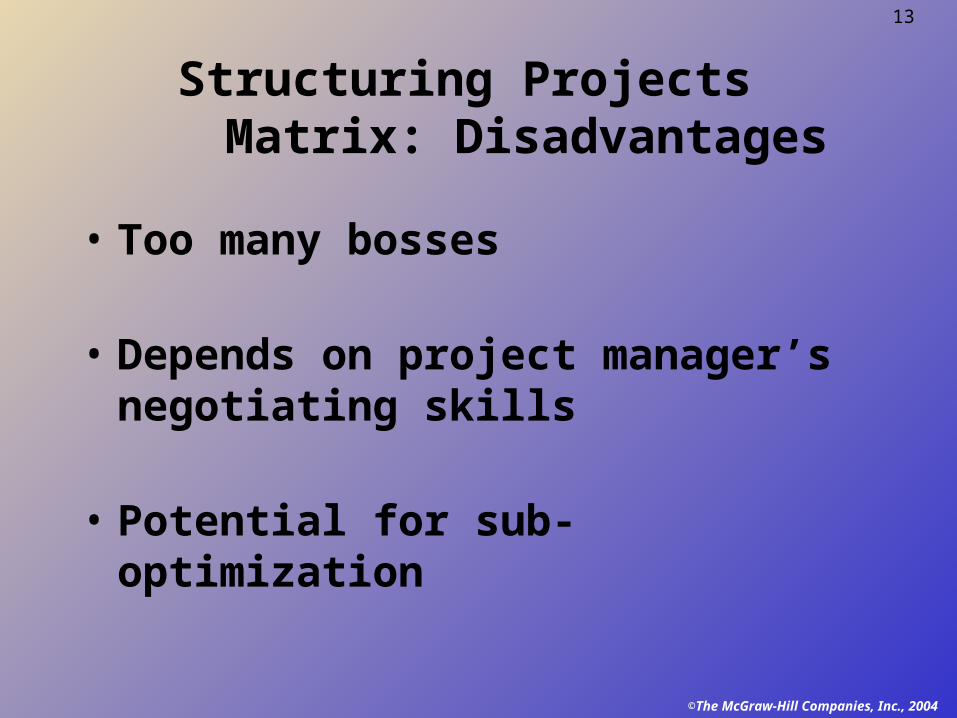
Structuring Projects Matrix: Disadvantages
• Too many bosses
• Depends on project manager’s negotiating skills
• Potential for sub-optimization
©The McGraw-Hill Companies, Inc., 2004
14
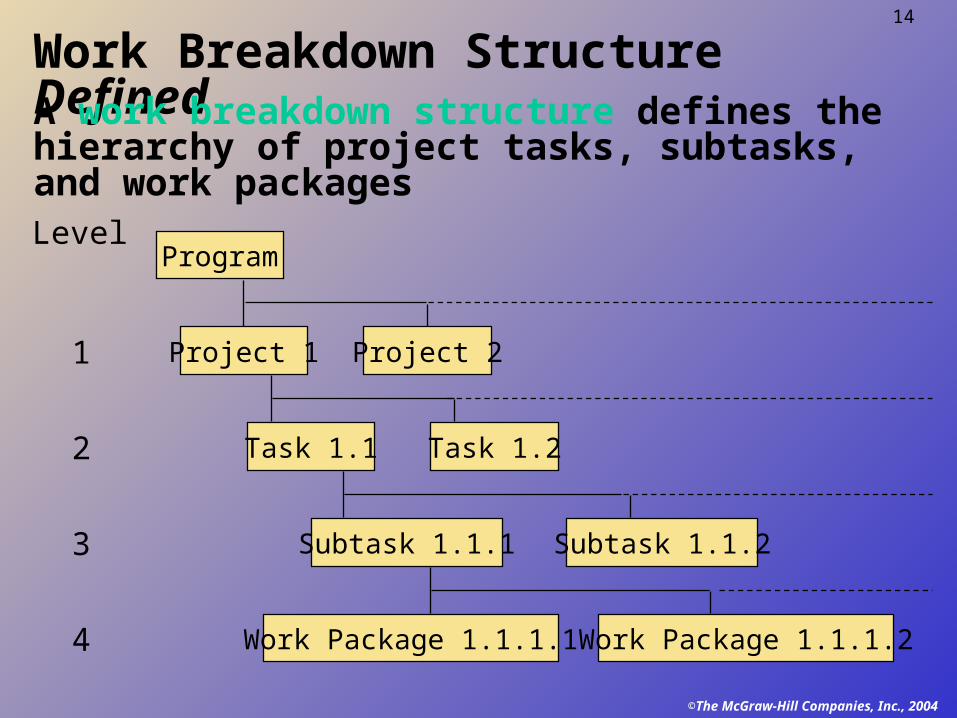
Work Breakdown StructureDefined
Program
Project 1 Project 2
Task 1.1
Subtask 1.1.1
Work Package 1.1.1.1
Level
1
2
3
4
Task 1.2
Subtask 1.1.2
Work Package 1.1.1.2
A work breakdown structure defines the hierarchy of project tasks, subtasks, and work packages
©The McGraw-Hill Companies, Inc., 2004
15
Network-Planning Models• A project is made up of a sequence of
activities that form a network representing a project
• The path taking longest time through this network of activities is called the “critical path”
• The critical path provides a wide range of scheduling information useful in managing a project
• Critical Path Method (CPM) helps to identify the critical path(s) in the project networks
©The McGraw-Hill Companies, Inc., 2004
16
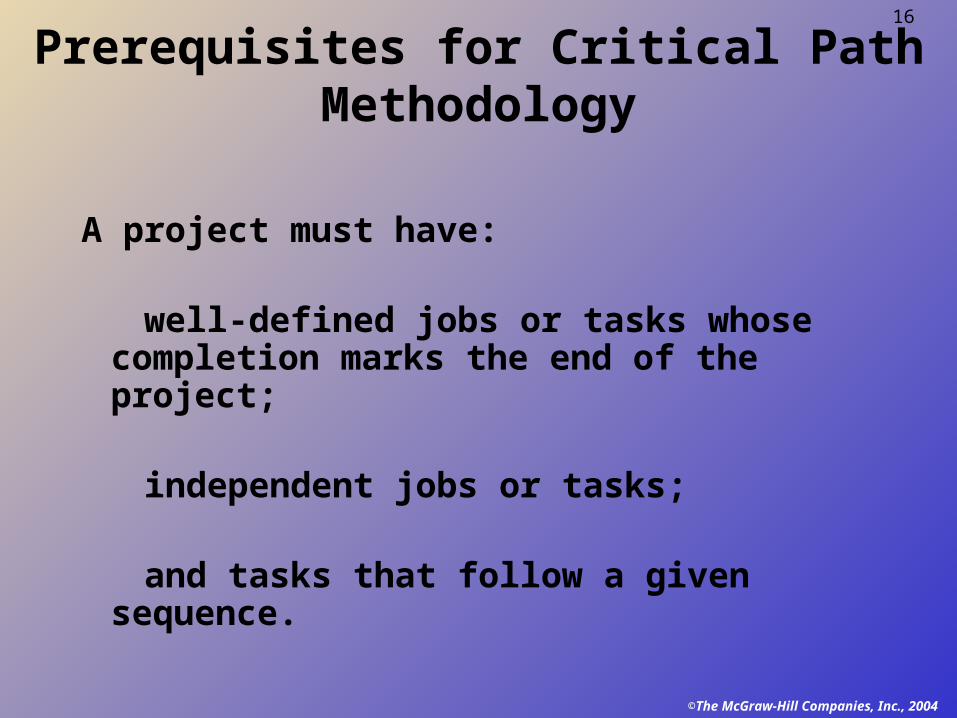
Prerequisites for Critical Path Methodology
A project must have:
well-defined jobs or tasks whose completion marks the end of the project;
independent jobs or tasks;
and tasks that follow a given sequence.
©The McGraw-Hill Companies, Inc., 2004
17
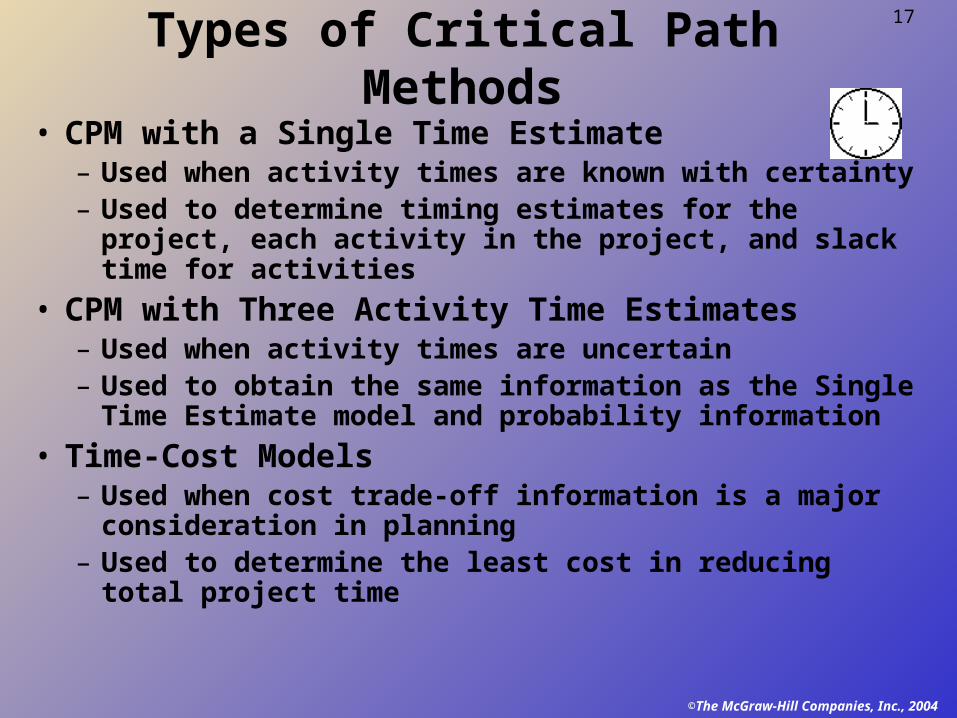
Types of Critical Path Methods• CPM with a Single Time Estimate
– Used when activity times are known with certainty– Used to determine timing estimates for the project, each
activity in the project, and slack time for activities • CPM with Three Activity Time Estimates
– Used when activity times are uncertain – Used to obtain the same information as the Single Time
Estimate model and probability information• Time-Cost Models
– Used when cost trade-off information is a major consideration in planning
– Used to determine the least cost in reducing total project time
©The McGraw-Hill Companies, Inc., 2004
18
Steps in the CPM with Single Time Estimate
• 1. Activity Identification• 2. Activity Sequencing and Network
Construction• 3. Determine the critical path
– From the critical path all of the project and activity timing information can be obtained
©The McGraw-Hill Companies, Inc., 2004
19
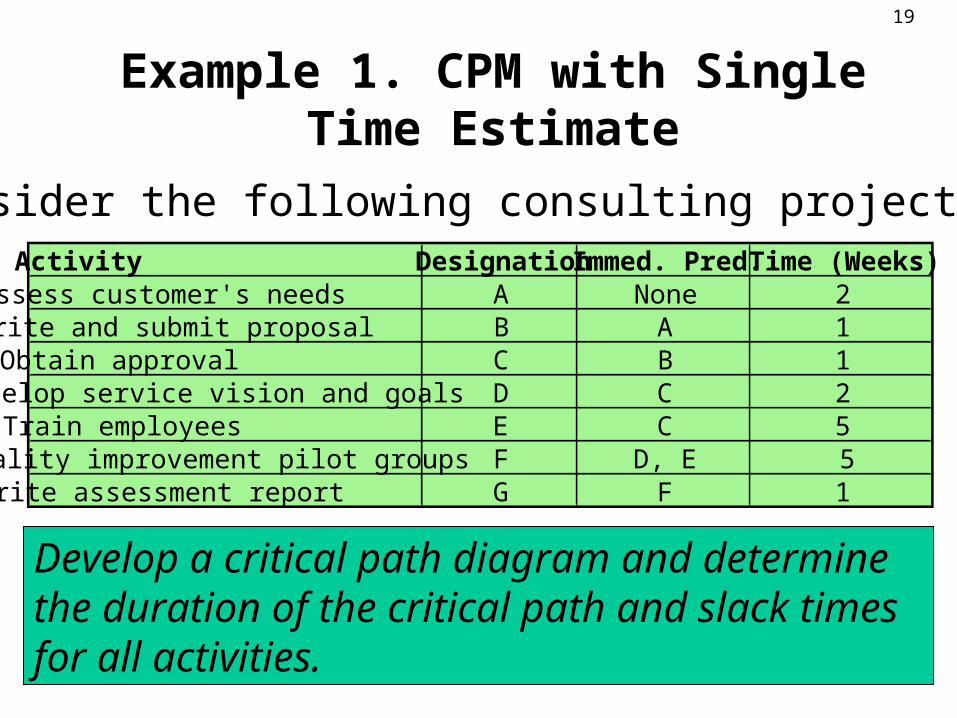
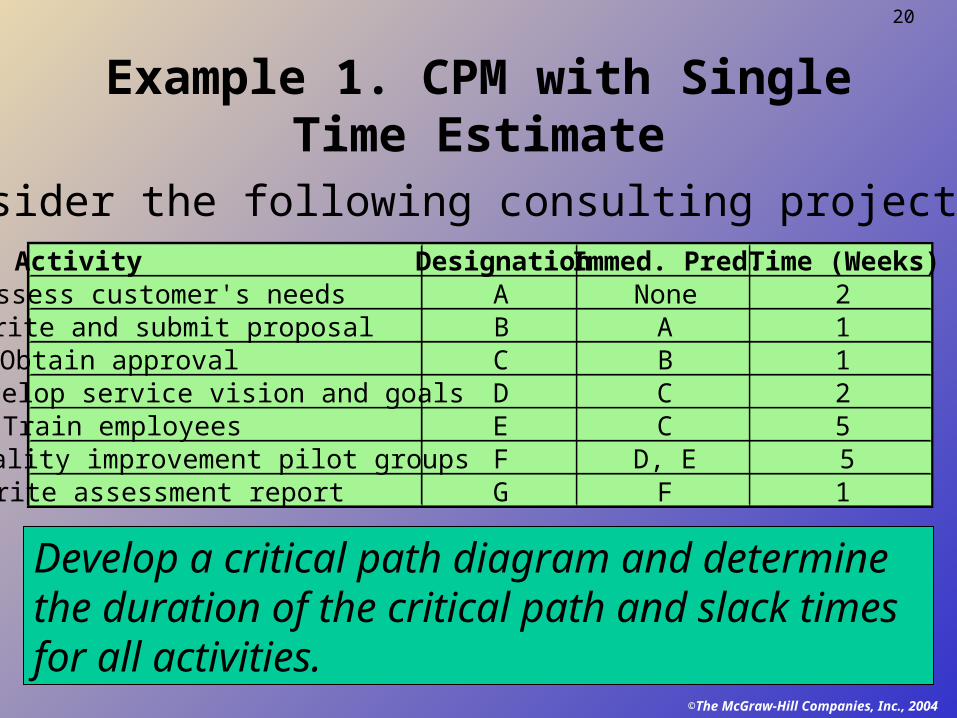
Example 1. CPM with Single Time Estimate
Consider the following consulting project:
Develop a critical path diagram and determine the duration of the critical path and slack times for all activities.
Activity Designation Immed. Pred. Time (Weeks)Assess customer's needs A None 2Write and submit proposal B A 1Obtain approval C B 1Develop service vision and goals D C 2Train employees E C 5Quality improvement pilot groups F D, E 5Write assessment report G F 1
©The McGraw-Hill Companies, Inc., 2004
20
Example 1. CPM with Single Time Estimate
Consider the following consulting project:Activity Designation Immed. Pred. Time (Weeks)Assess customer's needs A None 2Write and submit proposal B A 1Obtain approval C B 1Develop service vision and goals D C 2Train employees E C 5Quality improvement pilot groups F D, E 5Write assessment report G F 1
Develop a critical path diagram and determine the duration of the critical path and slack times for all activities.
©The McGraw-Hill Companies, Inc., 2004
21
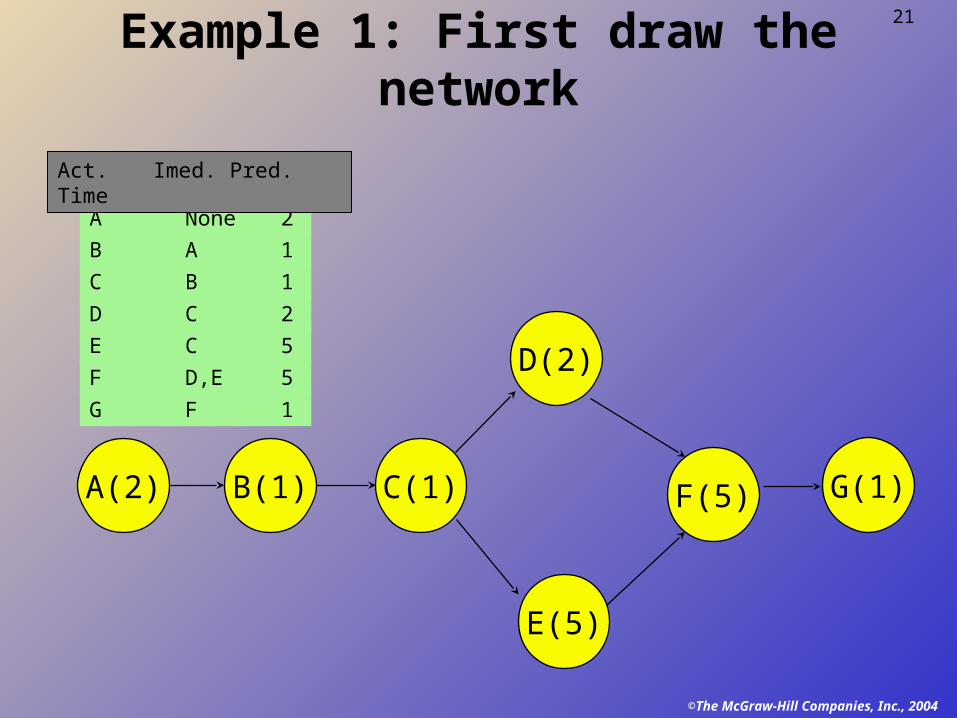
Example 1: First draw the network
A(2) B(1) C(1)
D(2)
E(5)
F(5) G(1)
A None 2B A 1C B 1D C 2E C 5F D,E 5G F 1
Act. Imed. Pred. Time
©The McGraw-Hill Companies, Inc., 2004
22
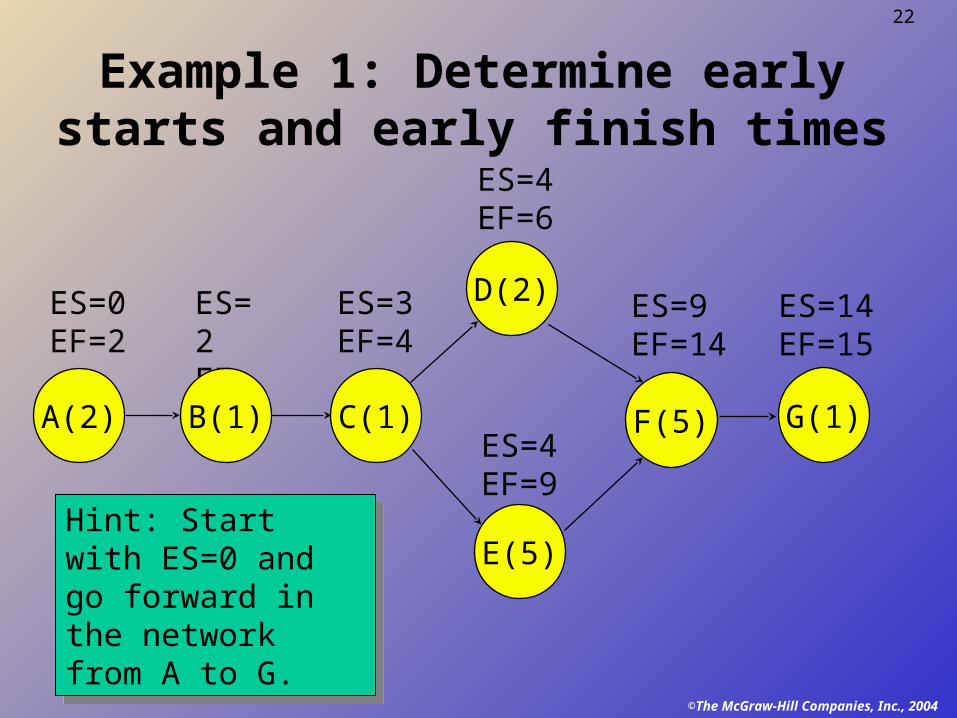
Example 1: Determine early starts and early finish times
ES=9EF=14
ES=14EF=15
ES=0EF=2
ES=2EF=3
ES=3EF=4
ES=4EF=9
ES=4EF=6
A(2) B(1) C(1)
D(2)
E(5)
F(5) G(1)
Hint: Start with ES=0 and go forward in the network from A to G.
©The McGraw-Hill Companies, Inc., 2004
23
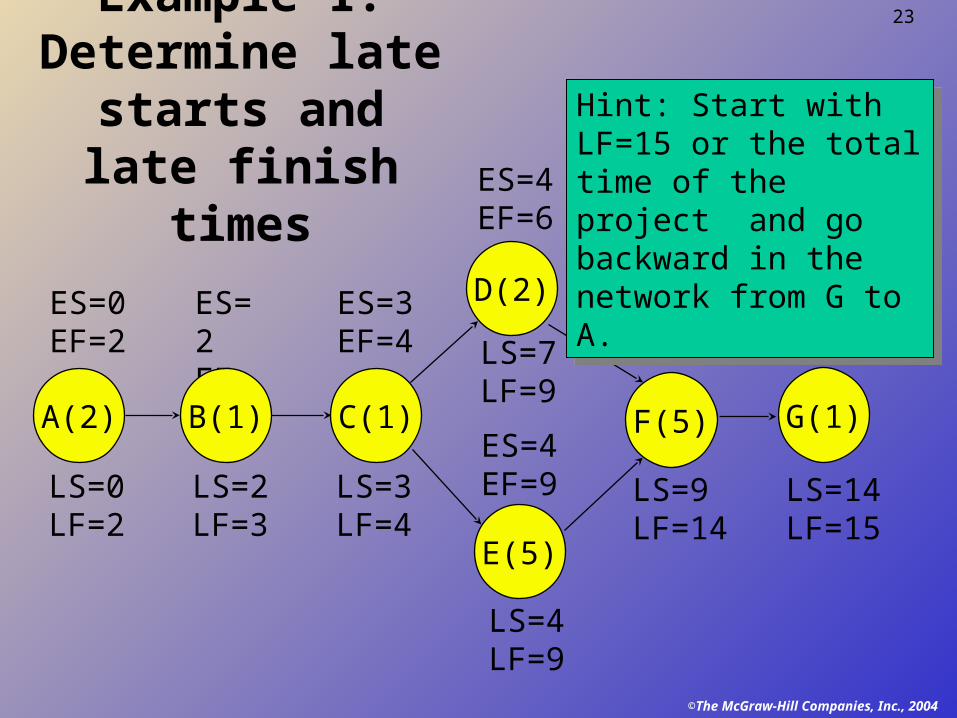
Example 1: Determine late
starts and late finish times
ES=9EF=14
ES=14EF=15
ES=0EF=2
ES=2EF=3
ES=3EF=4
ES=4EF=9
ES=4EF=6
A(2) B(1) C(1)
D(2)
E(5)
F(5) G(1)
LS=14LF=15
LS=9LF=14
LS=4LF=9
LS=7LF=9
LS=3LF=4
LS=2LF=3
LS=0LF=2
Hint: Start with LF=15 or the total time of the project and go backward in the network from G to A.
©The McGraw-Hill Companies, Inc., 2004
24
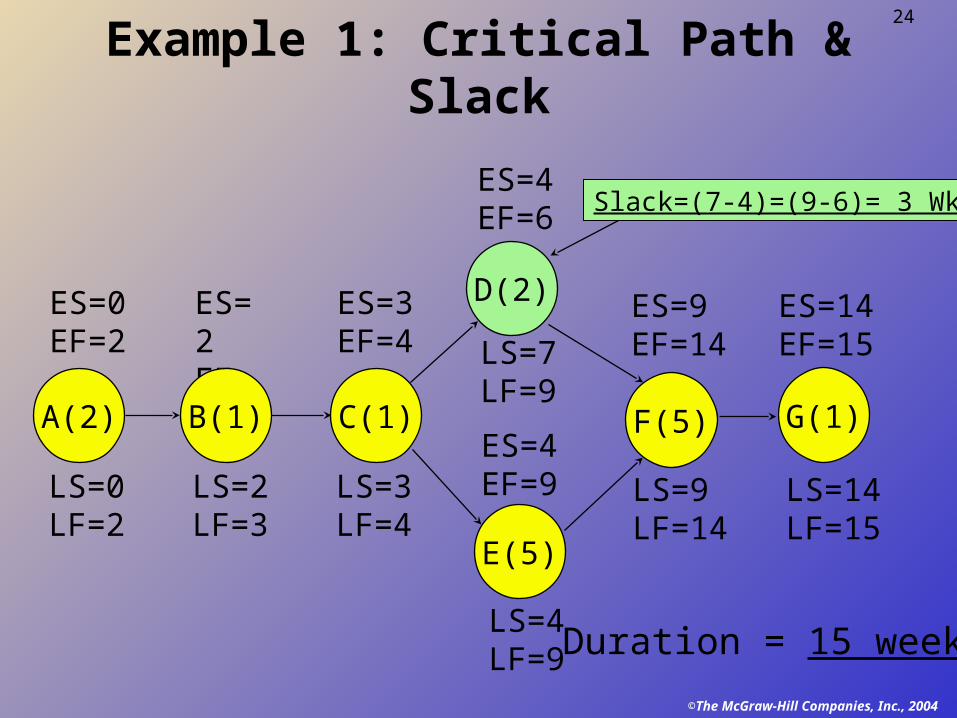
Example 1: Critical Path & Slack
ES=9EF=14
ES=14EF=15
ES=0EF=2
ES=2EF=3
ES=3EF=4
ES=4EF=9
ES=4EF=6
A(2) B(1) C(1)
D(2)
E(5)
F(5) G(1)
LS=14LF=15
LS=9LF=14
LS=4LF=9
LS=7LF=9
LS=3LF=4
LS=2LF=3
LS=0LF=2
Duration = 15 weeks
Slack=(7-4)=(9-6)= 3 Wks
©The McGraw-Hill Companies, Inc., 2004
25
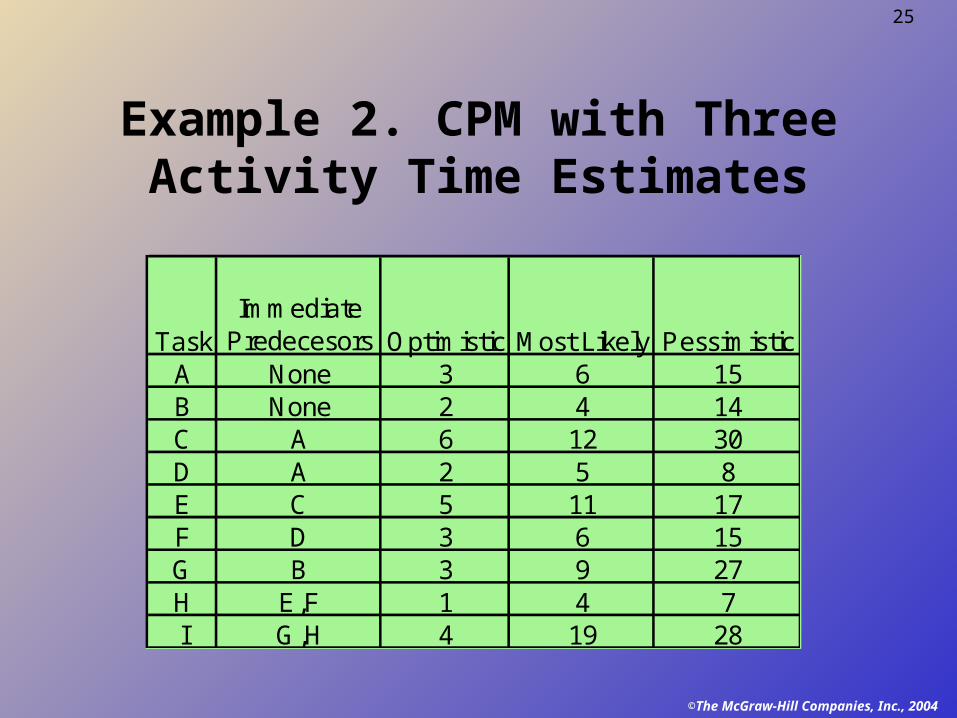
Example 2. CPM with Three Activity Time Estimates
TaskImmediate
Predecesors Optimistic Most Likely PessimisticA None 3 6 15B None 2 4 14C A 6 12 30D A 2 5 8E C 5 11 17F D 3 6 15G B 3 9 27H E,F 1 4 7I G,H 4 19 28
©The McGraw-Hill Companies, Inc., 2004
26
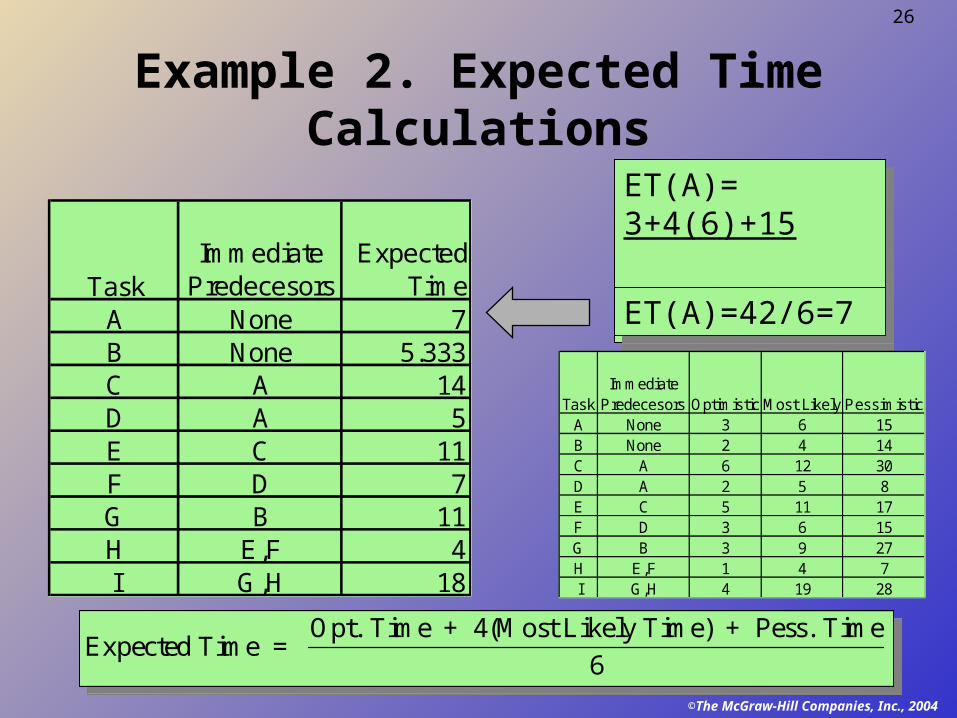
Example 2. Expected Time Calculations
ET(A)= 3+4(6)+15
6
ET(A)=42/6=7Task
Immediate Predecesors
Expected Time
A None 7B None 5.333C A 14D A 5E C 11F D 7G B 11H E,F 4I G,H 18
TaskImmediate
Predecesors Optimistic Most Likely PessimisticA None 3 6 15B None 2 4 14C A 6 12 30D A 2 5 8E C 5 11 17F D 3 6 15G B 3 9 27H E,F 1 4 7I G,H 4 19 28
Expected Time = Opt. Time + 4(Most Likely Time) + Pess. Time
6
©The McGraw-Hill Companies, Inc., 2004
27
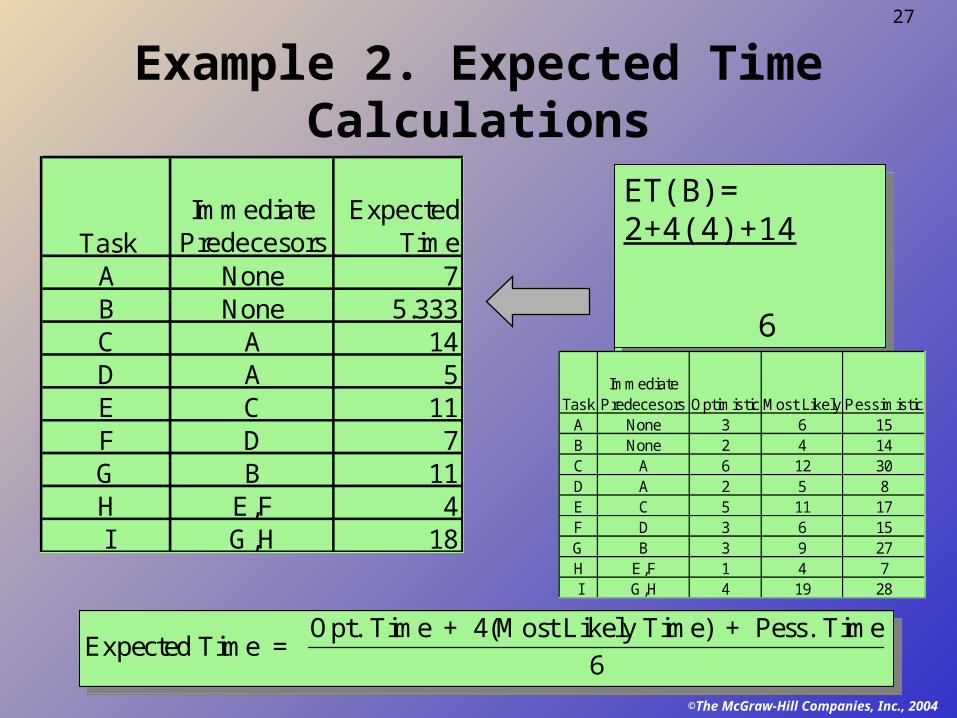
Example 2. Expected Time Calculations
TaskImmediate
PredecesorsExpected
TimeA None 7B None 5.333C A 14D A 5E C 11F D 7G B 11H E,F 4I G,H 18
ET(B)=32/6=5.333
ET(B)= 2+4(4)+14
6
TaskImmediate
Predecesors Optimistic Most Likely PessimisticA None 3 6 15B None 2 4 14C A 6 12 30D A 2 5 8E C 5 11 17F D 3 6 15G B 3 9 27H E,F 1 4 7I G,H 4 19 28
Expected Time = Opt. Time + 4(Most Likely Time) + Pess. Time
6
©The McGraw-Hill Companies, Inc., 2004
28
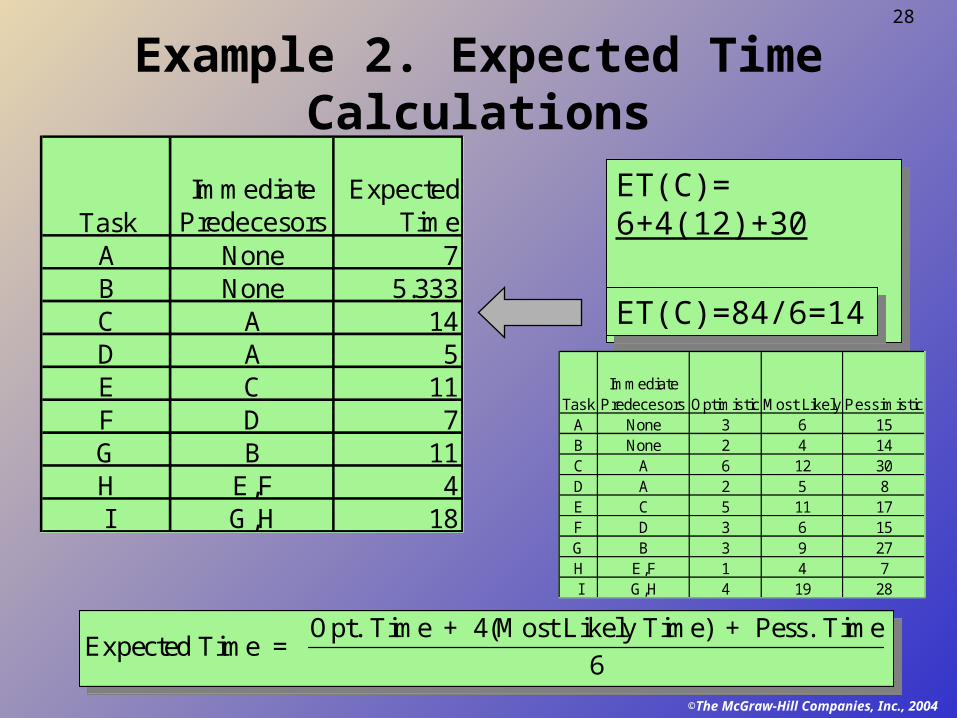
Example 2. Expected Time Calculations
TaskImmediate
PredecesorsExpected
TimeA None 7B None 5.333C A 14D A 5E C 11F D 7G B 11H E,F 4I G,H 18
ET(C)= 6+4(12)+30
6
ET(C)=84/6=14
TaskImmediate
Predecesors Optimistic Most Likely PessimisticA None 3 6 15B None 2 4 14C A 6 12 30D A 2 5 8E C 5 11 17F D 3 6 15G B 3 9 27H E,F 1 4 7I G,H 4 19 28
Expected Time = Opt. Time + 4(Most Likely Time) + Pess. Time
6
©The McGraw-Hill Companies, Inc., 2004
29
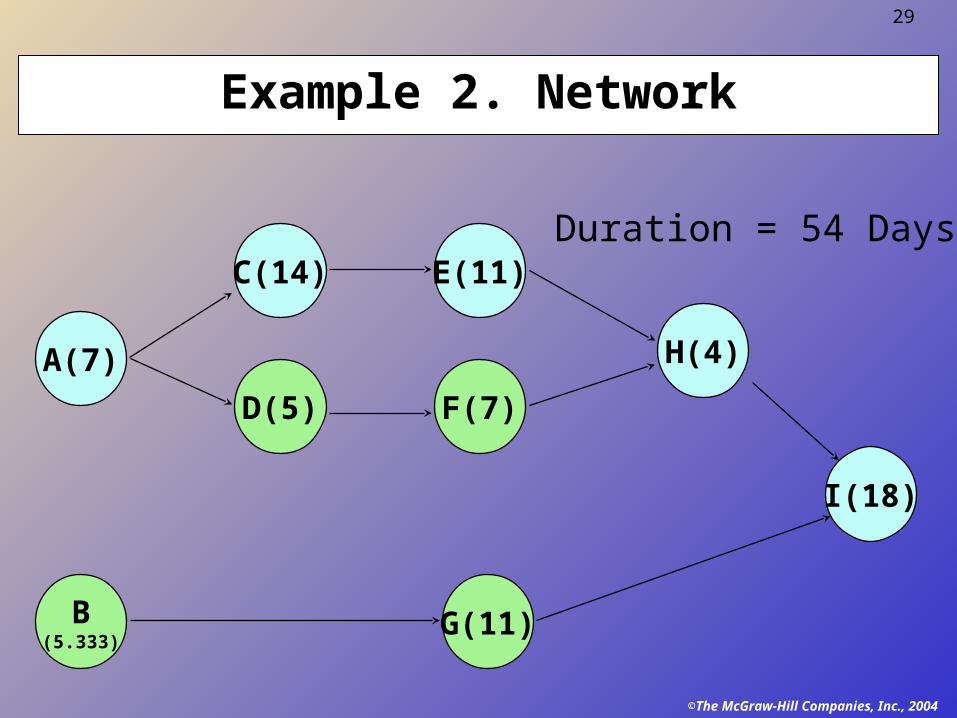
Example 2. Network
A(7)
B(5.333)
C(14)
D(5)
E(11)
F(7)
H(4)
G(11)
I(18)
Duration = 54 Days
©The McGraw-Hill Companies, Inc., 2004
30
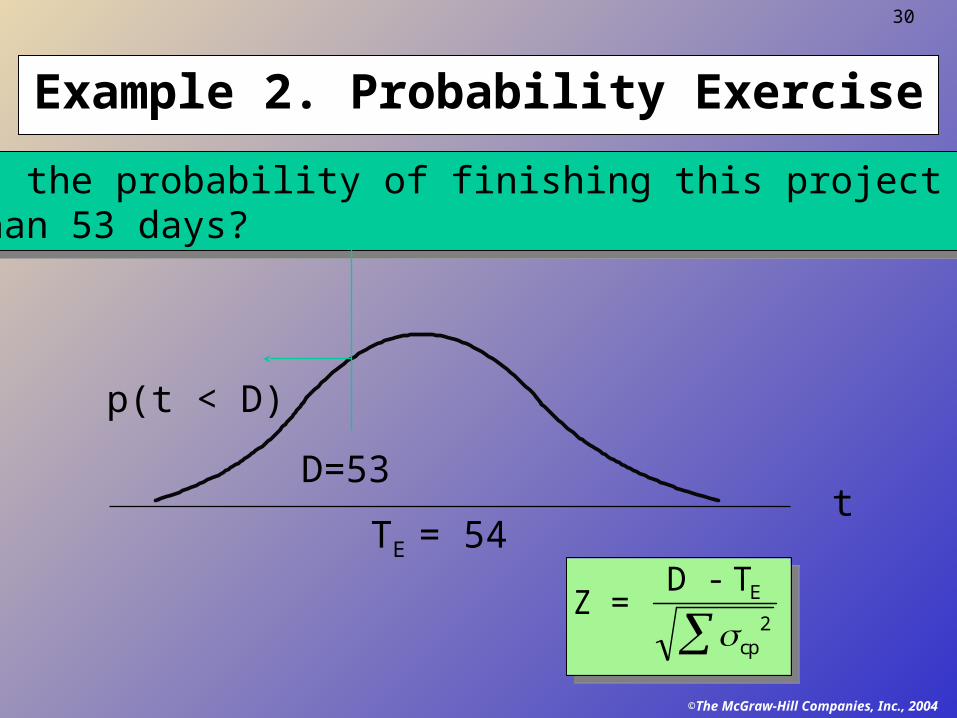
Example 2. Probability Exercise
What is the probability of finishing this project in less than 53 days?
p(t < D)
TE = 54
Z = D - TE
cp2
tD=53
©The McGraw-Hill Companies, Inc., 2004
31
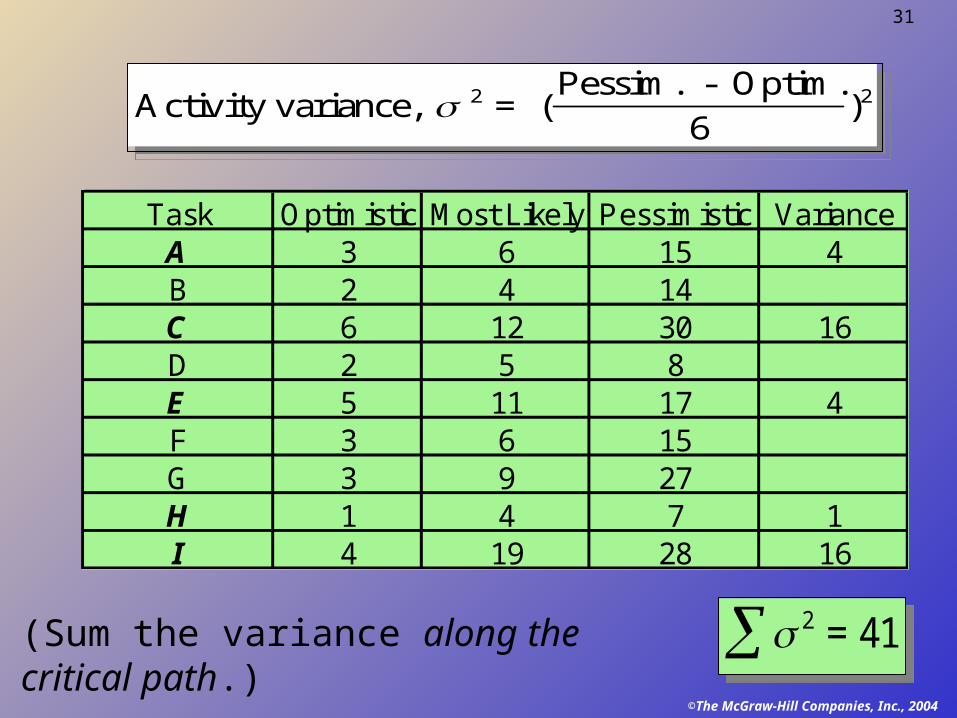
Activity variance, = (Pessim. - Optim.
6)2 2
Task Optimistic Most Likely Pessimistic VarianceA 3 6 15 4B 2 4 14C 6 12 30 16D 2 5 8E 5 11 17 4F 3 6 15G 3 9 27H 1 4 7 1I 4 19 28 16
(Sum the variance along the critical path.)
2 = 41
©The McGraw-Hill Companies, Inc., 2004
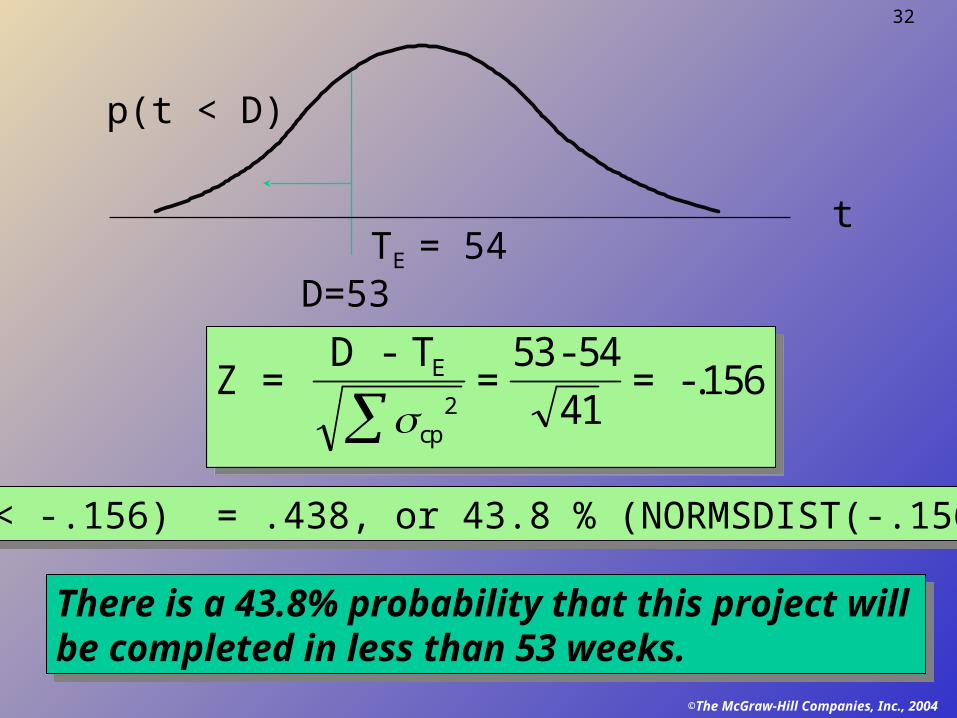
32
There is a 43.8% probability that this project will be completed in less than 53 weeks.
p(Z < -.156) = .438, or 43.8 % (NORMSDIST(-.156)
Z = D - T
=53- 54
41= -.156E
cp2
TE = 54
p(t < D)
t
D=53
©The McGraw-Hill Companies, Inc., 2004
33
Example 2. Additional Probability Exercise
• What is the probability that the project duration will exceed 56 weeks?
©The McGraw-Hill Companies, Inc., 2004
34
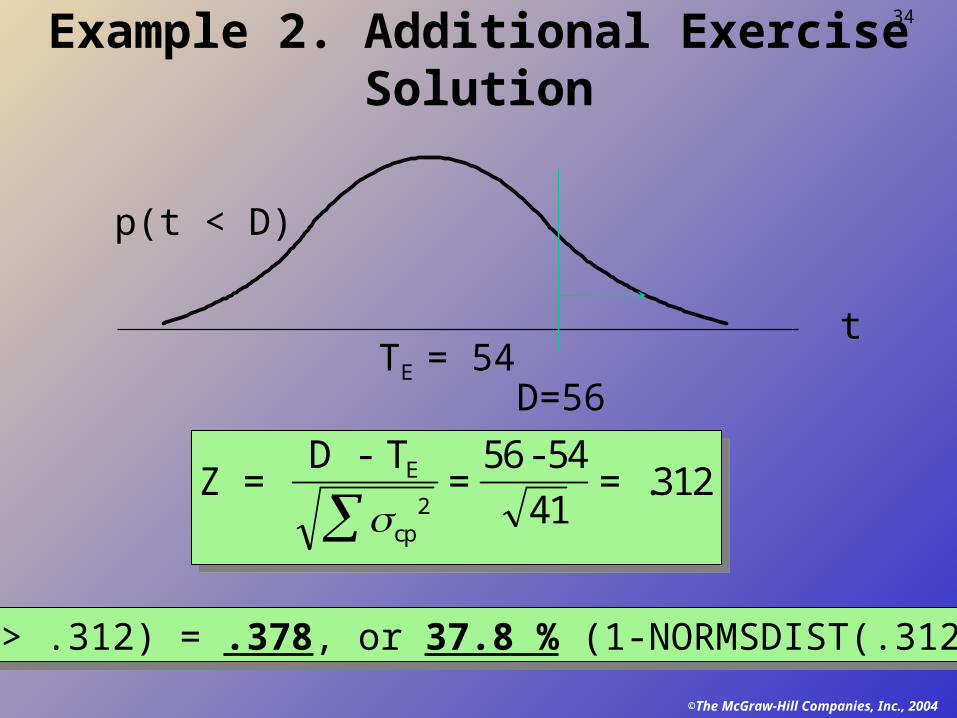
Example 2. Additional Exercise Solution
tTE = 54
p(t < D)
D=56
Z = D - T
=56 - 54
41= .312E
cp2
p(Z > .312) = .378, or 37.8 % (1-NORMSDIST(.312))
©The McGraw-Hill Companies, Inc., 2004
35
Time-Cost Models
• Basic Assumption: Relationship between activity completion time and project cost
• Time Cost Models: Determine the optimum point in time-cost tradeoffs– Activity direct costs– Project indirect costs– Activity completion times
©The McGraw-Hill Companies, Inc., 2004
36
CPM Assumptions/Limitations • Project activities can be identified as entities (There
is a clear beginning and ending point for each activity.)
• Project activity sequence relationships can be specified and networked
• Project control should focus on the critical path• The activity times follow the beta distribution, with
the variance of the project assumed to equal the sum of the variances along the critical path
• Project control should focus on the critical path
©The McGraw-Hill Companies, Inc., 2004
37
End of Chapter 3


![[XLS]fmism.univ-guelma.dzfmism.univ-guelma.dz/sites/default/files/le fond... · Web view1 1 1 1 1 1 1 1 1 1 1 1 1 1 1 1 1 1 1 1 1 1 1 1 1 1 1 1 1 1 1 1 1 1 1 1 1 1 1 1 1 1 1 1 1 1](https://img.pdfslide.tips/doc/110x75/5b9d17e509d3f2194e8d827e/xlsfmismuniv-fond-web-view1-1-1-1-1-1-1-1-1-1-1-1-1-1-1-1-1-1-1-1-1-1.jpg)

![1 ¢ Ù 1 £¢ 1 £ £¢ 1 - Narodowy Bank Polski · 1 à 1 1 1 1 \ 1 1 1 1 ¢ 1 1 £ 1 £ £¢ 1 ¢ 1 ¢ Ù 1 à 1 1 1 ¢ à 1 1 £ ï 1 1. £¿ï° 1 ¢ 1 £ 1 1 1 1 ] 1 1 1 1 ¢](https://img.pdfslide.tips/doc/110x75/5fc6757af26c7e63a70a621e/1-1-1-1-narodowy-bank-polski-1-1-1-1-1-1-1-1-1-1-1.jpg)
![[PPT]Marketing - Mrs. Martinez's Class Website - Homeledesma.weebly.com/uploads/5/7/6/0/5760661/chap003.ppt · Web viewTitle Marketing Author Grewal and Levy, 1e Last modified by](https://img.pdfslide.tips/doc/110x75/5ae12dc87f8b9a6e5c8e64f3/pptmarketing-mrs-martinezs-class-website-viewtitle-marketing-author-grewal.jpg)