Embed Size (px)
Citation preview

Chapter 1
H E A L T H S T A T U S S T A T I S T I C S

Region/ Region/Province/ Province/City Code City Code
Number Number
PHILIPPINES PHILIPPINES 85,822,854 Region 3 REGION 3 8,793,618
N C R N.C.R. 11,394,158 45 AURORA 207,63846 BATAAN 537,430
1 BATANES 16,250 47 BULACAN 1,758,2592 MALABON 424,313 48 NUEVA ECIJA 1,240,8503 NAVOTAS 267,778 49 PAMPANGA 1,519,6704 PATEROS 56,038 50 TARLAC 861,3455 SAN JUAN 104,708 51 ZAMBALES 486,2876 TAGUIG 649,355
52 ANGELES CITY 275,0787 CALOOCAN CITY 1,379,141 53 BALANGA CITY 75,5588 LAS PINAS CITY 747,048 54 CABANATUAN CITY 249,1439 MAKATI CITY 486,323 55 GAPAN CITY 87,577
10 MANDALUYONG CITY 296,663 56 MALOLOS CITY 172,81211 CITY OF MANILA 1,429,111 57 MUNOZ CITY 68,67512 MARIKINA CITY 462,560 58 OLONGAPO CITY 188,73413 MUNTINGLUPA CITY 656,464 59 PALAYAN CITY 39,97514 PARANAQUE CITY 518,297 60 SAN FERNANDO CITY 259,67915 PASAY CITY 423,694 61 SAN JOSE CITY 120,86216 PASIG CITY 595,258 62 SAN JOSE DEL MONTE 365,46417 QUEZON CITY 2,272,010 63 TARLAC CITY 278,58218 VALENZUELA CITY 609,147
Region 4A REGION 4A 10,475,286
C A R C.A.R. 1,591,963 64 BATANGAS 1,338,50365 CAVITE 2,031,192
19 ABRA 225,984 66 LAGUNA 1,491,41920 APAYAO 103,567 67 QUEZON 1,634,39221 BENGUET 380,348 68 RIZAL 1,425,17422 IFUGAO 187,94323 KALINGA 189,457 69 ANTIPOLO CITY 829,27524 MT. PROVINCE 157,160 70 BATANGAS CITY 251,586
71 CALAMBA CITY 315,96025 BAGUIO CITY 347,504 72 CAVITE CITY 87,570
73 LIPA CITY 210,41874 LUCENA CITY 239,058
Region 1 REGION 1 4,562,030 75 SAN PABLO CITY 225,97376 STA. ROSA CITY 216,681
26 ILOCOS NORTE 455,704 77 TANAUAN CITY 117,94427 ILOCOS SUR 527,442 78 TAGAYTAY CITY 35,13928 LA UNION 609,700 79 TRECE MARTIRES CITY 25,00229 PANGASINAN 2,134,297
Region 4B REGION 4B 2,521,97030 ALAMINOS CITY 80,79431 CANDON CITY 52,376 80 MARINDUQUE 219,09932 DAGUPAN CITY 147,023 81 MINDORO OCCIDENTAL 417,38133 LAOAG CITY 104,181 82 MINDORO ORIENTAL 625,32134 SAN CARLOS CITY 162,209 83 PALAWAN 668,04035 SAN FERNANDO CITY 115,494 84 ROMBLON 279,03536 URDANETA CITY 125,98937 VIGAN CITY 46,821 85 CALAPAN CITY 123,991
86 PUERTO PRINCESA CITY 189,103
Region 5 REGION 5 5,245,066Region 2 REGION 2 3,121,351
87 ALBAY 1,045,53088 CAMARINES NORTE 576,646
38 CAGAYAN 934,879 89 CAMARINES SUR 1,536,56039 ISABELA 1,198,636 90 CATANDUANES 250,83340 NUEVA VIZCAYA 421,073 91 MASBATE 723,33441 QUIRINO 174,337 92 SORSOGON 670,194
42 CAUAYAN CITY 126,164 93 IRIGA CITY 90,45543 SANTIAGO CITY 127,361 94 LEGASPI CITY 188,68344 TUGUEGARAO CITY 138,901 95 NAGA CITY 162,831
Table 1A.1 - Estimated PopulationBy Region, Province & City
Philippines, 2006
Area Population Area Population
2

Region/ Region/Province/ Province/City Code City Code
Number Number
Region 6 REGION 6 7,001,978
96 AKLAN 495,879 Region 10 REGION 10 4,053,02097 ANTIQUE 521,159 98 CAPIZ 593,878 152 BUKIDNON 918,39299 GUIMARAS 153,100 153 CAMIGUIN 78,788100 ILOILO 1,635,350 154 LANAO DEL NORTE 546,447101 NEGROS OCCIDENTAL 994,316 155 MISAMIS OCCIDENTAL 290,686
156 MISAMIS ORIENTAL 577,472102 BACOLOD CITY 529,559 103 BAGO CITY 170,161 157 CAGAYAN DE ORO 593,421104 CADIZ CITY 132,122 158 GINGOOG CITY 92,591105 ESCALANTE CITY 97,882 159 ILIGAN CITY 373,311106 HIMAMAYLAN CITY 96,132 160 MALAYBALAY CITY 171,434107 ILOILO CITY 416,649 161 OROQUIETA CITY 64,895108 KABANKALAN CITY 180,324 162 OZAMIS CITY 124,248109 LA CARLOTA CITY 63,010 163 TANGUB CITY 51,344110 PASSI CITY 69,354 164 VALENCIA CITY 169,991111 ROXAS CITY 160,316112 SAGAY CITY 149,623113 SAN CARLOS CITY 111,375114 SILAY CITY 165,687 Region 11 REGION 11 4,164,728115 SIPALAY CITY 82,364 116 TALISAY CITY 82,762 165 COMPOSTELLA VALLEY 688,838117 VICTORIAS CITY 100,976 166 DAVAO DEL NORTE 890,148
167 DAVAO ORIENTAL 490,797Region 7 REGION 7 6,182,821 168 DAVAO DEL SUR 772,323
118 BOHOL 1,109,016 169 DAVAO CITY 1,322,622119 CEBU 1,908,249120 NEGROS ORIENTAL 811,452121 SIQUIJOR 88,120
Region 12 REGION 12 3,848,885122 BAIS CITY 72,411 123 BAYAWAN CITY 113,282 170 NORTH COTABATO 1,112,153124 CANLAON CITY 50,745 171 SARANGANI 516,719125 CEBU CITY 818,900 172 SOUTH COTABATO 821,449126 DANAO CITY 99,931 173 SULTAN KUDARAT 678,655127 DUMAGUETE CITY 121,368 128 LAPU-LAPU CITY 252,428 174 COTABATO CITY 184,162129 MANDAWE CITY 236,444 175 GEN. SANTOS CITY 535,747130 TAGBILARAN CITY 98,326131 TALISAY CITY 168,981 132 TANJAY CITY 72,323133 TOLEDO CITY 160,845
A.R.M.M. ARMM 2,817,783Region 8 REGION 8 4,219,261
176 BASILAN 275,391134 BILIRAN 167,050 177 LANAO DEL SUR 702,302135 EASTERN SAMAR 437,540 178 MAGUINDANAO 835,732136 NORTHERN LEYTE 1,484,585 179 SULU 579,294137 NORTHERN SAMAR 553,609 180 TAWI-TAWI 285,397138 SOUTHERN LEYTE 319,296139 WESTERN SAMAR 571,528 181 MARAWI CITY 139,667
140 CALBAYOG CITY 163,639141 MAASIN CITY 79,460142 ORMOC CITY 191,129143 TACLOBAN CITY 251,425 CARAGA CARAGA 2,503,254
Region 9 REGION 9 3,325,682 182 AGUSAN DEL NORTE 322,791
183 AGUSAN DEL SUR 767,697144 ZAMBOANGA NORTE 787,171 184 SURIGAO DEL NORTE 399,130145 ZAMBOANGA SUR 787,500 185 SURIGAO DEL SUR 446,614146 ZAMBOANGA SIBUGAY 572,343
186 BISLIG CITY 125,966147 DAPITAN CITY 76,668 187 BUTUAN CITY 307,764148 DIPOLOG CITY 120,602 188 SURIGAO CITY 133,292149 ISABELA CITY 84,833150 PAGADIAN CITY 176,835151 ZAMBOANGA CITY 719,730
By Region, Province & CityPhilippines, 2006
Table 1A.1 - Estimated Population
Area Population Area Population
3
4
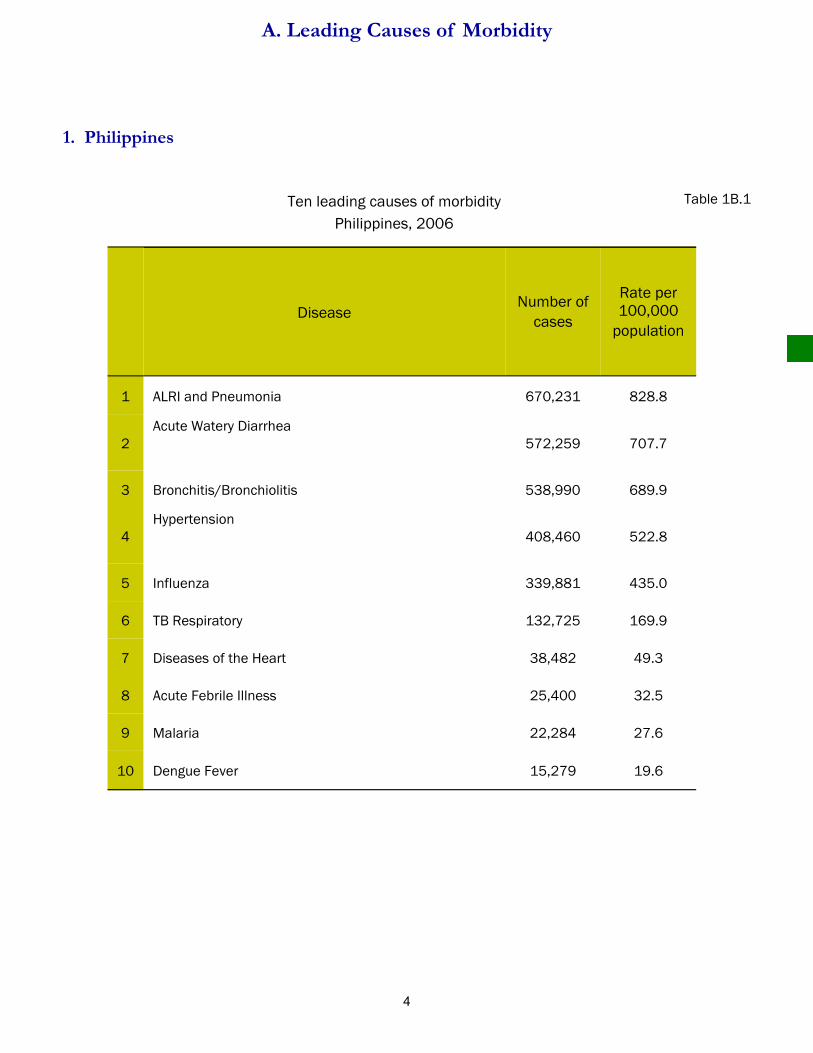
Ten leading causes of morbidity Philippines, 2006
Table 1B.1
Disease Number of
cases
Rate per 100,000
population
1 ALRI and Pneumonia 670,231 828.8
2 Acute Watery Diarrhea
572,259 707.7
3 Bronchitis/Bronchiolitis 538,990 689.9
4 Hypertension
408,460 522.8
5 Influenza 339,881 435.0
6 TB Respiratory 132,725 169.9
7 Diseases of the Heart 38,482 49.3
8 Acute Febrile Illness 25,400 32.5
9 Malaria 22,284 27.6
10 Dengue Fever 15,279 19.6
1. Philippines
A. Leading Causes of Morbidity

5
Female Table 1B.3
Disease Number of
cases
Rate per 100,000
population
1 ALRI and Pneumonia 327,242 767.2
2 Acute Watery Diarrhea 276,432 648.1
3 Bronchitis/Bronchiolitis 271,780 637.2
4 Hypertension 227,082 532.4
5 Influenza 175,829 412.2
6 TB Respiratory 47,639 111.7
7 Diseases of the Heart 20,536 48.1
8 Acute Febrile Illness 12,725 29.8
9 Chickenpox 10,326 24.2
10 Malaria 10,156 23.8
Disease Number of
cases
Rate per 100,000
population
1 ALRI and Pneumonia 342,989 794.5 2 Acute Watery Diarrhea 295,827 685.3 3 Bronchitis/Bronchiolitis 265,320 614.6 4 Hypertension 177,059 410.2 5 Influenza 161,446 374.0 6 TB Respiratory 82,969 192.2 7 Diseases of the Heart 17,946 41.6 8 Acute Febrile Illness 12,675 29.4 9 Malaria 12,128 28.1
10 Dengue Fever 8,076 18.7
Male Table 1B.2
2. By Gender
6
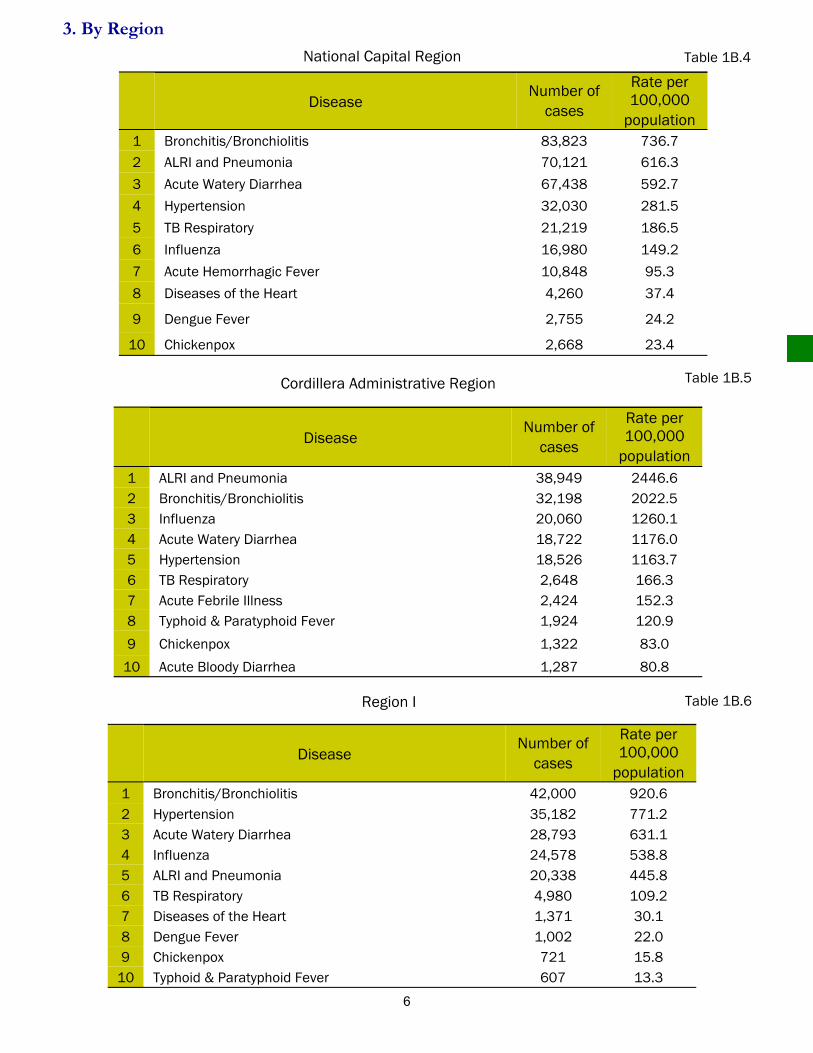
Cordillera Administrative Region Table 1B.5
Disease Number of
cases
Rate per 100,000
population 1 ALRI and Pneumonia 38,949 2446.6 2 Bronchitis/Bronchiolitis 32,198 2022.5 3 Influenza 20,060 1260.1 4 Acute Watery Diarrhea 18,722 1176.0 5 Hypertension 18,526 1163.7 6 TB Respiratory 2,648 166.3 7 Acute Febrile Illness 2,424 152.3 8 Typhoid & Paratyphoid Fever 1,924 120.9
9 Chickenpox 1,322 83.0
10 Acute Bloody Diarrhea 1,287 80.8
Region I Table 1B.6
Disease Number of
cases
Rate per 100,000
population 1 Bronchitis/Bronchiolitis 42,000 920.6 2 Hypertension 35,182 771.2 3 Acute Watery Diarrhea 28,793 631.1 4 Influenza 24,578 538.8 5 ALRI and Pneumonia 20,338 445.8 6 TB Respiratory 4,980 109.2 7 Diseases of the Heart 1,371 30.1 8 Dengue Fever 1,002 22.0 9 Chickenpox 721 15.8
10 Typhoid & Paratyphoid Fever 607 13.3
Disease Number of
cases
Rate per 100,000
population 1 Bronchitis/Bronchiolitis 83,823 736.7 2 ALRI and Pneumonia 70,121 616.3
3 Acute Watery Diarrhea 67,438 592.7
4 Hypertension 32,030 281.5
5 TB Respiratory 21,219 186.5
6 Influenza 16,980 149.2
7 Acute Hemorrhagic Fever 10,848 95.3
8 Diseases of the Heart 4,260 37.4
9 Dengue Fever 2,755 24.2
10 Chickenpox 2,668 23.4
National Capital Region Table 1B.4
3. By Region

7
Region III Table 1B.8
Disease Number of
cases
Rate per 100,000
population 1 Acute Watery Diarrhea 52,266 783.6 2 Hypertension 37,321 559.5 3 Bronchitis/Bronchiolitis 36,210 542.9 4 ALRI and Pneumonia 24,236 363.4 5 TB Respiratory 23,839 357.4 6 Influenza 9,293 139.3 7 Diseases of the Heart 8,169 122.5 8 Dengue Fever 2,481 37.2 9 Chickenpox 1,919 28.8
10 Malaria 794 11.9
Region IV-A (CALABARZON) Table 1B.9
Disease Number of
cases
Rate per 100,000
population 1 ALRI and Pneumonia 71,667 684.2 2 Acute Watery Diarrhea 63,540 606.6 3 Hypertension 58,797 561.3 4 Influenza 36,910 352.4 5 Bronchitis/Bronchiolitis 23,137 220.9 6 TB Respiratory 13,346 127.4 7 Acute Febrile Illness 3,956 37.8
8 Diseases of the Heart 2,563 24.5
9 Chickenpox 2,161 20.6 10 Dengue Fever 1,848 17.6
Disease Number of
cases
Rate per 100,000
population 1 Influenza 34,897 1118.0 2 Acute Watery Diarrhea 27,971 896.1 3 Bronchitis/Bronchiolitis 27,064 867.1 4 ALRI and Pneumonia 23,498 752.8 5 Hypertension 19,870 636.6 6 Diseases of the Heart 4,545 145.6 7 TB Respiratory 4,237 135.7 8 Malaria 2,437 78.1 9 Typhoid & Paratyphoid Fever 863 27.6
10 Dengue Fever 549 17.6
Region II Table 1B.7

8
Region V Table 1B.11
Disease Number of
cases
Rate per 100,000
population 1 ALRI and Pneumonia 71,136 1356.2 2 Bronchitis/Bronchiolitis 45,964 876.3 3 Acute Watery Diarrhea 39,211 747.6 4 Hypertension 35,279 672.6 5 Influenza 28,392 541.3 6 TB Respiratory 5,201 99.2 7 Acute Bloody Diarrhea 1,237 23.6 8 Chickenpox 1,126 21.5 9 Poisoning 371 7.1
10 Viral Hepatitis 351 6.7
Region VI Table 1B.12
Disease Number of
cases
Rate per 100,000
population
1 ALRI and Pneumonia 87,106 1244.0 2 Acute Watery Diarrhea 39,063 557.0 3 Bronchitis/Bronchiolitis 31,194 445.5 4 Hypertension 28,973 413.8 5 Influenza 22,724 324.5 6 TB Respiratory 14,017 200.2 7 Acute Bloody Diarrhea 1,576 22.5 8 Viral Hepatitis 1,493 21.3 9 Typhoid & Paratyphoid Fever 1,396 19.9
10 Diseases of the Heart 1,333 19.0
Disease Number of
cases
Rate per 100,000
population 1 Acute Watery Diarrhea 23,518 932.5 2 Influenza 23,053 914.1 3 Bronchitis/Bronchiolitis 18,692 741.2 4 Hypertension 12,605 499.8 5 Malaria 14,027 556.2
6 ALRI and Pneumonia 6,975 276.6
7 TB Respiratory 5,026 199.3 8 Diseases of the Heart 1,359 53.9
9 Chickenpox 760 30.1
10 Dengue Fever 255 10.1
Region IV-B (MIMAROPA) Table1B.10

9
Region VIII Table 1B.14
Disease Number of
cases
Rate per 100,000
population 1 ALRI and Pneumonia 52,058 1233.8 2 Bronchitis/Bronchiolitis 37,915 898.6 3 Acute Watery Diarrhea 29,543 700.2 4 Hypertension 16,421 389.2 5 Influenza 8,548 202.6 6 TB Respiratory 6,144 145.6 7 Diseases of the Heart 5,398 127.9 8 Chickenpox 1,582 37.5 9 TB Other Forms 792 18.8
10 Measles 415 9.8
Region IX Table 1B.15
Disease Number of
cases
Rate per 100,000
population 1 Bronchitis/Bronchiolitis 34,972 1051.6 2 Influenza 30,957 930.8 3 Acute Watery Diarrhea 29,859 897.8 4 Hypertension 27,350 822.4 5 ALRI and Pneumonia 24,778 745.1 6 TB Respiratory 6,478 194.8 7 Diseases of the Heart 2,245 67.5 8 Typhoid & Paratyphoid Fever 1,673 50.3 9 Chickenpox 1,302 39.1
10 Dengue Fever 896 26.9
Disease Number of
cases
Rate per 100,000
population
1 ALRI and Pneumonia 79,267 1282.1
2 Acute Watery Diarrhea 66,124 1069.5
3 Bronchitis/Bronchiolitis 43,933 711.5
4 Influenza 31,713 512.9
5 Hypertension 29,376 475.1
6 Acute Febrile Illness 8,175 132.2
7 TB Respiratory 6,512 105.3
8 Diseases of the Heart 2,435 39.4
9 Chickenpox 2,045 33.1
10 Dengue Fever 1,681 27.2
Region VII Table 1B.13
10
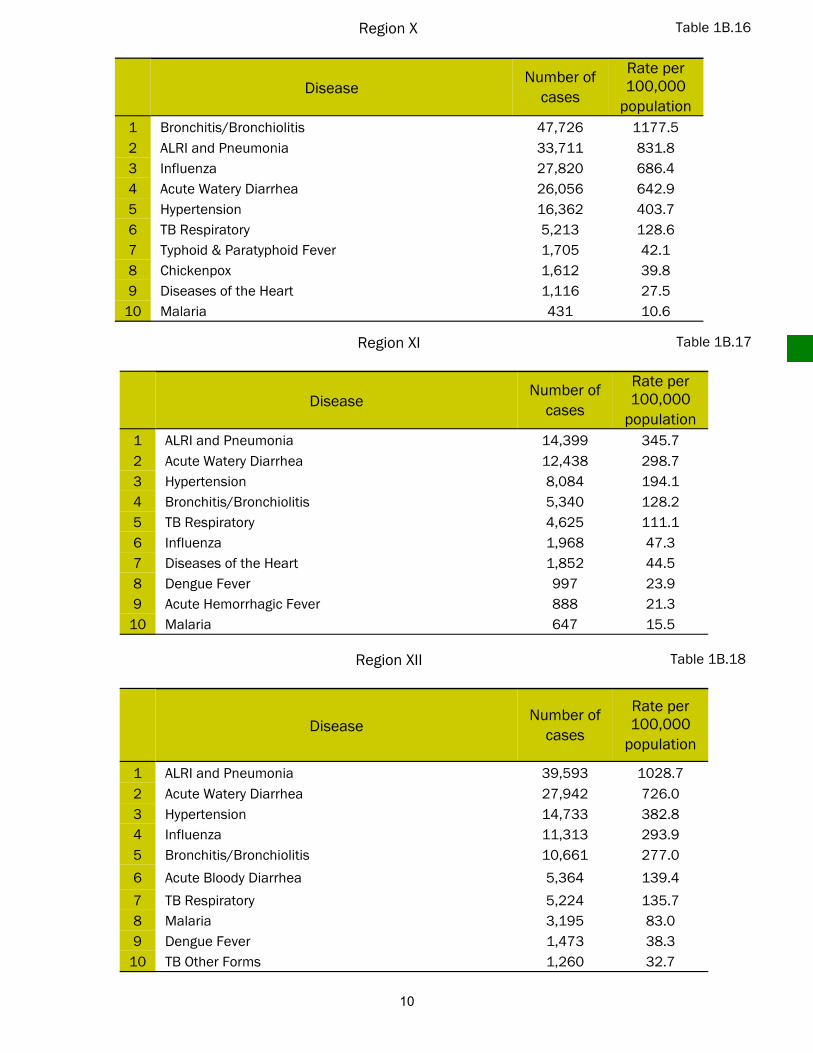
Region XI Table 1B.17
Disease Number of
cases
Rate per 100,000
population 1 ALRI and Pneumonia 14,399 345.7 2 Acute Watery Diarrhea 12,438 298.7 3 Hypertension 8,084 194.1 4 Bronchitis/Bronchiolitis 5,340 128.2 5 TB Respiratory 4,625 111.1 6 Influenza 1,968 47.3 7 Diseases of the Heart 1,852 44.5 8 Dengue Fever 997 23.9 9 Acute Hemorrhagic Fever 888 21.3
10 Malaria 647 15.5
Region XII Table 1B.18
Disease Number of
cases
Rate per 100,000
population
1 ALRI and Pneumonia 39,593 1028.7 2 Acute Watery Diarrhea 27,942 726.0 3 Hypertension 14,733 382.8 4 Influenza 11,313 293.9 5 Bronchitis/Bronchiolitis 10,661 277.0
6 Acute Bloody Diarrhea 5,364 139.4
7 TB Respiratory 5,224 135.7 8 Malaria 3,195 83.0 9 Dengue Fever 1,473 38.3
10 TB Other Forms 1,260 32.7
Disease Number of
cases
Rate per 100,000
population 1 Bronchitis/Bronchiolitis 47,726 1177.5 2 ALRI and Pneumonia 33,711 831.8 3 Influenza 27,820 686.4 4 Acute Watery Diarrhea 26,056 642.9 5 Hypertension 16,362 403.7 6 TB Respiratory 5,213 128.6 7 Typhoid & Paratyphoid Fever 1,705 42.1 8 Chickenpox 1,612 39.8 9 Diseases of the Heart 1,116 27.5
10 Malaria 431 10.6
Region X Table 1B.16

11
Region CARAGA
Table 1B.20
Disease Number of
cases
Rate per 100,000
population 1 Acute Watery Diarrhea 21,679 866.0 2 Bronchitis/Bronchiolitis 18,101 723.1 3 Hypertension 17,551 701.1 4 ALRI and Pneumonia 16,006 639.4 5 Influenza 10,675 426.4 6 TB Respiratory 4,016 160.4 7 Schistosomiasis 1,576 63.0 8 Chickenpox 1,110 44.3 9 Diseases of the Heart 1,001 40.0
10 Malaria 654 26.1

1. Crude death rate (CDR) - Philippines and Regions
Figure 1C.1
Figure 1C.2 Philippines and Regions, 2006
B. Mortality
Crude death rates, Philippines and Regions, 2006
Proportion of death by sex,
4.35.2
4.05.2
4.04.4
3.94.1
4.85.6
5.04.6
3.23.7
4.03.0
1.23.4
0.0 1.0 2.0 3.0 4.0 5.0 6.0
Phillippines
NCR
CAR
I
II
III
IV-A
IV-B
V
VI
VII
VIII
IX
X
XI
XII
ARMM
CARAGA
Reg
ion
Rate per 100,000 population
0% 10% 20% 30% 40% 50% 60% 70% 80% 90% 100%
Phillippines
NCR
CAR
I
II
III
IV-A
IV-B
V
VI
VII
VIII
IX
X
XI
XII
ARMM
CARAGA
Reg
ion
Percent
Male
Female
12
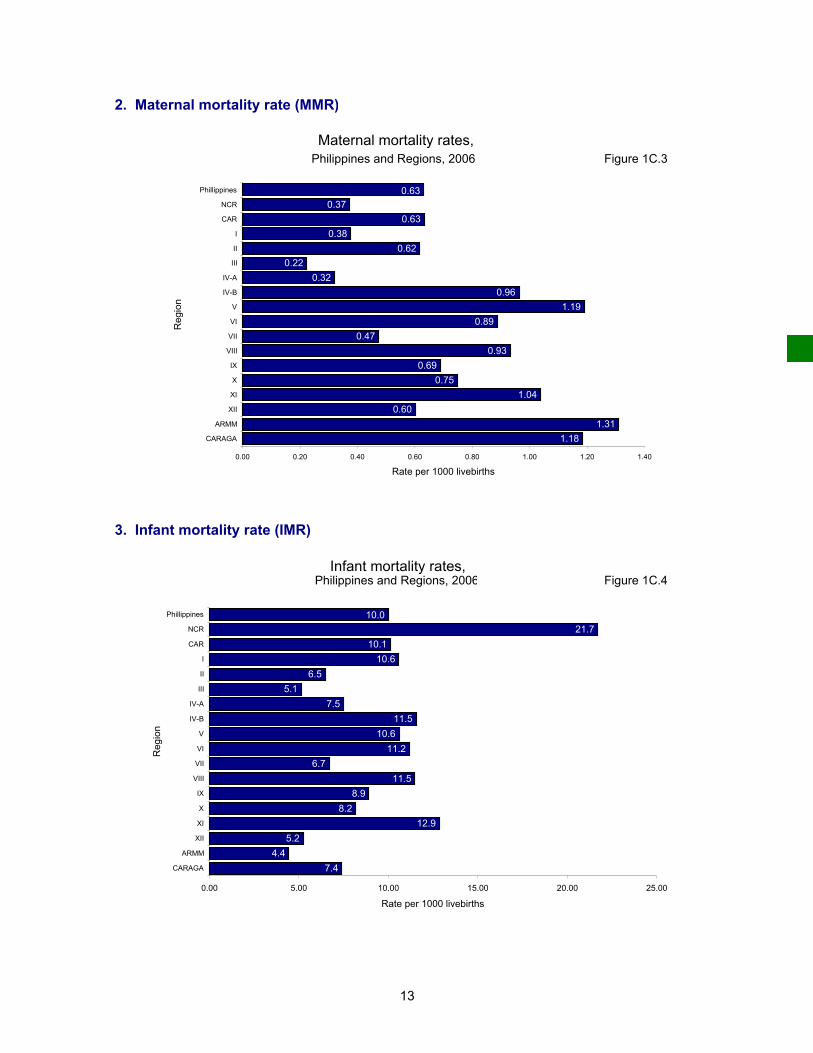
2. Maternal mortality rate (MMR)
Figure 1C.3
3. Infant mortality rate (IMR)
Figure 1C.4
Maternal mortality rates, Philippines and Regions, 2006
Infant mortality rates, Philippines and Regions, 2006
0.630.37
0.630.38
0.620.22
0.320.96
1.190.89
0.470.93
0.690.75
1.040.60
1.311.18
0.00 0.20 0.40 0.60 0.80 1.00 1.20 1.40
Phillippines
NCR
CAR
I
II
III
IV-A
IV-B
V
VI
VII
VIII
IX
X
XI
XII
ARMM
CARAGA
Reg
ion
Rate per 1000 livebirths
10.021.7
10.110.6
6.55.1
7.511.5
10.611.2
6.711.5
8.98.2
12.95.2
4.47.4
0.00 5.00 10.00 15.00 20.00 25.00
Phillippines
NCR
CAR
I
II
III
IV-A
IV-B
V
VI
VII
VIII
IX
X
XI
XII
ARMM
CARAGA
Reg
ion
Rate per 1000 livebirths
13
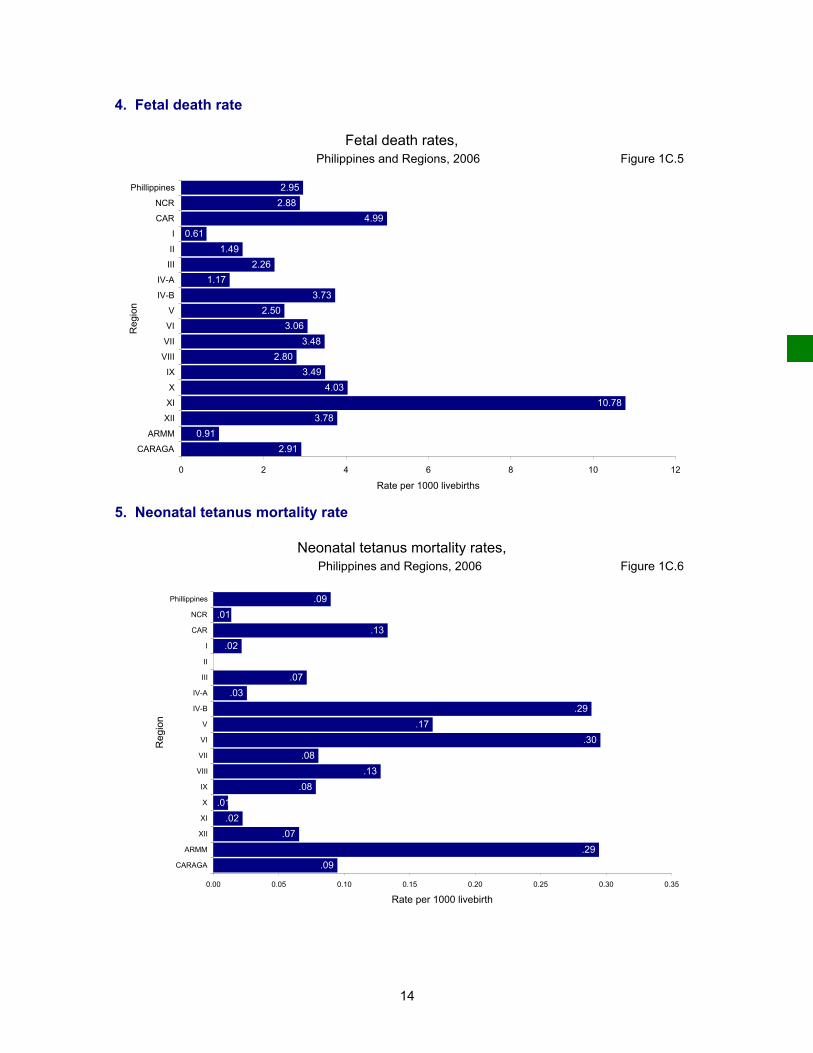
4. Fetal death rate
Figure 1C.5
5. Neonatal tetanus mortality rate
Figure 1C.6
Fetal death rates, Philippines and Regions, 2006
Neonatal tetanus mortality rates, Philippines and Regions, 2006
2.952.88
4.990.61
1.492.26
1.173.73
2.503.06
3.482.80
3.494.03
10.783.78
0.912.91
0 2 4 6 8 10 12
Phillippines
NCR
CAR
I
II
III
IV-A
IV-B
V
VI
VII
VIII
IX
X
XI
XII
ARMM
CARAGA
Reg
ion
Rate per 1000 livebirths
.09.01
.13.02
.00.07
.03.29
.17.30
.08.13
.08.01
.02.07
.29.09
0.00 0.05 0.10 0.15 0.20 0.25 0.30 0.35
Phillippines
NCR
CAR
I
II
III
IV-A
IV-B
V
VI
VII
VIII
IX
X
XI
XII
ARMM
CARAGA
Reg
ion
Rate per 1000 livebirth
14

Region Total Total Death
Province/ Population Male Female Deaths RateCity Code Col 4 / Col 1Number 1 2 3 4 5
Phillippines 85,822,854 215,248 154,781 372,489 4.3
NCR 11,394,158 34,168 24,831 58,999 5.2
1 16,250 74 39 113 7.02 424,313 727 546 1,273 3.03 267,778 683 435 1,118 4.24 56,038 121 103 224 4.05 104,708 428 390 818 7.86 649,355 735 517 1,252 1.9 7 1,379,141 2,605 1,906 4,511 3.38 747,048 1,265 986 2,251 3.09 486,323 1,444 1,155 2,599 5.3
10 296,663 684 715 1,399 4.711 1,429,111 10,615 7,547 18,162 12.712 462,560 1,275 891 2,166 4.713 656,464 1,462 957 2,419 3.714 518,297 1,513 1,089 2,602 5.015 423,694 1,202 889 2,091 4.916 595,258 1,695 1,142 2,837 4.817 2,272,010 6,476 4,627 11,103 4.918 609,147 1,164 897 2,061 3.4
CAR 1,591,963 3,751 2,644 6,395 4.0
19 225,984 543 434 977 4.320 103,567 206 161 367 3.521 380,348 732 449 1,181 3.122 187,943 392 293 685 3.623 189,457 400 264 664 3.524 157,160 481 395 876 5.6
25 347,504 997 648 1,645 4.7
Region 1 4,562,030 13,405 10,535 23,940 5.2
26 455,704 1,389 1,075 2,464 5.427 527,442 1,621 1,391 3,012 5.728 609,700 1,911 1,437 3,348 5.529 2,134,297 5,724 4,506 10,230 4.8
30 80,794 204 158 362 4.531 52,376 199 161 360 6.932 147,023 639 443 1,082 7.433 104,181 187 136 323 3.134 162,209 580 481 1,061 6.535 115,494 353 315 668 5.836 125,989 414 288 702 5.637 46,821 184 144 328 7.0
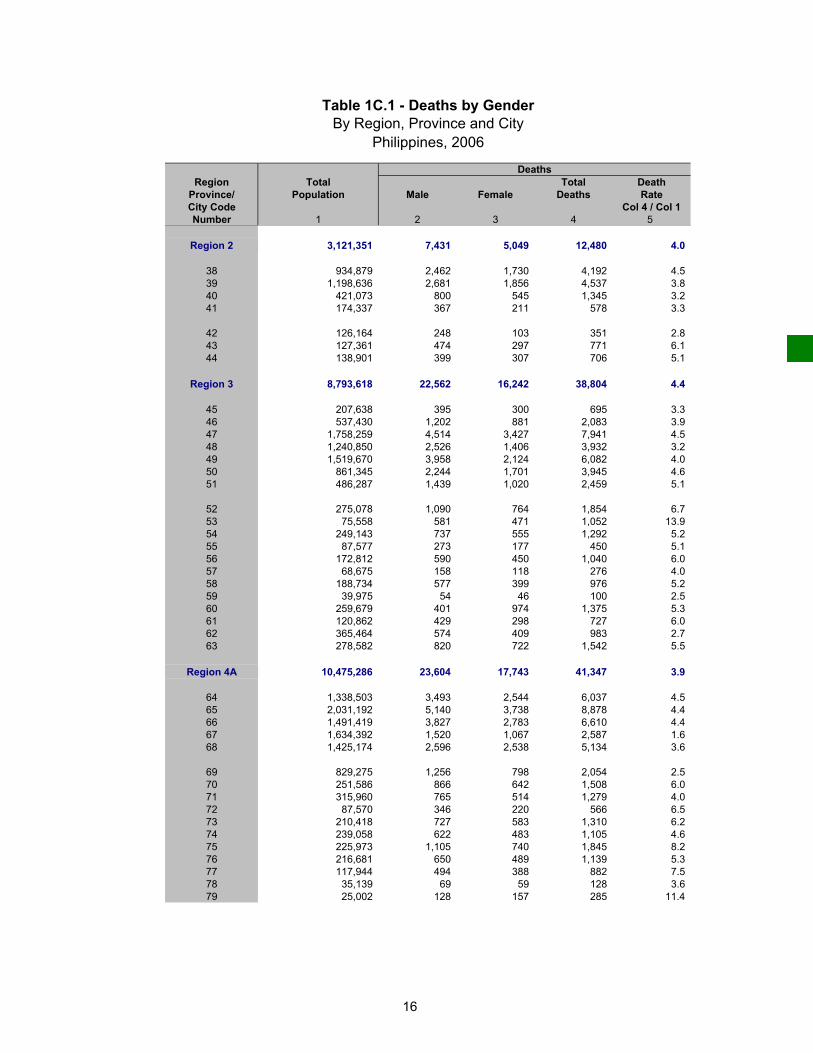
Table 1C.1 - Deaths by GenderBy Region, Province and City
Philippines, 2006
Deaths
15
Region Total Total Death
Province/ Population Male Female Deaths RateCity Code Col 4 / Col 1Number 1 2 3 4 5
Table 1C.1 - Deaths by GenderBy Region, Province and City
Philippines, 2006
Deaths
Region 2 3,121,351 7,431 5,049 12,480 4.0
38 934,879 2,462 1,730 4,192 4.539 1,198,636 2,681 1,856 4,537 3.840 421,073 800 545 1,345 3.241 174,337 367 211 578 3.3
42 126,164 248 103 351 2.843 127,361 474 297 771 6.144 138,901 399 307 706 5.1
Region 3 8,793,618 22,562 16,242 38,804 4.4
45 207,638 395 300 695 3.346 537,430 1,202 881 2,083 3.947 1,758,259 4,514 3,427 7,941 4.548 1,240,850 2,526 1,406 3,932 3.249 1,519,670 3,958 2,124 6,082 4.050 861,345 2,244 1,701 3,945 4.651 486,287 1,439 1,020 2,459 5.1
52 275,078 1,090 764 1,854 6.753 75,558 581 471 1,052 13.954 249,143 737 555 1,292 5.255 87,577 273 177 450 5.156 172,812 590 450 1,040 6.057 68,675 158 118 276 4.058 188,734 577 399 976 5.259 39,975 54 46 100 2.560 259,679 401 974 1,375 5.361 120,862 429 298 727 6.062 365,464 574 409 983 2.763 278,582 820 722 1,542 5.5
Region 4A 10,475,286 23,604 17,743 41,347 3.9
64 1,338,503 3,493 2,544 6,037 4.565 2,031,192 5,140 3,738 8,878 4.466 1,491,419 3,827 2,783 6,610 4.467 1,634,392 1,520 1,067 2,587 1.668 1,425,174 2,596 2,538 5,134 3.6
69 829,275 1,256 798 2,054 2.570 251,586 866 642 1,508 6.071 315,960 765 514 1,279 4.072 87,570 346 220 566 6.573 210,418 727 583 1,310 6.274 239,058 622 483 1,105 4.675 225,973 1,105 740 1,845 8.276 216,681 650 489 1,139 5.377 117,944 494 388 882 7.578 35,139 69 59 128 3.679 25,002 128 157 285 11.4
16

Region Total Total Death
Province/ Population Male Female Deaths RateCity Code Col 4 / Col 1Number 1 2 3 4 5
Table 1C.1 - Deaths by GenderBy Region, Province and City
Philippines, 2006
Deaths
Region 4B 2,521,970 4,585 3,228 10,273 4.1
80 219,099 769 652 1,421 6.581 417,381 770 478 1,248 3.082 625,321 - - 2,460 3.983 668,040 1,211 769 1,980 3.084 279,035 813 669 1,482 5.3
85 123,991 407 290 697 5.686 189,103 615 370 985 5.2
Region 5 5,245,066 13,404 11,763 25,167 4.8
87 1,045,530 1,937 3,329 5,266 5.088 576,646 1,485 1,017 2,502 4.389 1,536,560 3,565 2,725 6,290 4.190 250,833 770 554 1,324 5.391 723,334 1,665 1,160 2,825 3.992 670,194 2,267 1,629 3,896 5.8
93 90,455 355 272 627 6.994 188,683 753 609 1,362 7.295 162,831 607 468 1,075 6.6
Region 6 7,001,978 22,733 16,686 39,419 5.6
96 495,879 1,896 1,647 3,543 7.197 521,159 1,704 1,285 2,989 5.798 593,878 1,593 1,193 2,786 4.799 153,100 432 272 704 4.6
100 1,635,350 4,419 3,482 7,901 4.8101 994,316 2,588 1,723 4,311 4.3
102 529,559 2,639 1,854 4,493 8.5103 170,161 441 302 743 4.4104 132,122 408 259 667 5.0105 97,882 204 213 417 4.3106 96,132 300 251 551 5.7107 416,649 2,726 1,970 4,696 11.3108 180,324 407 269 676 3.7109 63,010 256 140 396 6.3110 69,354 208 139 347 5.0111 160,316 807 530 1,337 8.3112 149,623 232 148 380 2.5113 111,375 387 374 761 6.8114 165,687 433 247 680 4.1115 82,364 139 89 228 2.8116 82,762 262 133 395 4.8117 100,976 252 166 418 4.1
17

Region Total Total Death
Province/ Population Male Female Deaths RateCity Code Col 4 / Col 1Number 1 2 3 4 5
Table 1C.1 - Deaths by GenderBy Region, Province and City
Philippines, 2006
Deaths
Region 7 6,182,821 18,568 12,042 30,610 5.0
118 1,109,016 5,818 2,302 8,120 7.3119 1,908,249 4,703 3,881 8,584 4.5120 811,452 1,714 1,179 2,893 3.6121 88,120 296 230 526 6.0
122 72,411 182 111 293 4.0123 113,282 154 115 269 2.4124 50,745 156 105 261 5.1125 818,900 2,411 1,805 4,216 5.1126 99,931 368 239 607 6.1127 121,368 508 326 834 6.9128 252,428 759 593 1,352 5.4129 236,444 619 435 1,054 4.5130 98,326 221 173 394 4.0131 168,981 281 227 508 3.0132 72,323 151 142 293 4.1133 160,845 227 179 406 2.5
Region 8 4,219,261 11,103 8,500 19,603 4.6
134 167,050 441 350 791 4.7135 437,540 1,024 704 1,728 3.9136 1,484,585 3,445 2,732 6,177 4.2137 553,609 1,580 1,156 2,736 4.9138 319,296 1,320 1,212 2,532 7.9139 571,528 1,003 591 1,594 2.8
140 163,639 438 289 727 4.4141 79,460 282 265 547 6.9142 191,129 521 383 904 4.7143 251,425 1,049 818 1,867 7.4
Region 9 3,325,682 6,379 4,124 10,503 3.2
144 787,171 987 640 1,627 2.1145 787,500 1,189 798 1,987 2.5146 572,343 819 514 1,333 2.3
147 76,668 220 165 385 5.0148 120,602 379 266 645 5.3149 84,833 237 142 379 4.5150 176,835 498 342 840 4.8151 719,730 2,050 1,257 3,307 4.6
18

Region Total Total Death
Province/ Population Male Female Deaths RateCity Code Col 4 / Col 1Number 1 2 3 4 5
Table 1C.1 - Deaths by GenderBy Region, Province and City
Philippines, 2006
Deaths
Region 10 4,053,020 8,927 5,896 14,823 3.7
152 918,392 1,488 807 2,295 2.5153 78,788 317 205 522 6.6154 546,447 825 592 1,417 2.6155 290,686 677 533 1,210 4.2156 577,472 1,105 842 1,947 3.4
157 593,421 1,674 1,127 2,801 4.7158 92,591 403 180 583 6.3159 373,311 811 580 1,391 3.7160 171,434 506 267 773 4.5161 64,895 246 182 428 6.6162 124,248 396 307 703 5.7163 51,344 154 104 258 5.0164 169,991 325 170 495 2.9
Region 11 4,164,728 10,127 6,430 16,557 4.0
165 688,838 1,885 1,102 2,987 4.3166 890,148 1,798 1,224 3,022 3.4167 490,797 1,056 606 1,662 3.4168 772,323 1,138 703 1,841 2.4
169 1,322,622 4,250 2,795 7,045 5.3
Region 12 3,848,885 7,256 4,379 11,635 3.0
170 1,112,153 1,950 1,174 3,124 2.8171 516,719 657 400 1,057 2.0172 821,449 1,755 1,142 2,897 3.5173 678,655 1,178 698 1,876 2.8
174 184,162 326 192 518 2.8175 535,747 1,390 773 2,163 4.0
ARMM 2,817,783 2,098 1,359 3,457 1.2
176 275,391 344 229 573 2.1177 702,302 748 507 1,255 1.8178 835,732 543 310 853 1.0179 579,294 405 277 682 1.2180 285,397 - - 0 0.0
181 139,667 58 36 94 0.7
CARAGA 2,503,254 5,147 3,330 8,477 3.4
182 322,791 688 458 1,146 3.6183 767,697 883 541 1,424 1.9184 399,130 944 643 1,587 4.0185 446,614 978 642 1,620 3.6
186 125,966 295 150 445 3.5187 307,764 916 559 1,475 4.8188 133,292 443 337 780 5.9
19

Region
Province/ Livebirths No. Rate No. Rate No. Rate No. RateCity Code C2/C1 C4/C1 C6/C1 C8/C1Number 1 2 3 4 5 6 7 8 9
Phillippines 1,775,480 1,120 0.6 17,759 10.0 5,244 3.0 159 0.09
NCR 219,722 82 0.4 4,772 21.7 632 2.9 3 0.01
1 316 0 0.0 9 28.5 5 15.8 0 0.02 3,944 0 0.0 42 10.6 0 0.0 0 0.03 3,328 0 0.0 45 13.5 2 0.6 0 0.04 696 0 0.0 9 12.9 2 2.9 0 0.05 1,184 0 0.0 20 16.9 6 5.1 0 0.06 8,348 1 0.1 22 2.6 0 0.0 2 0.2 7 25,308 4 0.2 223 8.8 78 3.1 0 0.08 7,319 3 0.4 188 25.7 49 6.7 0 0.09 11,631 4 0.3 121 10.4 52 4.5 0 0.0
10 5,338 2 0.4 84 15.7 28 5.2 0 0.011 66,184 17 0.3 2,263 34.2 0 0.0 0 0.012 9,301 4 0.4 42 4.5 54 5.8 0 0.013 8,685 3 0.3 196 22.6 9 1.0 0 0.014 7,579 1 0.1 144 19.0 70 9.2 0 0.015 6,241 3 0.5 162 26.0 0 0.0 0 0.016 7,937 10 1.3 179 22.6 33 4.2 0 0.017 37,887 21 0.6 875 23.1 174 4.6 1 0.018 8,496 9 1.1 148 17.4 70 8.2 0 0.0
CAR 30,053 19 0.6 304 10.1 150 5.0 4 0.13
19 4,038 1 0.2 19 4.7 2 0.5 2 0.520 1,959 4 2.0 23 11.7 7 3.6 0 0.021 7,189 1 0.1 48 6.7 14 1.9 0 0.022 4,142 5 1.2 38 9.2 21 5.1 0 0.023 3,717 4 1.1 33 8.9 22 5.9 0 0.024 2,964 2 0.7 47 15.9 45 15.2 2 0.7
25 6,044 2 0.3 96 15.9 39 6.5 0 0.0
Region 1 92,845 35 0.4 983 10.6 57 0.6 2 0.02
26 7,390 0 0.0 53 7.2 10 1.4 0 0.027 9,583 3 0.3 71 7.4 0 0.0 0 0.028 12,347 3 0.2 125 10.1 0 0.0 1 0.129 43,525 17 0.4 471 10.8 11 0.3 0 0.0
30 1,967 0 0.0 15 7.6 0 0.0 0 0.031 1,076 1 0.9 9 8.4 7 6.5 1 0.932 3,451 3 0.9 78 22.6 29 8.4 0 0.033 3,161 1 0.3 11 3.5 0 0.0 0 0.034 3,604 1 0.3 73 20.3 0 0.0 0 0.035 3,609 2 0.6 41 11.4 0 0.0 0 0.036 2,152 2 0.9 20 9.3 0 0.0 0 0.037 980 2 2.0 16 16.3 0 0.0 0 0.0
Table 1C.2 - Maternal, Infant, Neonatal Tetanus Deaths & StillbirthsBy Region, Province and City
Philippines, 2006
Neonatal TetanusMaternalDeaths Deaths
StillbirthsInfantDeaths
20

Region
Province/ Livebirths No. Rate No. Rate No. Rate No. RateCity Code C2/C1 C4/C1 C6/C1 C8/C1Number 1 2 3 4 5 6 7 8 9
Table 1C.2 - Maternal, Infant, Neonatal Tetanus Deaths & StillbirthsBy Region, Province and City
Philippines, 2006
Neonatal TetanusMaternalDeaths Deaths
StillbirthsInfantDeaths
Region 2 63,138 39 0.6 409 6.5 94 1.5 0 0.0
38 17,436 9 0.5 117 6.7 27 1.5 0 0.039 25,603 16 0.6 146 5.7 27 1.1 0 0.040 8,879 8 0.9 28 3.2 3 0.3 0 0.041 3,753 1 0.3 23 6.1 9 2.4 0 0.0
42 1,863 0 0.0 21 11.3 0 0.0 0 0.043 3,140 3 1.0 51 16.2 14 4.5 0 0.044 2,464 2 0.8 23 9.3 14 5.7 0 0.0
Region 3 196,341 44 0.2 1,006 5.1 444 2.3 14 0.07
45 4,464 5 1.1 35 7.8 4 0.9 1 0.246 9,925 8 0.8 83 8.4 115 11.6 0 0.047 46,040 4 0.1 251 5.5 78 1.7 3 0.148 19,085 0 0.0 102 5.3 0 0.0 0 0.049 26,196 1 0.04 75 2.9 18 0.7 0 0.050 17,373 1 0.1 59 3.4 22 1.3 0 0.051 8,670 5 0.6 99 11.4 30 3.5 8 0.9
52 10,670 2 0.2 23 2.2 26 2.4 0 0.053 5,224 7 1.3 29 5.6 94 18.0 0 0.054 5,566 4 0.7 25 4.5 0 0.0 0 0.055 2,084 0 0.0 11 5.3 1 0.5 0 0.056 3,115 0 0.0 29 9.3 5 1.6 0 0.057 1,124 1 0.9 3 2.7 2 1.8 0 0.058 4,919 2 0.4 39 7.9 9 1.8 0 0.059 429 0 0.0 2 4.7 0 0.0 0 0.060 4,577 0 0.0 8 1.7 10 2.2 0 0.061 2,737 3 1.1 45 16.4 21 7.7 0 0.062 15,353 0 0.0 26 1.7 5 0.3 2 0.163 8,790 1 0.1 62 7.1 4 0.5 0 0.0
Region 4A 234,467 75 0.3 1,759 7.5 275 1.2 6 0.03
64 33,642 3 0.1 189 5.6 65 1.9 0 0.065 52,378 12 0.2 335 6.4 70 1.3 0 0.066 29,568 7 0.2 266 9.0 0 0.0 0 0.067 36,415 5 0.1 105 2.9 33 0.9 0 0.068 25,780 4 0.2 112 4.3 15 0.6 2 0.1
69 15,310 18 1.2 101 6.6 27 1.8 0 0.070 6,230 0 0.0 117 18.8 0 0.0 0 0.071 5,883 0 0.0 65 11.0 0 0.0 0 0.072 1,946 0 0.0 37 19.0 3 1.5 0 0.073 5,393 4 0.7 56 10.4 32 5.9 0 0.074 3,688 4 1.1 114 30.9 0 0.0 0 0.075 7,663 13 1.7 103 13.4 0 0.0 0 0.076 4,835 4 0.8 75 15.5 0 0.0 0 0.077 2,485 1 0.4 44 17.7 13 5.2 0 0.078 1,191 0 0.0 3 2.5 5 4.2 0 0.079 2,060 0 0.0 37 18.0 12 5.8 4 1.9
21

Region
Province/ Livebirths No. Rate No. Rate No. Rate No. RateCity Code C2/C1 C4/C1 C6/C1 C8/C1Number 1 2 3 4 5 6 7 8 9
Table 1C.2 - Maternal, Infant, Neonatal Tetanus Deaths & StillbirthsBy Region, Province and City
Philippines, 2006
Neonatal TetanusMaternalDeaths Deaths
StillbirthsInfantDeaths
Region 4B 51,949 50 1.0 600 11.5 194 3.7 15 0.29
80 4,458 1 0.2 47 10.5 52 11.7 3 0.781 8,885 6 0.7 82 9.2 24 2.7 7 0.882 12,244 2 0.2 75 6.1 19 1.6 3 0.283 15,361 33 2.1 197 12.8 49 3.2 2 0.184 5,268 3 0.6 68 12.9 18 3.4 0 0.0
85 2,365 0 0.0 42 17.8 7 3.0 0 0.086 3,368 5 1.5 89 26.4 25 7.4 0 0.0
Region 5 113,434 135 1.2 1,202 10.6 284 2.5 19 0.17
87 22,051 11 0.5 216 9.8 48 2.2 0 0.088 10,794 12 1.1 162 15.0 71 6.6 9 0.889 28,924 26 0.9 285 9.9 70 2.4 6 0.290 5,251 3 0.6 41 7.8 5 1.0 0 0.091 20,811 27 1.3 241 11.6 53 2.5 2 0.192 16,522 42 2.5 118 7.1 37 2.2 2 0.1
93 2,084 1 0.5 28 13.4 0 0.0 0 0.094 2,981 9 3.0 39 13.1 0 0.0 0 0.095 4,016 4 1.0 72 17.9 0 0.0 0 0.0
Region 6 128,560 114 0.9 1,437 11.2 394 3.1 38 0.30
96 8,066 10 1.2 82 10.2 25 3.1 1 0.197 9,742 5 0.5 126 12.9 24 2.5 0 0.098 8,294 8 1.0 74 8.9 25 3.0 1 0.199 2,794 1 0.4 24 8.6 7 2.5 0 0.0
100 28,676 10 0.3 307 10.7 79 2.8 1 0.0101 19,296 16 0.8 165 8.6 68 3.5 1 0.1
102 12,697 11 0.9 135 10.6 46 3.6 0 0.0103 1,178 0 0.0 24 20.4 5 4.2 0 0.0104 2,285 1 0.4 8 3.5 0 0.0 0 0.0105 1,618 3 1.9 20 12.4 0 0.0 0 0.0106 2,007 0 0.0 14 7.0 4 2.0 0 0.0107 10,372 29 2.8 263 25.4 60 5.8 2 0.2108 2,261 3 1.3 35 15.5 4 1.8 2 0.9109 1,360 0 0.0 12 8.8 6 4.4 0 0.0110 1,493 1 0.7 17 11.4 2 1.3 0 0.0111 4,306 7 1.6 47 10.9 0 0.0 29 6.7112 2,365 2 0.8 11 4.7 4 1.7 0 0.0113 2,479 4 1.6 33 13.3 0 0.0 0 0.0114 2,463 0 0.0 12 4.9 18 7.3 0 0.0115 1,429 2 1.4 8 5.6 3 2.1 1 0.7116 1,072 0 0.0 5 4.7 3 2.8 0 0.0117 2,307 1 0.4 15 6.5 11 4.8 0 0.0
22

Region
Province/ Livebirths No. Rate No. Rate No. Rate No. RateCity Code C2/C1 C4/C1 C6/C1 C8/C1Number 1 2 3 4 5 6 7 8 9
Table 1C.2 - Maternal, Infant, Neonatal Tetanus Deaths & StillbirthsBy Region, Province and City
Philippines, 2006
Neonatal TetanusMaternalDeaths Deaths
StillbirthsInfantDeaths
Region 7 137,102 65 0.5 918 6.7 477 3.5 11 0.08
118 21,771 10 0.5 198 9.1 84 3.9 0 0.0119 44,927 11 0.2 191 4.3 173 3.9 2 0.04120 13,669 9 0.7 75 5.5 51 3.7 4 0.3121 1,124 0 0.0 12 10.7 1 0.9 0 0.0
122 1,164 1 0.9 5 4.3 0 0.0 0 0.0123 2,286 5 2.2 8 3.5 15 6.6 0 0.0124 906 2 2.2 17 18.8 15 16.6 0 0.0125 19,062 10 0.5 119 6.2 7 0.4 3 0.2126 2,669 1 0.4 74 27.7 30 11.2 0 0.0127 2,558 0 0.0 10 3.9 15 5.9 0 0.0128 9,125 3 0.3 93 10.2 37 4.1 1 0.1129 7,835 0 0.0 83 10.6 44 5.6 0 0.0130 1,682 2 1.2 20 11.9 1 0.6 0 0.0131 4,101 2 0.5 10 2.4 4 1.0 0 0.0132 1,254 9 7.2 1 0.8 0 0.0 1 0.8133 2,969 0 0.0 2 0.7 0 0.0 0 0.0
Region 8 78,306 73 0.9 900 11.5 219 2.8 10 0.13
134 3,505 3 0.9 49 14.0 7 2.0 0 0.0135 8,915 12 1.3 155 17.4 47 5.3 1 0.1136 28,733 12 0.4 244 8.5 93 3.2 1 0.03137 12,898 20 1.6 163 12.6 27 2.1 2 0.2138 6,094 7 1.1 49 8.0 10 1.6 0 0.0139 2,862 9 3.1 94 32.8 14 4.9 3 1.0
140 3,298 2 0.6 13 3.9 0 0.0 0 0.0141 1,631 0 0.0 23 14.1 12 7.4 0 0.0142 5,182 5 1.0 51 9.8 4 0.8 1 0.2143 5,188 3 0.6 59 11.4 5 1.0 2 0.4
Region 9 63,883 44 0.7 570 8.9 223 3.5 5 0.08
144 14,251 7 0.5 49 3.4 26 1.8 0 0.0145 14,503 13 0.9 105 7.2 14 1.0 0 0.0146 10,500 6 0.6 58 5.5 34 3.2 3 0.3
147 1,364 1 0.7 11 8.1 5 3.7 0 0.0148 2,009 0 0.0 40 19.9 18 9.0 1 0.5149 1,959 0 0.0 8 4.1 13 6.6 1 0.5150 2,618 2 0.8 32 12.2 5 1.9 0 0.0151 16,679 15 0.9 267 16.0 108 6.5 0 0.0
23

Region
Province/ Livebirths No. Rate No. Rate No. Rate No. RateCity Code C2/C1 C4/C1 C6/C1 C8/C1Number 1 2 3 4 5 6 7 8 9
Table 1C.2 - Maternal, Infant, Neonatal Tetanus Deaths & StillbirthsBy Region, Province and City
Philippines, 2006
Neonatal TetanusMaternalDeaths Deaths
StillbirthsInfantDeaths
Region 10 89,480 67 0.7 732 8.2 361 4.0 1 0.01
152 22,589 21 0.9 98 4.3 62 2.7 0 0.0153 1,581 1 0.6 31 19.6 1 0.6 0 0.0154 11,727 8 0.7 71 6.1 34 2.9 0 0.0155 4,568 3 0.7 36 7.9 3 0.7 1 0.2156 12,320 6 0.5 68 5.5 0 0.0 0 0.0
157 14,286 12 0.8 194 13.6 106 7.4 0 0.0158 2,129 3 1.4 19 8.9 19 8.9 0 0.0159 9,337 4 0.4 84 9.0 34 3.6 0 0.0160 3,239 9 2.8 66 20.4 72 22.2 0 0.0161 1,044 0 0.0 12 11.5 4 3.8 0 0.0162 2,121 0 0.0 24 11.3 19 9.0 0 0.0163 1,072 0 0.0 14 13.1 1 0.9 0 0.0164 3,467 0 0.0 15 4.3 6 1.7 0 0.0
Region 11 89,626 93 1.0 1,152 12.9 966 10.8 2 0.02
165 14,365 24 1.7 329 22.9 225 15.7 1 0.1166 18,118 11 0.6 260 14.4 177 9.8 0 0.0167 9,595 11 1.1 81 8.4 162 16.9 1 0.1168 18,223 9 0.5 153 8.4 305 16.7 0 0.0
169 29,325 38 1.3 329 11.2 97 3.3 0 0.0
Region 12 76,401 46 0.6 400 5.2 289 3.8 5 0.07
170 20,107 9 0.4 52 2.6 21 1.0 2 0.1171 9,952 7 0.7 40 4.0 66 6.6 0 0.0172 15,637 12 0.8 129 8.2 113 7.2 2 0.1173 13,728 7 0.5 59 4.3 14 1.0 1 0.1
174 2,659 1 0.4 7 2.6 3 1.1 0 0.0175 14,318 10 0.7 113 7.9 72 5.0 0 0.0
ARMM 67,928 89 1.3 302 4.4 62 0.9 20 0.29
176 3,410 13 3.8 19 5.6 10 2.9 16 4.7177 16,968 18 1.1 59 3.5 26 1.5 1 0.1178 23,187 15 0.6 36 1.6 15 0.6 0 0.0179 11,824 16 1.4 65 5.5 9 0.8 3 0.3180 7,759 20 2.6 117 15.1 0 0.0 0 0.0
181 4,780 7 1.5 6 1.3 2 0.4 0 0.0
CARAGA 42,245 50 1.2 313 7.4 123 2.9 4 0.09
182 7,466 2 0.3 23 3.1 10 1.3 1 0.1183 13,025 13 1.0 86 6.6 34 2.6 2 0.2184 6,275 6 1.0 49 7.8 14 2.2 0 0.0185 6,726 14 2.1 56 8.3 34 5.1 - 0.0
186 1,677 2 1.2 13 7.8 21 12.5 0 0.0187 4,825 8 1.7 66 13.7 2 0.4 0 0.0188 2,251 5 2.2 20 8.9 8 3.6 1 0.4
24
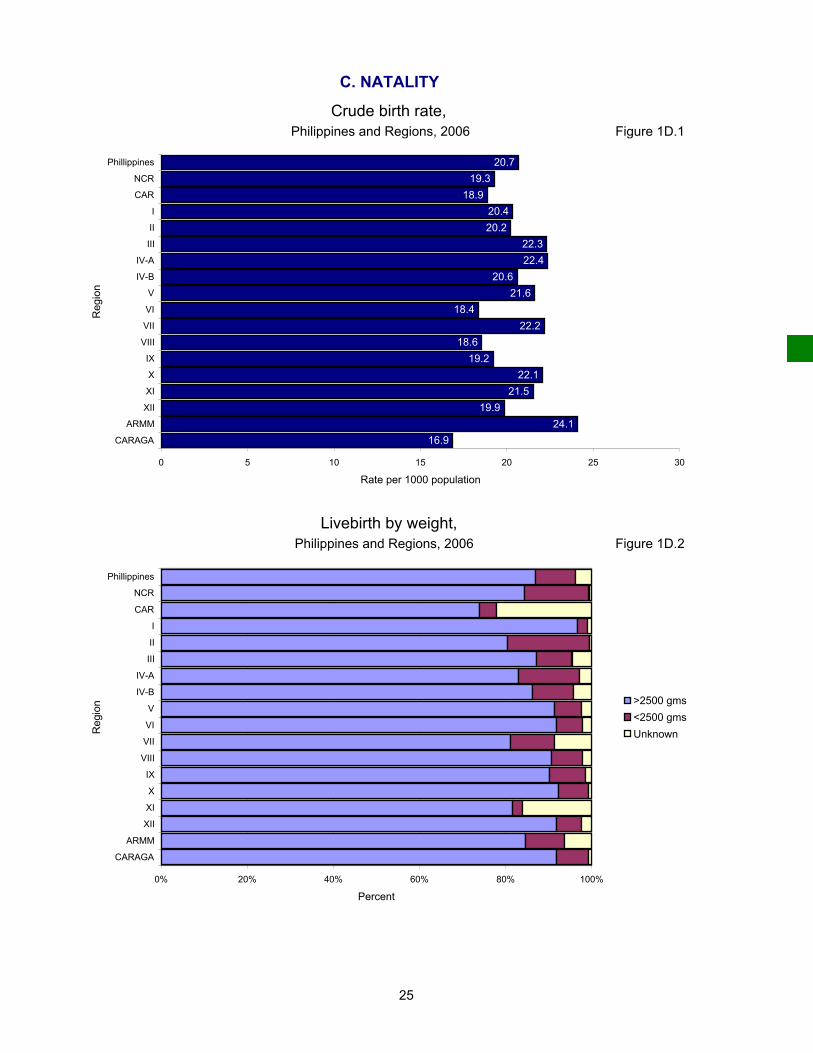
Figure 1D.1
Figure 1D.2 Philippines and Regions, 2006
C. NATALITY
Crude birth rate, Philippines and Regions, 2006
Livebirth by weight,
20.719.3
18.920.420.2
22.322.4
20.621.6
18.422.2
18.619.2
22.121.5
19.924.1
16.9
0 5 10 15 20 25 30
Phillippines
NCR
CAR
I
II
III
IV-A
IV-B
V
VI
VII
VIII
IX
X
XI
XII
ARMM
CARAGA
Reg
ion
Rate per 1000 population
0% 20% 40% 60% 80% 100%
Phillippines
NCR
CAR
I
II
III
IV-A
IV-B
V
VI
VII
VIII
IX
X
XI
XII
ARMM
CARAGA
Reg
ion
Percent
>2500 gms<2500 gmsUnknown
25

Figure 1D.3
Figure 1D.4
Births by type of pregnancy, Philippines and Regions, 2006
Deliveries by Place, Philippines and Regions, 2006
0% 10% 20% 30% 40% 50% 60% 70% 80% 90% 100%
Philippines
NCR
CAR
I
II
III
IV-A
IV-B
V
VI
VII
VIII
IX
X
XI
XII
ARMM
CARAGA
Reg
ion
Percent
HOMEHOSPITALOTHERS
0% 20% 40% 60% 80% 100%
Phillippines
NCR
CAR
I
II
III
IV-A
IV-B
V
VII
VII
VIII
IX
X
XI
XII
ARMM
CARAGA
Reg
ion
Percent
RISKNORMALNOT KNOWN
31

Region Number Province/ of No. % No. % No. %City Code Pregnancy C2/C1 C4/C1 C6/C1Number 1 2 3 4 5 6 7
Phillippines 1,770,735 423,516 23.9 1,134,721 64.1 212,498 12.0
NCR 219,722 37,767 17.2 66,823 30.4 115,132 52.4
1 316 160 50.6 156 49.4 0 0.02 3,944 0 0.0 0 0.0 3,944 100.03 3,328 0 0.0 0 0.0 3,328 100.04 696 0 0.0 0 0.0 696 100.05 1,184 0 0.0 0 0.0 1,184 100.06 8,348 2,767 33.1 5,572 66.7 9 0.1
7 25,308 2,389 9.4 22,919 90.6 0 0.08 7,319 0 0.0 0 0.0 7,319 100.09 11,631 0 0.0 0 0.0 11,631 100.0
10 5,338 522 9.8 4,816 90.2 0 0.011 66,184 0 0.0 0 0.0 66,184 100.012 9,301 0 0.0 0 0.0 9,301 100.013 8,685 0 0.0 5,203 59.9 3,482 40.114 7,579 0 0.0 0 0.0 7,579 100.015 6,241 1,049 16.8 5,174 82.9 18 0.316 7,937 1,112 14.0 6,381 80.4 444 5.617 37,887 29,291 77.3 8,596 22.7 0 0.018 8,496 477 5.6 8,006 94.2 13 0.2
CAR 30,053 8,294 27.6 15,304 50.9 6,455 21.5
19 4,038 1,596 39.5 2,207 54.7 235 5.820 1,959 598 30.5 1,336 68.2 25 1.321 7,189 1,928 26.8 5,163 71.8 98 1.422 4,142 1,242 30.0 2,876 69.4 24 0.623 3,717 1,390 37.4 2,322 62.5 5 0.124 2,964 1,540 52.0 1,400 47.2 24 0.8
25 6,044 0 0.0 0 0.0 6,044 100.0
Region 1 92,845 28,240 30.4 64,228 69.2 377 0.4
26 7,390 3,001 40.6 4,325 58.5 64 0.927 9,583 3,306 34.5 6,276 65.5 1 0.0128 12,347 4,915 39.8 7,418 60.1 14 0.129 43,525 12,746 29.3 30,661 70.4 118 0.3
30 1,967 607 30.9 1,360 69.1 0 0.031 1,076 265 24.6 807 75.0 4 0.432 3,451 237 6.9 3,172 91.9 42 1.233 3,161 123 3.9 3,038 96.1 0 0.034 3,604 1,417 39.3 2,151 59.7 36 1.035 3,609 705 19.5 2,812 77.9 92 2.536 2,152 579 26.9 1,573 73.1 0 0.037 980 339 34.6 635 64.8 6 0.6
R I s k N o r m a l Not Known
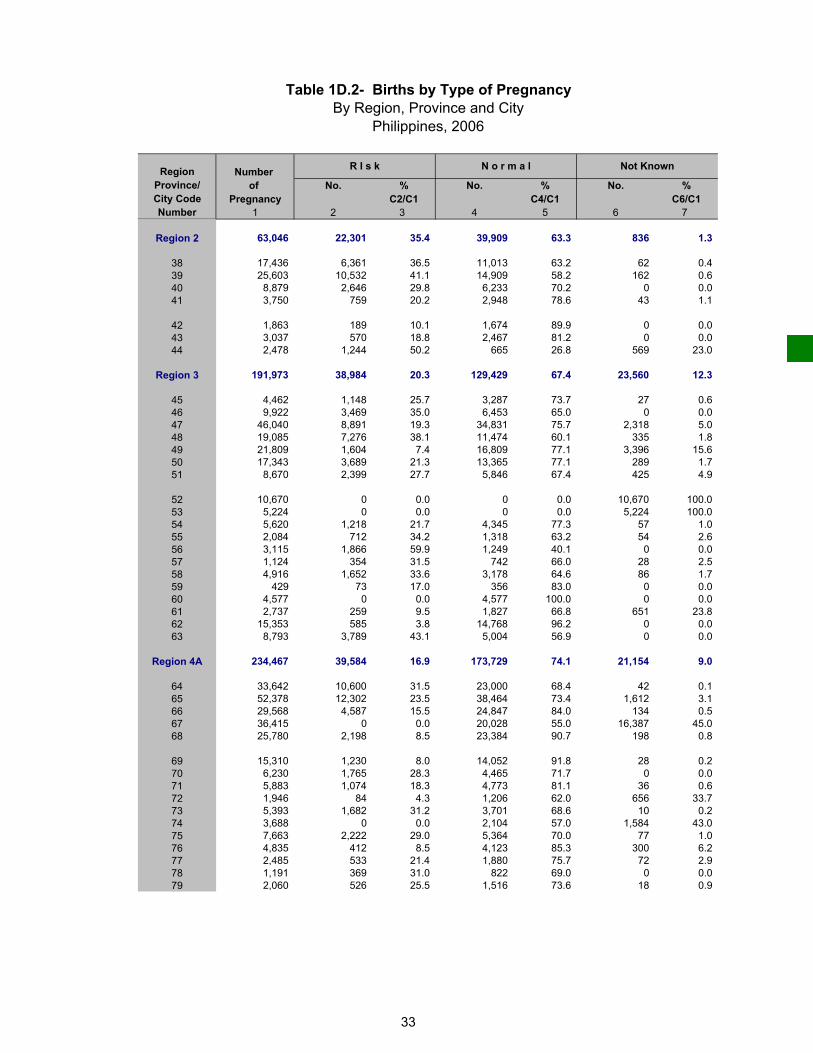
Table 1D.2- Births by Type of PregnancyBy Region, Province and City
Philippines, 2006
32
Region Number Province/ of No. % No. % No. %City Code Pregnancy C2/C1 C4/C1 C6/C1Number 1 2 3 4 5 6 7
R I s k N o r m a l Not Known
Table 1D.2- Births by Type of PregnancyBy Region, Province and City
Philippines, 2006
Region 2 63,046 22,301 35.4 39,909 63.3 836 1.3
38 17,436 6,361 36.5 11,013 63.2 62 0.439 25,603 10,532 41.1 14,909 58.2 162 0.640 8,879 2,646 29.8 6,233 70.2 0 0.041 3,750 759 20.2 2,948 78.6 43 1.1
42 1,863 189 10.1 1,674 89.9 0 0.043 3,037 570 18.8 2,467 81.2 0 0.044 2,478 1,244 50.2 665 26.8 569 23.0
Region 3 191,973 38,984 20.3 129,429 67.4 23,560 12.3
45 4,462 1,148 25.7 3,287 73.7 27 0.646 9,922 3,469 35.0 6,453 65.0 0 0.047 46,040 8,891 19.3 34,831 75.7 2,318 5.048 19,085 7,276 38.1 11,474 60.1 335 1.849 21,809 1,604 7.4 16,809 77.1 3,396 15.650 17,343 3,689 21.3 13,365 77.1 289 1.751 8,670 2,399 27.7 5,846 67.4 425 4.9
52 10,670 0 0.0 0 0.0 10,670 100.053 5,224 0 0.0 0 0.0 5,224 100.054 5,620 1,218 21.7 4,345 77.3 57 1.055 2,084 712 34.2 1,318 63.2 54 2.656 3,115 1,866 59.9 1,249 40.1 0 0.057 1,124 354 31.5 742 66.0 28 2.558 4,916 1,652 33.6 3,178 64.6 86 1.759 429 73 17.0 356 83.0 0 0.060 4,577 0 0.0 4,577 100.0 0 0.061 2,737 259 9.5 1,827 66.8 651 23.862 15,353 585 3.8 14,768 96.2 0 0.063 8,793 3,789 43.1 5,004 56.9 0 0.0
Region 4A 234,467 39,584 16.9 173,729 74.1 21,154 9.0
64 33,642 10,600 31.5 23,000 68.4 42 0.165 52,378 12,302 23.5 38,464 73.4 1,612 3.166 29,568 4,587 15.5 24,847 84.0 134 0.567 36,415 0 0.0 20,028 55.0 16,387 45.068 25,780 2,198 8.5 23,384 90.7 198 0.8
69 15,310 1,230 8.0 14,052 91.8 28 0.270 6,230 1,765 28.3 4,465 71.7 0 0.071 5,883 1,074 18.3 4,773 81.1 36 0.672 1,946 84 4.3 1,206 62.0 656 33.773 5,393 1,682 31.2 3,701 68.6 10 0.274 3,688 0 0.0 2,104 57.0 1,584 43.075 7,663 2,222 29.0 5,364 70.0 77 1.076 4,835 412 8.5 4,123 85.3 300 6.277 2,485 533 21.4 1,880 75.7 72 2.978 1,191 369 31.0 822 69.0 0 0.079 2,060 526 25.5 1,516 73.6 18 0.9
33

Region Number Province/ of No. % No. % No. %City Code Pregnancy C2/C1 C4/C1 C6/C1Number 1 2 3 4 5 6 7
R I s k N o r m a l Not Known
Table 1D.2- Births by Type of PregnancyBy Region, Province and City
Philippines, 2006
Region 4B 51,869 15,889 30.6 34,369 66.3 1,611 3.1
80 4,453 780 17.5 3,635 81.6 38 0.981 8,867 3,159 35.6 5,677 64.0 31 0.382 12,377 3,493 28.2 8,319 67.2 565 4.683 15,163 4,177 27.5 10,572 69.7 414 2.784 5,276 2,497 47.3 2,357 44.7 422 8.0
85 2,365 899 38.0 1,355 57.3 111 4.786 3,368 884 26.2 2,454 72.9 30 0.9
Region 5 113,434 37,281 32.9 74,122 65.3 2,031 1.8
87 22,051 10,466 47.5 11,147 50.6 438 2.088 10,794 3,723 34.5 6,386 59.2 685 6.389 28,924 5,287 18.3 23,400 80.9 237 0.890 5,251 3 0.1 5,248 99.9 0 0.091 20,811 7,496 36.0 12,802 61.5 513 2.592 16,522 8,276 50.1 8,096 49.0 150 0.9
93 2,084 193 9.3 1,891 90.7 0 0.094 2,981 856 28.7 2,117 71.0 8 0.395 4,016 981 24.4 3,035 75.6 0 0.0
Region 6 128,560 31,593 24.6 96,301 74.9 666 0.5
96 8,066 1,664 20.6 6,399 79.3 3 0.0497 9,742 2,793 28.7 6,892 70.7 57 0.698 8,294 2,356 28.4 5,897 71.1 41 0.599 2,794 837 30.0 1,944 69.6 13 0.5
100 28,676 8,237 28.7 20,190 70.4 249 0.9101 19,296 4,159 21.6 14,895 77.2 242 1.3
102 12,697 1,347 10.6 11,350 89.4 0 0.0103 1,178 207 17.6 971 82.4 0 0.0104 2,285 561 24.6 1,724 75.4 0 0.0105 1,618 473 29.2 1,145 70.8 0 0.0106 2,007 612 30.5 1,395 69.5 0 0.0107 10,372 1,777 17.1 8,549 82.4 46 0.4108 2,261 647 28.6 1,614 71.4 0 0.0109 1,360 275 20.2 1,085 79.8 0 0.0110 1,493 672 45.0 821 55.0 0 0.0111 4,306 2,483 57.7 1,823 42.3 0 0.0112 2,365 554 23.4 1,811 76.6 0 0.0113 2,479 715 28.8 1,764 71.2 0 0.0114 2,463 279 11.3 2,184 88.7 0 0.0115 1,429 434 30.4 992 69.4 3 0.2116 1,072 310 28.9 750 70.0 12 1.1117 2,307 201 8.7 2,106 91.3 0 0.0
34

Region Number Province/ of No. % No. % No. %City Code Pregnancy C2/C1 C4/C1 C6/C1Number 1 2 3 4 5 6 7
R I s k N o r m a l Not Known
Table 1D.2- Births by Type of PregnancyBy Region, Province and City
Philippines, 2006
Region 7 135,339 32,043 23.7 79,325 58.6 23,971 17.7
118 21,842 6,558 30.0 15,040 68.9 244 1.1119 43,901 10,927 24.9 18,107 41.2 14,867 33.9120 13,678 3,847 28.1 8,910 65.1 921 6.7121 1,123 5 0.4 118 10.5 1,000 89.0
122 1,142 447 39.1 555 48.6 140 12.3123 2,275 669 29.4 1,584 69.6 22 1.0124 846 35 4.1 782 92.4 29 3.4125 19,046 4,752 25.0 8,301 43.6 5,993 31.5126 2,669 112 4.2 2,557 95.8 0 0.0127 2,558 248 9.7 2,303 90.0 7 0.3128 9,125 264 2.9 8,861 97.1 0 0.0129 7,819 2,922 37.4 4,375 56.0 522 6.7130 1,687 445 26.4 1,166 69.1 76 4.5131 4,101 330 8.0 3,764 91.8 7 0.2132 567 0 0.0 567 100.0 0 0.0133 2,960 482 16.3 2,335 78.9 143 4.8
Region 8 78,306 24,071 30.7 52,331 66.8 1,904 2.4
134 3,505 1,718 49.0 1,554 44.3 233 6.6135 8,915 2,773 31.1 5,485 61.5 657 7.4136 28,733 9,696 33.7 18,910 65.8 127 0.4137 12,898 4,959 38.4 7,800 60.5 139 1.1138 6,094 2,559 42.0 3,202 52.5 333 5.5139 2,862 623 21.8 2,210 77.2 29 1.0
140 3,298 351 10.6 2,878 87.3 69 2.1141 1,631 735 45.1 825 50.6 71 4.4142 5,182 364 7.0 4,572 88.2 246 4.7143 5,188 293 5.6 4,895 94.4 0 0.0
Region 9 63,838 19,284 30.2 43,079 67.5 1,475 2.3
144 14,251 3,422 24.0 10,694 75.0 135 0.9145 14,483 3,495 24.1 10,548 72.8 440 3.0146 10,500 4,129 39.3 5,937 56.5 434 4.1
0 147 1,364 84 6.2 1,235 90.5 45 3.3148 2,009 472 23.5 1,537 76.5 0 0.0149 1,958 228 11.6 1,730 88.4 0 0.0150 2,618 869 33.2 1,749 66.8 0 0.0151 16,655 6,585 39.5 9,649 57.9 421 2.5
35

Region Number Province/ of No. % No. % No. %City Code Pregnancy C2/C1 C4/C1 C6/C1Number 1 2 3 4 5 6 7
R I s k N o r m a l Not Known
Table 1D.2- Births by Type of PregnancyBy Region, Province and City
Philippines, 2006
Region 10 89,480 31,616 35.3 54,686 61.1 3,178 3.6
152 22,589 8,508 37.7 12,639 56.0 1,442 6.4153 1,581 773 48.9 808 51.1 0 0.0154 11,727 2,664 22.7 8,982 76.6 81 0.7155 4,568 954 20.9 3,568 78.1 46 1.0156 12,320 4,667 37.9 7,604 61.7 49 0.4
157 14,286 5,787 40.5 8,318 58.2 181 1.3158 2,129 856 40.2 1,273 59.8 0 0.0159 9,337 3,425 36.7 5,332 57.1 580 6.2160 3,239 1,173 36.2 1,572 48.5 494 15.3161 1,044 414 39.7 630 60.3 0 0.0162 2,121 976 46.0 1,043 49.2 102 4.8163 1,072 159 14.8 910 84.9 3 0.3164 3,467 1,260 36.3 2,007 57.9 200 5.8
Region 11 91,272 3,974 4.4 81,949 89.8 5,349 5.9
165 14,741 505 3.4 13,143 89.2 1,093 7.4166 18,537 746 4.0 16,069 86.7 1,722 9.3167 9,844 379 3.9 8,942 90.8 523 5.3168 18,631 752 4.0 17,272 92.7 607 3.3
169 29,519 1,592 5.4 26,523 89.9 1,404 4.8
Region 12 76,030 21,753 28.6 53,538 70.4 739 1.0
170 20,110 6,642 33.0 13,113 65.2 355 1.8171 9,952 2,003 20.1 7,947 79.9 2 0.02172 15,959 3,860 24.2 12,099 75.8 0 0.0173 13,032 2,982 22.9 9,940 76.3 110 0.8
174 2,659 253 9.5 2,168 81.5 238 9.0175 14,318 6,013 42.0 8,271 57.8 34 0.2
ARMM 68,300 14,377 21.0 50,597 74.1 3,326 4.9
176 3,410 464 13.6 2,721 79.8 225 6.6177 16,992 4,812 28.3 11,737 69.1 443 2.6178 23,184 5,771 24.9 17,248 74.4 165 0.7179 11,824 993 8.4 9,522 80.5 1,309 11.1180 8,111 2,306 28.4 5,528 68.2 277 3.4
181 4,779 31 0.6 3,841 80.4 907 19.0
CARAGA 42,201 16,465 39.0 25,002 59.2 734 1.7
182 7,457 1,664 22.3 5,622 75.4 171 2.3183 13,010 6,373 49.0 6,568 50.5 69 0.5184 6,271 2,000 31.9 4,180 66.7 91 1.5185 6,723 3,051 45.4 3,625 53.9 47 0.7
186 1,673 804 48.1 869 51.9 0 0.0187 4,825 1,562 32.4 2,908 60.3 355 7.4188 2,242 1,011 45.1 1,230 54.9 1 0.04
36

Region Number TotalProvince/ of Number ofCity Code Livebirths Deliveries No. % No. % No. % No. %Number C3/C1 C5/C3 C7/C3 C9/C3
1 2 3 4 5 6 7 8 9 10
Philippines 1,775,480 1,770,735 1,760,788 99.2 1,107,506 62.9 560,354 31.8 92,928 5.3
NCR 219,722 219,722 219,722 100.0 57,731 26.3 124,576 56.7 37,415 17.0
1 316 316 316 100.0 149 47.2 167 52.8 0 0.02 3,944 3,944 3,944 100.0 2,129 54.0 1,736 44.0 79 2.03 3,328 3,328 3,328 100.0 2,328 70.0 0 0.0 1,000 30.04 696 696 696 100.0 553 79.5 0 0.0 143 20.55 1,184 1,184 1,184 100.0 185 15.6 631 53.3 368 31.16 8,348 8,348 8,348 100.0 5,523 66.2 2,767 33.1 58 0.7 7 25,308 25,308 25,308 100.0 10,400 41.1 9,678 38.2 5,230 20.78 7,319 7,319 7,319 100.0 2,921 39.9 3,632 49.6 766 10.59 11,631 11,631 11,631 100.0 1,730 14.9 6,497 55.9 3,404 29.3
10 5,338 5,338 5,338 100.0 341 6.4 3,329 62.4 1,668 31.211 66,184 66,184 66,184 100.0 1,600 2.4 55,852 84.4 8,732 13.212 9,301 9,301 9,301 100.0 1,392 15.0 4,256 45.8 3,653 39.313 8,685 8,685 8,685 100.0 3,962 45.6 3,482 40.1 1,241 14.314 7,579 7,579 7,579 100.0 3,722 49.1 3,855 50.9 2 0.0315 6,241 6,241 6,241 100.0 963 15.4 4,029 64.6 1,249 20.016 7,937 7,937 7,937 100.0 3,491 44.0 4,412 55.6 34 0.417 37,887 37,887 37,887 100.0 12,518 33.0 16,578 43.8 8,791 23.218 8,496 8,496 8,496 100.0 3,824 45.0 3,675 43.3 997 11.7
CAR 30,053 30,053 29,361 97.7 13,852 47.2 15,207 51.8 302 1.0
19 4,038 4,038 4,028 99.8 2,231 55.4 1,734 43.0 63 1.620 1,959 1,959 1,959 100.0 1,481 75.6 476 24.3 2 0.121 7,189 7,189 6,778 94.3 3,062 45.2 3,686 54.4 30 0.422 4,142 4,142 4,102 99.0 2,415 58.9 1,542 37.6 145 3.523 3,717 3,717 3,700 99.5 2,824 76.3 836 22.6 40 1.124 2,964 2,964 2,750 92.8 1,730 62.9 1,004 36.5 16 0.6
25 6,044 6,044 6,044 100.0 109 1.8 5,929 98.1 6 0.1
Region 1 92,845 92,845 92,525 99.7 67,557 73.0 24,202 26.2 766 0.8
26 7,390 7,390 7,390 100.0 4,774 64.6 2,616 35.4 0 0.027 9,583 9,583 9,568 99.8 6,975 72.9 2,538 26.5 55 0.628 12,347 12,347 12,259 99.3 6,426 52.4 5,826 47.5 7 0.129 43,525 43,525 43,342 99.6 36,982 85.3 6,260 14.4 100 0.2
30 1,967 1,967 1,967 100.0 1,360 69.1 566 28.8 41 2.131 1,076 1,076 1,042 96.8 728 69.9 312 29.9 2 0.232 3,451 3,451 3,451 100.0 1,803 52.2 1,644 47.6 4 0.133 3,161 3,161 3,161 100.0 2,376 75.2 785 24.8 0 0.034 3,604 3,604 3,604 100.0 2,446 67.9 1,078 29.9 80 2.235 3,609 3,609 3,609 100.0 1,876 52.0 1,262 35.0 471 13.136 2,152 2,152 2,152 100.0 1,303 60.5 849 39.5 0 0.037 980 980 980 100.0 508 51.8 466 47.6 6 0.6
Table 1D.3.a - Deliveries by Type and PlaceBy Region, Province and City
Philippines, 2006
Total Home Hospital
Normal
Others
37

Region Number TotalProvince/ of Number ofCity Code Livebirths Deliveries No. % No. % No. % No. %Number C3/C1 C5/C3 C7/C3 C9/C3
1 2 3 4 5 6 7 8 9 10
Table 1D.3.a - Deliveries by Type and PlaceBy Region, Province and City
Philippines, 2006
Total Home Hospital
Normal
Others
Region 2 63,138 63,046 62,509 99.0 48,481 77.6 13,016 20.8 1,012 1.6
38 17,436 17,436 17,170 98.5 13,024 75.9 3,673 21.4 473 2.839 25,603 25,603 25,332 98.9 20,645 81.5 4,488 17.7 199 0.840 8,879 8,879 8,879 100.0 6,522 73.5 2,181 24.6 176 2.041 3,753 3,750 3,750 99.9 3,001 80.0 612 16.3 137 3.7
42 1,863 1,863 1,863 100.0 1,329 71.3 534 28.7 0 0.043 3,140 3,037 3,037 96.7 2,570 84.6 440 14.5 27 0.944 2,464 2,478 2,478 100.6 1,390 56.1 1,088 43.9 0 0.0
Region 3 196,341 191,973 186,317 94.9 109,022 58.5 70,446 37.8 6,849 3.7
45 4,464 4,462 4,434 99.3 3,670 82.8 711 16.0 53 1.246 9,925 9,922 9,922 100.0 5,177 52.2 4,745 47.8 0 0.047 46,040 46,040 45,263 98.3 31,954 70.6 12,441 27.5 868 1.948 19,085 19,085 18,810 98.6 14,596 77.6 3,192 17.0 1,022 5.449 26,196 21,809 20,907 79.8 8,620 41.2 11,329 54.2 958 4.650 17,373 17,343 16,840 96.9 11,855 70.4 3,532 21.0 1,453 8.651 8,670 8,670 8,670 100.0 5,542 63.9 2,723 31.4 405 4.7
52 10,670 10,670 8,259 77.4 4,309 52.2 3,421 41.4 529 6.453 5,224 5,224 5,224 100.0 579 11.1 4,643 88.9 2 0.0454 5,566 5,620 5,537 99.5 1,467 26.5 3,986 72.0 84 1.555 2,084 2,084 2,084 100.0 1,581 75.9 503 24.1 0 0.056 3,115 3,115 2,743 88.1 986 35.9 1,757 64.1 0 0.057 1,124 1,124 1,124 100.0 868 77.2 192 17.1 64 5.758 4,919 4,916 4,723 96.0 2,073 43.9 1,927 40.8 723 15.359 429 429 429 100.0 282 65.7 147 34.3 0 0.060 4,577 4,577 4,577 100.0 1,207 26.4 3,370 73.6 0 0.061 2,737 2,737 2,737 100.0 1,443 52.7 1,278 46.7 16 0.662 15,353 15,353 15,241 99.3 8,751 57.4 5,861 38.5 629 4.163 8,790 8,793 8,793 100.0 4,062 46.2 4,688 53.3 43 0.5
Region 4A 234,467 234,467 234,467 100.0 148,822 63.5 70,562 30.1 15,083 6.4
64 33,642 33,642 33,642 100.0 23,894 71.0 8,418 25.0 1,330 4.065 52,378 52,378 52,378 100.0 31,710 60.5 17,290 33.0 3,378 6.466 29,568 29,568 29,568 100.0 23,130 78.2 5,609 19.0 829 2.867 36,415 36,415 36,415 100.0 26,583 73.0 8,011 22.0 1,821 5.068 25,780 25,780 25,780 100.0 17,441 67.7 5,393 20.9 2,946 11.4
69 15,310 15,310 15,310 100.0 6,278 41.0 6,633 43.3 2,399 15.770 6,230 6,230 6,230 100.0 2,945 47.3 3,208 51.5 77 1.271 5,883 5,883 5,883 100.0 3,114 52.9 2,769 47.1 0 0.072 1,946 1,946 1,946 100.0 322 16.5 1,611 82.8 13 0.773 5,393 5,393 5,393 100.0 3,228 59.9 2,162 40.1 3 0.174 3,688 3,688 3,688 100.0 1,869 50.7 1,810 49.1 9 0.275 7,663 7,663 7,663 100.0 2,334 30.5 4,220 55.1 1,109 14.576 4,835 4,835 4,835 100.0 2,475 51.2 1,451 30.0 909 18.877 2,485 2,485 2,485 100.0 1,660 66.8 820 33.0 5 0.278 1,191 1,191 1,191 100.0 856 71.9 335 28.1 0 0.079 2,060 2,060 2,060 100.0 983 47.7 822 39.9 255 12.4
38

Region Number TotalProvince/ of Number ofCity Code Livebirths Deliveries No. % No. % No. % No. %Number C3/C1 C5/C3 C7/C3 C9/C3
1 2 3 4 5 6 7 8 9 10
Table 1D.3.a - Deliveries by Type and PlaceBy Region, Province and City
Philippines, 2006
Total Home Hospital
Normal
Others
Region 4B 51,949 51,869 51,869 99.8 41,929 80.8 8,425 16.2 1,515 2.9
80 4,458 4,453 4,453 99.9 3,689 82.8 757 17.0 7 0.281 8,885 8,867 8,867 99.8 7,491 84.5 1,262 14.2 114 1.382 12,244 12,377 12,377 101.1 10,592 85.6 1,239 10.0 546 4.483 15,361 15,163 15,163 98.7 13,797 91.0 1,241 8.2 125 0.884 5,268 5,276 5,276 100.2 3,651 69.2 1,233 23.4 392 7.4
85 2,365 2,365 2,365 100.0 1,056 44.7 1,309 55.3 0 0.086 3,368 3,368 3,368 100.0 1,653 49.1 1,384 41.1 331 9.8
Region 5 113,434 113,434 113,290 99.9 92,307 81.5 19,335 17.1 1,648 1.5
87 22,051 22,051 22,051 100.0 18,584 84.3 3,087 14.0 380 1.788 10,794 10,794 10,748 99.6 8,395 78.1 1,972 18.3 381 3.589 28,924 28,924 28,924 100.0 26,101 90.2 2,596 9.0 227 0.890 5,251 5,251 5,251 100.0 3,640 69.3 1,611 30.7 0 0.091 20,811 20,811 20,713 99.5 18,583 89.7 2,013 9.7 117 0.692 16,522 16,522 16,522 100.0 11,441 69.2 4,656 28.2 425 2.6
93 2,084 2,084 2,084 100.0 1,745 83.7 221 10.6 118 5.794 2,981 2,981 2,981 100.0 1,771 59.4 1,210 40.6 0 0.095 4,016 4,016 4,016 100.0 2,047 51.0 1,969 49.0 0 0.0
Region 6 128,560 128,560 127,065 98.8 72,821 57.3 54,225 42.7 19 0.01
96 8,066 8,066 8,066 100.0 6,338 78.6 1,728 21.4 0 0.097 9,742 9,742 9,742 100.0 6,925 71.1 2,817 28.9 0 0.098 8,294 8,294 8,294 100.0 5,785 69.7 2,505 30.2 4 0.0599 2,794 2,794 2,688 96.2 1,525 56.7 1,163 43.3 0 0.0
100 28,676 28,676 28,199 98.3 18,786 66.6 9,413 33.4 0 0.0101 19,296 19,296 18,880 97.8 12,560 66.5 6,314 33.4 6 0.03
102 12,697 12,697 12,260 96.6 3,385 27.6 8,867 72.3 8 0.1103 1,178 1,178 1,178 100.0 380 32.3 798 67.7 0 0.0104 2,285 2,285 2,285 100.0 1,052 46.0 1,233 54.0 0 0.0105 1,618 1,618 1,618 100.0 1,339 82.8 279 17.2 0 0.0106 2,007 2,007 2,007 100.0 1,543 76.9 464 23.1 0 0.0107 10,372 10,372 10,372 100.0 1,689 16.3 8,683 83.7 0 0.0108 2,261 2,261 2,261 100.0 1,444 63.9 817 36.1 0 0.0109 1,360 1,360 1,341 98.6 882 65.8 459 34.2 0 0.0110 1,493 1,493 1,493 100.0 1,232 82.5 260 17.4 1 0.1111 4,306 4,306 4,306 100.0 1,930 44.8 2,376 55.2 0 0.0112 2,365 2,365 2,365 100.0 1,142 48.3 1,223 51.7 0 0.0113 2,479 2,479 2,462 99.3 1,596 64.8 866 35.2 0 0.0114 2,463 2,463 2,445 99.3 746 30.5 1,699 69.5 0 0.0115 1,429 1,429 1,429 100.0 1,039 72.7 390 27.3 0 0.0116 1,072 1,072 1,072 100.0 942 87.9 130 12.1 0 0.0117 2,307 2,307 2,302 99.8 561 24.4 1,741 75.6 0 0.0
39

Region Number TotalProvince/ of Number ofCity Code Livebirths Deliveries No. % No. % No. % No. %Number C3/C1 C5/C3 C7/C3 C9/C3
1 2 3 4 5 6 7 8 9 10
Table 1D.3.a - Deliveries by Type and PlaceBy Region, Province and City
Philippines, 2006
Total Home Hospital
Normal
Others
Region 7 137,102 135,339 135,339 98.7 87,592 64.7 40,920 30.2 6,827 5.0
118 21,771 21,842 21,842 100.3 16,168 74.0 4,163 19.1 1,511 6.9119 44,927 43,901 43,901 97.7 34,547 78.7 7,311 16.7 2,043 4.7120 13,669 13,678 13,678 100.1 10,658 77.9 2,386 17.4 634 4.6121 1,124 1,123 1,123 99.9 1,017 90.6 106 9.4 0 0.0
122 1,164 1,142 1,142 98.1 806 70.6 333 29.2 3 0.3123 2,286 2,275 2,275 99.5 1,901 83.6 374 16.4 0 0.0124 906 846 846 93.4 677 80.0 169 20.0 0 0.0125 19,062 19,046 19,046 99.9 5,399 28.3 11,387 59.8 2,260 11.9126 2,669 2,669 2,669 100.0 1,869 70.0 544 20.4 256 9.6127 2,558 2,558 2,558 100.0 282 11.0 2,276 89.0 0 0.0128 9,125 9,125 9,125 100.0 4,667 51.1 4,458 48.9 0 0.0129 7,835 7,819 7,819 99.8 3,849 49.2 3,869 49.5 101 1.3130 1,682 1,687 1,687 100.3 587 34.8 1,089 64.6 11 0.7131 4,101 4,101 4,101 100.0 3,056 74.5 1,045 25.5 0 0.0132 1,254 567 567 45.2 0 0.0 567 100.0 0 0.0133 2,969 2,960 2,960 99.7 2,109 71.3 843 28.5 8 0.3
Region 8 78,306 78,306 78,306 100.0 55,566 71.0 19,480 24.9 3,260 4.2
134 3,505 3,505 3,505 100.0 2,362 67.4 860 24.5 283 8.1135 8,915 8,915 8,915 100.0 7,426 83.3 1,227 13.8 262 2.9136 28,733 28,733 28,733 100.0 21,905 76.2 5,671 19.7 1,157 4.0137 12,898 12,898 12,898 100.0 10,790 83.7 2,001 15.5 107 0.8138 6,094 6,094 6,094 100.0 2,921 47.9 2,709 44.5 464 7.6139 2,862 2,862 2,862 100.0 2,213 77.3 527 18.4 122 4.3
140 3,298 3,298 3,298 100.0 2,703 82.0 591 17.9 4 0.1141 1,631 1,631 1,631 100.0 627 38.4 969 59.4 35 2.1142 5,182 5,182 5,182 100.0 2,755 53.2 1,794 34.6 633 12.2143 5,188 5,188 5,188 100.0 1,864 35.9 3,131 60.4 193 3.7
Region 9 63,883 63,838 63,838 99.9 51,502 80.7 9,874 15.5 2,462 3.9
144 14,251 14,251 14,251 100.0 12,318 86.4 1,570 11.0 363 2.5145 14,503 14,483 14,483 99.9 12,673 87.5 1,338 9.2 472 3.3146 10,500 10,500 10,500 100.0 9,828 93.6 624 5.9 48 0.5
147 1,364 1,364 1,364 100.0 761 55.8 603 44.2 0 0.0148 2,009 2,009 2,009 100.0 919 45.7 1,061 52.8 29 1.4149 1,959 1,958 1,958 99.9 1,730 88.4 228 11.6 0 0.0150 2,618 2,618 2,618 100.0 1,948 74.4 589 22.5 81 3.1151 16,679 16,655 16,655 99.9 11,325 68.0 3,861 23.2 1,469 8.8
Region 10 89,480 89,480 89,480 100.0 59,607 66.6 24,174 27.0 5,699 6.4
152 22,589 22,589 22,589 100.0 17,581 77.8 3,757 16.6 1,251 5.5153 1,581 1,581 1,581 100.0 1,114 70.5 461 29.2 6 0.4154 11,727 11,727 11,727 100.0 9,231 78.7 2,284 19.5 212 1.8155 4,568 4,568 4,568 100.0 3,687 80.7 862 18.9 19 0.4156 12,320 12,320 12,320 100.0 8,713 70.7 2,026 16.4 1,581 12.8
40

Region Number TotalProvince/ of Number ofCity Code Livebirths Deliveries No. % No. % No. % No. %Number C3/C1 C5/C3 C7/C3 C9/C3
1 2 3 4 5 6 7 8 9 10
Table 1D.3.a - Deliveries by Type and PlaceBy Region, Province and City
Philippines, 2006
Total Home Hospital
Normal
Others
157 14,286 14,286 14,286 100.0 4,820 33.7 7,940 55.6 1,526 10.7158 2,129 2,129 2,129 100.0 1,539 72.3 393 18.5 197 9.3159 9,337 9,337 9,337 100.0 5,332 57.1 3,332 35.7 673 7.2160 3,239 3,239 3,239 100.0 2,350 72.6 837 25.8 52 1.6161 1,044 1,044 1,044 100.0 524 50.2 511 48.9 9 0.9162 2,121 2,121 2,121 100.0 1,002 47.2 1,119 52.8 0 0.0163 1,072 1,072 1,072 100.0 735 68.6 164 15.3 173 16.1164 3,467 3,467 3,467 100.0 2,979 85.9 488 14.1 0 0.0
Region 11 89,626 91,272 91,272 101.8 50,843 55.7 35,158 38.5 5,271 5.8
165 14,365 14,741 14,741 102.6 10,508 71.3 3,215 21.8 1,018 6.9166 18,118 18,537 18,537 102.3 9,545 51.5 7,131 38.5 1,861 10.0167 9,595 9,844 9,844 102.6 7,049 71.6 2,300 23.4 495 5.0168 18,223 18,631 18,631 102.2 13,912 74.7 4,241 22.8 478 2.6
169 29,325 29,519 29,519 100.7 9,829 33.3 18,271 61.9 1,419 4.8
Region 12 76,401 76,030 74,927 98.1 56,485 75.4 15,916 21.2 2,526 3.4
170 20,107 20,110 19,482 96.9 15,964 81.9 3,200 16.4 318 1.6171 9,952 9,952 9,952 100.0 8,604 86.5 1,281 12.9 67 0.7172 15,637 15,959 15,559 99.5 11,589 74.5 3,280 21.1 690 4.4173 13,728 13,032 13,032 94.9 11,120 85.3 1,750 13.4 162 1.2
174 2,659 2,659 2,584 97.2 1,640 63.5 848 32.8 96 3.7175 14,318 14,318 14,318 100.0 7,568 52.9 5,557 38.8 1,193 8.3
ARMM 67,928 68,300 68,300 100.5 60,192 88.1 6,652 9.7 1,456 2.1
176 3,410 3,410 3,410 100.0 2,838 83.2 366 10.7 206 6.0177 16,968 16,992 16,992 100.1 15,303 90.1 957 5.6 732 4.3178 23,187 23,184 23,184 100.0 21,085 90.9 1,973 8.5 126 0.5179 11,824 11,824 11,824 100.0 10,551 89.2 1,215 10.3 58 0.5180 7,759 8,111 8,111 104.5 7,775 95.9 331 4.1 5 0.1
181 4,780 4,779 4,779 100.0 2,640 55.2 1,810 37.9 329 6.9
CARAGA 42,245 42,201 42,201 99.9 33,197 78.7 8,186 19.4 818 1.9
182 7,466 7,457 7,457 99.9 6,250 83.8 1,123 15.1 84 1.1183 13,025 13,010 13,010 99.9 10,891 83.7 1,708 13.1 411 3.2184 6,275 6,271 6,271 99.9 5,297 84.5 854 13.6 120 1.9185 6,726 6,723 6,723 100.0 5,270 78.4 1,325 19.7 128 1.9
186 1,677 1,673 1,673 99.8 974 58.2 668 39.9 31 1.9187 4,825 4,825 4,825 100.0 3,240 67.2 1,541 31.9 44 0.9188 2,251 2,242 2,242 99.6 1,275 56.9 967 43.1 0 0.0
41

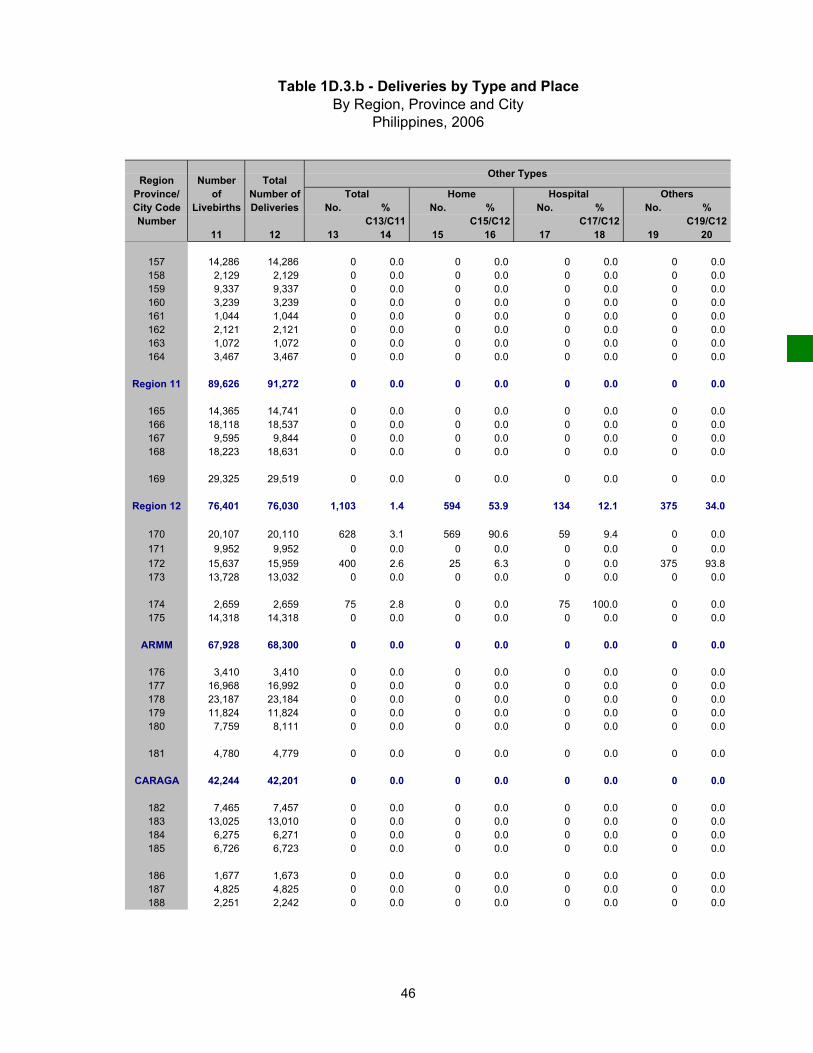
Region Number TotalProvince/ of Number ofCity Code Livebirths Deliveries No. % No. % No. % No. %Number C13/C11 C15/C12 C17/C12 C19/C12
11 12 13 14 15 16 17 18 19 20
Philippines 1,784,980 1,770,735 9,947 0.6 3,374 33.9 4,892 49.2 1,681 16.9
NCR 219,722 219,722 0 0.0 0 0.0 0 0.0 0 0.0
1 316 316 0 0.0 - - - - - -2 3,944 3,944 0 0.0 0 0.0 0 0.0 0 0.03 3,328 3,328 0 0.0 0 0.0 0 0.0 0 0.04 696 696 0 0.0 0 0.0 0 0.0 0 0.05 1,184 1,184 0 0.0 0 0.0 0 0.0 0 0.06 8,348 8,348 0 0.0 0 0.0 0 0.0 0 0.0 7 25,308 25,308 0 0.0 0 0.0 0 0.0 0 0.08 7,319 7,319 0 0.0 0 0.0 0 0.0 0 0.09 11,631 11,631 0 0.0 0 0.0 0 0.0 0 0.0
10 5,338 5,338 0 0.0 0 0.0 0 0.0 0 0.011 66,184 66,184 0 0.0 0 0.0 0 0.0 0 0.012 9,301 9,301 0 0.0 0 0.0 0 0.0 0 0.013 8,685 8,685 0 0.0 0 0.0 0 0.0 0 0.014 7,579 7,579 0 0.0 0 0.0 0 0.0 0 0.015 6,241 6,241 0 0.0 0 0.0 0 0.0 0 0.016 7,937 7,937 0 0.0 0 0.0 0 0.0 0 0.017 37,887 37,887 0 0.0 0 0.0 0 0.0 0 0.018 8,496 8,496 0 0.0 0 0.0 0 0.0 0 0.0
CAR 29,753 30,053 692 2.3 4 0.6 684 98.8 4 0.6
19 4,038 4,038 10 0.2 4 40.0 4 0.0 2 20.020 1,659 1,959 0 0.0 0 0.0 0 0.0 0 0.021 7,189 7,189 411 5.7 0 0.0 410 0.0 1 0.222 4,142 4,142 40 1.0 0 0.0 40 100.0 0 0.023 3,717 3,717 17 0.5 0 0.0 17 100.0 0 0.024 2,964 2,964 214 7.2 0 0.0 213 7.9 1 0.5
25 6,044 6,044 0 0.0 0 0.0 0 0.0 0 0.0
Region 1 92,845 92,845 320 0.3 51 15.9 260 81.3 9.0 2.8
26 7,390 7,390 0 0.0 0 0.0 0 0.0 0 0.027 9,583 9,583 15 0.2 15 100.0 0 0.0 0 0.028 12,347 12,347 88 0.7 18 20.5 61 69.3 9 10.229 43,525 43,525 183 0.4 2 1.1 181 98.9 0 0.0
30 1,967 1,967 0 0.0 0 0.0 0 0.0 0 0.031 1,076 1,076 34 3.2 16 47.1 18 52.9 0 0.032 3,451 3,451 0 0.0 0 0.0 0 0.0 0 0.033 3,161 3,161 0 0.0 0 0.0 0 0.0 0 0.034 3,604 3,604 0 0.0 0 0.0 0 0.0 0 0.035 3,609 3,609 0 0.0 0 0.0 0 0.0 0 0.036 2,152 2,152 0 0.0 0 0.0 0 0.0 0 0.037 980 980 0 0.0 0 0.0 0 0.0 0 0.0
Table 1D.3.b - Deliveries by Type and PlaceBy Region, Province and City
Philippines, 2006
Other Types
Home Hospital OthersTotal
42

Region Number TotalProvince/ of Number ofCity Code Livebirths Deliveries No. % No. % No. % No. %Number C13/C11 C15/C12 C17/C12 C19/C12
11 12 13 14 15 16 17 18 19 20
Table 1D.3.b - Deliveries by Type and PlaceBy Region, Province and City
Philippines, 2006
Other Types
Home Hospital OthersTotal
Region 2 63,138 63,046 537 0.9 209 38.9 316 58.8 12 2.2
38 17,436 17,436 266 1.5 209 78.6 57 21.4 0 0.039 25,603 25,603 271 1.1 0 0.0 259 95.6 12 4.440 8,879 8,879 0 0.0 0 0.0 0 0.0 0 0.041 3,753 3,750 0 0.0 0 0.0 0 0.0 0 0.0
42 1,863 1,863 0 0.0 0 0.0 0 0.0 0 0.043 3,140 3,037 0 0.0 0 0.0 0 0.0 0 0.044 2,464 2,478 0 0.0 0 0.0 0 0.0 0 0.0
Region 3 206,142 191,973 5,656 2.7 2,439 43.1 1,942 34.3 1,275 22.5
45 4,464 4,462 28 0.6 0 0.0 28 100.0 0 0.046 15,149 9,922 0 0.0 0 0.0 0 0.0 0 0.047 46,040 46,040 777 1.7 0 0.0 744 95.8 33 4.248 19,085 19,085 275 1.4 0 0.0 275 100.0 0 0.049 30,773 21,809 902 2.9 0 0.0 29 3.2 873 96.850 17,373 17,343 503 2.9 0 0.0 165 32.8 338 67.251 8,670 8,670 0 0.0 0 0.0 0 0.0 0 0.0
52 10,670 10,670 2,411 22.6 2,411 100.0 0 0.0 0 0.053 5,224 5,224 0 0.0 0 0.0 0 0.0 0 0.054 5,566 5,620 83 1.5 0 0.0 83 100.0 0 0.055 2,084 2,084 0 0.0 0 0.0 0 0.0 0 0.056 3,115 3,115 372 11.9 0 0.0 372 100.0 0 0.057 1,124 1,124 0 0.0 0 0.0 0 0.0 0 0.058 4,919 4,916 193 3.9 0 0.0 193 100.0 0 0.059 429 429 0 0.0 0 0.0 0 0.0 0 0.060 4,577 4,577 0 0.0 0 0.0 0 0.0 0 0.061 2,737 2,737 0 0.0 0 0.0 0 0.0 0 0.062 15,353 15,353 112 0.7 28 25.0 53 47.3 31 27.763 8,790 8,793 0 0.0 0 0.0 0 0.0 0 0.0
Region 4A 234,467 234,467 0 0.0 0 0.0 0 0.0 0 0.0
64 33,642 33,642 0 0.0 0 0.0 0 0.0 0 0.065 52,378 52,378 0 0.0 0 0.0 0 0.0 0 0.066 29,568 29,568 0 0.0 0 0.0 0 0.0 0 0.067 36,415 36,415 0 0.0 0 0.0 0 0.0 0 0.068 25,780 25,780 0 0.0 0 0.0 0 0.0 0 0.0
69 15,310 15,310 0 0.0 0 0.0 0 0.0 0 0.070 6,230 6,230 0 0.0 0 0.0 0 0.0 0 0.071 5,883 5,883 0 0.0 0 0.0 0 0.0 0 0.072 1,946 1,946 0 0.0 0 0.0 0 0.0 0 0.073 5,393 5,393 0 0.0 0 0.0 0 0.0 0 0.074 3,688 3,688 0 0.0 0 0.0 0 0.0 0 0.075 7,663 7,663 0 0.0 0 0.0 0 0.0 0 0.076 4,835 4,835 0 0.0 0 0.0 0 0.0 0 0.077 2,485 2,485 0 0.0 0 0.0 0 0.0 0 0.078 1,191 1,191 0 0.0 0 0.0 0 0.0 0 0.079 2,060 2,060 0 0.0 0 0.0 0 0.0 0 0.0
43

Region Number TotalProvince/ of Number ofCity Code Livebirths Deliveries No. % No. % No. % No. %Number C13/C11 C15/C12 C17/C12 C19/C12
11 12 13 14 15 16 17 18 19 20
Table 1D.3.b - Deliveries by Type and PlaceBy Region, Province and City
Philippines, 2006
Other Types
Home Hospital OthersTotal
Region 4B 51,949 51,869 0 0.0 0 0.0 0 0.0 0 0.0
80 4,458 4,453 0 0.0 0 0.0 0 0.0 0 0.081 8,885 8,867 0 0.0 0 0.0 0 0.0 0 0.082 12,244 12,377 0 0.0 0 0.0 0 0.0 0 0.083 15,361 15,163 0 0.0 0 0.0 0 0.0 0 0.084 5,268 5,276 0 0.0 0 0.0 0 0.0 0 0.0
85 2,365 2,365 0 0.0 0 0.0 0 0.0 0 0.086 3,368 3,368 0 0.0 0 0.0 0 0.0 0 0.0
Region 5 113,434 113,434 144 0.1 77 53.5 61 42.4 6 4.2
87 22,051 22,051 0 0.0 0 0.0 0 0.0 0 0.088 10,794 10,794 46 0.4 4 8.7 36 78.3 6 13.089 28,924 28,924 0 0.0 0 0.0 0 0.0 0 0.090 5,251 5,251 0 0.0 0 0.0 0 0.0 0 0.091 20,811 20,811 98 0.5 73 74.5 25 25.5 0 0.092 16,522 16,522 0 0.0 0 0.0 0 0.0 0 0.0
93 2,084 2,084 0 0.0 0 0.0 0 0.0 0 0.094 2,981 2,981 0 0.0 0 0.0 0 0.0 0 0.095 4,016 4,016 0 0.0 0 0.0 0 0.0 0 0.0
Region 6 128,560 128,560 1,495 1.2 0 0.0 1,495 100.0 0 0.0
96 8,066 8,066 0 0.0 0 0.0 0 0.0 0 0.097 9,742 9,742 0 0.0 0 0.0 0 0.0 0 0.098 8,294 8,294 0 0.0 0 0.0 0 0.0 0 0.099 2,794 2,794 106 3.8 0 0.0 106 100.0 0 0.0
100 28,676 28,676 477 1.7 0 0.0 477 100.0 0 0.0101 19,296 19,296 416 2.2 0 0.0 416 100.0 0 0.0
102 12,697 12,697 437 3.4 0 0.0 437 100.0 0 0.0103 1,178 1,178 0 0.0 0 0.0 0 0.0 0 0.0104 2,285 2,285 0 0.0 0 0.0 0 0.0 0 0.0105 1,618 1,618 0 0.0 0 0.0 0 0.0 0 0.0106 2,007 2,007 0 0.0 0 0.0 0 0.0 0 0.0107 10,372 10,372 0 0.0 0 0.0 0 0.0 0 0.0108 2,261 2,261 0 0.0 0 0.0 0 0.0 0 0.0109 1,360 1,360 19 1.4 0 0.0 19 100.0 0 0.0110 1,493 1,493 0 0.0 0 0.0 0 0.0 0 0.0111 4,306 4,306 0 0.0 0 0.0 0 0.0 0 0.0112 2,365 2,365 0 0.0 0 0.0 0 0.0 0 0.0113 2,479 2,479 17 0.7 0 0.0 17 100.0 0 0.0114 2,463 2,463 18 0.7 0 0.0 18 100.0 0 0.0115 1,429 1,429 0 0.0 0 0.0 0 0.0 0 0.0116 1,072 1,072 0 0.0 0 0.0 0 0.0 0 0.0117 2,307 2,307 5 0.2 0 0.0 5 100.0 0 0.0
44

Region Number TotalProvince/ of Number ofCity Code Livebirths Deliveries No. % No. % No. % No. %Number C13/C11 C15/C12 C17/C12 C19/C12
11 12 13 14 15 16 17 18 19 20
Table 1D.3.b - Deliveries by Type and PlaceBy Region, Province and City
Philippines, 2006
Other Types
Home Hospital OthersTotal
Region 7 137,102 135,339 0 0.0 0 0.0 0 0.0 0 0.0
118 21,771 21,842 0 0.0 0 0.0 0 0.0 0 0.0119 44,927 43,901 0 0.0 0 0.0 0 0.0 0 0.0120 13,669 13,678 0 0.0 0 0.0 0 0.0 0 0.0121 1,124 1,123 0 0.0 0 0.0 0 0.0 0 0.0
122 1,164 1,142 0 0.0 0 0.0 0 0.0 0 0.0123 2,286 2,275 0 0.0 0 0.0 0 0.0 0 0.0124 906 846 0 0.0 0 0.0 0 0.0 0 0.0125 19,062 19,046 0 0.0 0 0.0 0 0.0 0 0.0126 2,669 2,669 0 0.0 0 0.0 0 0.0 0 0.0127 2,558 2,558 0 0.0 0 0.0 0 0.0 0 0.0128 9,125 9,125 0 0.0 0 0.0 0 0.0 0 0.0129 7,835 7,819 0 0.0 0 0.0 0 0.0 0 0.0130 1,682 1,687 0 0.0 0 0.0 0 0.0 0 0.0131 4,101 4,101 0 0.0 0 0.0 0 0.0 0 0.0132 1,254 567 0 0.0 0 0.0 0 0.0 0 0.0133 2,969 2,960 0 0.0 0 0.0 0 0.0 0 0.0
Region 8 78,306 78,306 0 0.0 0 0.0 0 0.0 0 0.0
134 3,505 3,505 0 0.0 0 0.0 0 0.0 0 0.0135 8,915 8,915 0 0.0 0 0.0 0 0.0 0 0.0136 28,733 28,733 0 0.0 0 0.0 0 0.0 0 0.0137 12,898 12,898 0 0.0 0 0.0 0 0.0 0 0.0138 6,094 6,094 0 0.0 0 0.0 0 0.0 0 0.0139 2,862 2,862 0 0.0 0 0.0 0 0.0 0 0.0
140 3,298 3,298 0 0.0 0 0.0 0 0.0 0 0.0141 1,631 1,631 0 0.0 0 0.0 0 0.0 0 0.0142 5,182 5,182 0 0.0 0 0.0 0 0.0 0 0.0143 5,188 5,188 0 0.0 0 0.0 0 0.0 0 0.0
Region 9 63,883 63,838 0 0.0 0 0.0 0 0.0 0 0.0
144 14,251 14,251 0 0.0 0 0.0 0 0.0 0 0.0145 14,503 14,483 0 0.0 0 0.0 0 0.0 0 0.0146 10,500 10,500 0 0.0 0 0.0 0 0.0 0 0.0
147 1,364 1,364 0 0.0 0 0.0 0 0.0 0 0.0148 2,009 2,009 0 0.0 0 0.0 0 0.0 0 0.0149 1,959 1,958 0 0.0 0 0.0 0 0.0 0 0.0150 2,618 2,618 0 0.0 0 0.0 0 0.0 0 0.0151 16,679 16,655 0 0.0 0 0.0 0 0.0 0 0.0
Region 10 89,480 89,480 0 0.0 0 0.0 0 0.0 0 0.0
152 22,589 22,589 0 0.0 0 0.0 0 0.0 0 0.0153 1,581 1,581 0 0.0 0 0.0 0 0.0 0 0.0154 11,727 11,727 0 0.0 0 0.0 0 0.0 0 0.0155 4,568 4,568 0 0.0 0 0.0 0 0.0 0 0.0156 12,320 12,320 0 0.0 0 0.0 0 0.0 0 0.0
45
Region Number TotalProvince/ of Number ofCity Code Livebirths Deliveries No. % No. % No. % No. %Number C13/C11 C15/C12 C17/C12 C19/C12
11 12 13 14 15 16 17 18 19 20
Table 1D.3.b - Deliveries by Type and PlaceBy Region, Province and City
Philippines, 2006
Other Types
Home Hospital OthersTotal
157 14,286 14,286 0 0.0 0 0.0 0 0.0 0 0.0158 2,129 2,129 0 0.0 0 0.0 0 0.0 0 0.0159 9,337 9,337 0 0.0 0 0.0 0 0.0 0 0.0160 3,239 3,239 0 0.0 0 0.0 0 0.0 0 0.0161 1,044 1,044 0 0.0 0 0.0 0 0.0 0 0.0162 2,121 2,121 0 0.0 0 0.0 0 0.0 0 0.0163 1,072 1,072 0 0.0 0 0.0 0 0.0 0 0.0164 3,467 3,467 0 0.0 0 0.0 0 0.0 0 0.0
Region 11 89,626 91,272 0 0.0 0 0.0 0 0.0 0 0.0
165 14,365 14,741 0 0.0 0 0.0 0 0.0 0 0.0166 18,118 18,537 0 0.0 0 0.0 0 0.0 0 0.0167 9,595 9,844 0 0.0 0 0.0 0 0.0 0 0.0168 18,223 18,631 0 0.0 0 0.0 0 0.0 0 0.0
169 29,325 29,519 0 0.0 0 0.0 0 0.0 0 0.0
Region 12 76,401 76,030 1,103 1.4 594 53.9 134 12.1 375 34.0
170 20,107 20,110 628 3.1 569 90.6 59 9.4 0 0.0171 9,952 9,952 0 0.0 0 0.0 0 0.0 0 0.0172 15,637 15,959 400 2.6 25 6.3 0 0.0 375 93.8173 13,728 13,032 0 0.0 0 0.0 0 0.0 0 0.0
174 2,659 2,659 75 2.8 0 0.0 75 100.0 0 0.0175 14,318 14,318 0 0.0 0 0.0 0 0.0 0 0.0
ARMM 67,928 68,300 0 0.0 0 0.0 0 0.0 0 0.0
176 3,410 3,410 0 0.0 0 0.0 0 0.0 0 0.0177 16,968 16,992 0 0.0 0 0.0 0 0.0 0 0.0178 23,187 23,184 0 0.0 0 0.0 0 0.0 0 0.0179 11,824 11,824 0 0.0 0 0.0 0 0.0 0 0.0180 7,759 8,111 0 0.0 0 0.0 0 0.0 0 0.0
181 4,780 4,779 0 0.0 0 0.0 0 0.0 0 0.0
CARAGA 42,244 42,201 0 0.0 0 0.0 0 0.0 0 0.0
182 7,465 7,457 0 0.0 0 0.0 0 0.0 0 0.0183 13,025 13,010 0 0.0 0 0.0 0 0.0 0 0.0184 6,275 6,271 0 0.0 0 0.0 0 0.0 0 0.0185 6,726 6,723 0 0.0 0 0.0 0 0.0 0 0.0
186 1,677 1,673 0 0.0 0 0.0 0 0.0 0 0.0187 4,825 4,825 0 0.0 0 0.0 0 0.0 0 0.0188 2,251 2,242 0 0.0 0 0.0 0 0.0 0 0.0
46

Figure 1D.5Delivery attendant,
Philippines and Regions, 2006
0% 20% 40% 60% 80% 100%
Philippines
NCR
CAR
I
II
III
IV-A
IV-B
V
VI
VII
VIII
IX
X
XI
XII
ARMM
CARAGA
Reg
ion
Percent
DoctorsNursesMidwivesTrained HilotUntrained HilotOthers
47
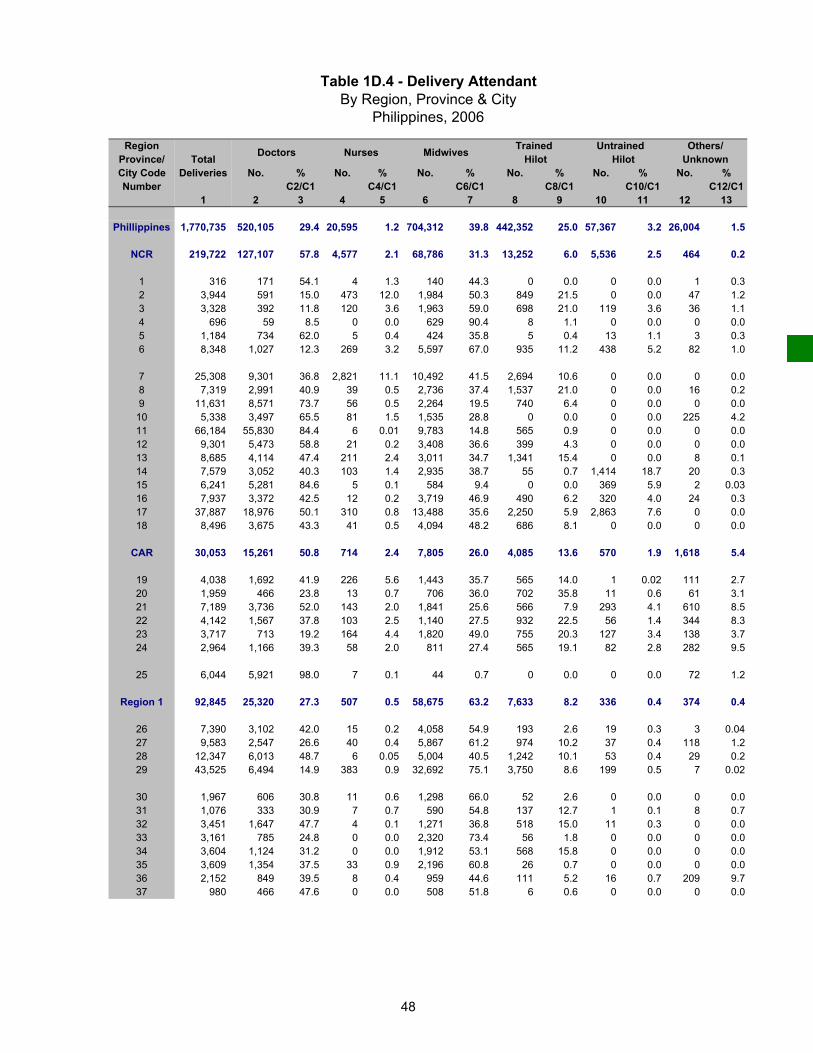
RegionProvince/ TotalCity Code Deliveries No. % No. % No. % No. % No. % No. %Number C2/C1 C4/C1 C6/C1 C8/C1 C10/C1 C12/C1
1 2 3 4 5 6 7 8 9 10 11 12 13
Phillippines 1,770,735 520,105 29.4 20,595 1.2 704,312 39.8 442,352 25.0 57,367 3.2 26,004 1.5
NCR 219,722 127,107 57.8 4,577 2.1 68,786 31.3 13,252 6.0 5,536 2.5 464 0.2
1 316 171 54.1 4 1.3 140 44.3 0 0.0 0 0.0 1 0.32 3,944 591 15.0 473 12.0 1,984 50.3 849 21.5 0 0.0 47 1.23 3,328 392 11.8 120 3.6 1,963 59.0 698 21.0 119 3.6 36 1.14 696 59 8.5 0 0.0 629 90.4 8 1.1 0 0.0 0 0.05 1,184 734 62.0 5 0.4 424 35.8 5 0.4 13 1.1 3 0.36 8,348 1,027 12.3 269 3.2 5,597 67.0 935 11.2 438 5.2 82 1.0 7 25,308 9,301 36.8 2,821 11.1 10,492 41.5 2,694 10.6 0 0.0 0 0.08 7,319 2,991 40.9 39 0.5 2,736 37.4 1,537 21.0 0 0.0 16 0.29 11,631 8,571 73.7 56 0.5 2,264 19.5 740 6.4 0 0.0 0 0.0
10 5,338 3,497 65.5 81 1.5 1,535 28.8 0 0.0 0 0.0 225 4.211 66,184 55,830 84.4 6 0.01 9,783 14.8 565 0.9 0 0.0 0 0.012 9,301 5,473 58.8 21 0.2 3,408 36.6 399 4.3 0 0.0 0 0.013 8,685 4,114 47.4 211 2.4 3,011 34.7 1,341 15.4 0 0.0 8 0.114 7,579 3,052 40.3 103 1.4 2,935 38.7 55 0.7 1,414 18.7 20 0.315 6,241 5,281 84.6 5 0.1 584 9.4 0 0.0 369 5.9 2 0.0316 7,937 3,372 42.5 12 0.2 3,719 46.9 490 6.2 320 4.0 24 0.317 37,887 18,976 50.1 310 0.8 13,488 35.6 2,250 5.9 2,863 7.6 0 0.018 8,496 3,675 43.3 41 0.5 4,094 48.2 686 8.1 0 0.0 0 0.0
CAR 30,053 15,261 50.8 714 2.4 7,805 26.0 4,085 13.6 570 1.9 1,618 5.4
19 4,038 1,692 41.9 226 5.6 1,443 35.7 565 14.0 1 0.02 111 2.720 1,959 466 23.8 13 0.7 706 36.0 702 35.8 11 0.6 61 3.121 7,189 3,736 52.0 143 2.0 1,841 25.6 566 7.9 293 4.1 610 8.522 4,142 1,567 37.8 103 2.5 1,140 27.5 932 22.5 56 1.4 344 8.323 3,717 713 19.2 164 4.4 1,820 49.0 755 20.3 127 3.4 138 3.724 2,964 1,166 39.3 58 2.0 811 27.4 565 19.1 82 2.8 282 9.5
25 6,044 5,921 98.0 7 0.1 44 0.7 0 0.0 0 0.0 72 1.2
Region 1 92,845 25,320 27.3 507 0.5 58,675 63.2 7,633 8.2 336 0.4 374 0.4
26 7,390 3,102 42.0 15 0.2 4,058 54.9 193 2.6 19 0.3 3 0.0427 9,583 2,547 26.6 40 0.4 5,867 61.2 974 10.2 37 0.4 118 1.228 12,347 6,013 48.7 6 0.05 5,004 40.5 1,242 10.1 53 0.4 29 0.229 43,525 6,494 14.9 383 0.9 32,692 75.1 3,750 8.6 199 0.5 7 0.02
30 1,967 606 30.8 11 0.6 1,298 66.0 52 2.6 0 0.0 0 0.031 1,076 333 30.9 7 0.7 590 54.8 137 12.7 1 0.1 8 0.732 3,451 1,647 47.7 4 0.1 1,271 36.8 518 15.0 11 0.3 0 0.033 3,161 785 24.8 0 0.0 2,320 73.4 56 1.8 0 0.0 0 0.034 3,604 1,124 31.2 0 0.0 1,912 53.1 568 15.8 0 0.0 0 0.035 3,609 1,354 37.5 33 0.9 2,196 60.8 26 0.7 0 0.0 0 0.036 2,152 849 39.5 8 0.4 959 44.6 111 5.2 16 0.7 209 9.737 980 466 47.6 0 0.0 508 51.8 6 0.6 0 0.0 0 0.0
Table 1D.4 - Delivery AttendantBy Region, Province & City
Philippines, 2006
NursesDoctors Others/Untrained Trained Midwives Hilot Hilot Unknown
48

RegionProvince/ TotalCity Code Deliveries No. % No. % No. % No. % No. % No. %Number C2/C1 C4/C1 C6/C1 C8/C1 C10/C1 C12/C1
Table 1D.4 - Delivery AttendantBy Region, Province & City
Philippines, 2006
NursesDoctors Others/Untrained Trained Midwives Hilot Hilot Unknown
Region 2 63,046 12,895 20.5 637 1.0 35,035 55.6 13,013 20.6 1,394 2.2 72 0.1
38 17,436 3,529 20.2 215 1.2 8,663 49.7 4,684 26.9 326 1.9 19 0.139 25,603 4,785 18.7 317 1.2 15,209 59.4 4,856 19.0 431 1.7 5 0.0240 8,879 2,140 24.1 80 0.9 4,473 50.4 1,693 19.1 493 5.6 0 0.041 3,750 582 15.5 21 0.6 1,596 42.6 1,378 36.7 125 3.3 48 1.3
42 1,863 534 28.7 0 0.0 1,129 60.6 198 10.6 2 0.1 0 0.043 3,037 240 7.9 1 0.03 2,726 89.8 56 1.8 14 0.5 0 0.044 2,478 1,085 43.8 3 0.1 1,239 50.0 148 6.0 3 0.1 0 0.0
Region 3 191,973 69,415 36.2 1,933 1.0 97,007 50.5 16,671 8.7 2,870 1.5 4,077 2.1
45 4,462 772 17.3 15 0.3 752 16.9 2,840 63.6 67 1.5 16 0.446 9,922 4,256 42.9 3 0.0 5,112 51.5 258 2.6 289 2.9 4 0.0447 46,040 10,886 23.6 120 0.3 31,007 67.3 2,483 5.4 685 1.5 859 1.948 19,085 3,383 17.7 164 0.9 13,491 70.7 1,685 8.8 115 0.6 247 1.349 21,809 12,234 56.1 52 0.2 8,512 39.0 593 2.7 405 1.9 13 0.0650 17,343 3,361 19.4 706 4.1 11,129 64.2 1,985 11.4 60 0.3 102 0.651 8,670 2,813 32.4 111 1.3 3,654 42.1 1,531 17.7 544 6.3 17 0.2
52 10,670 4,112 38.5 126 1.2 5,205 48.8 1,107 10.4 120 1.1 0 0.053 5,224 4,643 88.9 2 0.04 539 10.3 40 0.8 0 0.0 0 0.054 5,620 3,971 70.7 71 1.3 843 15.0 247 4.4 128 2.3 360 6.455 2,084 494 23.7 3 0.1 783 37.6 4 0.2 28 1.3 772 37.056 3,115 186 6.0 1 0.03 1,105 35.5 53 1.7 91 2.9 1,679 53.957 1,124 176 15.7 0 0.0 830 73.8 105 9.3 13 1.2 0 0.058 4,916 2,447 49.8 27 0.5 1,716 34.9 704 14.3 22 0.4 0 0.059 429 144 33.6 3 0.7 114 26.6 142 33.1 26 6.1 0 0.060 4,577 3,370 73.6 0 0.0 783 17.1 424 9.3 0 0.0 0 0.061 2,737 1,284 46.9 232 8.5 840 30.7 108 3.9 273 10.0 0 0.062 15,353 6,195 40.4 1 0.01 7,517 49.0 1,628 10.6 4 0.03 8 0.163 8,793 4,688 53.3 296 3.4 3,075 35.0 734 8.3 0 0.0 0 0.0
Region 4A 234,467 69,160 29.5 2,391 1.0 105,031 44.8 48,525 20.7 6,733 2.9 2,627 1.1
64 33,642 8,983 26.7 28 0.1 18,702 55.6 5,259 15.6 666 4.0 4 0.0165 52,378 16,378 31.3 436 0.8 25,527 48.7 7,465 14.3 1,788 3.4 784 1.566 29,568 5,707 19.3 454 1.5 17,508 59.2 4,727 16.0 1,119 3.8 53 0.267 36,415 7,647 21.0 364 1.0 10,560 29.0 15,294 42.0 1,092 3.0 1,458 4.068 25,780 3,760 14.6 100 0.4 16,535 64.1 4,921 19.1 456 1.8 8 0.03
69 15,310 7,158 46.8 243 1.6 4,372 28.6 2,270 14.8 1,267 8.3 0 0.070 6,230 3,090 49.6 15 0.2 1,474 23.7 1,529 24.5 121 1.9 1 0.0271 5,883 2,686 45.7 0 0.0 1,999 34.0 1,198 20.4 0 0.0 0 0.072 1,946 1,431 73.5 15 0.8 319 16.4 181 9.3 0 0.0 0 0.073 5,393 2,074 38.5 0 0.0 1,268 23.5 2,036 37.8 15 0.3 0 0.074 3,688 1,815 49.2 28 0.8 397 10.8 1,345 36.5 9 0.2 94 2.575 7,663 4,653 60.7 702 9.2 1,405 18.3 903 11.8 0 0.0 0 0.076 4,835 1,755 36.3 6 0.1 2,680 55.4 214 4.4 0 0.0 180 3.777 2,485 825 33.2 0 0.0 976 39.3 621 25.0 63 2.5 0 0.078 1,191 335 28.1 0 0.0 558 46.9 183 15.4 115 9.7 0 0.079 2,060 863 41.9 0 0.0 751 36.5 379 18.4 22 1.1 45 2.2
49

RegionProvince/ TotalCity Code Deliveries No. % No. % No. % No. % No. % No. %Number C2/C1 C4/C1 C6/C1 C8/C1 C10/C1 C12/C1
Table 1D.4 - Delivery AttendantBy Region, Province & City
Philippines, 2006
NursesDoctors Others/Untrained Trained Midwives Hilot Hilot Unknown
Region 4B 51,869 8,043 15.5 521 1.0 15,585 30.0 23,303 44.9 4,235 8.2 182 0.4
80 4,453 614 13.8 23 0.5 1,661 37.3 2,091 47.0 63 1.4 1 0.0281 8,867 1,267 14.3 29 0.3 2,662 30.0 4,608 52.0 228 2.6 73 0.882 12,377 1,298 10.5 210 1.7 4,478 36.2 5,692 46.0 687 5.6 12 0.183 15,163 1,151 7.6 177 1.2 4,090 27.0 6,853 45.2 2,841 18.7 51 0.384 5,276 1,155 21.9 71 1.3 1,764 33.4 2,233 42.3 15 0.3 38 0.7
85 2,365 1,313 55.5 0 0.0 115 4.9 934 39.5 3 0.1 0 0.086 3,368 1,245 37.0 11 0.3 815 24.2 892 26.5 398 11.8 7 0.2
Region 5 113,434 16,857 14.9 1,418 1.3 36,713 32.4 53,121 46.8 4,674 4.1 651 0.6
87 22,051 2,949 13.4 85 0.4 7,888 35.8 10,290 46.7 740 3.4 99 0.488 10,794 1,380 12.8 549 5.1 3,792 35.1 4,618 42.8 357 3.3 98 0.989 28,924 1,846 6.4 368 1.3 9,484 32.8 14,278 49.4 2,893 10.0 55 0.290 5,251 1,359 25.9 6 0.1 755 14.4 3,131 59.6 0 0.0 0 0.091 20,811 1,901 9.1 187 0.9 7,656 36.8 10,435 50.1 573 2.8 59 0.392 16,522 4,322 26.2 62 0.4 4,040 24.5 7,671 46.4 87 0.5 340 2.1
93 2,084 240 11.5 10 0.5 1,113 53.4 721 34.6 0 0.0 0 0.094 2,981 1,085 36.4 51 1.7 928 31.1 894 30.0 23 0.8 0 0.095 4,016 1,775 44.2 100 2.5 1,057 26.3 1,083 27.0 1 0.02 0 0.0
Region 6 128,560 42,462 33.0 697 0.5 41,214 32.1 41,490 32.3 2,549 2.0 148 0.1
96 8,066 1,408 17.5 63 0.8 3,864 47.9 2,693 33.4 33 0.4 5 0.197 9,742 2,390 24.5 21 0.2 3,413 35.0 3,825 39.3 89 0.9 4 0.0498 8,294 1,221 14.7 64 0.8 3,452 41.6 3,193 38.5 362 4.4 2 0.0299 2,794 1,208 43.2 1 0.04 513 18.4 1,056 37.8 16 0.6 0 0.0
100 28,676 8,260 28.8 131 0.5 10,994 38.3 9,023 31.5 238 0.8 30 0.1101 19,296 3,109 16.1 148 0.8 8,518 44.1 6,455 33.5 1,004 5.2 62 0.3
102 12,697 8,380 66.0 64 0.5 868 6.8 3,379 26.6 6 0.05 0 0.0103 1,178 167 14.2 0 0.0 927 78.7 73 6.2 11 0.9 0 0.0104 2,285 1,173 51.3 15 0.7 245 10.7 777 34.0 75 3.3 0 0.0105 1,618 254 15.7 0 0.0 288 17.8 1,051 65.0 0 0.0 25 1.5106 2,007 462 23.0 0 0.0 674 33.6 753 37.5 118 5.9 0 0.0107 10,372 8,225 79.3 1 0.01 699 6.7 1,447 14.0 0 0.0 0 0.0108 2,261 654 28.9 4 0.2 445 19.7 1,105 48.9 36 1.6 17 0.8109 1,360 366 26.9 0 0.0 469 34.5 508 37.4 17 1.3 0 0.0110 1,493 260 17.4 0 0.0 459 30.7 767 51.4 7 0.5 0 0.0111 4,306 1,931 44.8 94 2.2 1,408 32.7 871 20.2 0 0.0 2 0.05112 2,365 511 21.6 1 0.04 745 31.5 1,072 45.3 36 1.5 0 0.0113 2,479 401 16.2 38 1.5 652 26.3 1,174 47.4 214 8.6 0 0.0114 2,463 1,416 57.5 42 1.7 415 16.8 575 23.3 15 0.6 0 0.0115 1,429 85 5.9 0 0.0 739 51.7 440 30.8 164 11.5 1 0.1116 1,072 1 0.1 5 0.5 175 16.3 790 73.7 101 9.4 0 0.0117 2,307 580 25.1 5 0.2 1,252 54.3 463 20.1 7 0.3 0 0.0
50

RegionProvince/ TotalCity Code Deliveries No. % No. % No. % No. % No. % No. %Number C2/C1 C4/C1 C6/C1 C8/C1 C10/C1 C12/C1
Table 1D.4 - Delivery AttendantBy Region, Province & City
Philippines, 2006
NursesDoctors Others/Untrained Trained Midwives Hilot Hilot Unknown
Region 7 135,339 37,993 28.1 821 0.6 65,066 48.1 29,741 22.0 1,718 1.3 0 0.0
118 21,842 5,488 25.1 106 0.5 11,790 54.0 4,070 18.6 388 1.8 0 0.0119 43,901 7,466 17.0 105 0.2 27,909 63.6 7,779 17.7 642 1.5 0 0.0120 13,678 2,255 16.5 5 0.04 5,029 36.8 6,084 44.5 305 2.2 0 0.0121 1,123 109 9.7 1 0.1 933 83.1 75 6.7 5 0.4 0 0.0
122 1,142 335 29.3 0 0.0 196 17.2 522 45.7 89 7.8 0 0.0123 2,275 361 15.9 4 0.2 992 43.6 809 35.6 109 4.8 0 0.0124 846 109 12.9 0 0.0 204 24.1 498 58.9 35 4.1 0 0.0125 19,046 10,332 54.2 15 0.1 6,036 31.7 2,660 14.0 3 0.0 0 0.0126 2,669 585 21.9 3 0.1 1,015 38.0 1,066 39.9 0 0.0 0 0.0127 2,558 2,276 89.0 0 0.0 65 2.5 215 8.4 2 0.1 0 0.0128 9,125 2,720 29.8 532 5.8 3,212 35.2 2,661 29.2 0 0.0 0 0.0129 7,819 2,975 38.0 14 0.2 3,339 42.7 1,379 17.6 112 1.4 0 0.0130 1,687 1,003 59.5 0 0.0 677 40.1 1 0.1 6 0.4 0 0.0131 4,101 1,023 24.9 6 0.1 2,734 66.7 332 8.1 6 0.1 0 0.0132 567 379 66.8 0 0.0 105 18.5 82 14.5 1 0.2 0 0.0133 2,960 577 19.5 30 1.0 830 28.0 1,508 50.9 15 0.5 0 0.0
Region 8 78,306 18,813 24.0 625 0.8 29,089 37.1 26,510 33.9 2,594 3.3 675 0.9
134 3,505 620 17.7 12 0.3 202 5.8 1,403 40.0 1,268 36.2 0 0.0135 8,915 1,313 14.7 92 1.0 3,837 43.0 3,522 39.5 151 1.7 0 0.0136 28,733 5,694 19.8 182 0.6 15,878 55.3 6,931 24.1 39 0.1 9 0.03137 12,898 1,754 13.6 86 0.7 3,932 30.5 6,510 50.5 601 4.7 15 0.1138 6,094 2,525 41.4 87 1.4 1,984 32.6 1,185 19.4 313 5.1 0 0.0139 2,862 343 12.0 55 1.9 1,116 39.0 1,240 43.3 97 3.4 11 0.4
140 3,298 594 18.0 2 0.1 495 15.0 2,082 63.1 125 3.8 0 0.0141 1,631 1,012 62.0 0 0.0 501 30.7 118 7.2 0 0.0 0 0.0142 5,182 1,641 31.7 109 2.1 706 13.6 2,086 40.3 0 0.0 640 12.4143 5,188 3,317 63.9 0 0.0 438 8.4 1,433 27.6 0 0.0 0 0.0
Region 9 63,838 9,143 14.3 1,708 2.7 25,452 39.9 24,445 38.3 2,932 4.6 158 0.2
144 14,251 1,341 9.4 110 0.8 7,147 50.2 4,839 34.0 802 5.6 12 0.1145 14,483 870 6.0 571 3.9 5,795 40.0 6,469 44.7 662 4.6 116 0.8146 10,500 648 6.2 137 1.3 4,329 41.2 4,529 43.1 833 7.9 24 0.2
147 1,364 603 44.2 15 1.1 265 19.4 380 27.9 101 7.4 0 0.0148 2,009 1,068 53.2 1 0.05 347 17.3 346 17.2 247 12.3 0 0.0149 1,958 232 11.8 2 0.1 893 45.6 772 39.4 59 3.0 0 0.0150 2,618 598 22.8 2 0.1 438 16.7 1,564 59.7 16 0.6 0 0.0151 16,655 3,783 22.7 870 5.2 6,238 37.5 5,546 33.3 212 1.3 6 0.04
51

RegionProvince/ TotalCity Code Deliveries No. % No. % No. % No. % No. % No. %Number C2/C1 C4/C1 C6/C1 C8/C1 C10/C1 C12/C1
Table 1D.4 - Delivery AttendantBy Region, Province & City
Philippines, 2006
NursesDoctors Others/Untrained Trained Midwives Hilot Hilot Unknown
Region 10 89,480 16,341 18.3 361 0.4 34,923 39.0 28,900 32.3 1,152 1.3 7,803 8.7
152 22,589 2,735 12.1 77 0.3 8,404 37.2 10,464 46.3 732 3.2 177 0.8153 1,581 461 29.2 17 1.1 814 51.5 288 18.2 1 0.1 0 0.0154 11,727 2,241 19.1 26 0.2 8,189 69.8 1,158 9.9 104 0.9 9 0.1155 4,568 776 17.0 14 0.3 2,305 50.5 1,368 29.9 96 2.1 9 0.2156 12,320 2,226 18.1 19 0.2 6,242 50.7 3,810 30.9 18 0.1 5 0.04
157 14,286 891 6.2 54 0.4 1,680 11.8 4,010 28.1 51 0.4 7,600 53.2158 2,129 366 17.2 6 0.3 356 16.7 1,300 61.1 101 4.7 0 0.0159 9,337 3,354 35.9 41 0.4 3,176 34.0 2,766 29.6 0 0.0 0 0.0160 3,239 871 26.9 2 0.1 793 24.5 1,538 47.5 32 1.0 3 0.1161 1,044 520 49.8 0 0.0 96 9.2 428 41.0 0 0.0 0 0.0162 2,121 1,116 52.6 0 0.0 81 3.8 913 43.0 11 0.5 0 0.0163 1,072 312 29.1 3 0.3 378 35.3 373 34.8 6 0.6 0 0.0164 3,467 472 13.6 102 2.9 2,409 69.5 484 14.0 0 0.0 0 0.0
Region 11 91,272 24,299 26.6 753 0.8 20,558 22.5 33,794 37.0 6,236 6.8 5,632 6.2
165 14,741 2,980 20.2 243 1.6 2,839 19.3 6,266 42.5 1,335 9.1 1,078 7.3166 18,537 5,464 29.5 45 0.2 3,971 21.4 6,694 36.1 564 3.0 1,799 9.7167 9,844 2,171 22.1 32 0.3 2,068 21.0 4,484 45.6 602 6.1 487 4.9168 18,631 3,852 20.7 76 0.4 2,530 13.6 8,466 45.4 2,925 15.7 782 4.2
169 29,519 9,832 33.3 357 1.2 9,150 31.0 7,884 26.7 810 2.7 1,486 5.0
Region 12 76,030 13,730 18.1 482 0.6 22,768 29.9 32,771 43.1 5,720 7.5 559 0.7
170 20,110 3,000 14.9 45 0.2 5,121 25.5 10,000 49.7 1,918 9.5 26 0.1171 9,952 934 9.4 40 0.4 3,414 34.3 4,846 48.7 614 6.2 104 1.0172 15,959 3,214 20.1 107 0.7 5,651 35.4 4,347 27.2 2,449 15.3 191 1.2173 13,032 1,816 13.9 42 0.3 4,954 38.0 5,755 44.2 445 3.4 20 0.2
174 2,659 782 29.4 33 1.2 630 23.7 957 36.0 124 4.7 133 5.0175 14,318 3,984 27.8 215 1.5 2,998 20.9 6,866 48.0 170 1.2 85 0.6
ARMM 68,300 4,748 7.0 2,241 3.3 26,530 38.8 26,445 38.7 7,422 10.9 914 1.3
176 3,410 352 10.3 55 1.6 542 15.9 2,081 61.0 317 9.3 63 1.8177 16,992 815 4.8 312 1.8 9,322 54.9 3,687 21.7 2,121 12.5 735 4.3178 23,184 1,381 6.0 188 0.8 8,326 35.9 10,554 45.5 2,676 11.5 59 0.3179 11,824 1,019 8.6 375 3.2 2,715 23.0 5,883 49.8 1,795 15.2 37 0.3180 8,111 351 4.3 441 5.4 4,186 51.6 2,640 32.5 493 6.1 0 0.0
181 4,779 830 17.4 870 18.2 1,439 30.1 1,600 33.5 20 0.4 20 0.4
CARAGA 42,201 8,518 20.2 209 0.5 14,075 33.4 18,653 44.2 696 1.6 50 0.1
182 7,457 1,068 14.3 22 0.3 3,274 43.9 2,877 38.6 176 2.4 40 0.5183 13,010 1,753 13.5 101 0.8 5,721 44.0 5,180 39.8 255 2.0 0 0.0184 6,271 802 12.8 71 1.1 2,265 36.1 2,999 47.8 128 2.0 6 0.1185 6,723 1,317 19.6 14 0.2 1,954 29.1 3,363 50.0 74 1.1 1 0.01
186 1,673 659 39.4 0 0.0 380 22.7 604 36.1 27 1.6 3 0.2187 4,825 1,973 40.9 0 0.0 384 8.0 2,445 50.7 23 0.5 0 0.0188 2,242 946 42.2 1 0.04 97 4.3 1,185 52.9 13 0.6 0 0.0
52


![Chapter 17, Solution 1. 2 periodic ω πω · Hence f(t) = sin(n t) n 10 1 n 1 π π + ∑ ∞ = 5 Chapter 17, Solution 5. T =2π, ω=2π/T =1 [1x 2x ] 0.5 2 1 z(t)dt T 1 a T 0 o](https://img.pdfslide.tips/doc/110x75/6074eba23279511438525e78/chapter-17-solution-1-2-periodic-hence-ft-sinn-t-n-10-1-n-1-.jpg)

![cheminfinity.com Chapter 1 @cheminfinity · t = [][][] = [] = ) + + . −−== =. =+ ′ =−+ == = − = −. − ′ =−+ ′′′() ()() − +=− − −+ =− + =− 0](https://img.pdfslide.tips/doc/110x75/5f8a96e44672461a4d6c686a/chapter-1-cheminfinity-t-aa-a-a-.jpg)


![Lecture of TF Chapter 1[1].t](https://img.pdfslide.tips/doc/110x75/55cf987a550346d03397e421/lecture-of-tf-chapter-11t.jpg)