Embed Size (px)
Citation preview
Chapter 14 Chapter 14 –– Applications of Molecular Applications of Molecular Absorption SpectrometryAbsorption Spectrometry
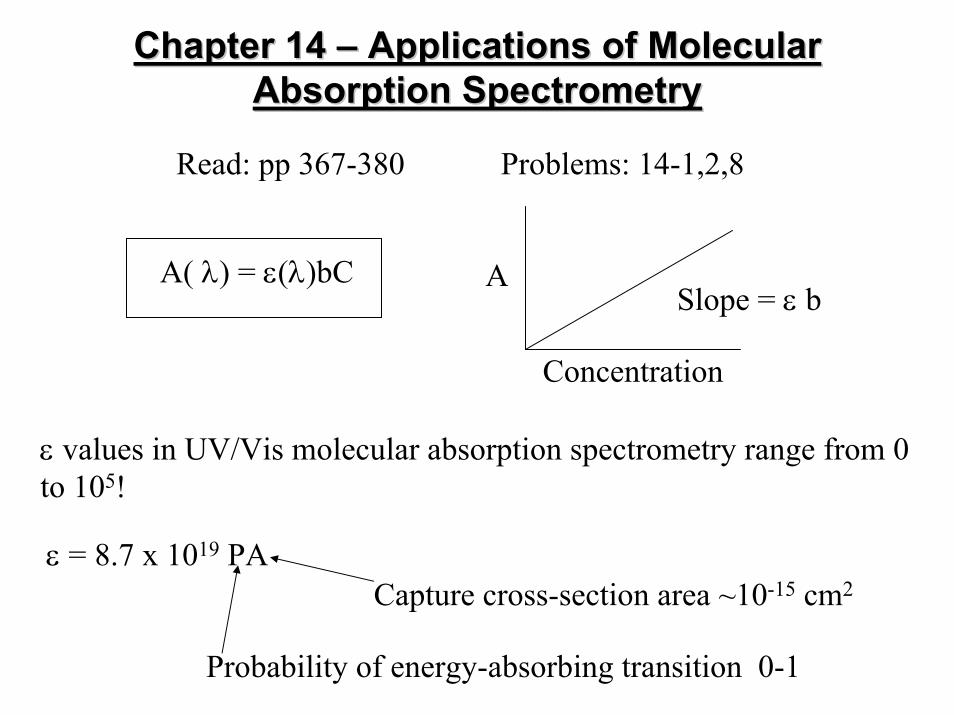
Read: pp 367-380 Problems: 14-1,2,8
Concentration
Slope = ε bA( λ) = ε(λ)bC A
ε values in UV/Vis molecular absorption spectrometry range from 0 to 105!
ε = 8.7 x 10¹⁹ PACapture cross-section area ~10-15 cm2
Probability of energy-absorbing transition 0-1
Absorbance Measurements in Gas vs. Absorbance Measurements in Gas vs. Liquid PhaseLiquid Phase
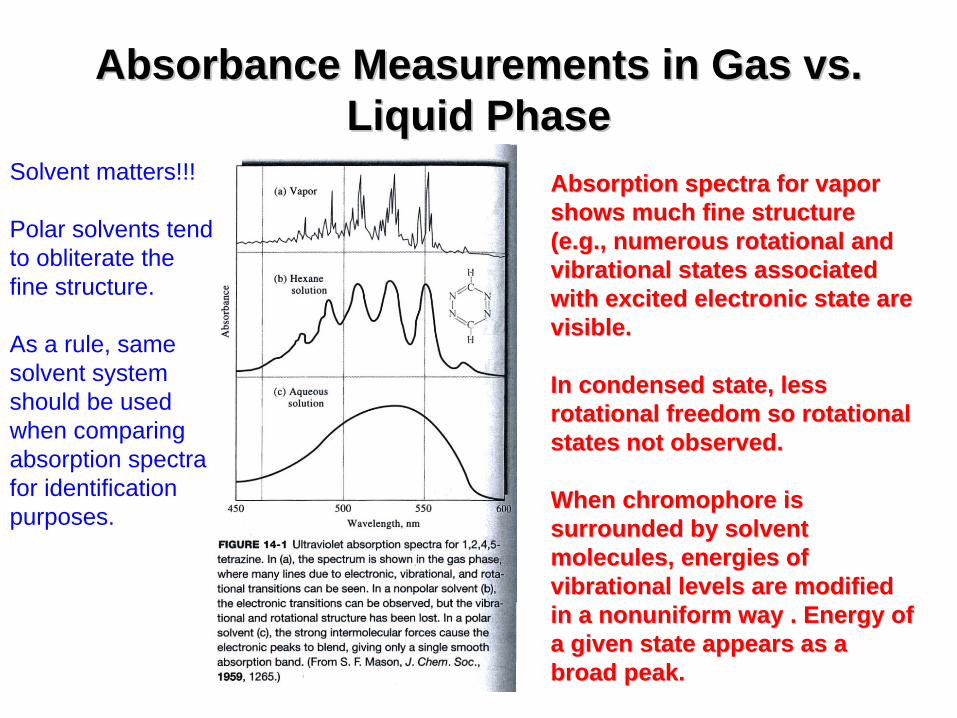
Absorption spectra for vapor Absorption spectra for vapor shows much fine structure shows much fine structure (e.g., numerous rotational and (e.g., numerous rotational and vibrationalvibrational states associated states associated with excited electronic state are with excited electronic state are visible.visible.
In condensed state, less In condensed state, less rotational freedom so rotational rotational freedom so rotational states not observed.states not observed.
When When chromophorechromophore is is surrounded by solvent surrounded by solvent molecules, energies of molecules, energies of vibrationalvibrational levels are modified levels are modified in a in a nonuniformnonuniform way . Energy of way . Energy of a given state appears as a a given state appears as a broad peak.broad peak.
Solvent matters!!!
Polar solvents tend to obliterate the fine structure.
As a rule, same solvent system should be used when comparing absorption spectra for identification purposes.
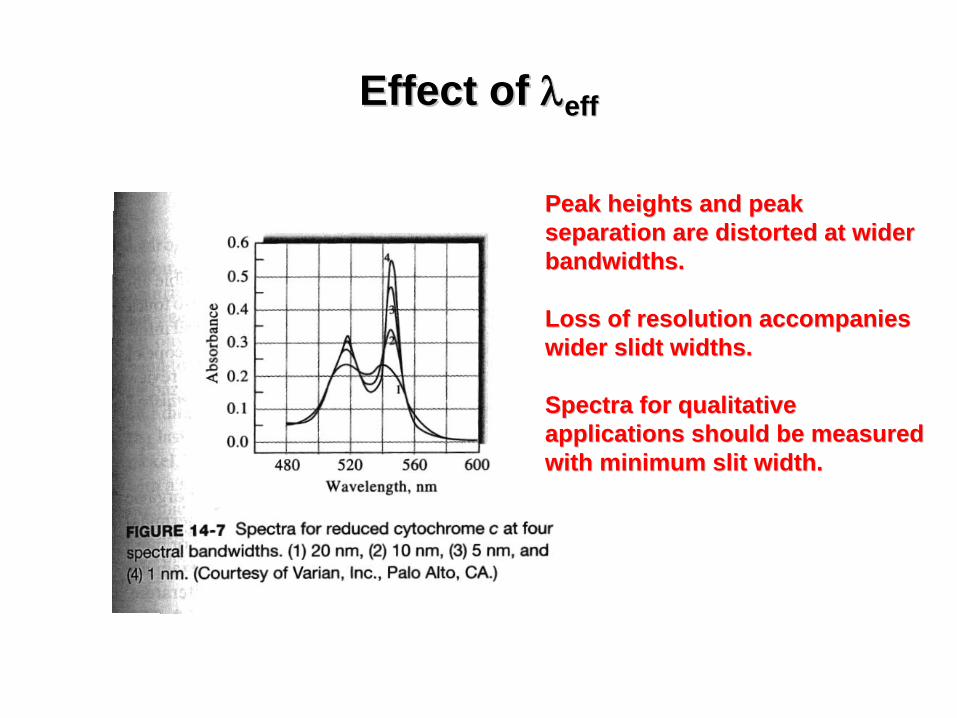
Effect of Effect of λλ
effeff
Peak heights and peak Peak heights and peak separation are distorted at wider separation are distorted at wider bandwidths.bandwidths.
Loss of resolution accompanies Loss of resolution accompanies wider wider slidtslidt widths.widths.
Spectra for qualitative Spectra for qualitative applications should be measured applications should be measured with minimum slit width.with minimum slit width.
Absorbing SpeciesAbsorbing Species
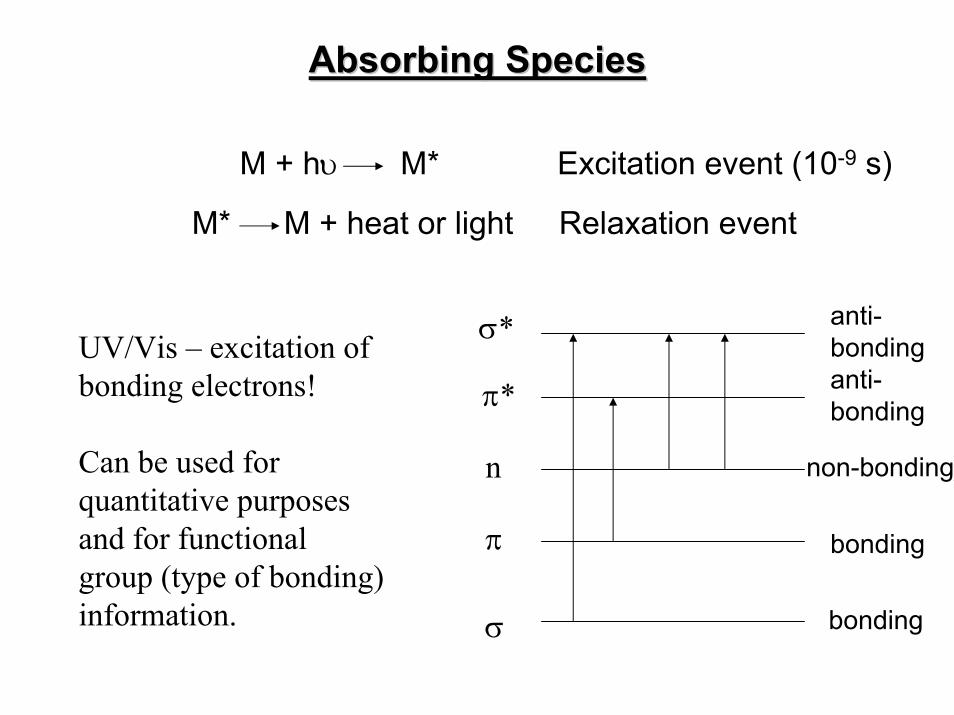
Excitation event (10-9 s)M + hυ M*
Relaxation eventM* M + heat or light
non-bonding
σ
π
n
π*
σ*
bonding
bonding
anti-bonding
anti-bondingUV/Vis – excitation of
bonding electrons!
Can be used for quantitative purposes and for functional group (type of bonding) information.
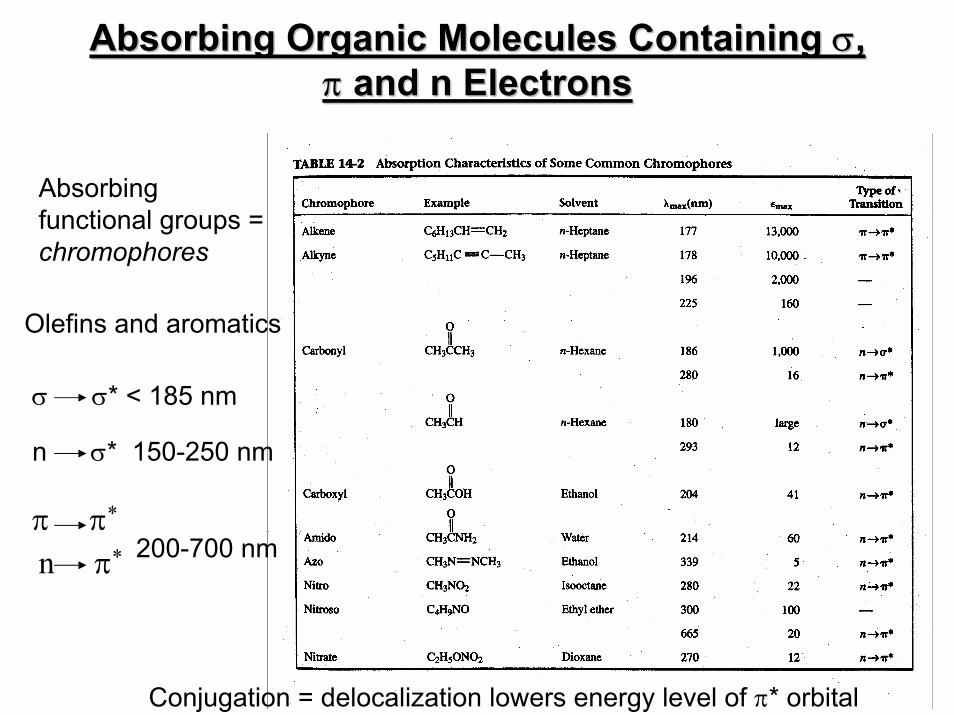
Absorbing Organic Molecules Containing Absorbing Organic Molecules Containing σσ, , ππ and n Electronsand n Electrons
σ σ* < 185 nm
Olefins and aromatics
n σ* 150-250 nm
π π*
n π* 200-700 nm
Conjugation = delocalization lowers energy level of π* orbital
Absorbing functional groups = chromophores
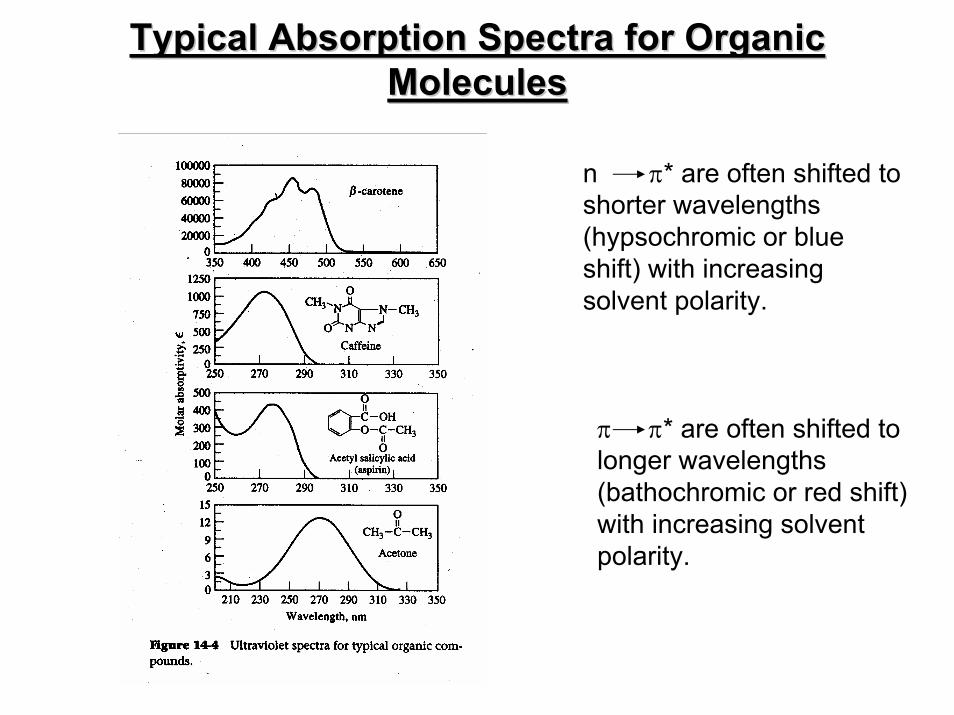
Typical Absorption Spectra for Organic Typical Absorption Spectra for Organic MoleculesMolecules
n π* are often shifted to shorter wavelengths (hypsochromic or blue shift) with increasing solvent polarity.
π π* are often shifted to longer wavelengths (bathochromic or red shift) with increasing solvent polarity.
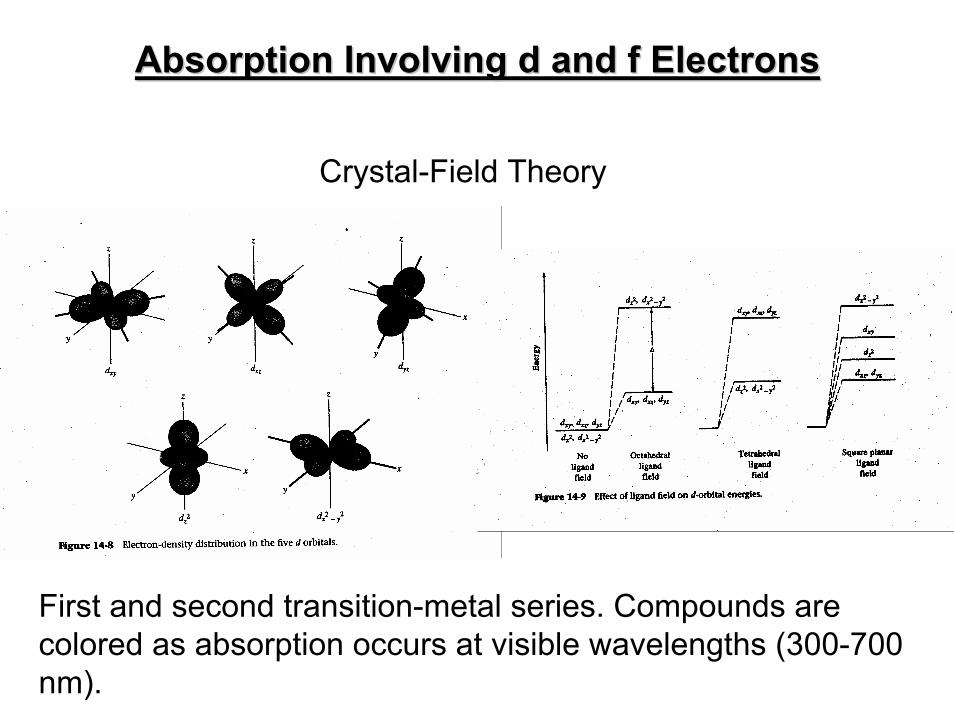
Absorption Involving d and f ElectronsAbsorption Involving d and f Electrons
Crystal-Field Theory
First and second transition-metal series. Compounds are colored as absorption occurs at visible wavelengths (300-700 nm).
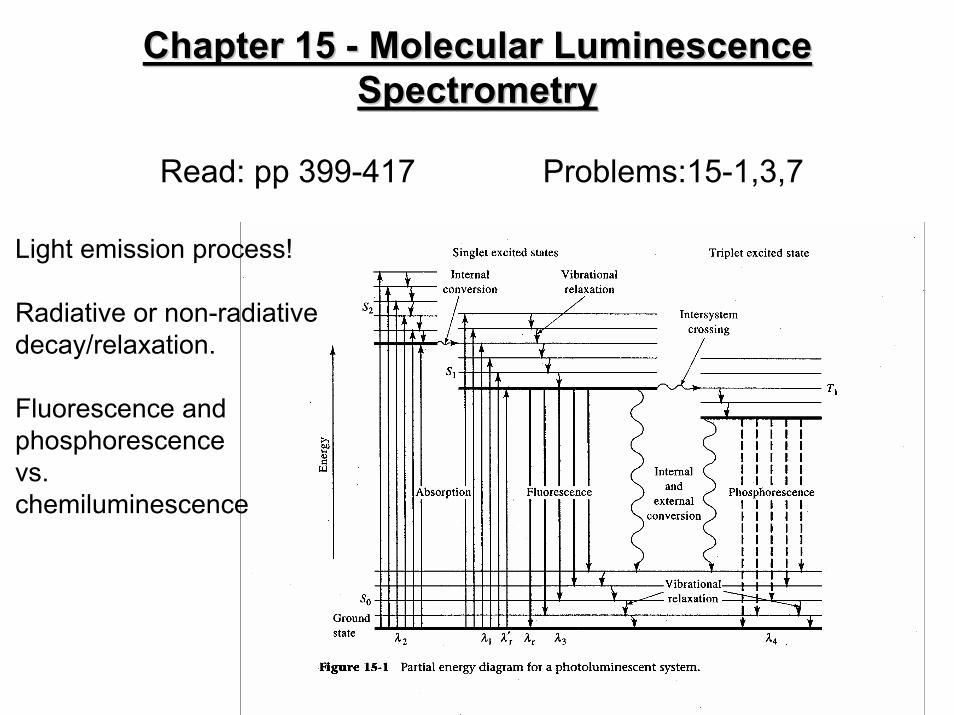
Chapter 15 Chapter 15 -- Molecular Luminescence Molecular Luminescence SpectrometrySpectrometry
Read: pp 399-417 Problems:15-1,3,7
Light emission process!
Radiative or non-radiativedecay/relaxation.
Fluorescence and phosphorescencevs.chemiluminescence
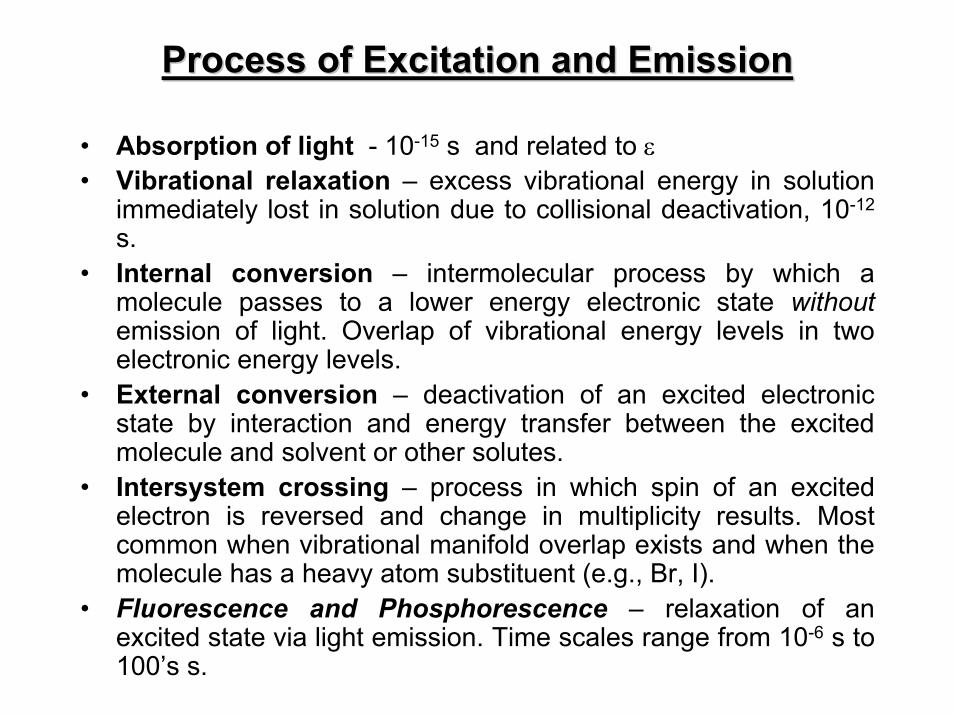
Process of Excitation and EmissionProcess of Excitation and Emission
• Absorption of light - 10-15 s and related to ε• Vibrational relaxation – excess vibrational energy in solution
immediately lost in solution due to collisional deactivation, 10-12
s.• Internal conversion – intermolecular process by which a
molecule passes to a lower energy electronic state without emission of light. Overlap of vibrational energy levels in two electronic energy levels.
• External conversion – deactivation of an excited electronic state by interaction and energy transfer between the excited molecule and solvent or other solutes.
• Intersystem crossing – process in which spin of an excited electron is reversed and change in multiplicity results. Most common when vibrational manifold overlap exists and when the molecule has a heavy atom substituent (e.g., Br, I).
• Fluorescence and Phosphorescence – relaxation of an excited state via light emission. Time scales range from 10-6 s to 100’s s.
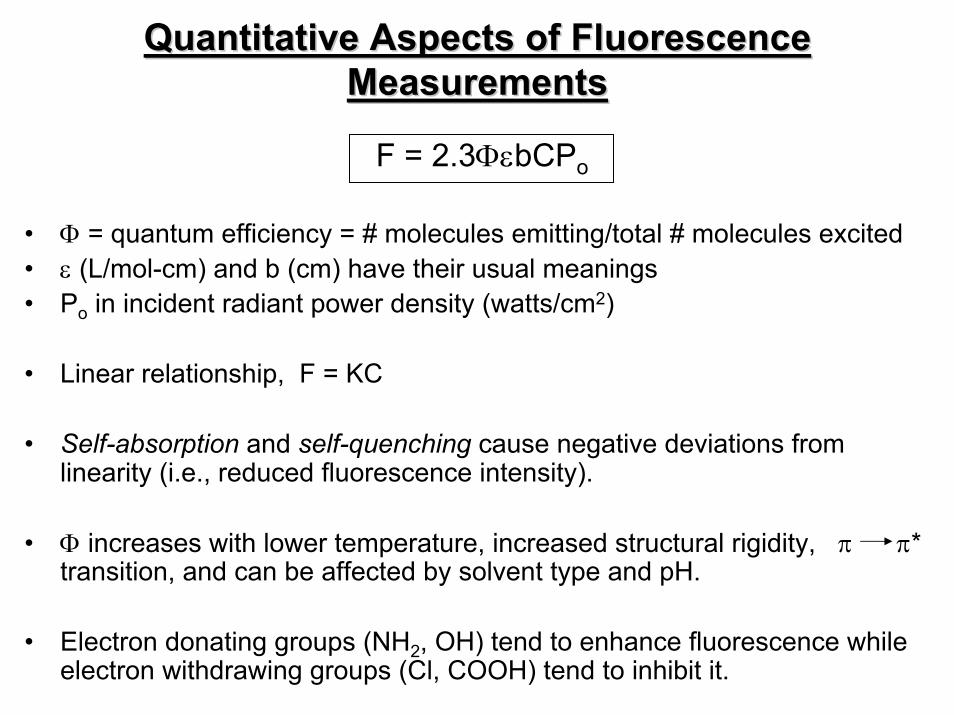
Quantitative Aspects of Fluorescence Quantitative Aspects of Fluorescence MeasurementsMeasurements
F = 2.3ΦεbCPo
• Φ = quantum efficiency = # molecules emitting/total # molecules excited• ε (L/mol-cm) and b (cm) have their usual meanings• Po in incident radiant power density (watts/cm2)
• Linear relationship, F = KC
• Self-absorption and self-quenching cause negative deviations from linearity (i.e., reduced fluorescence intensity).
• Φ increases with lower temperature, increased structural rigidity, π π* transition, and can be affected by solvent type and pH.
• Electron donating groups (NH2, OH) tend to enhance fluorescence while electron withdrawing groups (Cl, COOH) tend to inhibit it.
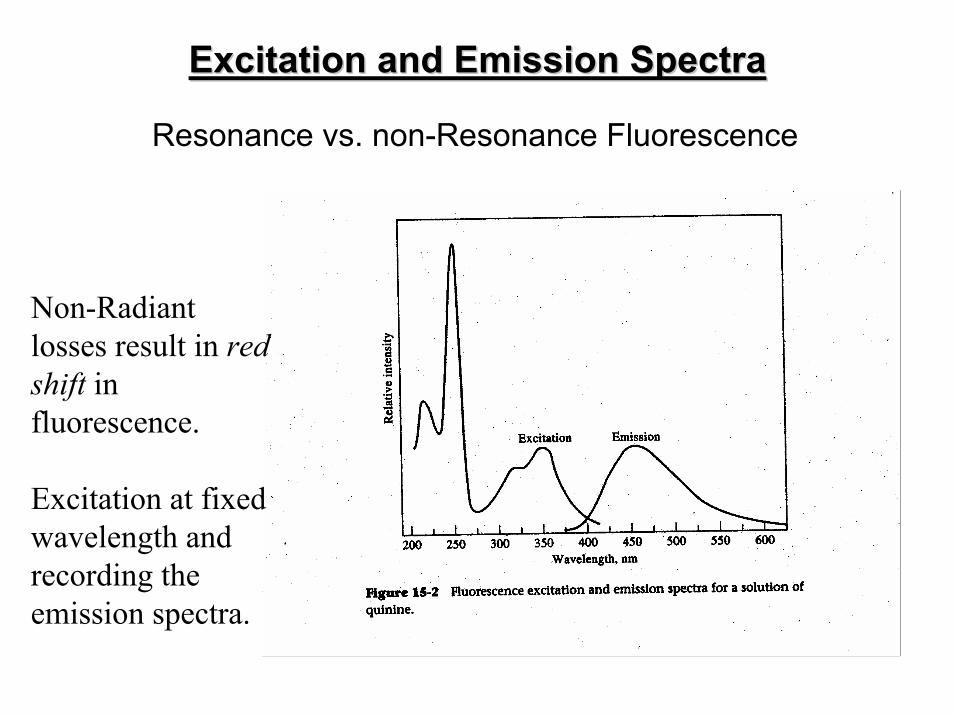
Excitation and Emission SpectraExcitation and Emission Spectra
Resonance vs. non-Resonance Fluorescence
Non-Radiant losses result in red shift in fluorescence.
Excitation at fixed wavelength and recording the emission spectra.
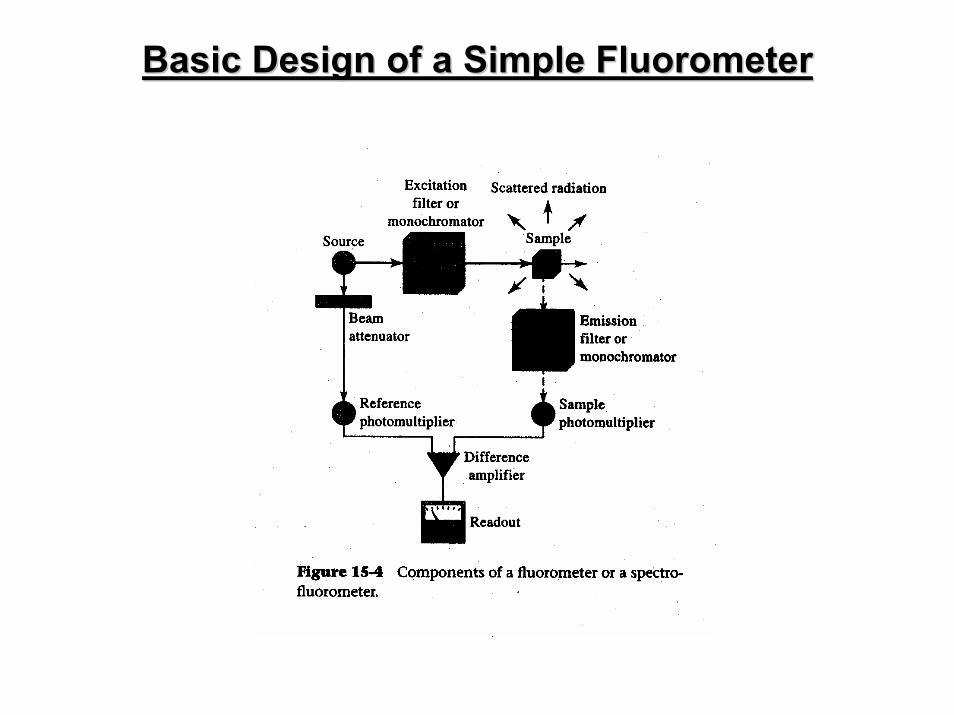
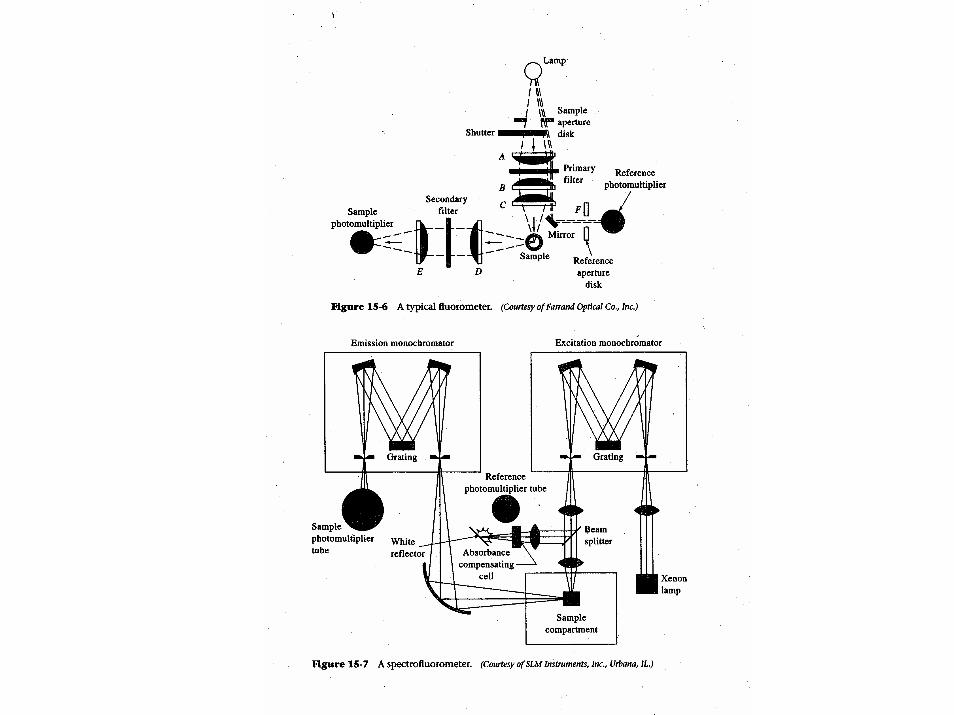
Basic Design of a Simple Basic Design of a Simple FluorometerFluorometer
Chapter 7 Chapter 7 –– Components of Optical Components of Optical InstrumentsInstruments
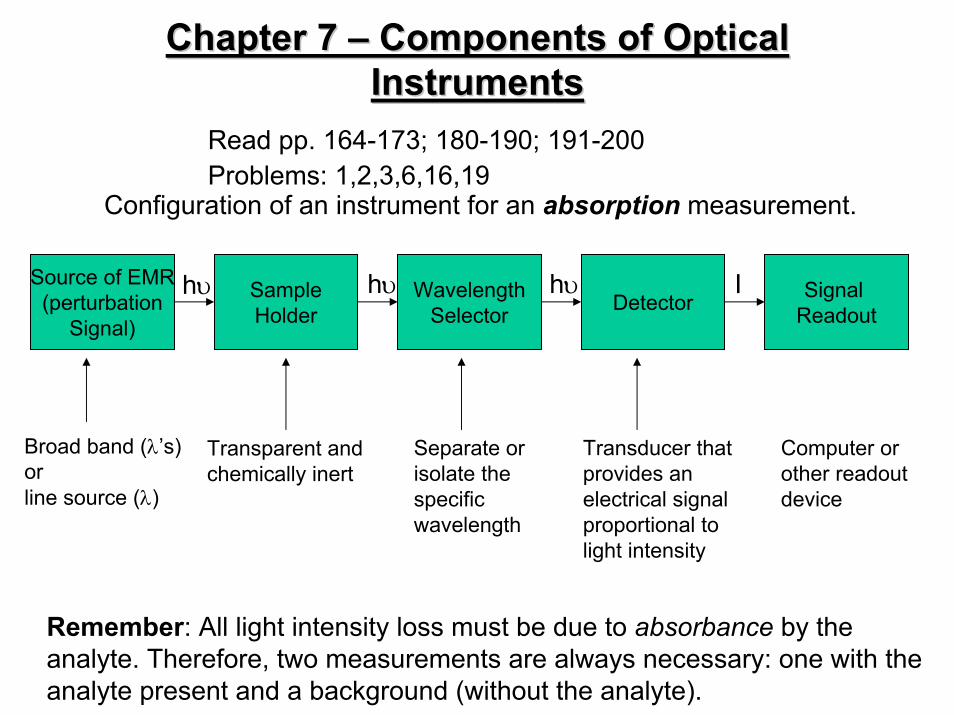
Read pp. 164-173; 180-190; 191-200 Problems: 1,2,3,6,16,19
Configuration of an instrument for an absorption measurement.
Source of EMR(perturbation
Signal)
h SampleHolder
WavelengthSelector Detector Signal
Readouthυ hυ Iυ
Broad band (λ’s)orline source (λ)
Separate or isolate the specificwavelength
Transducer that provides an electrical signal proportional to light intensity
Computer or other readout device
Transparent andchemically inert
Rememanalyte.analyte
ber: All light intensity loss must be due to absorbance by the Therefore, two measurements are always necessary: one with thepresent and a background (without the analyte).
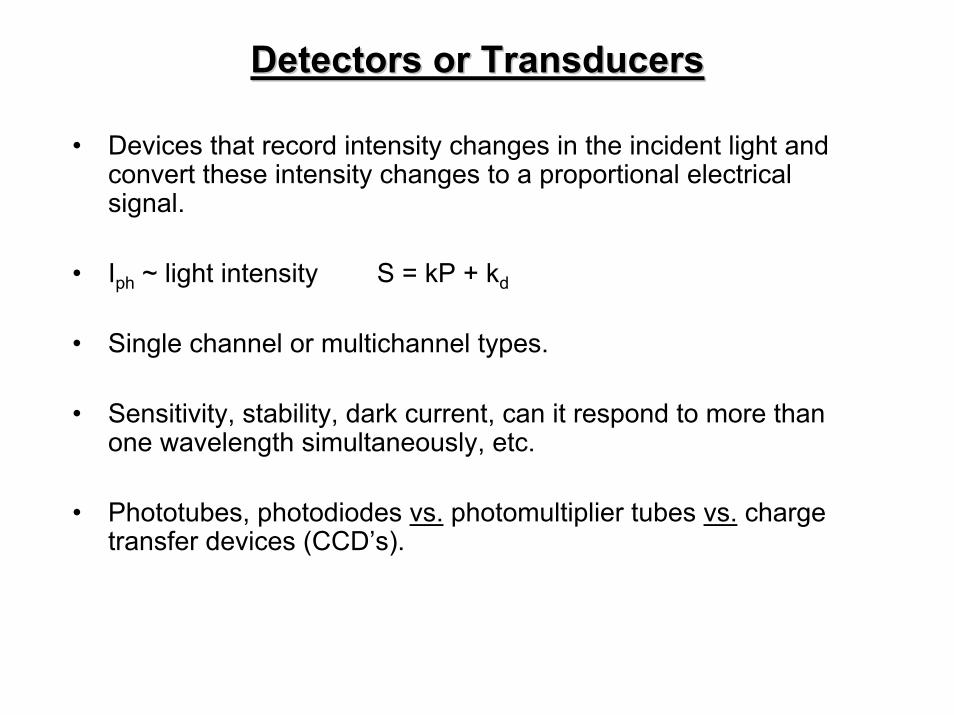
Detectors or TransducersDetectors or Transducers
• Devices that record intensity changes in the incident light and convert these intensity changes to a proportional electrical signal.
• Iph ~ light intensity S = kP + kd
• Single channel or multichannel types.
• Sensitivity, stability, dark current, can it respond to more than one wavelength simultaneously, etc.
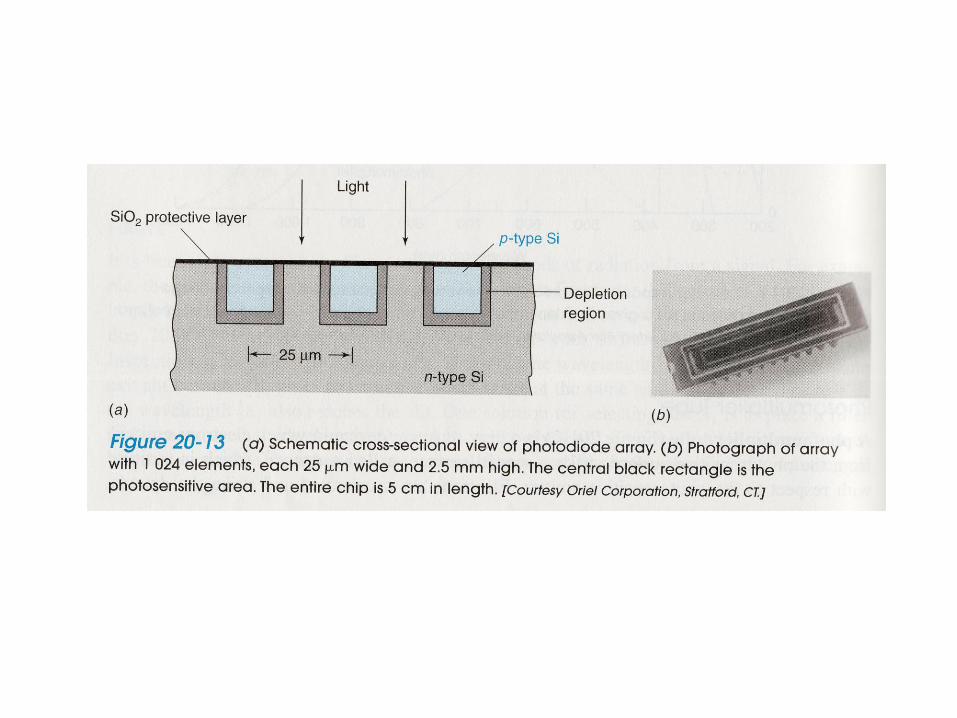
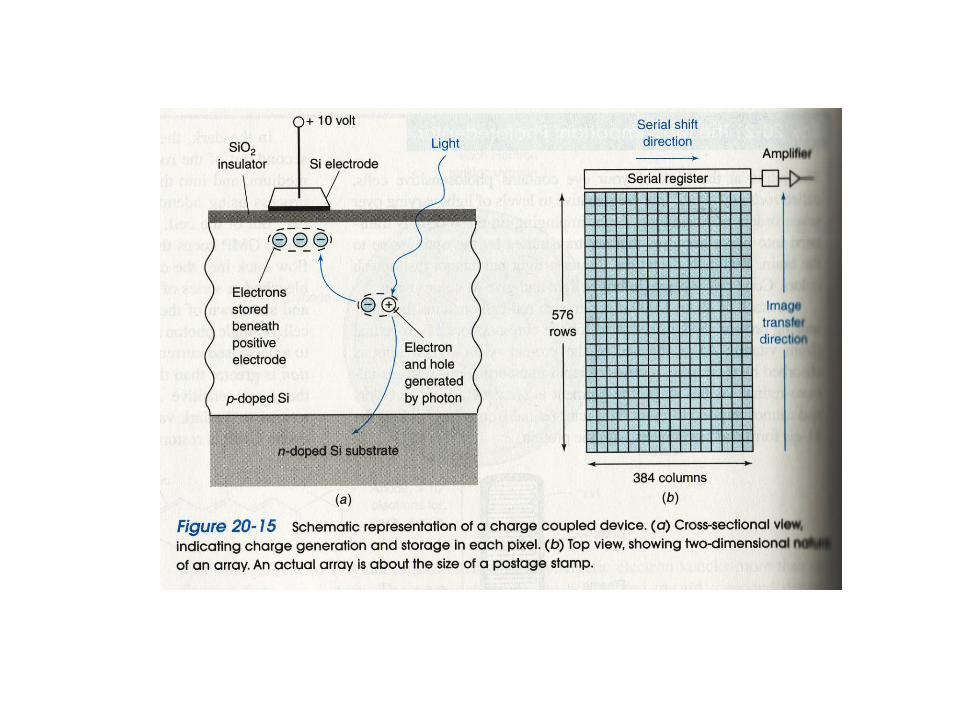
• Phototubes, photodiodes vs. photomultiplier tubes vs. charge transfer devices (CCD’s).
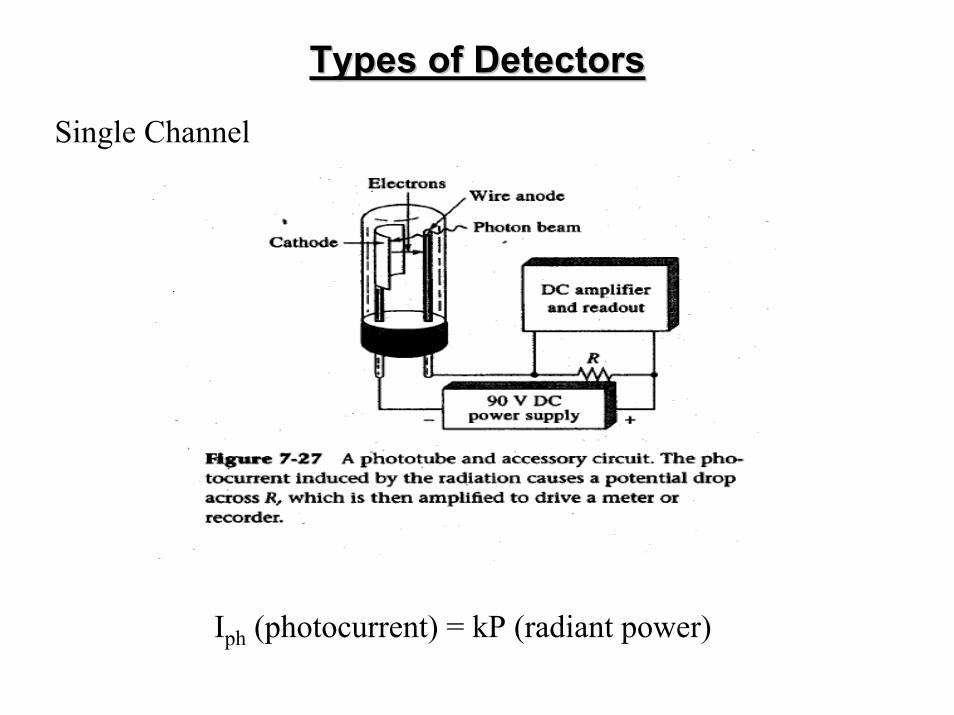
Types of DetectorsTypes of Detectors
Single Channel
Iph (photocurrent) = kP (radiant power)
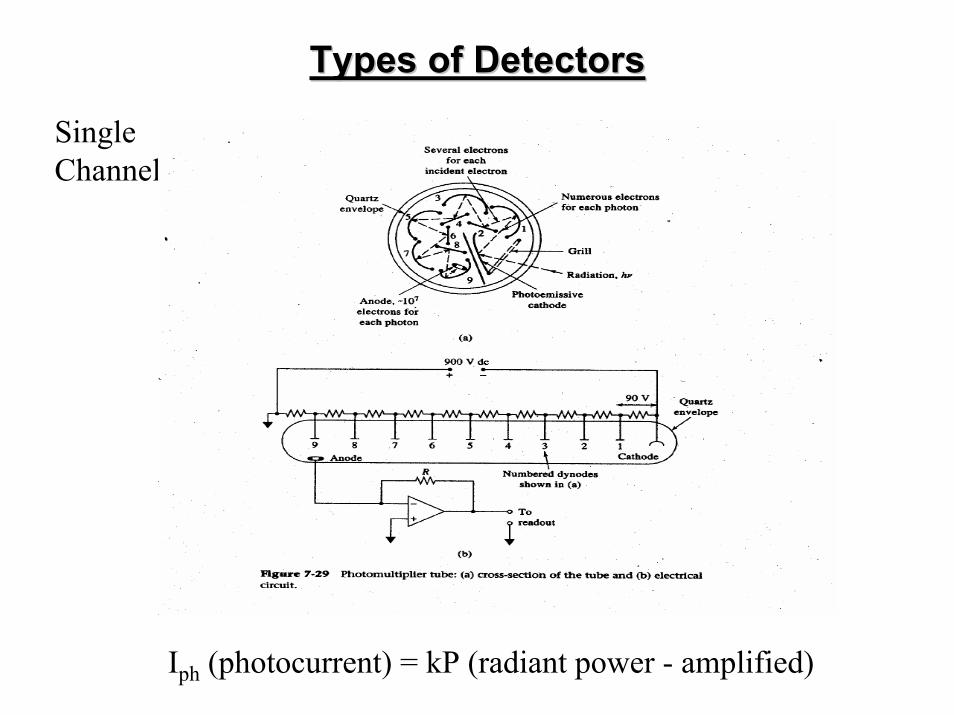
Types of DetectorsTypes of Detectors
Single Channel
Iph (photocurrent) = kP (radiant power - amplified)
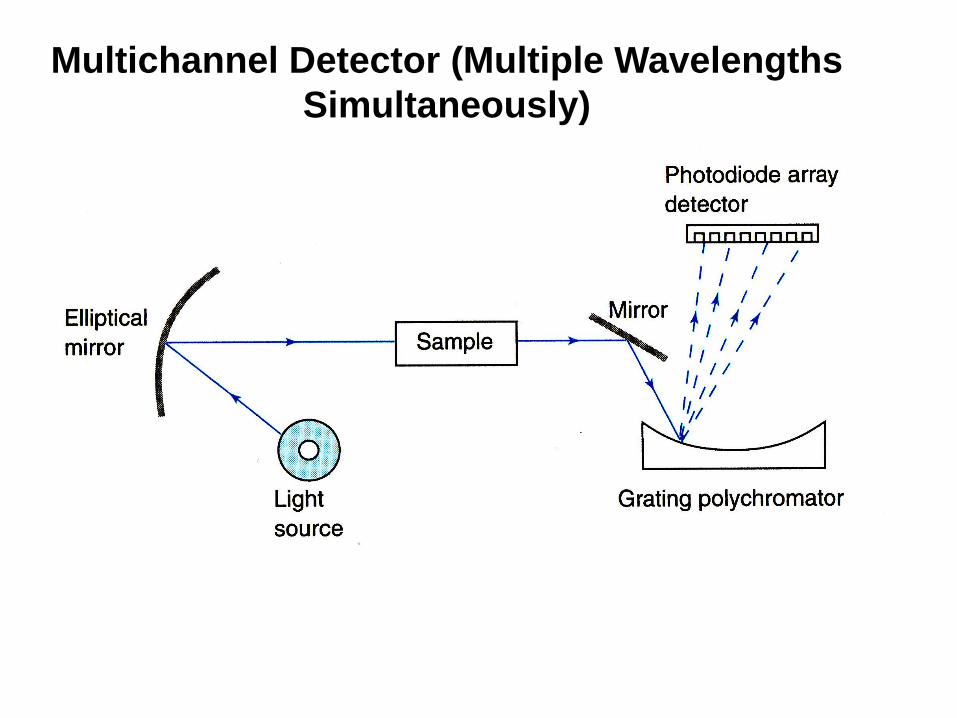
Multichannel Detector (Multiple Wavelengths
Simultaneously)