Embed Size (px)
Citation preview
1
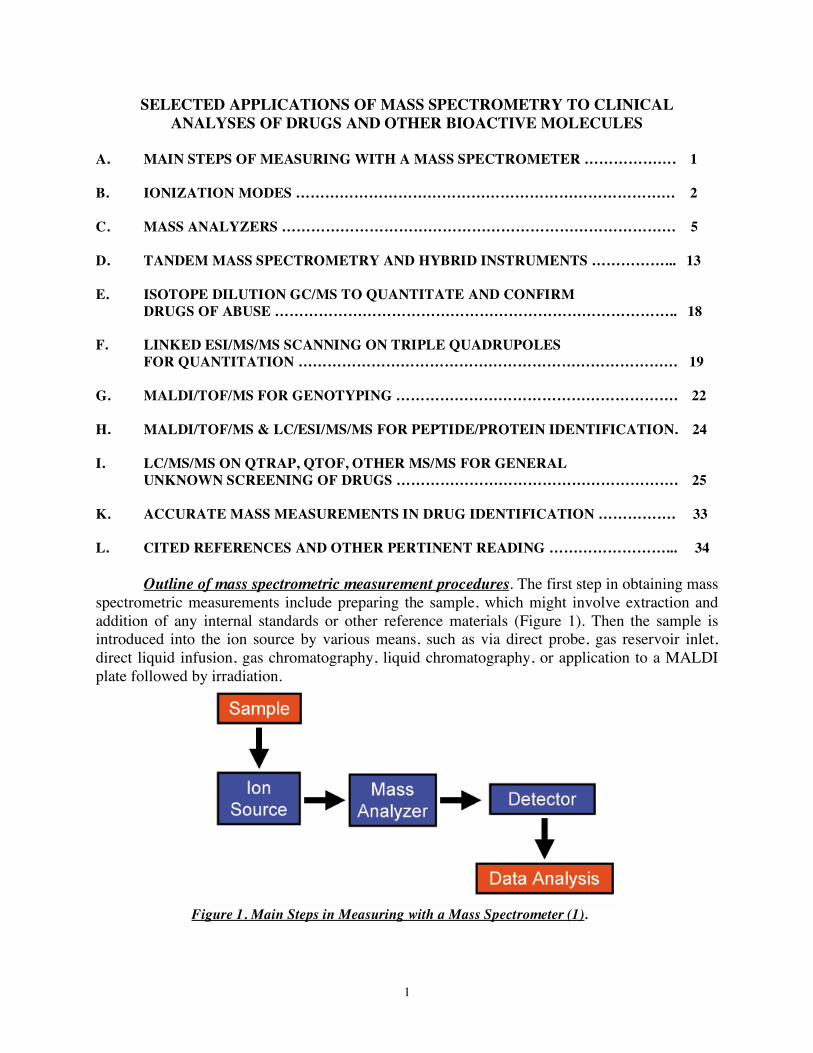
SELECTED APPLICATIONS OF MASS SPECTROMETRY TO CLINICAL ANALYSES OF DRUGS AND OTHER BIOACTIVE MOLECULES
A. MAIN STEPS OF MEASURING WITH A MASS SPECTROMETER ………………. 1 B. IONIZATION MODES …………………………………………………………………… 2 C. MASS ANALYZERS ……………………………………………………………………… 5 D. TANDEM MASS SPECTROMETRY AND HYBRID INSTRUMENTS ……………... 13 E. ISOTOPE DILUTION GC/MS TO QUANTITATE AND CONFIRM
DRUGS OF ABUSE ……………………………………………………………………….. 18 F. LINKED ESI/MS/MS SCANNING ON TRIPLE QUADRUPOLES
FOR QUANTITATION …………………………………………………………………… 19
G. MALDI/TOF/MS FOR GENOTYPING …………………………………………………. 22 H. MALDI/TOF/MS & LC/ESI/MS/MS FOR PEPTIDE/PROTEIN IDENTIFICATION. 24 I. LC/MS/MS ON QTRAP, QTOF, OTHER MS/MS FOR GENERAL
UNKNOWN SCREENING OF DRUGS …………………………………………………. 25
K. ACCURATE MASS MEASUREMENTS IN DRUG IDENTIFICATION ……………. 33 L. CITED REFERENCES AND OTHER PERTINENT READING ……………………... 34
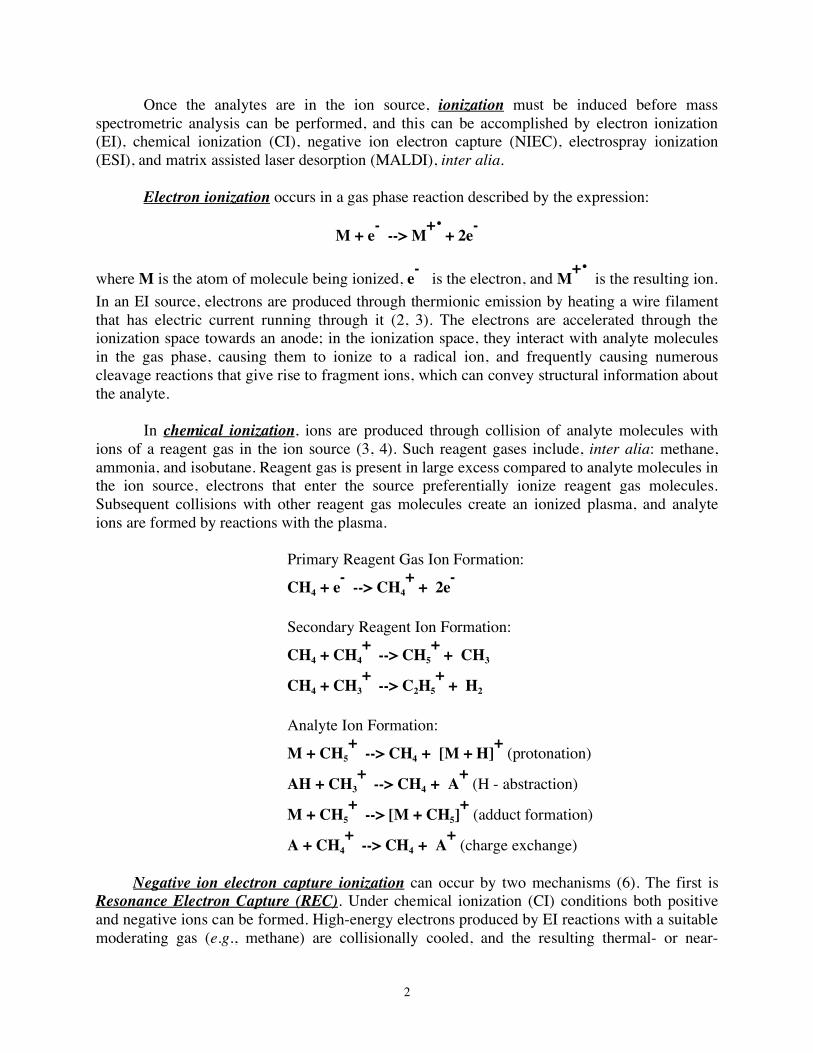
Outline of mass spectrometric measurement procedures. The first step in obtaining mass spectrometric measurements include preparing the sample, which might involve extraction and addition of any internal standards or other reference materials (Figure 1). Then the sample is introduced into the ion source by various means, such as via direct probe, gas reservoir inlet, direct liquid infusion, gas chromatography, liquid chromatography, or application to a MALDI plate followed by irradiation.
Figure 1. Main Steps in Measuring with a Mass Spectrometer (1).
2
Once the analytes are in the ion source, ionization must be induced before mass spectrometric analysis can be performed, and this can be accomplished by electron ionization (EI), chemical ionization (CI), negative ion electron capture (NIEC), electrospray ionization (ESI), and matrix assisted laser desorption (MALDI), inter alia.
Electron ionization occurs in a gas phase reaction described by the expression:
M + e- --> M+. + 2e-
where M is the atom of molecule being ionized, e- is the electron, and M+. is the resulting ion.
In an EI source, electrons are produced through thermionic emission by heating a wire filament that has electric current running through it (2, 3). The electrons are accelerated through the ionization space towards an anode; in the ionization space, they interact with analyte molecules in the gas phase, causing them to ionize to a radical ion, and frequently causing numerous cleavage reactions that give rise to fragment ions, which can convey structural information about the analyte.
In chemical ionization, ions are produced through collision of analyte molecules with ions of a reagent gas in the ion source (3, 4). Such reagent gases include, inter alia: methane, ammonia, and isobutane. Reagent gas is present in large excess compared to analyte molecules in the ion source, electrons that enter the source preferentially ionize reagent gas molecules. Subsequent collisions with other reagent gas molecules create an ionized plasma, and analyte ions are formed by reactions with the plasma.
Primary Reagent Gas Ion Formation:
CH4 + e- --> CH4+ + 2e-
Secondary Reagent Ion Formation:
CH4 + CH4+ --> CH5
+ + CH3
CH4 + CH3+ --> C2H5
+ + H2
Analyte Ion Formation:
M + CH5+ --> CH4 + [M + H]+ (protonation)
AH + CH3+ --> CH4 + A+ (H - abstraction)
M + CH5+ --> [M + CH5]
+ (adduct formation)
A + CH4+ --> CH4 + A+ (charge exchange)
Negative ion electron capture ionization can occur by two mechanisms (6). The first is Resonance Electron Capture (REC). Under chemical ionization (CI) conditions both positive and negative ions can be formed. High-energy electrons produced by EI reactions with a suitable moderating gas (e.g., methane) are collisionally cooled, and the resulting thermal- or near-
3
thermal-energy electrons attach to certain analyte molecules by the process:
The captured electron occupies the lowest vacant molecular orbital of M and thus forms a short-lived radical anion in an excited state. These collisions have resonant character, and M-.
formation follows second-order kinetics with the rate constant k1. The excess internal energy is often large enough to cause auto-detachment by first-order kinetics with a rate constant k2, but in the presence of a moderating gas B (e.g., methane), the excited molecular radical anion may loose its excess internal energy by collision and thereby yield a stabilized thermal-energy molecular radical anion by second order kinetics with rate constant k3. For those compounds for which the reverse reaction is minor, resonance electron capture is a highly efficient ionization process, and this accounts for the high sensitivity of NIEC-MS in many analytical applications. Dissociative Electron Capture. In addition to stable molecular radical anions, fragment ions can form by dissociative electron capture:
This generally yields negative ions with a distribution of internal energies governed primarily by the ability of the leaving group AB to absorb excess internal energy, which increases with the size of AB (6).
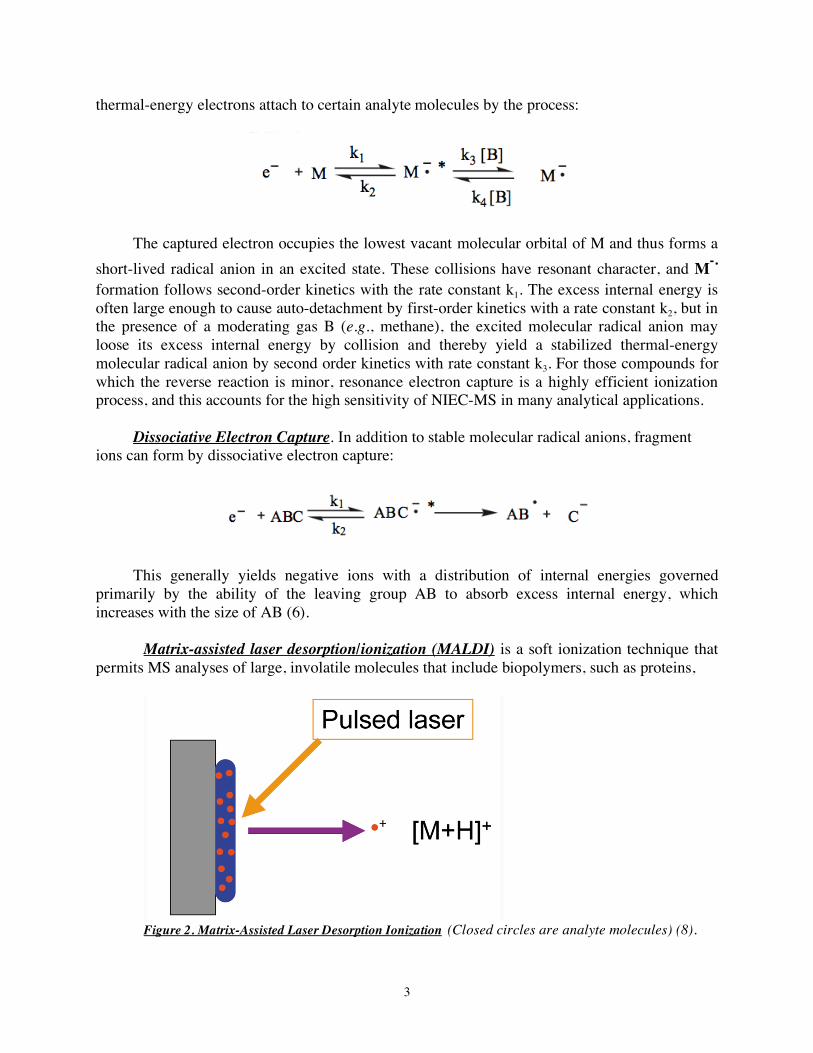
Matrix-assisted laser desorption/ionization (MALDI) is a soft ionization technique that permits MS analyses of large, involatile molecules that include biopolymers, such as proteins,
Figure 2. Matrix-Assisted Laser Desorption Ionization (Closed circles are analyte molecules) (8).
4
peptides, carbohydrates, and oligonucleonucleotides (7-10). Ionization is induced by UV laser (usually a nitrogen laser) irradiation of a mixture of analyte and matrix molecules on a solid surface. Matrix molecules absorb UV light and are ionized (Figure 2). Analyte molecules [M] are then ionized by interaction with matrix ions to produce even electron-ions such as [M+H]+, [M+Na]+, or [M-H]-. MALDI generally produces singly-charged ions, but multiply charged ions ([M+nH]n+) can be observed, depending on the matrix, laser intensity, and other factors.
The matrix is thought to protect the target analyte molecules from photodestruction and to facilitate ionization and vaporization/desorption. Among commonly used matrices are 3,5-dimethoxy-4-hydroxycinnamic acid (sinapinic acid), α-cyano-4-hydroxycinnamic acid (alpha-cyano or alpha-matrix) and 2,5-dihydroxybenzoic acid (DHB). In general, matrix molecules have a fairly low molecular weight to facilitate vaporization but are large enough and have a sufficiently low vapor pressure not to evaporate during sample preparation or after application. Matrix molecules are also generally acidic and serve as a proton source in producing [M + H]+ ions; contain UV chromophores that permit absorption of energy from the laser; and have polar substituents to facilitate dissolution in solvent mixtures of water and a miscible organic solvent such as ethanol or acetonitrile. When matrix solution is mixed with analyte, the organic solvent and water facilitate dissolution of hydrophobic and hydrophilic molecules, respectively. After the solution is spotted onto a MALDI plate, the solvents evaporate to leave matrix crystals with embedded analyte molecules (7, 8). In some cases, liquid ionic matrices have been used for MALDI analyses of certain classes of analyte molecules, such as phospholipids (11).
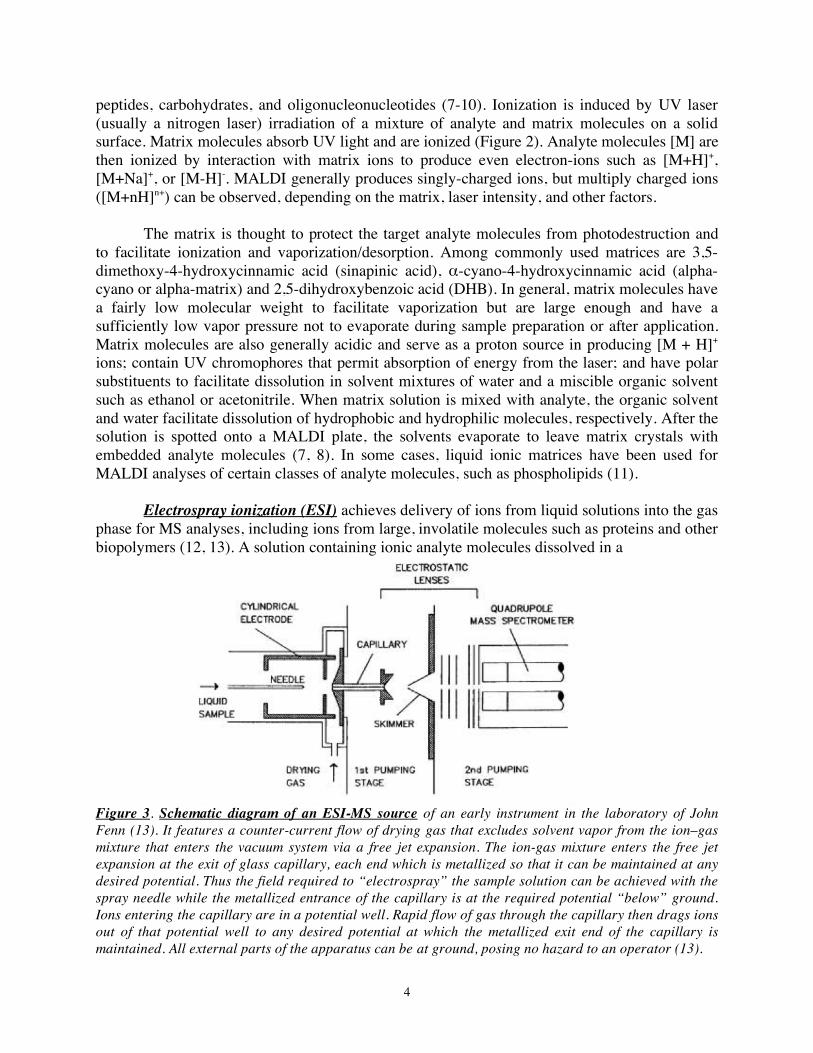
Electrospray ionization (ESI) achieves delivery of ions from liquid solutions into the gas phase for MS analyses, including ions from large, involatile molecules such as proteins and other biopolymers (12, 13). A solution containing ionic analyte molecules dissolved in a
Figure 3. Schematic diagram of an ESI-MS source of an early instrument in the laboratory of John Fenn (13). It features a counter-current flow of drying gas that excludes solvent vapor from the ion–gas mixture that enters the vacuum system via a free jet expansion. The ion-gas mixture enters the free jet expansion at the exit of glass capillary, each end which is metallized so that it can be maintained at any desired potential. Thus the field required to “electrospray” the sample solution can be achieved with the spray needle while the metallized entrance of the capillary is at the required potential “below” ground. Ions entering the capillary are in a potential well. Rapid flow of gas through the capillary then drags ions out of that potential well to any desired potential at which the metallized exit end of the capillary is maintained. All external parts of the apparatus can be at ground, posing no hazard to an operator (13).
5
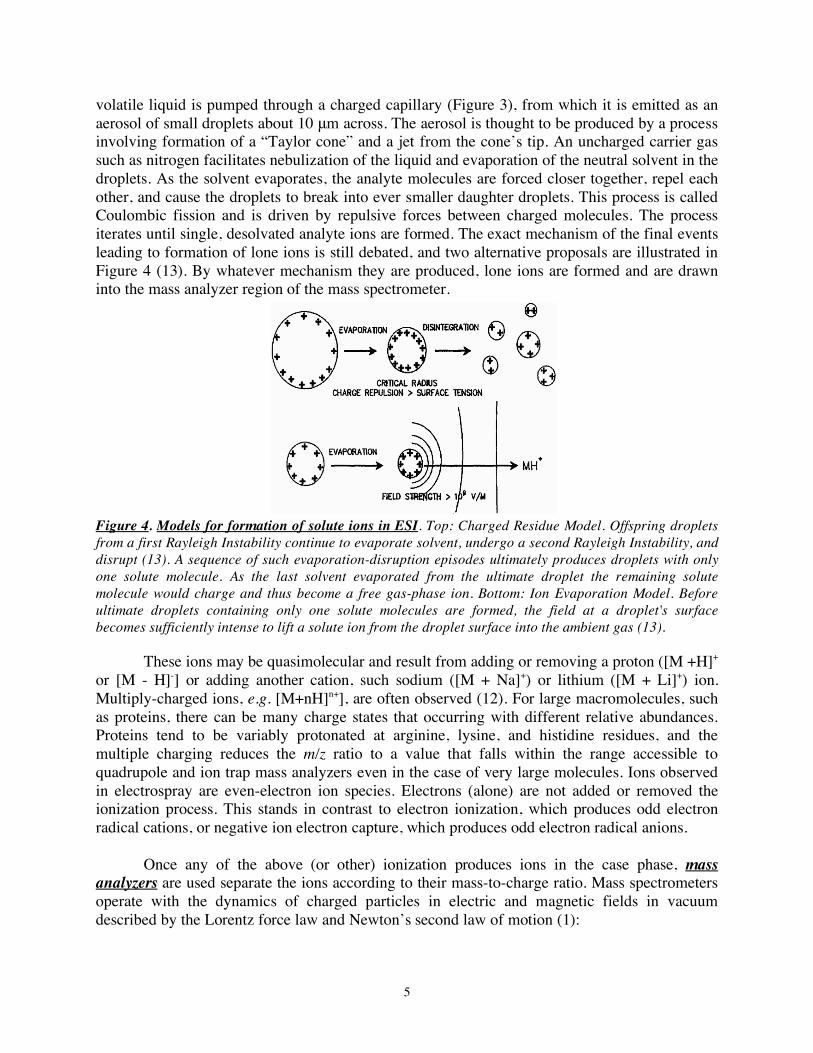
volatile liquid is pumped through a charged capillary (Figure 3), from which it is emitted as an aerosol of small droplets about 10 μm across. The aerosol is thought to be produced by a process involving formation of a “Taylor cone” and a jet from the cone’s tip. An uncharged carrier gas such as nitrogen facilitates nebulization of the liquid and evaporation of the neutral solvent in the droplets. As the solvent evaporates, the analyte molecules are forced closer together, repel each other, and cause the droplets to break into ever smaller daughter droplets. This process is called Coulombic fission and is driven by repulsive forces between charged molecules. The process iterates until single, desolvated analyte ions are formed. The exact mechanism of the final events leading to formation of lone ions is still debated, and two alternative proposals are illustrated in Figure 4 (13). By whatever mechanism they are produced, lone ions are formed and are drawn into the mass analyzer region of the mass spectrometer.
Figure 4. Models for formation of solute ions in ESI. Top: Charged Residue Model. Offspring droplets from a first Rayleigh Instability continue to evaporate solvent, undergo a second Rayleigh Instability, and disrupt (13). A sequence of such evaporation-disruption episodes ultimately produces droplets with only one solute molecule. As the last solvent evaporated from the ultimate droplet the remaining solute molecule would charge and thus become a free gas-phase ion. Bottom: Ion Evaporation Model. Before ultimate droplets containing only one solute molecules are formed, the field at a droplet's surface becomes sufficiently intense to lift a solute ion from the droplet surface into the ambient gas (13).
These ions may be quasimolecular and result from adding or removing a proton ([M +H]+
or [M - H]-] or adding another cation, such sodium ([M + Na]+) or lithium ([M + Li]+) ion. Multiply-charged ions, e.g. [M+nH]n+], are often observed (12). For large macromolecules, such as proteins, there can be many charge states that occurring with different relative abundances. Proteins tend to be variably protonated at arginine, lysine, and histidine residues, and the multiple charging reduces the m/z ratio to a value that falls within the range accessible to quadrupole and ion trap mass analyzers even in the case of very large molecules. Ions observed in electrospray are even-electron ion species. Electrons (alone) are not added or removed the ionization process. This stands in contrast to electron ionization, which produces odd electron radical cations, or negative ion electron capture, which produces odd electron radical anions.
Once any of the above (or other) ionization produces ions in the case phase, mass
analyzers are used separate the ions according to their mass-to-charge ratio. Mass spectrometers operate with the dynamics of charged particles in electric and magnetic fields in vacuum described by the Lorentz force law and Newton’s second law of motion (1):
6
F = z(E + v x B) (Lorentz force equation)
F = ma (Newton’s second law of motion) where F is the force applied to the ion, m is the mass of the ion, a is the acceleration, q is the ionic charge, E is the electric field, and v x B is the vector cross product of the ion velocity and the magnetic field. Combining those equations results in the equation that describes the motion of charged particles:
(m/z)a = E + v x B Two particles with the same physical quantity m/z behave identically, and all mass spectrometers measure m/z rather than m. Types of mass analyzers include, inter alia, magnetic or electric sectors, time-of-flight instruments, quadrupoles, ion traps, and instruments that perform Fourier Transformations of image currents of ion trajectories, but they all operate according to this same law. Some mass spectrometers use two or more mass analyzers for tandem mass spectrometry.
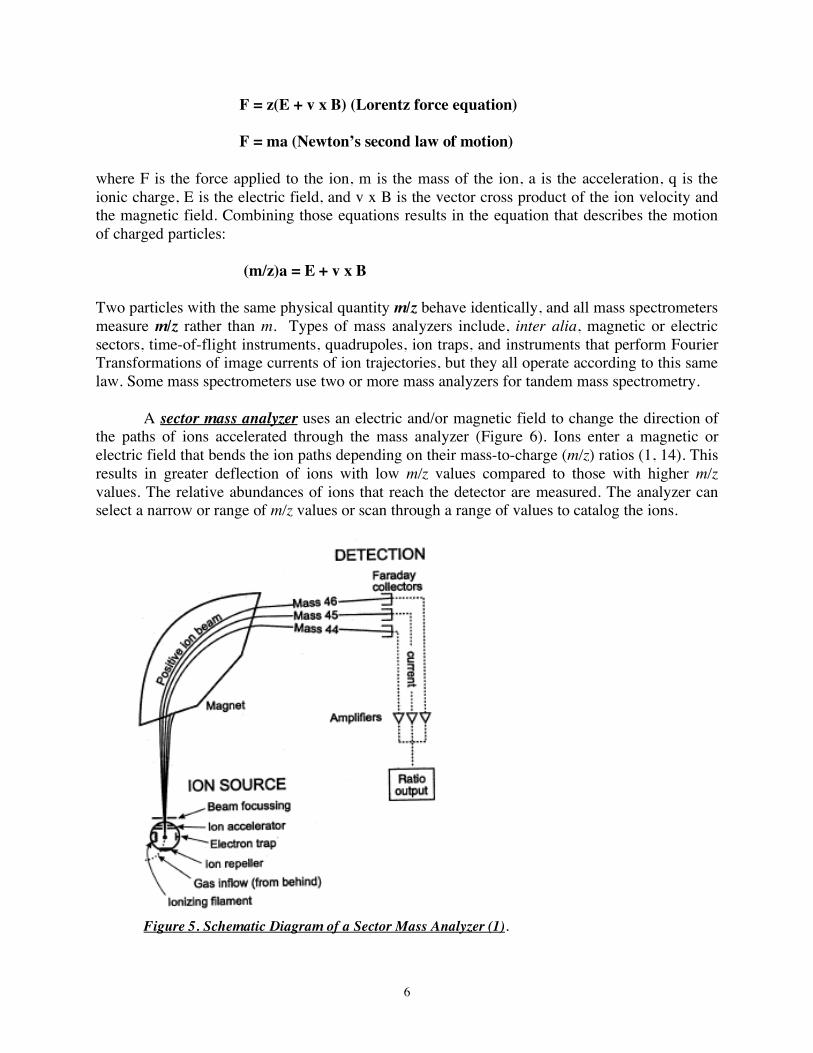
A sector mass analyzer uses an electric and/or magnetic field to change the direction of the paths of ions accelerated through the mass analyzer (Figure 6). Ions enter a magnetic or electric field that bends the ion paths depending on their mass-to-charge (m/z) ratios (1, 14). This results in greater deflection of ions with low m/z values compared to those with higher m/z values. The relative abundances of ions that reach the detector are measured. The analyzer can select a narrow or range of m/z values or scan through a range of values to catalog the ions.
Figure 5. Schematic Diagram of a Sector Mass Analyzer (1).
7
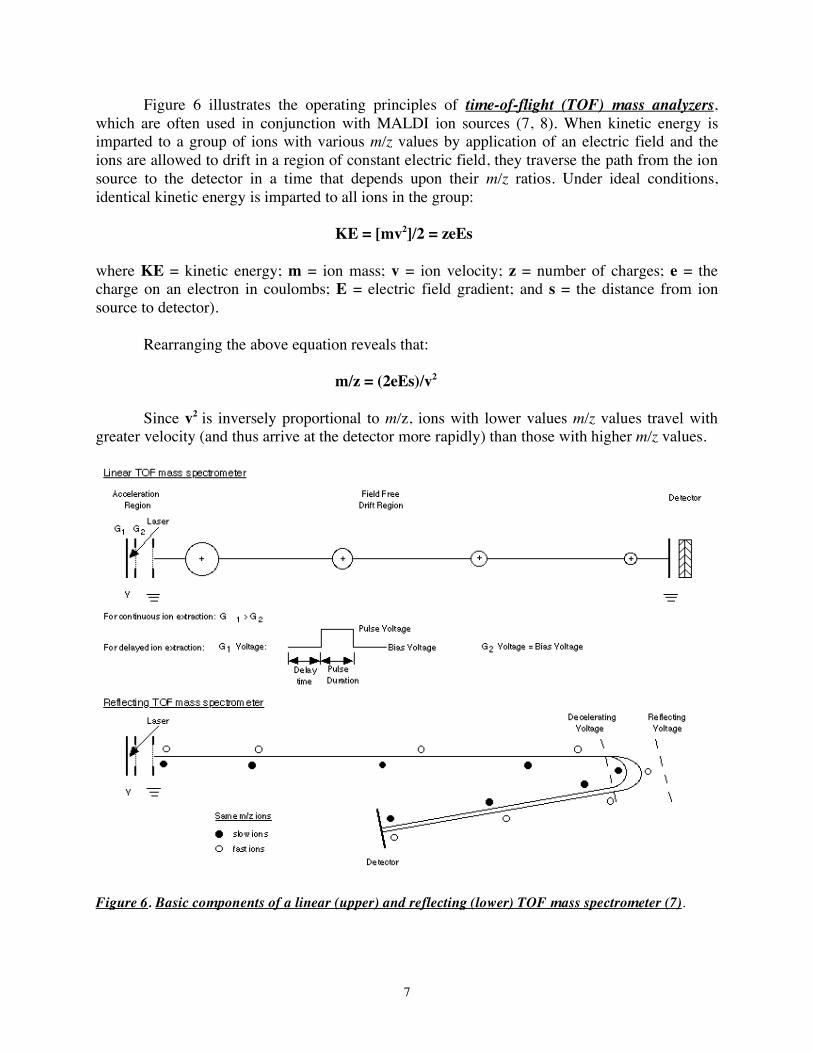
Figure 6 illustrates the operating principles of time-of-flight (TOF) mass analyzers, which are often used in conjunction with MALDI ion sources (7, 8). When kinetic energy is imparted to a group of ions with various m/z values by application of an electric field and the ions are allowed to drift in a region of constant electric field, they traverse the path from the ion source to the detector in a time that depends upon their m/z ratios. Under ideal conditions, identical kinetic energy is imparted to all ions in the group:
KE = [mv2]/2 = zeEs
where KE = kinetic energy; m = ion mass; v = ion velocity; z = number of charges; e = the charge on an electron in coulombs; E = electric field gradient; and s = the distance from ion source to detector). Rearranging the above equation reveals that:
m/z = (2eEs)/v2
Since v2 is inversely proportional to m/z, ions with lower values m/z values travel with greater velocity (and thus arrive at the detector more rapidly) than those with higher m/z values.
Figure 6. Basic components of a linear (upper) and reflecting (lower) TOF mass spectrometer (7).
8
Early TOF mass analyzers had relatively poor resolution (R), which is the ability to distinguish m1/z from m2/z. (If the difference between those values is Δm and their mean is M, then R is defined as M/Δm.) The low R reflected deviation from the ideal condition that identical KE is imparted to all ions in the group. Various factors create some spread among KE values, even among ions with identical m/z values. Two developments have greatly increased the resolving power of modern TOF mass analyzers: delayed extraction and the reflectron (7).
Among the factors that might contribute to KE spread are collisions with neutrals or other
ions in the plume created above the spot of impact of the laser beam that causes ion formation. This could cause differences in initial velocities among individual ions of identical m/z value. A fraction of the final velocity achieved by ions of a given m/z value as they are accelerated out of the ion source into the field free region includes this initial velocity component. Delayed extraction involves interposing a brief interval between ion creation by the laser flash and ion acceleration by application of the electric field. This allows the dense plume of MALDI-generated ions/neutrals to dissipate before ions are accelerated out of the ion source, and it reduces the broadening of ion velocity distribution from collisional processes in the ion source. This results in narrower ion arrival time distributions and better mass resolution. The reflectron provides an additional means to compensate for the broadening of the range of flight times among ions of identical m/z by focusing the ion packets in space and time at the detector.
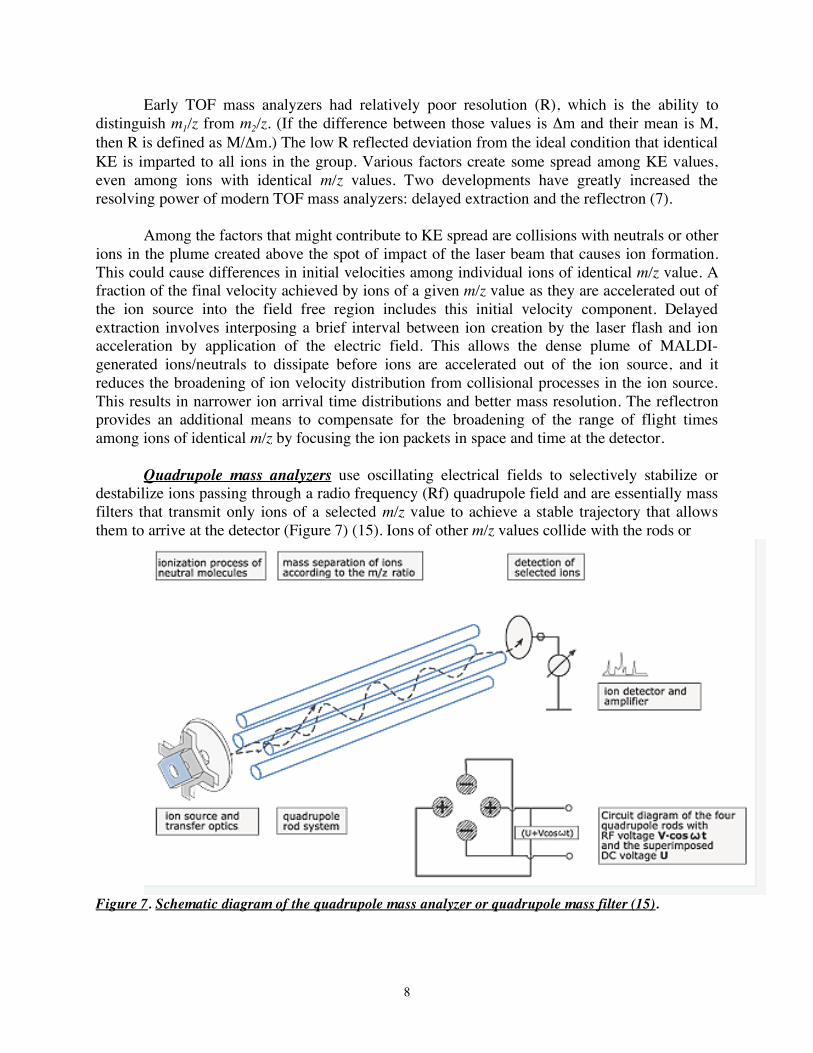
Quadrupole mass analyzers use oscillating electrical fields to selectively stabilize or
destabilize ions passing through a radio frequency (Rf) quadrupole field and are essentially mass filters that transmit only ions of a selected m/z value to achieve a stable trajectory that allows them to arrive at the detector (Figure 7) (15). Ions of other m/z values collide with the rods or
Figure 7. Schematic diagram of the quadrupole mass analyzer or quadrupole mass filter (15).
9
walls of the apparatus and are destroyed. The quadrupole consists of four parallel metal rods. Each opposing rod pair is connected together electrically and a radio frequency (Rf) alternating current voltage is applied between one pair of rods and the other. A direct current voltage is then superimposed on the Rf voltage, and this causes the ions to adopt an irregular, oscillatory trajectory as they traverse the region bounded by the rods. For a given ratio of voltages, only ions of a specific m/z value reach the detector, and other ions have unstable trajectories and are collisionally annihilated. This allows selected monitoring of ions of a particular m/z value, or a mass spectrum can obtained by scanning through the m/z range of interest over time.
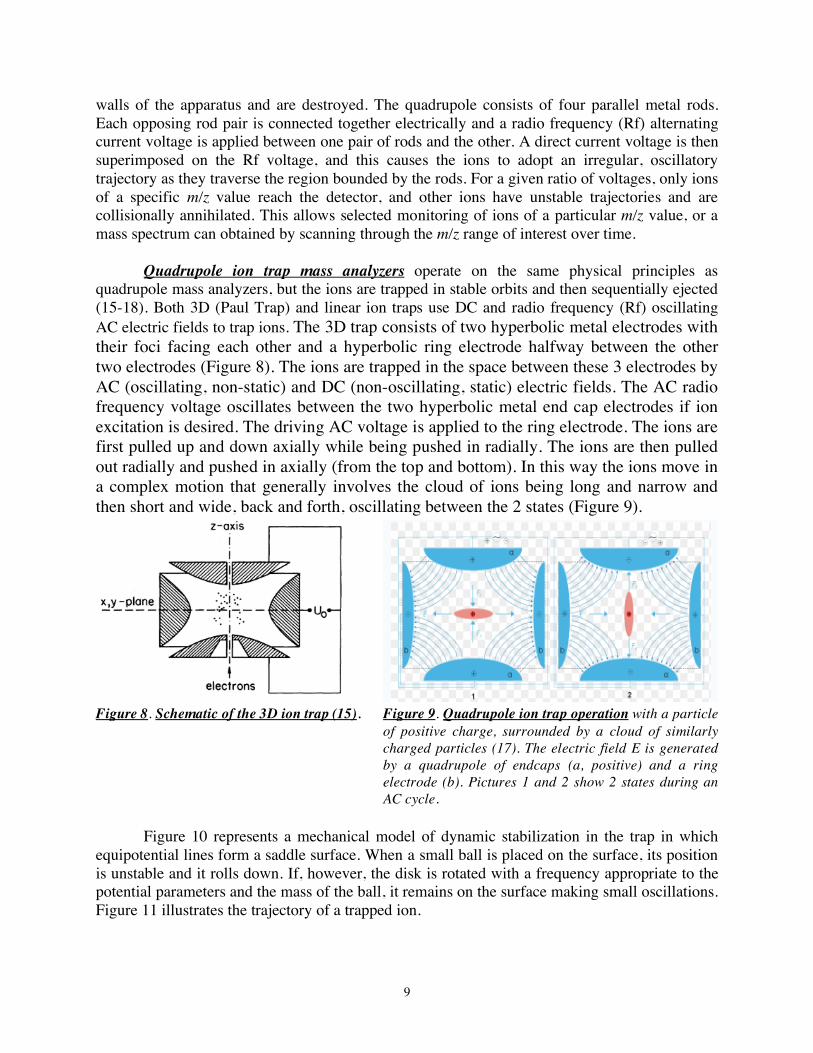
Quadrupole ion trap mass analyzers operate on the same physical principles as quadrupole mass analyzers, but the ions are trapped in stable orbits and then sequentially ejected (15-18). Both 3D (Paul Trap) and linear ion traps use DC and radio frequency (Rf) oscillating AC electric fields to trap ions. The 3D trap consists of two hyperbolic metal electrodes with their foci facing each other and a hyperbolic ring electrode halfway between the other two electrodes (Figure 8). The ions are trapped in the space between these 3 electrodes by AC (oscillating, non-static) and DC (non-oscillating, static) electric fields. The AC radio frequency voltage oscillates between the two hyperbolic metal end cap electrodes if ion excitation is desired. The driving AC voltage is applied to the ring electrode. The ions are first pulled up and down axially while being pushed in radially. The ions are then pulled out radially and pushed in axially (from the top and bottom). In this way the ions move in a complex motion that generally involves the cloud of ions being long and narrow and then short and wide, back and forth, oscillating between the 2 states (Figure 9).
Figure 8. Schematic of the 3D ion trap (15). Figure 9. Quadrupole ion trap operation with a particle
of positive charge, surrounded by a cloud of similarly charged particles (17). The electric field E is generated by a quadrupole of endcaps (a, positive) and a ring electrode (b). Pictures 1 and 2 show 2 states during an AC cycle.
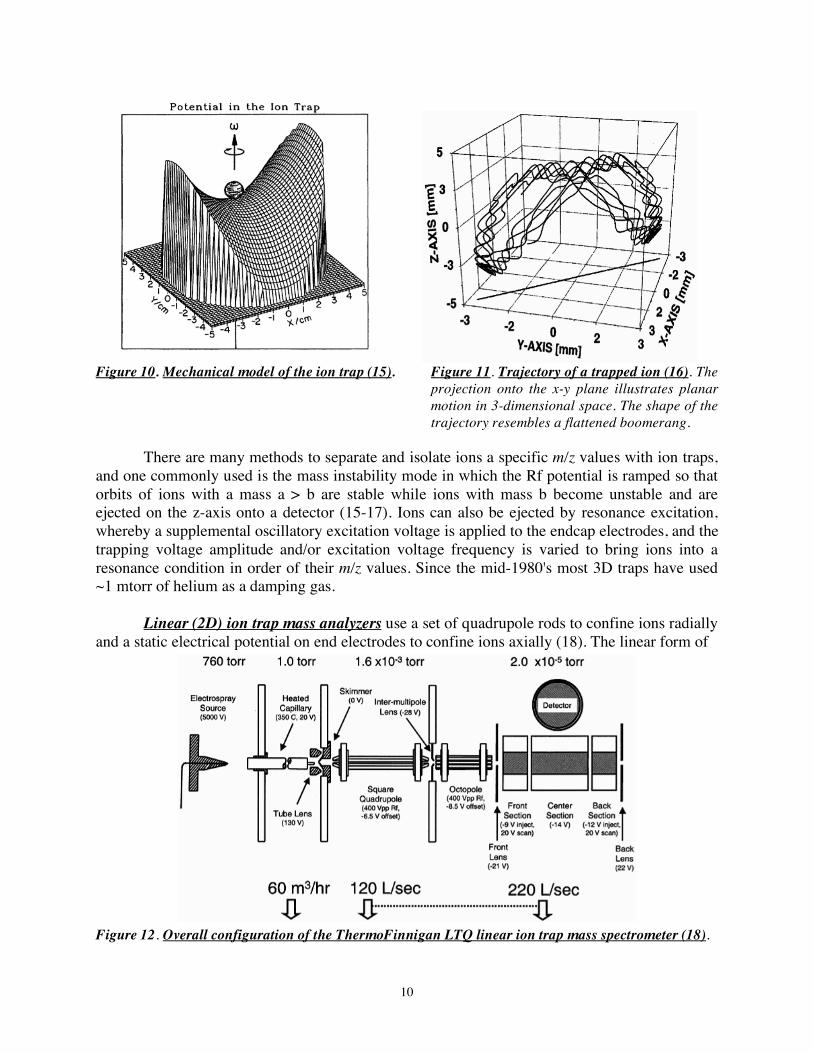
Figure 10 represents a mechanical model of dynamic stabilization in the trap in which
equipotential lines form a saddle surface. When a small ball is placed on the surface, its position is unstable and it rolls down. If, however, the disk is rotated with a frequency appropriate to the potential parameters and the mass of the ball, it remains on the surface making small oscillations. Figure 11 illustrates the trajectory of a trapped ion.
10
Figure 10. Mechanical model of the ion trap (15). Figure 11. Trajectory of a trapped ion (16). The
projection onto the x-y plane illustrates planar motion in 3-dimensional space. The shape of the trajectory resembles a flattened boomerang.
There are many methods to separate and isolate ions a specific m/z values with ion traps,
and one commonly used is the mass instability mode in which the Rf potential is ramped so that orbits of ions with a mass a > b are stable while ions with mass b become unstable and are ejected on the z-axis onto a detector (15-17). Ions can also be ejected by resonance excitation, whereby a supplemental oscillatory excitation voltage is applied to the endcap electrodes, and the trapping voltage amplitude and/or excitation voltage frequency is varied to bring ions into a resonance condition in order of their m/z values. Since the mid-1980's most 3D traps have used ~1 mtorr of helium as a damping gas.
Linear (2D) ion trap mass analyzers use a set of quadrupole rods to confine ions radially and a static electrical potential on end electrodes to confine ions axially (18). The linear form of
Figure 12. Overall configuration of the ThermoFinnigan LTQ linear ion trap mass spectrometer (18).
11
the trap can be used as a selective mass filter, as described above, or as a trap by creating a potential well for ions along the axis of the electrodes. Advantages of the linear trap design are increased ion storage capacity, faster scan times, and simplicity of construction. Thermo Fisher's LTQ (Linear Trap Quadrupole) is an example of a linear ion trap, and the overall configuration of that instrument is illustrated in Figure 12 (18). Figure 13 illustrates the voltages necessary to operate the 2-D ion trap, which include three DC voltages applied to the separate sections of each rod to produce an axial trapping field, two phases of the primary RF voltage applied to the rod pairs to produce the radial trapping field, and two phases of supplemental AC voltage applied across the X rods for isolation, activation, and ejection of ions.
Figure 13. Scheme to apply DC, RF trapping, & AC excitation voltages to operate a 2-D ion trap (18).
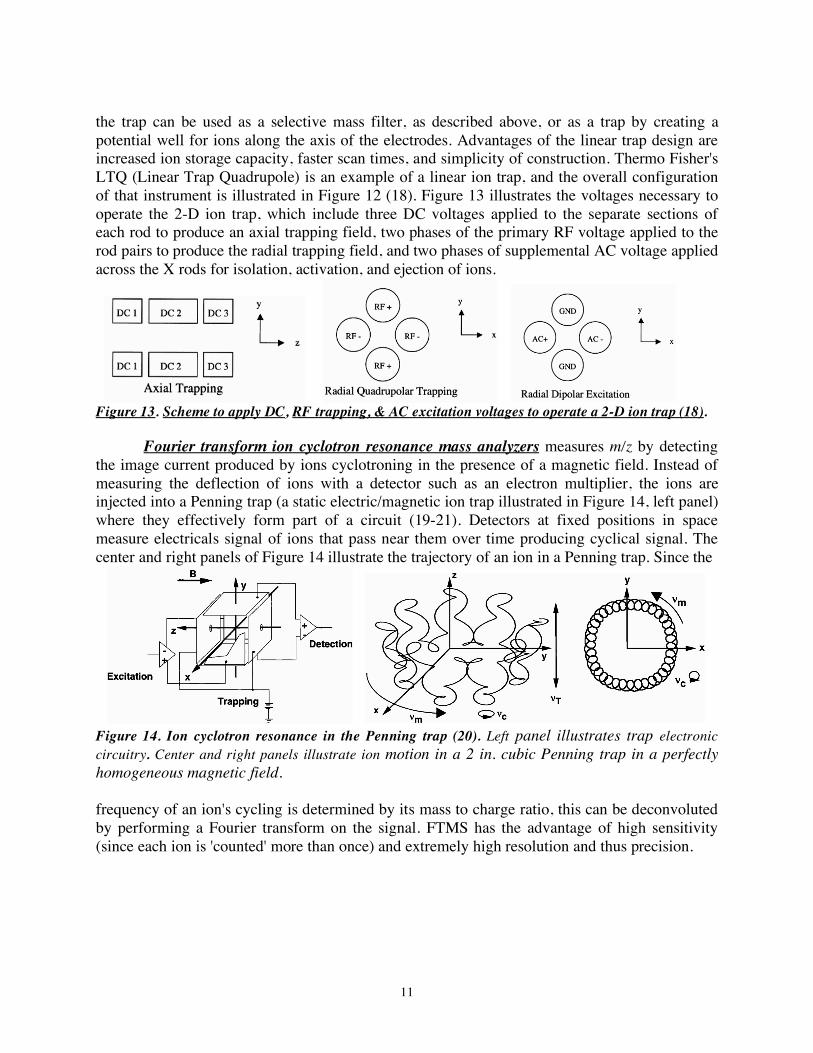
Fourier transform ion cyclotron resonance mass analyzers measures m/z by detecting the image current produced by ions cyclotroning in the presence of a magnetic field. Instead of measuring the deflection of ions with a detector such as an electron multiplier, the ions are injected into a Penning trap (a static electric/magnetic ion trap illustrated in Figure 14, left panel) where they effectively form part of a circuit (19-21). Detectors at fixed positions in space measure electricals signal of ions that pass near them over time producing cyclical signal. The center and right panels of Figure 14 illustrate the trajectory of an ion in a Penning trap. Since the
Figure 14. Ion cyclotron resonance in the Penning trap (20). Left panel illustrates trap electronic circuitry. Center and right panels illustrate ion motion in a 2 in. cubic Penning trap in a perfectly homogeneous magnetic field. frequency of an ion's cycling is determined by its mass to charge ratio, this can be deconvoluted by performing a Fourier transform on the signal. FTMS has the advantage of high sensitivity (since each ion is 'counted' more than once) and extremely high resolution and thus precision.
12
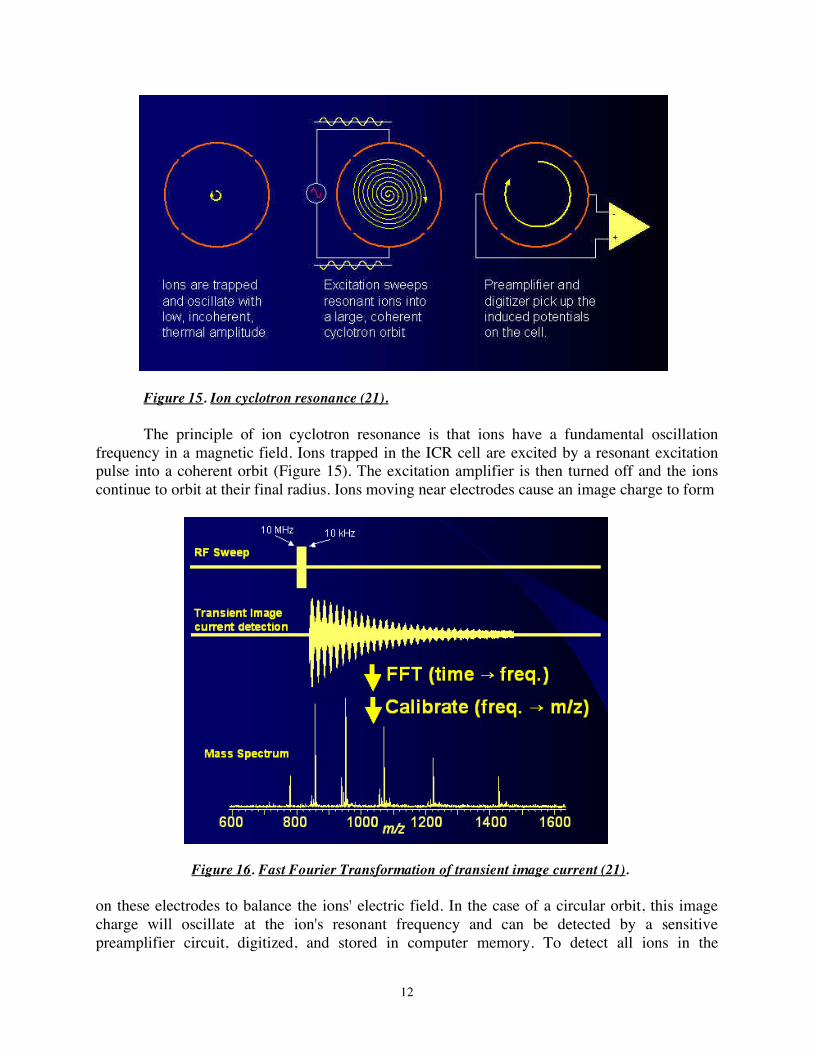
Figure 15. Ion cyclotron resonance (21). The principle of ion cyclotron resonance is that ions have a fundamental oscillation
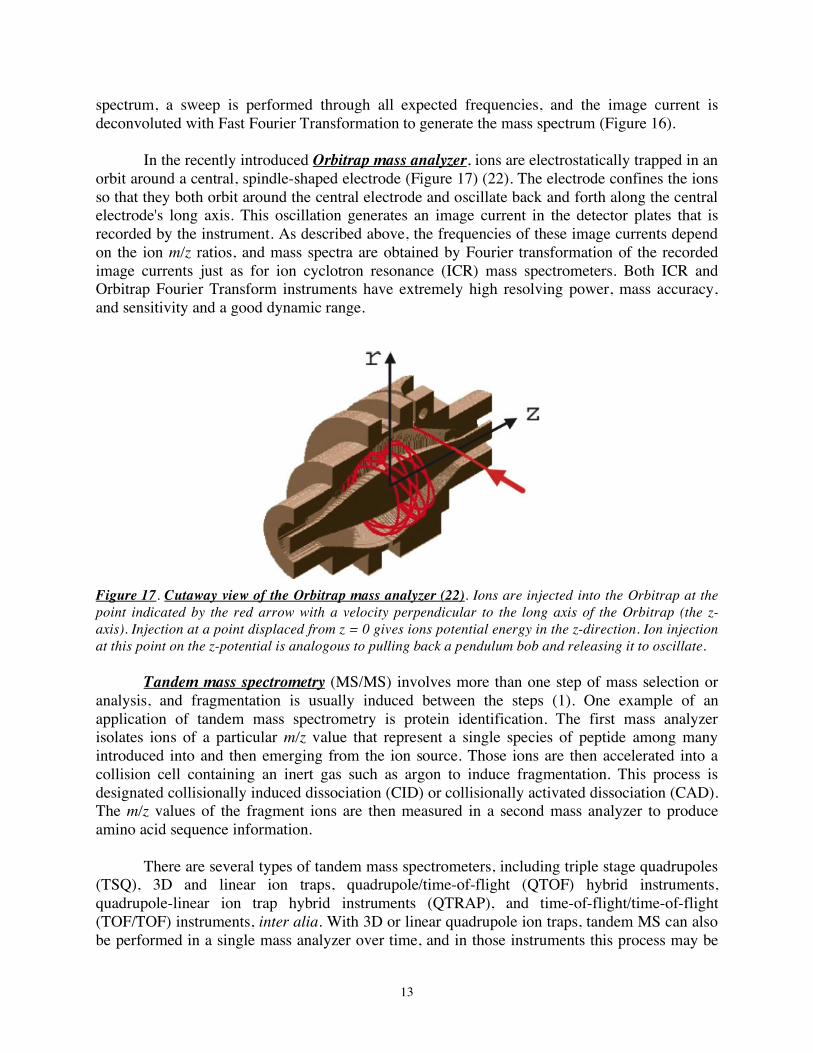
frequency in a magnetic field. Ions trapped in the ICR cell are excited by a resonant excitation pulse into a coherent orbit (Figure 15). The excitation amplifier is then turned off and the ions continue to orbit at their final radius. Ions moving near electrodes cause an image charge to form
Figure 16. Fast Fourier Transformation of transient image current (21). on these electrodes to balance the ions' electric field. In the case of a circular orbit, this image charge will oscillate at the ion's resonant frequency and can be detected by a sensitive preamplifier circuit, digitized, and stored in computer memory. To detect all ions in the
13
spectrum, a sweep is performed through all expected frequencies, and the image current is deconvoluted with Fast Fourier Transformation to generate the mass spectrum (Figure 16).
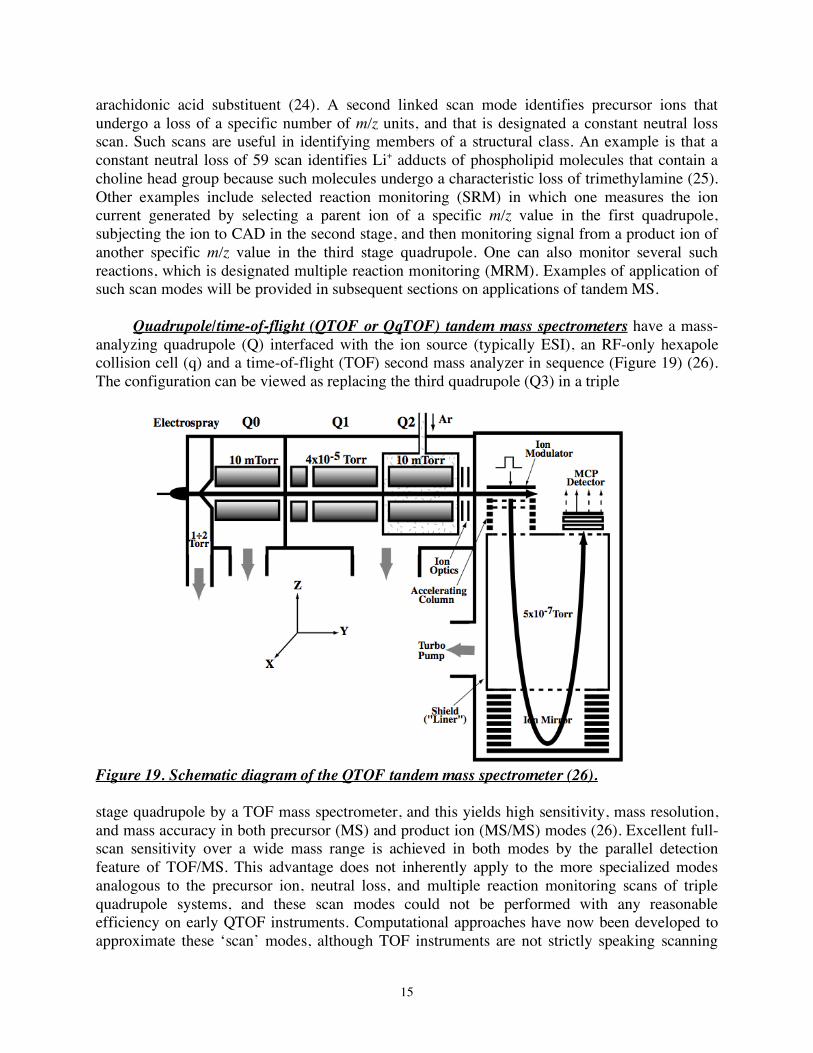
In the recently introduced Orbitrap mass analyzer, ions are electrostatically trapped in an orbit around a central, spindle-shaped electrode (Figure 17) (22). The electrode confines the ions so that they both orbit around the central electrode and oscillate back and forth along the central electrode's long axis. This oscillation generates an image current in the detector plates that is recorded by the instrument. As described above, the frequencies of these image currents depend on the ion m/z ratios, and mass spectra are obtained by Fourier transformation of the recorded image currents just as for ion cyclotron resonance (ICR) mass spectrometers. Both ICR and Orbitrap Fourier Transform instruments have extremely high resolving power, mass accuracy, and sensitivity and a good dynamic range.
Figure 17. Cutaway view of the Orbitrap mass analyzer (22). Ions are injected into the Orbitrap at the point indicated by the red arrow with a velocity perpendicular to the long axis of the Orbitrap (the z-axis). Injection at a point displaced from z = 0 gives ions potential energy in the z-direction. Ion injection at this point on the z-potential is analogous to pulling back a pendulum bob and releasing it to oscillate.
Tandem mass spectrometry (MS/MS) involves more than one step of mass selection or analysis, and fragmentation is usually induced between the steps (1). One example of an application of tandem mass spectrometry is protein identification. The first mass analyzer isolates ions of a particular m/z value that represent a single species of peptide among many introduced into and then emerging from the ion source. Those ions are then accelerated into a collision cell containing an inert gas such as argon to induce fragmentation. This process is designated collisionally induced dissociation (CID) or collisionally activated dissociation (CAD). The m/z values of the fragment ions are then measured in a second mass analyzer to produce amino acid sequence information.
There are several types of tandem mass spectrometers, including triple stage quadrupoles
(TSQ), 3D and linear ion traps, quadrupole/time-of-flight (QTOF) hybrid instruments, quadrupole-linear ion trap hybrid instruments (QTRAP), and time-of-flight/time-of-flight (TOF/TOF) instruments, inter alia. With 3D or linear quadrupole ion traps, tandem MS can also be performed in a single mass analyzer over time, and in those instruments this process may be

14
iterated more than once to yield MSn spectra. Those instruments achieve fragmentation by resonance excitation, which induces collisions with the trap bath gas (helium) of sufficiently high energy to induce fragmentation. The other instruments mentioned above employ CID in a collision cell. Other methods that can be used to fragment molecules for tandem MS include electron capture dissociation (ECD), electron transfer dissociation (ETD), infrared multiphoton dissociation (IRMPD) and blackbody infrared radiative dissociation (BIRD) (1).
Triple stage quadrupole (TSQ) tandem mass spectrometers have two mass analyzing quadrupoles separated by a quadrupole operated in the RF-only mode that serves as a containment device and collision cell, as illustrated in Figure 18. In the first stage quadrupole ions formed in the ion source and focused into the quadrupole are mass-analyzed, and ions of a single m/z value are transmitted to the second stage quadrupole, which contains an inert gas such as argon. The potential that accelerates the ions into the second stage can be varied to produce collisions at various energy levels, and these collisions induce dissociation of the precursor (or parent) ion into a set of product (or daughter) fragment ions. Those ions are then mass-analyzed in the third stage quadrupole to yield a product ion spectrum.
Figure 18. Schematic Diagram of a Triple Stage Quadrupole Tandem Mass Spectrometer (23).
Other kinds of experiments can be performed on triple quadrupoles by coordinating the
activities of the two mass analyzing quadrupoles, a process sometimes designated “linked scanning”. One such experiment is to identify precursor ions that yield a product ion of a specific m/z value, and this is designated precursor ion scanning or parent ion scanning. This can be used to identify parents that contain a specific substituent. An example is negative ion scanning for parents of m/z 303 when analyzing phospholipids will identify species that contain an
15
arachidonic acid substituent (24). A second linked scan mode identifies precursor ions that undergo a loss of a specific number of m/z units, and that is designated a constant neutral loss scan. Such scans are useful in identifying members of a structural class. An example is that a constant neutral loss of 59 scan identifies Li+ adducts of phospholipid molecules that contain a choline head group because such molecules undergo a characteristic loss of trimethylamine (25). Other examples include selected reaction monitoring (SRM) in which one measures the ion current generated by selecting a parent ion of a specific m/z value in the first quadrupole, subjecting the ion to CAD in the second stage, and then monitoring signal from a product ion of another specific m/z value in the third stage quadrupole. One can also monitor several such reactions, which is designated multiple reaction monitoring (MRM). Examples of application of such scan modes will be provided in subsequent sections on applications of tandem MS.
Quadrupole/time-of-flight (QTOF or QqTOF) tandem mass spectrometers have a mass-analyzing quadrupole (Q) interfaced with the ion source (typically ESI), an RF-only hexapole collision cell (q) and a time-of-flight (TOF) second mass analyzer in sequence (Figure 19) (26). The configuration can be viewed as replacing the third quadrupole (Q3) in a triple
Figure 19. Schematic diagram of the QTOF tandem mass spectrometer (26). stage quadrupole by a TOF mass spectrometer, and this yields high sensitivity, mass resolution, and mass accuracy in both precursor (MS) and product ion (MS/MS) modes (26). Excellent full-scan sensitivity over a wide mass range is achieved in both modes by the parallel detection feature of TOF/MS. This advantage does not inherently apply to the more specialized modes analogous to the precursor ion, neutral loss, and multiple reaction monitoring scans of triple quadrupole systems, and these scan modes could not be performed with any reasonable efficiency on early QTOF instruments. Computational approaches have now been developed to approximate these ‘scan’ modes, although TOF instruments are not strictly speaking scanning
16
devices. For MS/MS, Q1 is operated in the mass filter mode to transmit only the parent ion of interest, which is then accelerated into collision cell Q2, where it undergoes collision-induced dissociation. Resultant fragment ions and residual parent ions are then mass-analyzed by TOF. An ion mirror compensates for the initial energy and spatial spread of the ions. The detector is made of two microchannel plates. The electrostatic mirror and the ion detector are similar to those used with MALDI ionization sources.
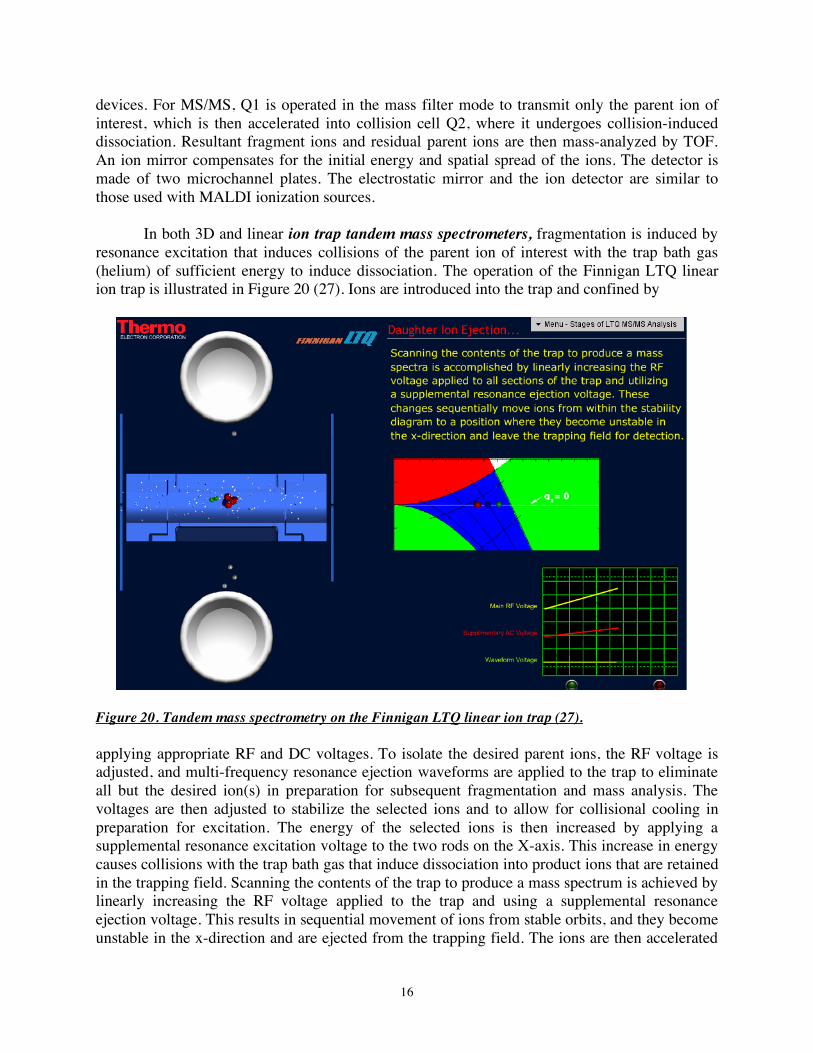
In both 3D and linear ion trap tandem mass spectrometers, fragmentation is induced by resonance excitation that induces collisions of the parent ion of interest with the trap bath gas (helium) of sufficient energy to induce dissociation. The operation of the Finnigan LTQ linear ion trap is illustrated in Figure 20 (27). Ions are introduced into the trap and confined by
Figure 20. Tandem mass spectrometry on the Finnigan LTQ linear ion trap (27). applying appropriate RF and DC voltages. To isolate the desired parent ions, the RF voltage is adjusted, and multi-frequency resonance ejection waveforms are applied to the trap to eliminate all but the desired ion(s) in preparation for subsequent fragmentation and mass analysis. The voltages are then adjusted to stabilize the selected ions and to allow for collisional cooling in preparation for excitation. The energy of the selected ions is then increased by applying a supplemental resonance excitation voltage to the two rods on the X-axis. This increase in energy causes collisions with the trap bath gas that induce dissociation into product ions that are retained in the trapping field. Scanning the contents of the trap to produce a mass spectrum is achieved by linearly increasing the RF voltage applied to the trap and using a supplemental resonance ejection voltage. This results in sequential movement of ions from stable orbits, and they become unstable in the x-direction and are ejected from the trapping field. The ions are then accelerated
17
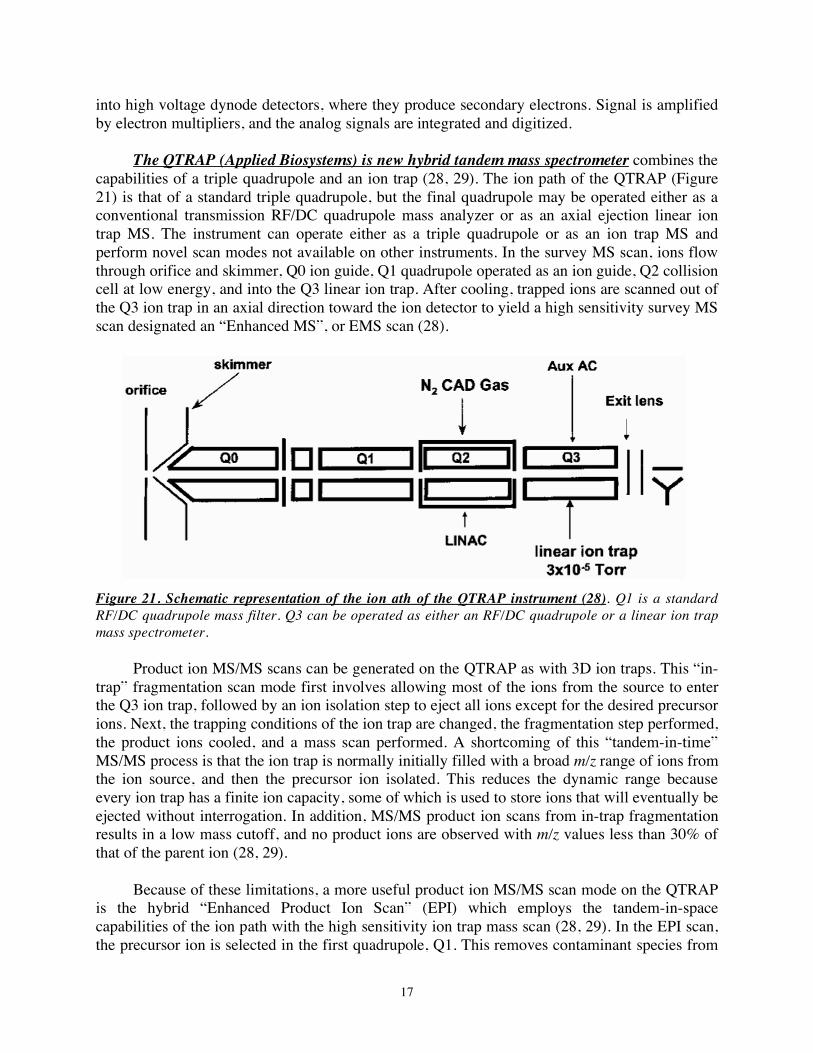
into high voltage dynode detectors, where they produce secondary electrons. Signal is amplified by electron multipliers, and the analog signals are integrated and digitized. The QTRAP (Applied Biosystems) is new hybrid tandem mass spectrometer combines the capabilities of a triple quadrupole and an ion trap (28, 29). The ion path of the QTRAP (Figure 21) is that of a standard triple quadrupole, but the final quadrupole may be operated either as a conventional transmission RF/DC quadrupole mass analyzer or as an axial ejection linear ion trap MS. The instrument can operate either as a triple quadrupole or as an ion trap MS and perform novel scan modes not available on other instruments. In the survey MS scan, ions flow through orifice and skimmer, Q0 ion guide, Q1 quadrupole operated as an ion guide, Q2 collision cell at low energy, and into the Q3 linear ion trap. After cooling, trapped ions are scanned out of the Q3 ion trap in an axial direction toward the ion detector to yield a high sensitivity survey MS scan designated an “Enhanced MS”, or EMS scan (28).
Figure 21. Schematic representation of the ion ath of the QTRAP instrument (28). Q1 is a standard RF/DC quadrupole mass filter. Q3 can be operated as either an RF/DC quadrupole or a linear ion trap mass spectrometer. Product ion MS/MS scans can be generated on the QTRAP as with 3D ion traps. This “in-trap” fragmentation scan mode first involves allowing most of the ions from the source to enter the Q3 ion trap, followed by an ion isolation step to eject all ions except for the desired precursor ions. Next, the trapping conditions of the ion trap are changed, the fragmentation step performed, the product ions cooled, and a mass scan performed. A shortcoming of this “tandem-in-time” MS/MS process is that the ion trap is normally initially filled with a broad m/z range of ions from the ion source, and then the precursor ion isolated. This reduces the dynamic range because every ion trap has a finite ion capacity, some of which is used to store ions that will eventually be ejected without interrogation. In addition, MS/MS product ion scans from in-trap fragmentation results in a low mass cutoff, and no product ions are observed with m/z values less than 30% of that of the parent ion (28, 29). Because of these limitations, a more useful product ion MS/MS scan mode on the QTRAP is the hybrid “Enhanced Product Ion Scan” (EPI) which employs the tandem-in-space capabilities of the ion path with the high sensitivity ion trap mass scan (28, 29). In the EPI scan, the precursor ion is selected in the first quadrupole, Q1. This removes contaminant species from
18
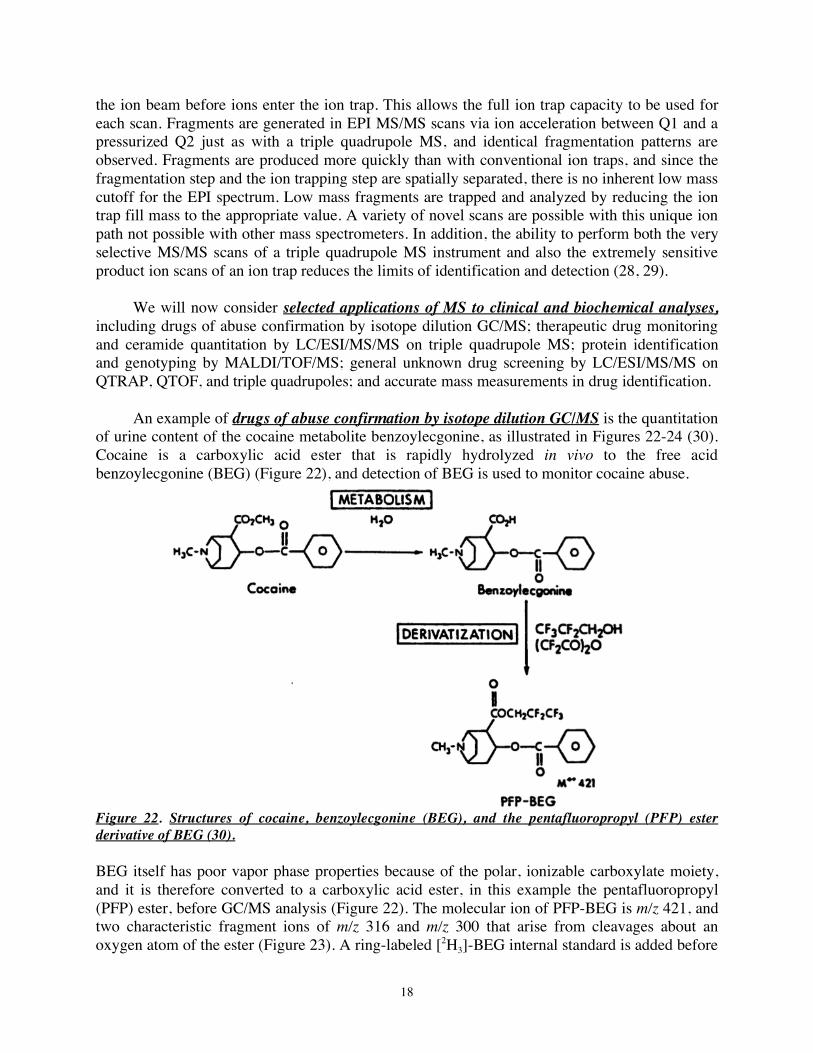
the ion beam before ions enter the ion trap. This allows the full ion trap capacity to be used for each scan. Fragments are generated in EPI MS/MS scans via ion acceleration between Q1 and a pressurized Q2 just as with a triple quadrupole MS, and identical fragmentation patterns are observed. Fragments are produced more quickly than with conventional ion traps, and since the fragmentation step and the ion trapping step are spatially separated, there is no inherent low mass cutoff for the EPI spectrum. Low mass fragments are trapped and analyzed by reducing the ion trap fill mass to the appropriate value. A variety of novel scans are possible with this unique ion path not possible with other mass spectrometers. In addition, the ability to perform both the very selective MS/MS scans of a triple quadrupole MS instrument and also the extremely sensitive product ion scans of an ion trap reduces the limits of identification and detection (28, 29). We will now consider selected applications of MS to clinical and biochemical analyses, including drugs of abuse confirmation by isotope dilution GC/MS; therapeutic drug monitoring and ceramide quantitation by LC/ESI/MS/MS on triple quadrupole MS; protein identification and genotyping by MALDI/TOF/MS; general unknown drug screening by LC/ESI/MS/MS on QTRAP, QTOF, and triple quadrupoles; and accurate mass measurements in drug identification. An example of drugs of abuse confirmation by isotope dilution GC/MS is the quantitation of urine content of the cocaine metabolite benzoylecgonine, as illustrated in Figures 22-24 (30). Cocaine is a carboxylic acid ester that is rapidly hydrolyzed in vivo to the free acid benzoylecgonine (BEG) (Figure 22), and detection of BEG is used to monitor cocaine abuse.
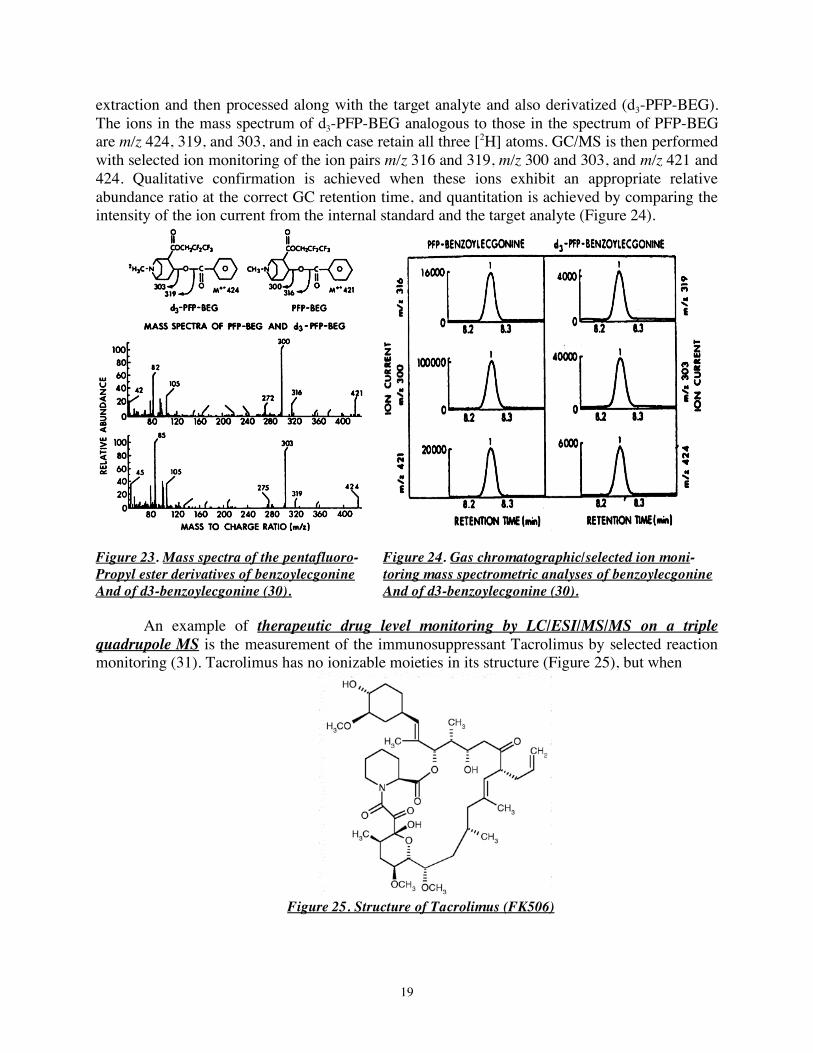
Figure 22. Structures of cocaine, benzoylecgonine (BEG), and the pentafluoropropyl (PFP) ester derivative of BEG (30). BEG itself has poor vapor phase properties because of the polar, ionizable carboxylate moiety, and it is therefore converted to a carboxylic acid ester, in this example the pentafluoropropyl (PFP) ester, before GC/MS analysis (Figure 22). The molecular ion of PFP-BEG is m/z 421, and two characteristic fragment ions of m/z 316 and m/z 300 that arise from cleavages about an oxygen atom of the ester (Figure 23). A ring-labeled [2H3]-BEG internal standard is added before
19
extraction and then processed along with the target analyte and also derivatized (d3-PFP-BEG). The ions in the mass spectrum of d3-PFP-BEG analogous to those in the spectrum of PFP-BEG are m/z 424, 319, and 303, and in each case retain all three [2H] atoms. GC/MS is then performed with selected ion monitoring of the ion pairs m/z 316 and 319, m/z 300 and 303, and m/z 421 and 424. Qualitative confirmation is achieved when these ions exhibit an appropriate relative abundance ratio at the correct GC retention time, and quantitation is achieved by comparing the intensity of the ion current from the internal standard and the target analyte (Figure 24).
Figure 23. Mass spectra of the pentafluoro- Figure 24. Gas chromatographic/selected ion moni- Propyl ester derivatives of benzoylecgonine toring mass spectrometric analyses of benzoylecgonine And of d3-benzoylecgonine (30). And of d3-benzoylecgonine (30). An example of therapeutic drug level monitoring by LC/ESI/MS/MS on a triple quadrupole MS is the measurement of the immunosuppressant Tacrolimus by selected reaction monitoring (31). Tacrolimus has no ionizable moieties in its structure (Figure 25), but when
Figure 25. Structure of Tacrolimus (FK506)
20
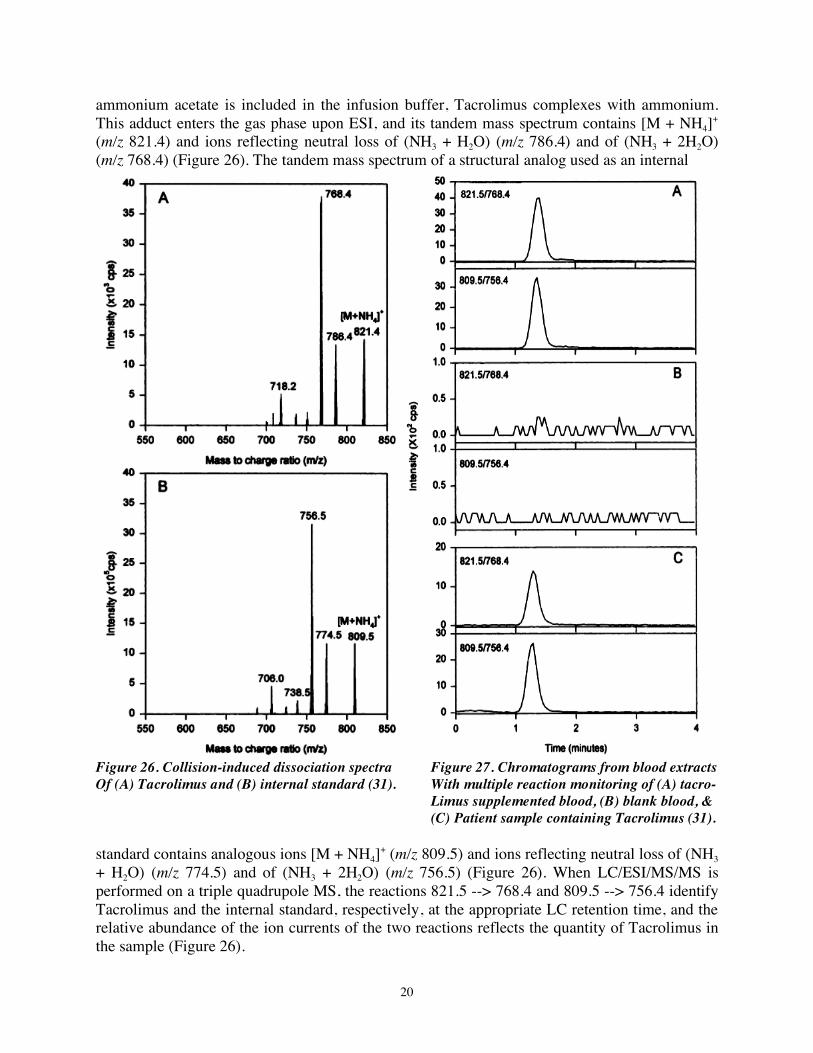
ammonium acetate is included in the infusion buffer, Tacrolimus complexes with ammonium. This adduct enters the gas phase upon ESI, and its tandem mass spectrum contains [M + NH4]+ (m/z 821.4) and ions reflecting neutral loss of (NH3 + H2O) (m/z 786.4) and of (NH3 + 2H2O) (m/z 768.4) (Figure 26). The tandem mass spectrum of a structural analog used as an internal
Figure 26. Collision-induced dissociation spectra Figure 27. Chromatograms from blood extracts Of (A) Tacrolimus and (B) internal standard (31). With multiple reaction monitoring of (A) tacro- Limus supplemented blood, (B) blank blood, & (C) Patient sample containing Tacrolimus (31). standard contains analogous ions [M + NH4]+ (m/z 809.5) and ions reflecting neutral loss of (NH3 + H2O) (m/z 774.5) and of (NH3 + 2H2O) (m/z 756.5) (Figure 26). When LC/ESI/MS/MS is performed on a triple quadrupole MS, the reactions 821.5 --> 768.4 and 809.5 --> 756.4 identify Tacrolimus and the internal standard, respectively, at the appropriate LC retention time, and the relative abundance of the ion currents of the two reactions reflects the quantity of Tacrolimus in the sample (Figure 26).
21
Constant neutral loss scanning on a triple quadrupole MS to quantitate ceramide is illustrated in Figures 27-29 (32). Ceramide is a fatty acid amide of the long-chain base sphingosine and is an important signaling molecule in apoptosis (programmed cell death) in many cases. One example is apoptosis of insulin-secreting β-cells induced by depletion of internal Ca2+ stores by treatment with thapsigargin, an inhibitor of the sarco(endo)plasmic reticulum Ca2+-ATPase. Ceramide has no ionizable moieties, but it complexes with Li+ in salts added to the infusion buffer. The adduct ion enters the gas phase upon ESI. Cell extracts contain ceramide species with various fatty acid substituents, and an internal standard that does not occur naturally with an octanoic acid substituent (8:0-CM) can be added. Figure 28A illustrates the profile of ceramide species in a lipid extract from insulinoma cells to which 8:0-CM had been added. The 8:0-CM [M + Li]+ ion is m/z 432, and the [M + Li]+ ions of endogenous ceramide species with different fatty acid substituents are m/z 656.7 (24:0-CM), 654.4 (24:1-CM), 628.6 (22:0-CM), 572.5 (18:0-CM), and 544.5 (16:0-CM). Figure 28B is the tandem spectrum from
Figure 28. ESI/MS analyses of Li+ adducts of ceramide species from insulinoma cells (A) and tandem mass spectrum of [M + Li]+ of 24:1-CM (B) (32). CID of m/z 654.6, which is [M + Li]+ of 24:1-CM. The prominent fragment ion of m/z 606 reflects sequential neutral losses of water and formaldehyde, as illustrated in Figure 29, and the net loss of 48 m/z units is a common feature of the tandem spectra of Li+ adducts of all ceramide species.
Figure 29. Neutral losses of water and formaldehyde from [M + Li]+ of 24:1-ceramide (32). A constant neutral loss of 48 ESI/MS/MS scan on a triple quadrupole can thus be used to display the ceramide species in a biological mixture, and each species can be quantitated relative
22
to the 8:0-CM internal standard, as in Figure 30, which compares ceramide content of control insulinoma cells to that of thapsigargin-treated cells. Treated cells exhibit a higher abundance of endogenous species (e.g., m/z 546 for 16:0-CM) relative to the internal standard (m/z 432) than control cells, reflecting a thapsigargin-induced rise in the endogenous ceramide content.
Figure 30. Thapsigargin-induced ceramide accumulation in INS-1 insulinoma cells. Ceramide species in control cells (A) or cells treated with thapsigargin (B) were analyzed as Li+ adducts by ESI/MS/MS scanning for constant neutral loss of 48 (32). The advantage of constant neutral loss scans over simply monitoring total ion current is that MS/MS scanning eliminates interference from extraneous substances in biological extracts and greatly increases both measurement specificity and sensitivity by reducing noise level. An example of genotyping by using primer oligo base extension and MALDI/TOF/MS is provided in Figures 31-32 (33). Several known mutations in the cystic fibrosis transmembrane conductance regulator (CFTR) gene cause cystic fibrosis, and four of them involve a short segment of the gene, as illustrated in Figure 31. These mutations can be identified and distinguished from the wild-type allele by using PCR primers complementary to the region of the gene adjacent to the mutation site and then performing PCR with mixtures of dXTP that permit chain extension and ddYTP that causes chain termination.
In the example in Figure 31a, using the primer and ddTTP as the chain terminator results in production of an oligonucleotide of m/z 8841.8 from the wild-type allele and one of m/z 7889.8 from the ΔF508 mutant allele. In contrast, Figure 31b illustrates that when ddCTP is used as chain terminator, the wild-type allele produces an oligonucleotide of m/z 11,604.5, and the ΔF508 mutant allele produces a fragment of m/z 10,652.0.
Figure 32 illustrates MALDI/TOF/MS analyses of products of such primer oligo base extension assays for the genotypes homozygous wild-type (WT/WT, panels a and b), homozygous ΔF508 mutant (ΔF508/ΔF508 mutant, panels e and f), and heterozygous WT/ΔF508 (panels c and d). Note that these analyses were performed before delayed extraction and reflectrons had been developed for MALDI/TOF/MS, and the resolution and mass accuracy of the spectra are rather poor, although still adequate to achieve the objective of genotyping.
23
Figure 31. Detecting CFTR gene mutations by using primer oligo base extension (33).
Figure 32. MALDI/TOF/MS of primer oligo base extension products to detect CFTR mutations (33).
24
Peptide mass mapping of a tryptic digest by MALDI/TOF/MS to identify a protein is illustrated in Figures 33-34 (34). In this case, two bands of different MW on SDS-PAGE were observed in genetically manipulated and native insulinoma cells that were immunoreactive with antibodies to the Group VIA Phospholipase A2 (iPLA2β) on Western blotting (Figure 33). The higher MW material corresponded to the product expected from the cDNA sequence and was overexpressed in cells stably transfected with the iPLA2β cDNA in a retroviral vector (OE). In contrast, only the lower MW material was observed in native insulinoma cells (832/13) or cells transfected with empty vector (V). The question arose as to whether the lower MW material was a product of the iPLA2β gene or simply a cross-reactive protein encoded by another gene.
Figure 33. Western Figure 34. MALDI/TOF/MS of tryptic digest of a 70 kDa iPLA2β- Blot of iPLA2β- immunoreactive protein expressed by β-cell lines (34). Immunoreactive Proteins in β-cell Lines (34). To address this question, the bands were excised from the gels, digested with trypsin, and analyzed by MALDI/TOF/MS (Figure 34). For both higher and lower MW bands, at least ten ions corresponded exactly in m/z value to tryptic peptides expected from the iPLA2β cDNA sequence, providing strong evidence that the lower MW band is in fact a product of the iPLA2β gene. This was confirmed by LC/ESI/MS/MS analyses of several of the peptides on a QTOF instrument (Figure 35), which produced spectra that confirmed the amino acid sequence expected from the iPLA2β cDNA sequence. (Although a doubly charged ion was subjected to CAD, the QTOF data system converts the data into a spectrum for singly charged species to facilitate interpretation. Singly charged species themselves are not subjected to CAD and are excluded in the data-dependent MS to MS/MS transition algorithm because most singly charged species represent chemical noise rather than bona fide tryptic peptides. Most tryptic peptides will have a charge state of at least +2 because they will have a C-terminal Lys or Arg residue with a basic side chain and an N-terminal alpha amino group, and both of these moieties are expected to be protonated under the conditions of the LC/ESI/MS/MS analyses.)
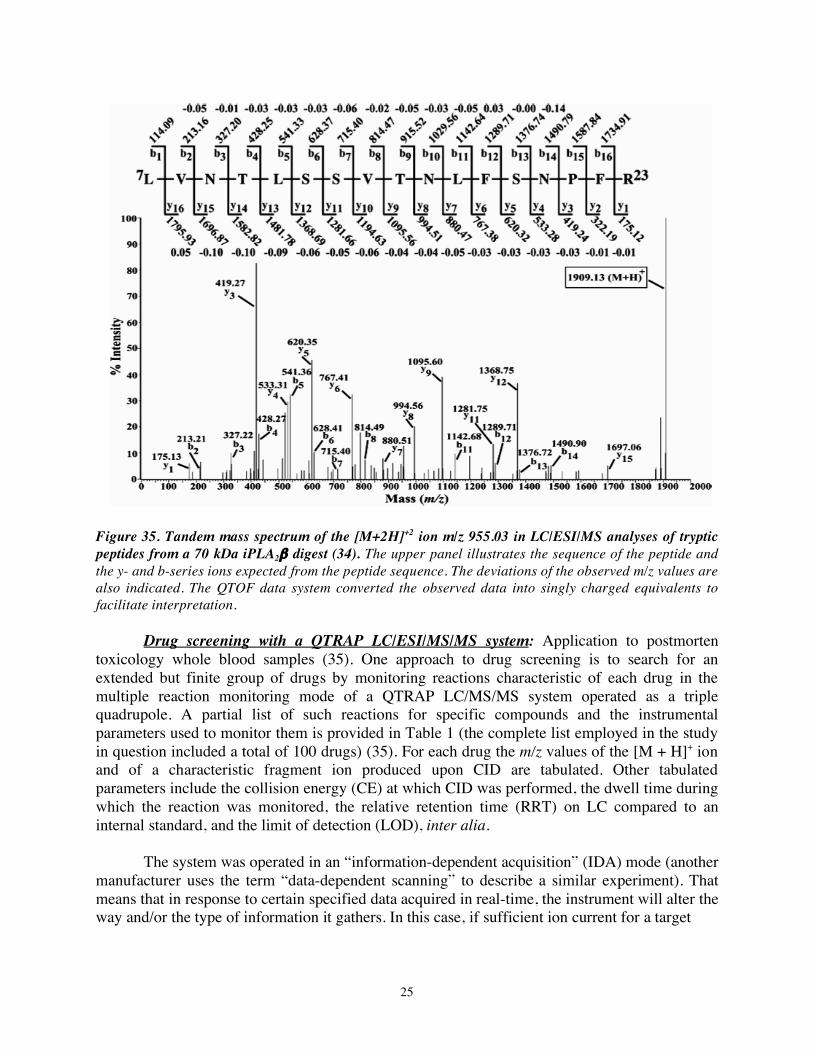
25
Figure 35. Tandem mass spectrum of the [M+2H]+2 ion m/z 955.03 in LC/ESI/MS analyses of tryptic peptides from a 70 kDa iPLA2β digest (34). The upper panel illustrates the sequence of the peptide and the y- and b-series ions expected from the peptide sequence. The deviations of the observed m/z values are also indicated. The QTOF data system converted the observed data into singly charged equivalents to facilitate interpretation.
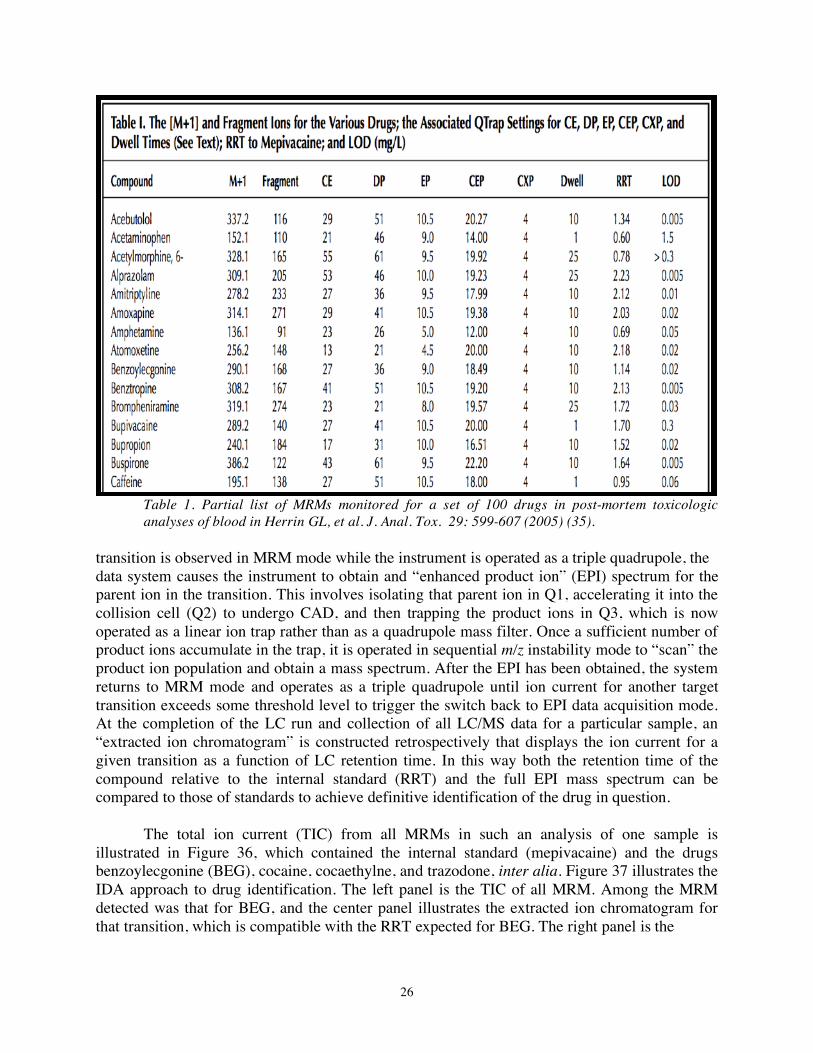
Drug screening with a QTRAP LC/ESI/MS/MS system: Application to postmorten toxicology whole blood samples (35). One approach to drug screening is to search for an extended but finite group of drugs by monitoring reactions characteristic of each drug in the multiple reaction monitoring mode of a QTRAP LC/MS/MS system operated as a triple quadrupole. A partial list of such reactions for specific compounds and the instrumental parameters used to monitor them is provided in Table 1 (the complete list employed in the study in question included a total of 100 drugs) (35). For each drug the m/z values of the [M + H]+ ion and of a characteristic fragment ion produced upon CID are tabulated. Other tabulated parameters include the collision energy (CE) at which CID was performed, the dwell time during which the reaction was monitored, the relative retention time (RRT) on LC compared to an internal standard, and the limit of detection (LOD), inter alia.
The system was operated in an “information-dependent acquisition” (IDA) mode (another manufacturer uses the term “data-dependent scanning” to describe a similar experiment). That means that in response to certain specified data acquired in real-time, the instrument will alter the way and/or the type of information it gathers. In this case, if sufficient ion current for a target
26
Table 1. Partial list of MRMs monitored for a set of 100 drugs in post-mortem toxicologic analyses of blood in Herrin GL, et al. J. Anal. Tox. 29: 599-607 (2005) (35).
transition is observed in MRM mode while the instrument is operated as a triple quadrupole, the data system causes the instrument to obtain and “enhanced product ion” (EPI) spectrum for the parent ion in the transition. This involves isolating that parent ion in Q1, accelerating it into the collision cell (Q2) to undergo CAD, and then trapping the product ions in Q3, which is now operated as a linear ion trap rather than as a quadrupole mass filter. Once a sufficient number of product ions accumulate in the trap, it is operated in sequential m/z instability mode to “scan” the product ion population and obtain a mass spectrum. After the EPI has been obtained, the system returns to MRM mode and operates as a triple quadrupole until ion current for another target transition exceeds some threshold level to trigger the switch back to EPI data acquisition mode. At the completion of the LC run and collection of all LC/MS data for a particular sample, an “extracted ion chromatogram” is constructed retrospectively that displays the ion current for a given transition as a function of LC retention time. In this way both the retention time of the compound relative to the internal standard (RRT) and the full EPI mass spectrum can be compared to those of standards to achieve definitive identification of the drug in question. The total ion current (TIC) from all MRMs in such an analysis of one sample is illustrated in Figure 36, which contained the internal standard (mepivacaine) and the drugs benzoylecgonine (BEG), cocaine, cocaethylne, and trazodone, inter alia. Figure 37 illustrates the IDA approach to drug identification. The left panel is the TIC of all MRM. Among the MRM detected was that for BEG, and the center panel illustrates the extracted ion chromatogram for that transition, which is compatible with the RRT expected for BEG. The right panel is the
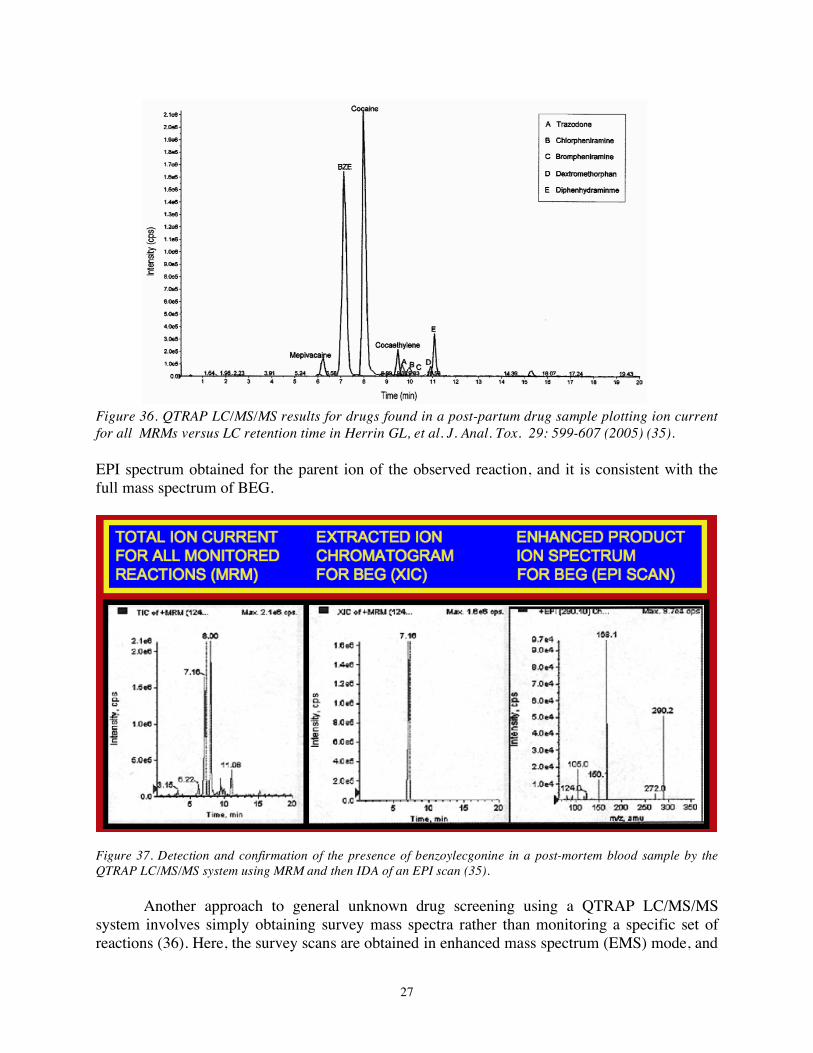
27
Figure 36. QTRAP LC/MS/MS results for drugs found in a post-partum drug sample plotting ion current for all MRMs versus LC retention time in Herrin GL, et al. J. Anal. Tox. 29: 599-607 (2005) (35). EPI spectrum obtained for the parent ion of the observed reaction, and it is consistent with the full mass spectrum of BEG.
Figure 37. Detection and confirmation of the presence of benzoylecgonine in a post-mortem blood sample by the QTRAP LC/MS/MS system using MRM and then IDA of an EPI scan (35).
Another approach to general unknown drug screening using a QTRAP LC/MS/MS system involves simply obtaining survey mass spectra rather than monitoring a specific set of reactions (36). Here, the survey scans are obtained in enhanced mass spectrum (EMS) mode, and
28
this involves operating Q1 and Q2 as RF-only transmission devices over a wide range of m/z values, e.g., 100-1100, that include the [M + H]+ ions of most conventional heterocyclic drugs. Ions accumulate in the trap until it contains a sufficient number to produce a high quality mass spectrum (rather than being obtained “on-the-fly” as in a triple stage quadrupole, for example). Once the trap accumulates an adequate number of ions, it is operated in sequential mass instability mode to scan the m/z values of the trapped ions.
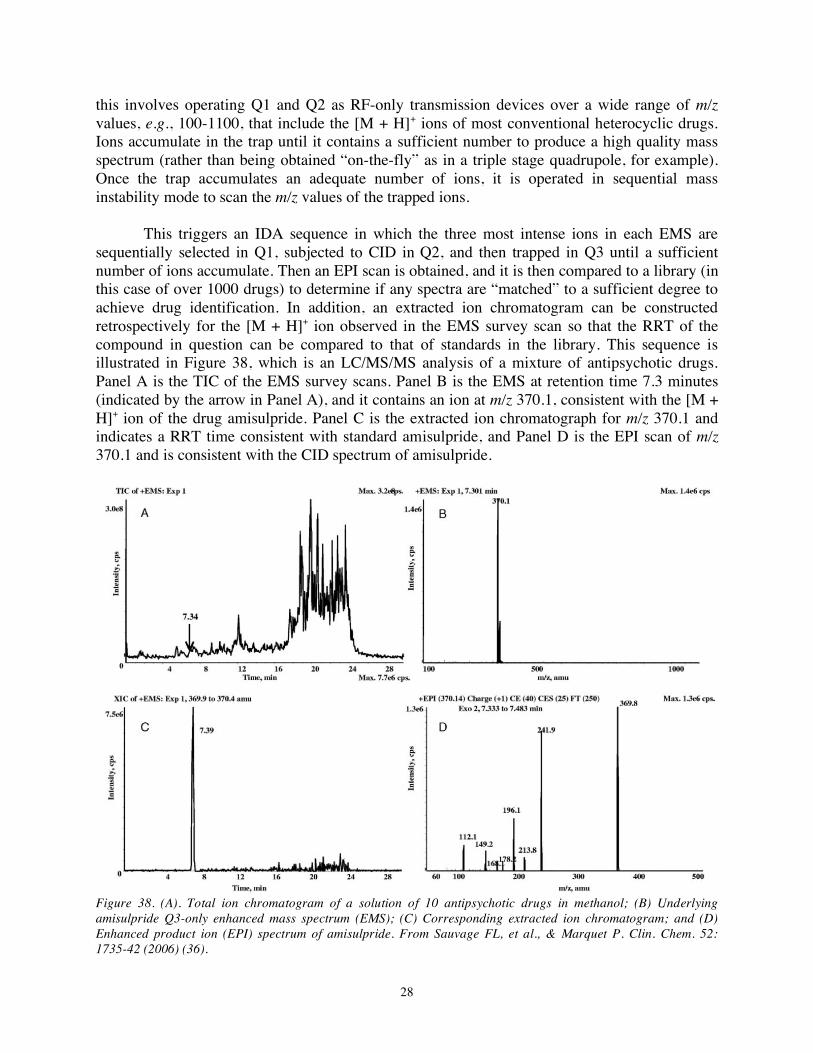
This triggers an IDA sequence in which the three most intense ions in each EMS are
sequentially selected in Q1, subjected to CID in Q2, and then trapped in Q3 until a sufficient number of ions accumulate. Then an EPI scan is obtained, and it is then compared to a library (in this case of over 1000 drugs) to determine if any spectra are “matched” to a sufficient degree to achieve drug identification. In addition, an extracted ion chromatogram can be constructed retrospectively for the [M + H]+ ion observed in the EMS survey scan so that the RRT of the compound in question can be compared to that of standards in the library. This sequence is illustrated in Figure 38, which is an LC/MS/MS analysis of a mixture of antipsychotic drugs. Panel A is the TIC of the EMS survey scans. Panel B is the EMS at retention time 7.3 minutes (indicated by the arrow in Panel A), and it contains an ion at m/z 370.1, consistent with the [M + H]+ ion of the drug amisulpride. Panel C is the extracted ion chromatograph for m/z 370.1 and indicates a RRT time consistent with standard amisulpride, and Panel D is the EPI scan of m/z 370.1 and is consistent with the CID spectrum of amisulpride.
Figure 38. (A). Total ion chromatogram of a solution of 10 antipsychotic drugs in methanol; (B) Underlying amisulpride Q3-only enhanced mass spectrum (EMS); (C) Corresponding extracted ion chromatogram; and (D) Enhanced product ion (EPI) spectrum of amisulpride. From Sauvage FL, et al., & Marquet P. Clin. Chem. 52: 1735-42 (2006) (36).
29
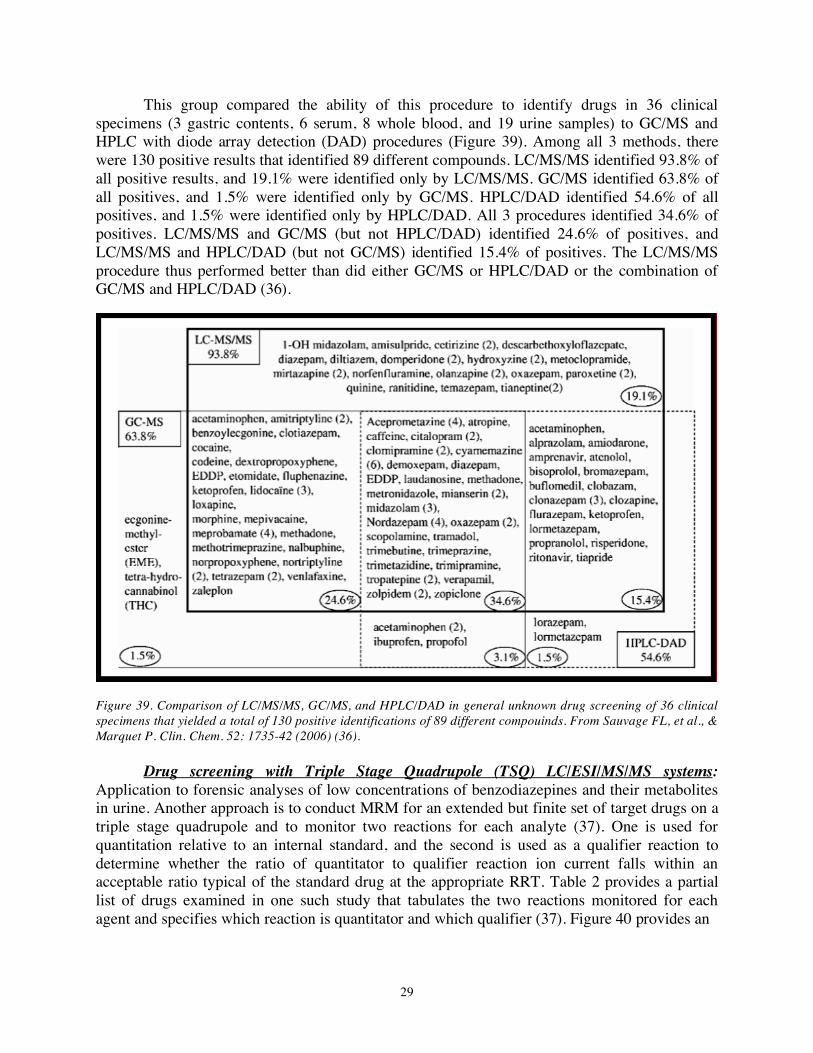
This group compared the ability of this procedure to identify drugs in 36 clinical specimens (3 gastric contents, 6 serum, 8 whole blood, and 19 urine samples) to GC/MS and HPLC with diode array detection (DAD) procedures (Figure 39). Among all 3 methods, there were 130 positive results that identified 89 different compounds. LC/MS/MS identified 93.8% of all positive results, and 19.1% were identified only by LC/MS/MS. GC/MS identified 63.8% of all positives, and 1.5% were identified only by GC/MS. HPLC/DAD identified 54.6% of all positives, and 1.5% were identified only by HPLC/DAD. All 3 procedures identified 34.6% of positives. LC/MS/MS and GC/MS (but not HPLC/DAD) identified 24.6% of positives, and LC/MS/MS and HPLC/DAD (but not GC/MS) identified 15.4% of positives. The LC/MS/MS procedure thus performed better than did either GC/MS or HPLC/DAD or the combination of GC/MS and HPLC/DAD (36).
Figure 39. Comparison of LC/MS/MS, GC/MS, and HPLC/DAD in general unknown drug screening of 36 clinical specimens that yielded a total of 130 positive identifications of 89 different compouinds. From Sauvage FL, et al., & Marquet P. Clin. Chem. 52: 1735-42 (2006) (36).
Drug screening with Triple Stage Quadrupole (TSQ) LC/ESI/MS/MS systems: Application to forensic analyses of low concentrations of benzodiazepines and their metabolites in urine. Another approach is to conduct MRM for an extended but finite set of target drugs on a triple stage quadrupole and to monitor two reactions for each analyte (37). One is used for quantitation relative to an internal standard, and the second is used as a qualifier reaction to determine whether the ratio of quantitator to qualifier reaction ion current falls within an acceptable ratio typical of the standard drug at the appropriate RRT. Table 2 provides a partial list of drugs examined in one such study that tabulates the two reactions monitored for each agent and specifies which reaction is quantitator and which qualifier (37). Figure 40 provides an
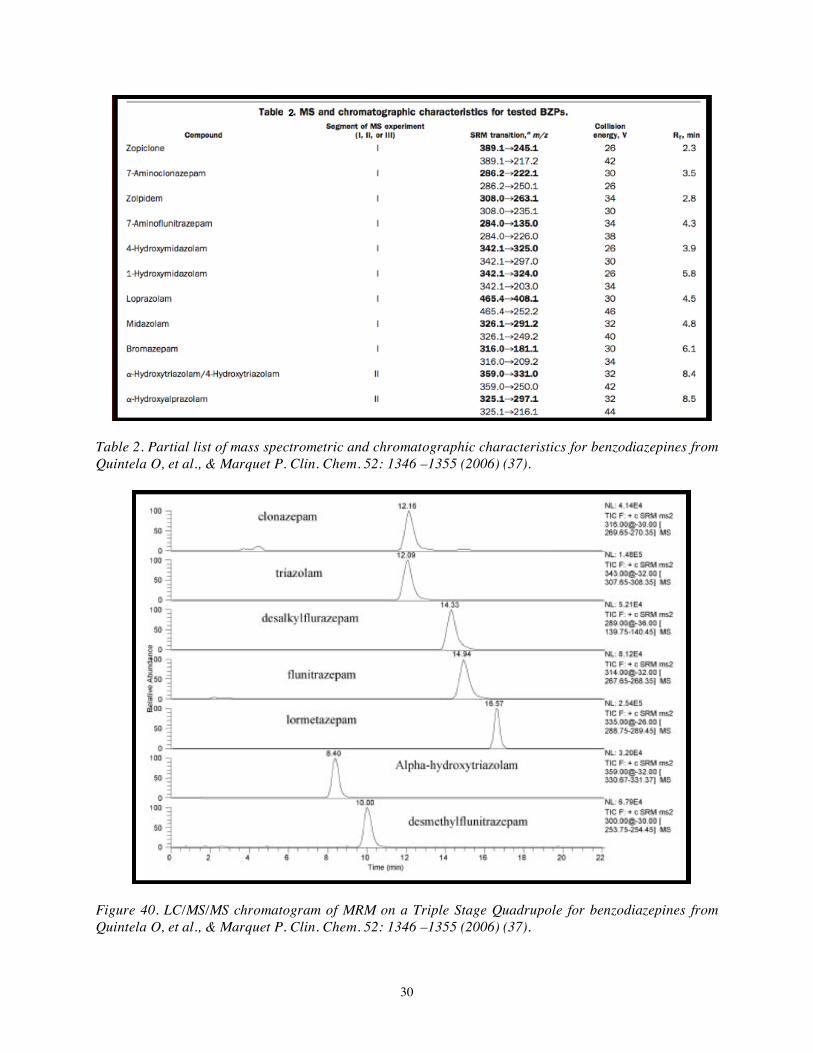
30
Table 2. Partial list of mass spectrometric and chromatographic characteristics for benzodiazepines from Quintela O, et al., & Marquet P. Clin. Chem. 52: 1346 –1355 (2006) (37).
Figure 40. LC/MS/MS chromatogram of MRM on a Triple Stage Quadrupole for benzodiazepines from Quintela O, et al., & Marquet P. Clin. Chem. 52: 1346 –1355 (2006) (37).
31
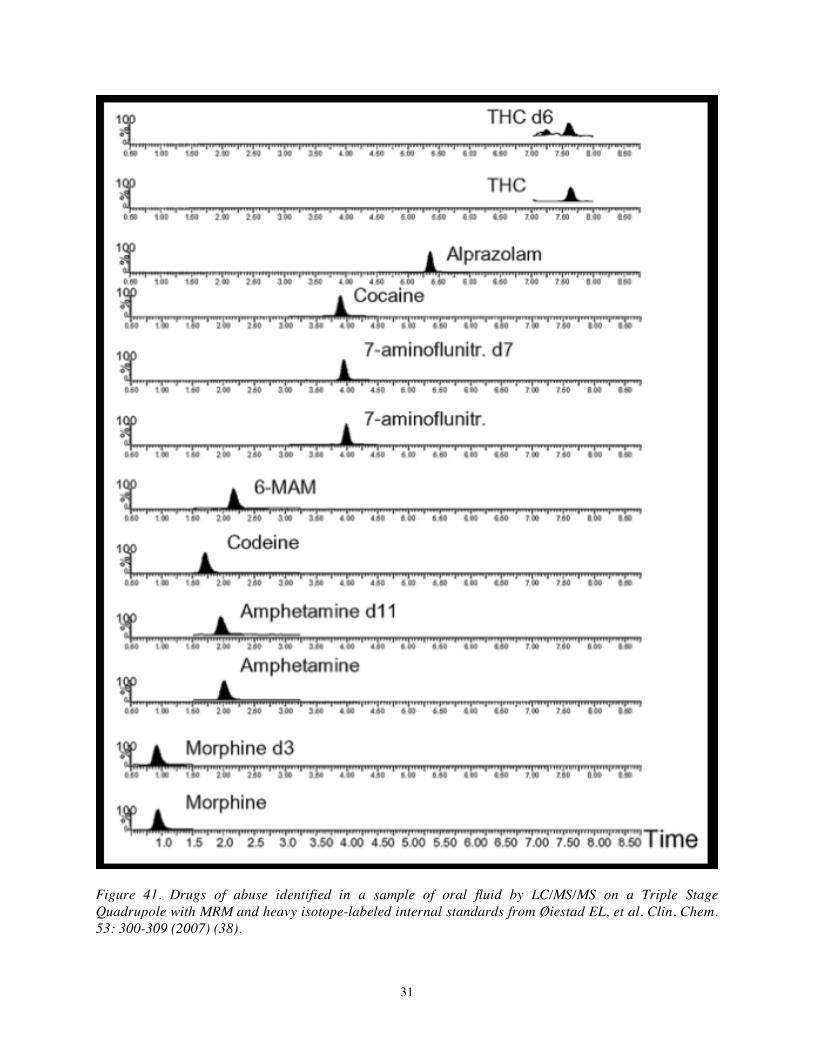
Figure 41. Drugs of abuse identified in a sample of oral fluid by LC/MS/MS on a Triple Stage Quadrupole with MRM and heavy isotope-labeled internal standards from Øiestad EL, et al. Clin. Chem. 53: 300-309 (2007) (38).
32
illustration of an LC/MS/MS chromatogram for such a sample that illustrates retention times and reactions monitored for the benzodiazepines identified. Figure 41 provides another example of LC/MS/MS on a TSQ with MRM for a single reaction for each target analyte used to screen for drugs of abuse in oral fluid. Here, [2Hx]-labeled analogs of THC, amphetamine, and morphine, inter alia, were included to permit quantitation (38).
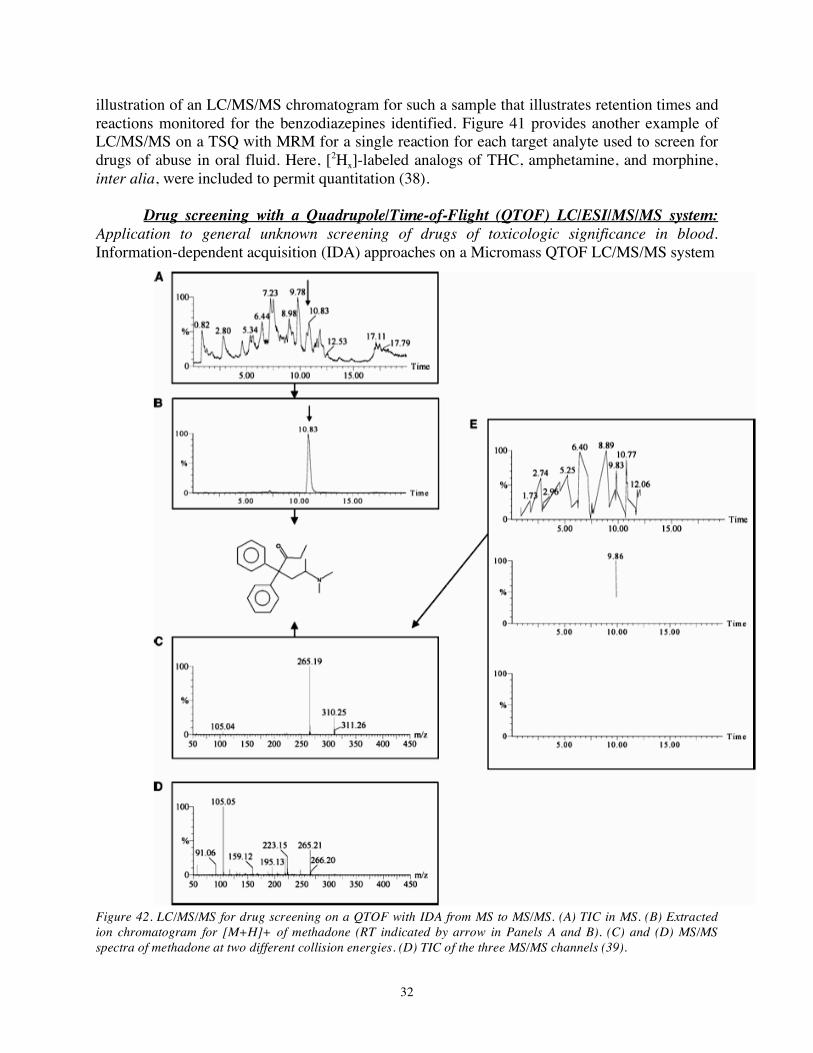
Drug screening with a Quadrupole/Time-of-Flight (QTOF) LC/ESI/MS/MS system: Application to general unknown screening of drugs of toxicologic significance in blood. Information-dependent acquisition (IDA) approaches on a Micromass QTOF LC/MS/MS system
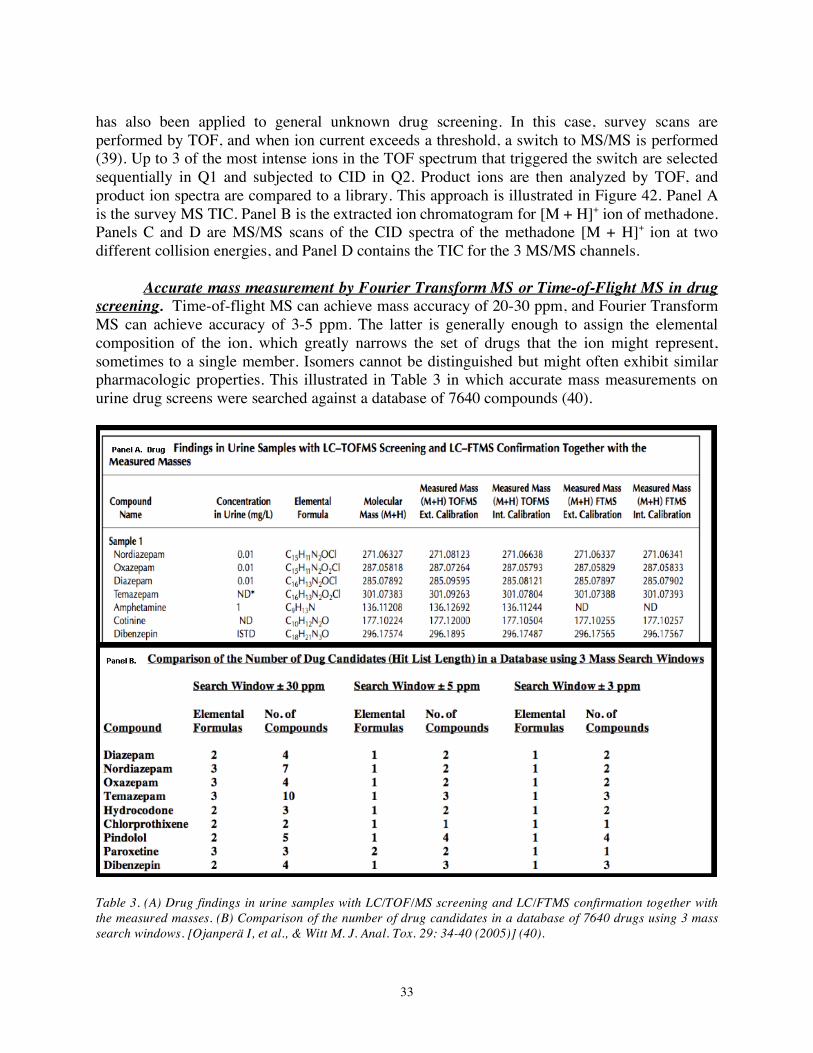
Figure 42. LC/MS/MS for drug screening on a QTOF with IDA from MS to MS/MS. (A) TIC in MS. (B) Extracted ion chromatogram for [M+H]+ of methadone (RT indicated by arrow in Panels A and B). (C) and (D) MS/MS spectra of methadone at two different collision energies. (D) TIC of the three MS/MS channels (39).
33
has also been applied to general unknown drug screening. In this case, survey scans are performed by TOF, and when ion current exceeds a threshold, a switch to MS/MS is performed (39). Up to 3 of the most intense ions in the TOF spectrum that triggered the switch are selected sequentially in Q1 and subjected to CID in Q2. Product ions are then analyzed by TOF, and product ion spectra are compared to a library. This approach is illustrated in Figure 42. Panel A is the survey MS TIC. Panel B is the extracted ion chromatogram for [M + H]+ ion of methadone. Panels C and D are MS/MS scans of the CID spectra of the methadone [M + H]+ ion at two different collision energies, and Panel D contains the TIC for the 3 MS/MS channels.
Accurate mass measurement by Fourier Transform MS or Time-of-Flight MS in drug screening. Time-of-flight MS can achieve mass accuracy of 20-30 ppm, and Fourier Transform MS can achieve accuracy of 3-5 ppm. The latter is generally enough to assign the elemental composition of the ion, which greatly narrows the set of drugs that the ion might represent, sometimes to a single member. Isomers cannot be distinguished but might often exhibit similar pharmacologic properties. This illustrated in Table 3 in which accurate mass measurements on urine drug screens were searched against a database of 7640 compounds (40).
Table 3. (A) Drug findings in urine samples with LC/TOF/MS screening and LC/FTMS confirmation together with the measured masses. (B) Comparison of the number of drug candidates in a database of 7640 drugs using 3 mass search windows. [Ojanperä I, et al., & Witt M. J. Anal. Tox. 29: 34-40 (2005)] (40).
34
Cited References 1.) Mass spectrometry. http://en.wikipedia.org/wiki/Mass_spectrometry (2008). 2.) Electron ionization. http://en.wikipedia.org/wiki/Electron_ionization (2008). 3.) Fales HM, Milne GW, Pisano JJ, Brewer HB, Blum MS, MacConnell JG, Brand J, &
Law N. Biological applications of electron ionization and chemical ionization mass spectrometry. Recent Prog. Horm. Res. 28: 591-626. (1972).
4.) Chemical ionization. http://en.wikipedia.org/wiki/Chemical_ionization (2008). 5.) Munson MSB & Field FH. Chemical Ionization Mass Spectrometry. J. Am. Chem. Soc.
88: 2621-2630 (1968). 6.) Dougherty RC. Negative chemical ionization mass spectrometry: applications in
environmental analytical chemistry. Biomed. Mass Spectrom. 8: 283-92 (1981). 7.) Lennon JJ. Matrix Assisted Laser Desorption Ionization Time-of-flight Mass
Spectrometry. http://www.abrf.org/ABRFNews/1997/June1997/ (1997). 8.) Matrix assisted laser desroprtion/ionization. http://en.wikipedia.org/wiki/Matrix-
assisted_laser_desorption/ionization (2008). 9.) Karas M, Bachman D, Bahr U, & Hillenkamp F. Matrix-assisted ultraviolet laser
desorption of non-volatile compounds. Int. J. Mass Spectrom. Ion Process 78: 53 (1987). 10.) Beavis RC & Chait BT. Matrix assisted laser desorption ionization mass spectrometry of
proteins. Methods Enzymol. 270: 519 (1996). 11.) Li YL, Gross ML, & Hsu FF. Ionic-liquid matrices for improved analysis of
phospholipids by MALDI-TOF mass spectrometry. J. Am. Soc. Mass Spectrom. 16: 679-82 (2005).
12.) Electrospray ionization. http://en.wikipedia.org/wiki/Electrospray_ionization (2008). 13.) Fenn JB. Electrospray Wings for Molecular Elephants (Nobel Lecture). Angew. Chem.
Int. Ed. 42, 3871 – 3894 (2003). 14.) Cottrell JS & Greathead RJ. Extending the mass range of a sector mass spectrometer.
Mass Spectrom. Rev. 5: 215-247 (1986). 15.) Paul W. Electromagnetic traps for charged and neutral particles. Reviews of Modern
Physics 62: 531-540 (1990). 16.) March RE. Quadrupole ion trap mass spectrometry: A view at the turn of the century. Int.
J. Mass Spectrom. 200: 285-312 (2000). 17.) Quadrupole ion trap. http://en.wikipedia.org/wiki/Quadrupole_ion_trap (2008). 18.) Schwartz JC, MW, & Syka JEP. A Two-Dimensional Quadrupole Ion Trap Mass
Spectrometer. J. Am. Soc. Mass. Spectrom. 13, 659 – 669 (2002). [Describes the LTQ] 19.) Comisarow, M. B.; Marshall, A. G. Fourier transform ion cyclotron resonance
spectroscopy Chem. Phys. Lett. 25: 282-283 (1974). 20.) Marshall AG, Hendrickson CL, & Jackson GS. Fourier Transform Ion Cyclotron
Resonance Mass Spectrometry: A Primer. Mass Spectrometry Reviews 17: 1-35 (1998). 21.) Marshall AG. Milestones in Fourier transform ion cyclotron resonance mass
spectrometry development Int. J. Mass Spectrom. Ion Processes 200: 331-356 (2000). 22.) Hu Q, Noll RJ, Li H, Makarov A, Hardmanc M & Cooks RG. The Orbitrap: a new mass
spectrometer. J. Mass Spectrom. 40: 430-443 (2005). 23.) Feigel C. Varian Application Note Number 27 24.) Ramanadham S, Hsu FF, Bohrer A, Nowatzke W, Ma Z, & Turk J. Electrospray
ionization mass spectrometric analyses of phospholipids from rat and human pancreatic
35
islets and subcellular membranes. Comparison to other tissues and implications for membrane fusion in insulin exocytosis. Biochemistry 1998; 37: 4533-4567.
25.) Hsu FF, Bohrer A, & Turk J. Formation of lithiated adducts of glycerophosphocholine lipids facilitates their identification by electrospray ionization tandem mass spectrometry. J. Am. Soc. Mass Spectrom. 1998; 9: 516-526.
26.) Chernushevich IV, Loboda AV, & Thomson BA. An introduction to quadrupole/time-of-flight mass spectrometry J. Mass Spectrom. 36: 849-865 (2001). [Describes the QTOF]
27.) Schwartz JC, MW, & Syka JEP. A Two-Dimensional Quadrupole Ion Trap Mass Spectrometer. J. Am. Soc. Mass. Spectrom. 13, 659-669 (2002). [Describes the LTQ]
28.) Le Blanc JCY, Hager JW, Ilisiu AMP, Hunter C, Zhong F, Chu I. Unique scanning capabilities of a new hybrid linear ion trap mass spectrometer (QTRAP) used for high sensitivity proteomics applications. Proteomics 3: 859–869 859 (2003).
29.) Londry FA & Hager JW. Mass selective axial ion ejection from a linear quadrupole ion trap. J. Am. Soc. Mass Spectrom. 14: 1130-1147 (2003). [Describes the QTRAP]
30.) Bodor G, Roggeman R, & Turk J: Variations in abundance of the molecular ion of the derivatized cocaine metabolite benzoylecgonine. Clin. Chem. 36: 742-747 (1990).
31.) Taylor PJ, Jones A, Balderson GA, Lynch SV, Norris RLG, & Pond SM Sensitive, specific quantitative analysis of tacrolimus (FK506) in blood by liquid chromatography-electrospray tandem mass spectrometry. Clinical Chemistry 42: 279-285 (1996).
32.) Ramanadham S, Hsu FF, Zhang S, Jin C, Bohrer A, Ma Z, & Turk J. Involvement of the Group VIA Phospholipase A2 (iPLA2β) in endoplasmic reticulum stress-induced apoptosis in insulinoma cells. Biochemistry 43: 918-930 (2004).
33.) Braun A, Little DP, & Koster H. Detecting CFTR gene mutations by using primer oligo base extension and mass spectrometry. Clinical Chemistry 43: 1151–1158 (1997).
34.) Ramanadham S, Song H, Hsu FF, Zhang S, Crankshaw M, Grant G, Newgard C, & Turk J. Pancreatic islets and insulinoma cells express a novel isoform of Group VIA PLA2 (iPLA2β) that participates in glucose-stimulated insulin secretion and is not produced by alternate splicing of the iPLA2β transcript. Biochemistry 42: 13929-40 (2003).
35.) Herrin GL, McCurdy HH, & Wall WH. Investigation of an LC–MS–MS (QTrap) Method for the Rapid Screening and Identification of Drugs in Post mortem Toxicology Whole Blood Samples. Journal of Analytical Toxicology 29: 599-607 (2005).
36.) Sauvage FL, Saint-marcoux F, Duretz B, Deporte D, Lachatre G, & Marquet P Screening of Drugs and Toxic Compounds with Liquid Chromatography-Linear Ion Trap Tandem Mass Spectrometry. Clin. Chem. 52: 1735–1742 (2006).
37.) Quintela O, Sauvage FL, Charvier F, Gaulier JM, Lachatre G, Marquet P. Liquid Chromatography–Tandem Mass Spectrometry for Detection of Low Concentrations of 21 Benzodiazepines, Metabolites, and Analogs in Urine: Method with Forensic Applications. Clin. Chem. 52: 1346 –1355 (2006).
38.) Øiestad EL, Johansen U, & Christophersen AS. Drug Screening of Preserved Oral Fluid by Liquid Chromatography-Tandem Mass Spectrometry. Clin. Chem. 53:300-309 (2007).
39.) Decaestecker TN, Van de Casteele SR, Wallemacq PE, Van Peteghem, CH Defore DL & Van Bocxlaer JF. Information-Dependent Acquisition-Mediated LC-MS/MS Screening Procedure with Semiquantitative Potential. Anal. Chem. 76: 6365-6373 (2004).
40.) Ojanperä I, Pelander A, Laks S, Gergov M, Vuori E, & Witt M. Application of Accurate Mass Measurement to Urine Drug Screening. Journal of Analytical Toxicology 29: 34-40 (2005).
36
Other Pertinent Reading Newer Ionization Methods 41.) Karas M, Bachman D, Bahr U, & Hillenkamp F. Matrix-assisted ultraviolet laser
desorption of non-volatile compounds. Int. J. Mass Spectrom. Ion Process 78: 53 (1987). 42.) Beavis RC & Chait BT. Matrix assisted laser desorption ionization mass spectrometry of
proteins. Methods Enzymol. 270: 519 (1996). 43.) Fenn JB. Electrospray Wings for Molecular Elephants (Nobel Lecture). Angew. Chem.
Int. Ed. 42, 3871 – 3894 (2003). Mass Analyzers 44.) Paul W. Electromagnetic traps for charged and neutral particles. Reviews of Modern
Physics 62: 531-540 (1990). 45.) March RE. Quadrupole ion trap mass spectrometry: A view at the turn of the century. Int.
J. Mass Spectrom. 200: 285-312 (2000). 46.) Marshall AG, Hendrickson CL, & Jackson GS. Fourier Transform Ion Cyclotron
Resonance Mass Spectrometry: A Primer. Mass Spectrometry Reviews 17: 1-35 (1998). 47.) Marshall AG. Milestones in Fourier transform ion cyclotron resonance mass
spectrometry development Int. J. Mass Spectrom. Ion Processes 200: 331-356 (2000). 48.) Hu Q, Noll RJ, Li H, Makarov A, Hardmanc M & Cooks RG. The Orbitrap: a new mass
spectrometer. J. Mass Spectrom. 40: 430-443 (2005). Newer Tandem Mass Spectrometers 49.) Chernushevich IV, Loboda AV, & Thomson BA. An introduction to quadrupole/time-of-
flight mass spectrometry J. Mass Spectrom. 36: 849-865 (2001). [Describes the QTOF] 50.) Schwartz JC, MW, & Syka JEP. A Two-Dimensional Quadrupole Ion Trap Mass
Spectrometer. J. Am. Soc. Mass. Spectrom. 13, 659 – 669 (2002). [Describes the LTQ] 51.) Londry FA & Hager JW. Mass selective axial ion ejection from a linear quadrupole ion
trap. J. Am. Soc. Mass Spectrom. 14: 1130-1147 (2003). [Describes the QTRAP] Isotope Dilution GC/MS (EI) to Quantitate and Confirm Drugs of Abuse 52.) Bodor G, Roggeman R, & Turk J: Variations in abundance of the molecular ion of the
derivatized cocaine metabolite benzoylecgonine. Clin. Chem. 36: 742-747 (1990). Negative Ion Electron Capture Measurement of Bioactive Substances 53.) Leis HJ, Fauler G, Rechberger GN, & Windischhofer W. Electron-Capture Mass
Spectrometry: A Powerful Tool in Biomedical Trace Level Analysis. Current Medicinal Chemistry 11: 1585-1594 (2004).
54.) Stickle D, Bohrer A, Berger R, Morrisey J, Klahr S, & Turk J. Quantitation of the putative neurotransmitter agmatine as the hexafluoroacetylacetonate derivative by stable isotope dilution gas chromatography and negative ion chemical ionization mass spectrometry. Anal. Biochem. 238: 129-136 (1996).
55.) Kempe K, Hsu FF, Bohrer A, & Turk J. Isotope dilution mass spectrometric measurements indicate that arachidonylethanolamide, the proposed endogenous ligand of the cannabinoid receptor, accumulates in rat brain tissue post-mortem but is contained at low levels in or is absent from fresh tissue. J. Biol. Chem. 271: 17287-17295 (1996).
56.) Peters FT, Samyn N, Kraemer T, Riedel WJ, Maurer HH. Negative-Ion Chemical Ionization Gas Chromatography–Mass Spectrometry Assay for Enantioselective Measurement of Amphetamines in Oral Fluid: Application to a Controlled Study with MDMA and Driving Under the Influence Cases. Clinical Chemistry 53: 702–710 (2007).
37
Quantitative Linked Tandem MS Scanning Modes on Triple Stage Quadrupoles: Therapeutic Drug Level Monitoring and Biochemical Measurements 57.) Taylor PJ, Jones A, Balderson GA, Lynch SV, Norris RLG, & Pond SM Sensitive,
specific quantitative analysis of tacrolimus (FK506) in blood by liquid chromatography-electrospray tandem mass spectrometry. Clinical Chemistry 42: 279-285 (1996).
58.) Ramanadham S, Hsu FF, Zhang S, Jin C, Bohrer A, Ma Z, & Turk J. Involvement of the Group VIA Phospholipase A2 (iPLA2β) in endoplasmic reticulum stress-induced apoptosis in insulinoma cells. Biochemistry 43: 918-930 (2004).
Peptide/Protein Characterization by MALDI/TOF/MS and LC/ESI/MS/MS 59.) Le Blanc JCY, Hager JW, Ilisiu AMP, Hunter C, Zhong F, Chu I. Unique scanning
capabilities of a new hybrid linear ion trap mass spectrometer (Q TRAP) used for high sensitivity proteomics applications. Proteomics 3: 859–869 859 (2003).
60.) Ramanadham S, Song H, Hsu FF, Zhang S, Crankshaw M, Grant G, Newgard C, & Turk J. Pancreatic islets and insulinoma cells express a novel isoform of Group VIA PLA2 (iPLA2β) that participates in glucose-stimulated insulin secretion and is not produced by alternate splicing of the iPLA2β transcript. Biochemistry 42: 13929-40 (2003).
61.) Hortin GL. The MALDI-TOF Mass Spectrometric View of the Plasma Proteome and Peptidome. Clinical Chemistry 52: 1223–1237 (2006).
62.) Albrethsen J. Reproducibility in Protein Profiling by MALDI-TOF Mass Spectrometry Clinical Chemistry 53: 852– 858 (2007).
MALDI/TOF/MS Methods for Genotyping 63.) Jalanko A, Kere J, Savilahti E, Schwartz M, Syvflnen AC, Ranki M, & Soderlund H.
Screening for Defined Cystic Fibrosis Mutations by Solid-Phase Minisequencing. Clin. Chem. 38: 39-43 (1992).
64.) Nikiforov TT, Rendle RB, Goelet P, Rogers YH, Kotewicz ML, Anderson S, Trainor GL, & Knapp MR. Genetic Bit Analysis: a solid phase method for typing single nucleotide polymorphisms. Nucleic Acids Research 22: 4167-4175 (1994).
65.) Braun A, Little DP, & Koster H. Detecting CFTR gene mutations by using primer oligo base extension and mass spectrometry. Clinical Chemistry 43: 1151–1158 (1997).
66.) Ross P, Hall L, Smirnov I, & Haff L. High level multiplex genotyping by MALDI-TOF mass spectrometry. Nature Biotechnology 16: 1347-1351 (1998).
67.) Kepper P, Reinhardt R, Dahl A, Lehrach H, & Sauer S. Matrix-Assisted Laser Desorption/Ionization Mass Spectrometric Analysis of DNA on Microarrays. Clinical Chemistry 52: 1303–1310 (2006).
68.) Kao HY, Su YN, Liao HK, MS, & Yu-Ju Chen YJ. Determination of SMN1/SMN2 Gene Dosage by a Quantitative Genotyping Platform Combining Capillary Electrophoresis and MALDI-TOF Mass Spectrometry. Clin. Chem. 52: 361-369 (2006).
69.) Blievernicht JK, Schaeffeler E, Klein K, Eichelbaum M, Schwab M, & Zanger UM. MALDI-TOF Mass Spectrometry for Multiplex Genotyping of CYP2B6 Single-Nucleotide Polymorphisms. Clinical Chemistry 53: 24-33 (2007).
Drug Screening with 3D Ion Trap Tandem MS Systems 70.) Fitzgerald RL, Rivera JD, & Herold DA. Broad Spectrum Drug Identification Directly
from Urine, Using Liquid Chromatography-Tandem Mass Spectrometry. Clinical Chemistry 45: 1224 –1234 (1999). [Drug screening with an LCQ].
38
Drug Screening with Triple Stage Quadrupole (TSQ) Tandem MS Systems 71.) Weinmann W, Wiedemann A, Eppinger B, Renz M, & Svoboda M. Screening for Drugs
in Serum by Electrospray Ionization/Collision-Induced Dissociation and Library Searching. J. Am. Soc. Mass Spectrom. 10: 1028 –1037 (1999).
72.) Weinmann W, Stoertzel M, Vogt S, Svoboda M, & Schreiber A.Tuning compounds for electrospray ionization/in-source collision-induced dissociation and mass spectra library searching. J. Mass Spectrom. 36: 1013 – 1023 (2001).
73.) Muller C, Schafer P, Stortzel M, Vogt S, & Weinmann W. Ion suppression effects in liquid chromatography–electrospray-ionization transport-region collision induced dissociation mass spectrometry with different serum extraction methods for systematic toxicological analysis with mass spectra libraries. J. Chromatogr. B 773: 47-52 (2002).
74.) Gergov M, Ojanpera I, & Vuori E. Simultaneous screening for 238 drugs in blood by liquid chromatography–ionspray tandem mass spectrometry with multiple-reaction monitoring. J. Chromatogr. B 795: 41-53 (2003).
75.) Maralikova B & Weinmann W. Confirmatory analysis for drugs of abuse in plasma and urine by high-performance liquid chromatography–tandem mass spectrometry with respect to criteria for compound identification. J. Chromatogr. B 811: 21-30 (2004).
76.) Quintela O, Sauvage FL, Charvier F, Gaulier JM, Lachatre G, Marquet P. Liquid Chromatography–Tandem Mass Spectrometry for Detection of Low Concentrations of 21 Benzodiazepines, Metabolites, and Analogs in Urine: Method with Forensic Applications. Clin. Chem. 52: 1346 –1355 (2006).
77.) Øiestad EL, Johansen U, & Christophersen AS. Drug Screening of Preserved Oral Fluid by Liquid Chromatography-Tandem Mass Spectrometry. Clin. Chem. 53:300-309 (2007).
Drug Screening with QTRAP Hybrid Quadrupole/Linear Ion Trap Tandem MS Systems 78.) Marquet P, Saint-Marcoux F, Gamble TN, Leblanc JCY. Comparison of a preliminary
procedure for the general unknown screening of drugs and toxic compounds using a quadrupole-linear ion-trap mass spectrometer with a liquid chromatography–mass spectrometry reference technique. J. Chromatogr. B 789: 9–18 (2003).
79.) Herrin GL, McCurdy HH, & Wall WH. Investigation of an LC–MS–MS (QTrap) Method for the Rapid Screening and Identification of Drugs in Post mortem Toxicology Whole Blood Samples. Journal of Analytical Toxicology 29: 599-607 (2005).
80.) Mueller CA, Weinmann W, Dresen S, Schreiber A, & Gergov M. Development of a multi-target screening analysis for 301 drugs using a QTrap liquid chromatography/tandem mass spectrometry system and automated library searching. Rapid Commun. Mass Spectrom. 19: 1332-1338 (2005).
81.) Jansen R, Lachatre G, & Marquet P. LC-MS/MS systematic toxicological analysis: Comparison of MS/MS spectra obtained with different instruments and settings. Clinical Biochemistry 38: 362 – 372 (2005). [Compares drug screening on QTRAP vs. TSQ]
82.) Sauvage FL, Saint-marcoux F, Duretz B, Deporte D, Lachatre G, & Marquet P Screening of Drugs and Toxic Compounds with Liquid Chromatography-Linear Ion Trap Tandem Mass Spectrometry. Clin. Chem. 52: 1735–1742 (2006).
Drug Screening with QTOF Hybrid Quadrupole/Time-of-Flight Tandem MS Systems 83.) Decaestecker TN, Clauwaert KM, Van Bocxlaer JF, Lambert WE, Van den Eeckhout
EG, Van Peteghem CH, De Leenheer AP. Evaluation of automated single mass spectrometry to tandem mass spectrometry function switching for comprehensive drug
39
profiling analysis using a quadrupole time-of-flight mass spectrometer. Rapid Commun. Mass Spectrom. 14: 1787-92 (2000).
84.) Decaestecker TN, Van de Casteele SR, Wallemacq PE, Van Peteghem, CH Defore DL & Van Bocxlaer JF. Information-Dependent Acquisition-Mediated LC-MS/MS Screening Procedure with Semiquantitative Potential. Anal. Chem. 76: 6365-6373 (2004).
Accurate Mass Measurements by TOF/MS and FTMS in Drug Screening 85.) Ojanperä I, Pelander A, Laks S, Gergov M, Vuori E, & Witt M. Application of Accurate
Mass Measurement to Urine Drug Screening. Journal of Analytical Toxicology 29: 34-40 (2005).