Embed Size (px)
Citation preview
Engineering Thermodynamics _________________________________________________________ _ AAiT
_____________________________________________________________________________________Compiled by Yidnekachew M. Page 1 of 54
Chapter 7
Vapor-Power Cycle
4.1 Introduction
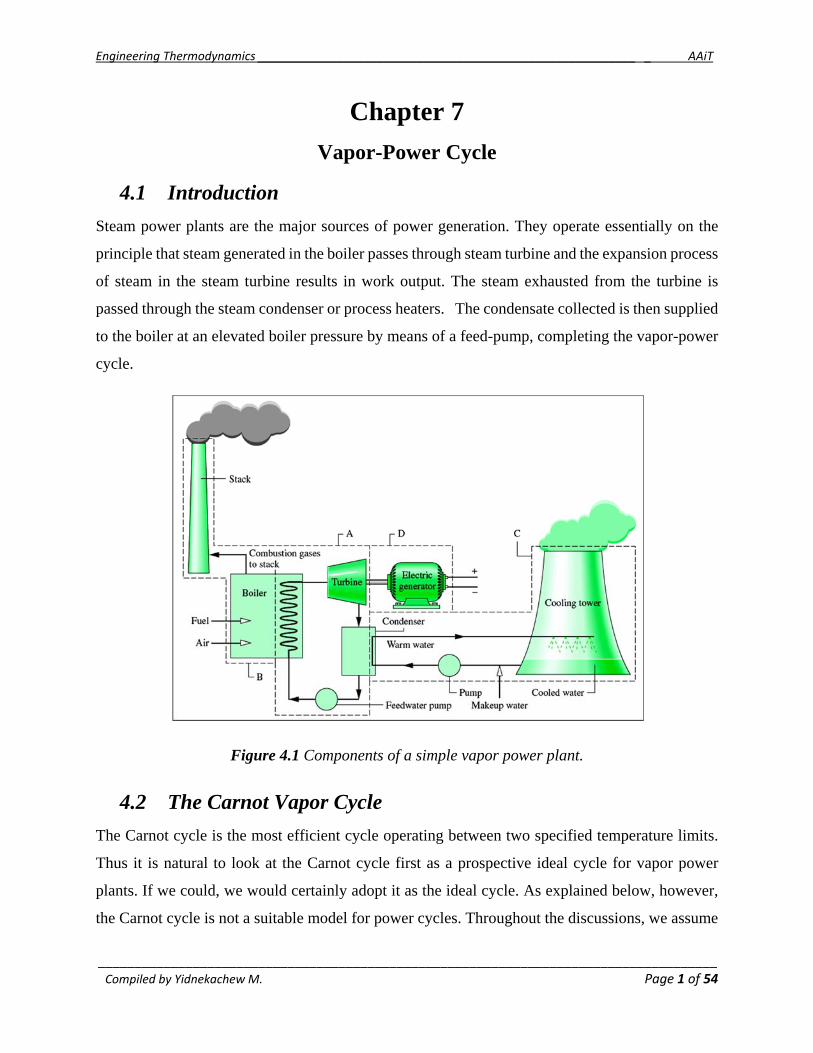
Steam power plants are the major sources of power generation. They operate essentially on the
principle that steam generated in the boiler passes through steam turbine and the expansion process
of steam in the steam turbine results in work output. The steam exhausted from the turbine is
passed through the steam condenser or process heaters. The condensate collected is then supplied
to the boiler at an elevated boiler pressure by means of a feed-pump, completing the vapor-power
cycle.
Figure 4.1 Components of a simple vapor power plant.
4.2 The Carnot Vapor Cycle
The Carnot cycle is the most efficient cycle operating between two specified temperature limits.
Thus it is natural to look at the Carnot cycle first as a prospective ideal cycle for vapor power
plants. If we could, we would certainly adopt it as the ideal cycle. As explained below, however,
the Carnot cycle is not a suitable model for power cycles. Throughout the discussions, we assume

Engineering Thermodynamics _________________________________________________________ _ AAiT
_____________________________________________________________________________________Compiled by Yidnekachew M. Page 2 of 54
steam to be the working fluid since it is the working fluid predominantly used in vapor power
cycles.
Consider a steady-flow Carnot cycle executed within the saturation dome of a pure substance, as
shown in Fig. 4.2 Heat is supplied to the working fluid at constant temperature in a boiler (process
1-2), the fluid expanded isentropically in a turbine (process 2-3), then condensed at constant
temperature in the condenser (process 3-4), and compressed isentropically by a compressor to the
initial state (process 4-1).
Figure 4.2 T-s diagram of Carnot vapor cycle.
The thermal efficiency of the Carnot cycle, Carnot , which is the highest for any cycle operating
between the source temperature T1, and the sink temperature T3 is given by:
3
1
1Carnot
T
T
(4.1)
Limitations of Carnot Cycle
Though Carnot cycle is simple (thermodynamically) and has the highest thermal efficiency for
given values of T1 and T2, yet it is extremely difficult to operate in practice because of the following
reasons:
Limiting the heat transfer processes to two-phase systems, however, severely limits the
maximum temperature that can be used in the cycle (it has to remain under the critical-

Engineering Thermodynamics _________________________________________________________ _ AAiT
_____________________________________________________________________________________Compiled by Yidnekachew M. Page 3 of 54
point value, which is 374°C for water). Limiting the maximum temperature in the cycle
also limits the thermal efficiency. Any attempt to raise the maximum temperature in the
cycle involves heat transfer to the working fluid in a single phase, which is not easy to
accomplish isothermally.
The isentropic expansion process (process 2-3) can be approximated closely by a well-
designed turbine. However, the quality of the steam decreases during this process, as shown
on the T-s diagram in Fig. 4.2. Thus the turbine has to handle steam with low quality, that
is, steam with a high moisture content. The impingement of liquid droplets on the turbine
blades causes erosion and is a major source of wear. Thus steam with qualities less than
about 90 percent cannot be tolerated in the operation of power plants.
The isentropic compression process (process 4-1) involves the compression of a liquid–
vapor mixture to a saturated liquid. There are two difficulties associated with this process.
First, it is not easy to control the condensation process so precisely as to end up with the
desired quality at state 4. Second, it is not practical to design a compressor that handles two
phases.
The cycle is still more difficult to operate in practice with superheated steam due to the
necessity of supplying the superheat at constant temperature instead of constant pressure.
Therefore, the Carnot cycle cannot be realized in practice, but sets the upper limit to which the
cycle efficiency of any thermal plan can be raised
4.3 Rankine Cycle
Many of the impracticalities associated with the Carnot cycle can be eliminated by superheating
the steam in the boiler and condensing it completely in the condenser, as shown schematically on
a T-s diagram in Figure 4.3. The cycle that results is the Rankine cycle, which is the ideal cycle
for vapor power plants. The ideal Rankine cycle does not involve any internal irreversibilities and
consists of the following four processes:
1-2 Isentropic compression in a pump
2-3 Constant pressure heat addition in a boiler
3-4 Isentropic expansion in a turbine
4-1 Constant pressure heat rejection in a condenser

Engineering Thermodynamics _________________________________________________________ _ AAiT
_____________________________________________________________________________________Compiled by Yidnekachew M. Page 4 of 54
Figure 4.3 The simple ideal Rankine cycle
Water enters the pump at state 1 as saturated liquid and is compressed isentropically to the
operating pressure of the boiler. The water temperature increases somewhat during this isentropic
compression process due to a slight decrease in the specific volume of water. The vertical distance
between states 1 and 2 on the T-s diagram is greatly exaggerated for clarity.
Water enters the boiler as a compressed liquid at state 2 and leaves as a superheated vapor at state
3. The boiler is basically a large heat exchanger where the heat originating from combustion gases,
nuclear reactors, or other sources is transferred to the water essentially at constant pressure. The
boiler, together with the section where the steam is superheated (the superheater), is often called
the steam generator.
The superheated vapor at state 3 enters the turbine, where it expands isentropically and produces
work by rotating the shaft connected to an electric generator. The pressure and the temperature of
steam drop during this process to the values at state 4, where steam enters the condenser. At this
state, steam is usually a saturated liquid–vapor mixture with a high quality.
Steam is condensed at constant pressure in the condenser, which is basically a large heat
exchanger, by rejecting heat to a cooling medium such as a lake, a river, or the atmosphere. Steam
leaves the condenser as saturated liquid and enters the pump, completing the cycle. In areas where
water is precious, the power plants are cooled by air instead of water. This method of cooling,
which is also used in car engines, is called dry cooling.

Engineering Thermodynamics _________________________________________________________ _ AAiT
_____________________________________________________________________________________Compiled by Yidnekachew M. Page 5 of 54
Remembering that the area under the process curve on a T-s diagram represents the heat transfer
for internally reversible processes, we see that the area under process curve 2-3 represents the heat
transferred to the water in the boiler and the area under the process curve 4-1 represents the heat
rejected in the condenser. The difference between these two (the area enclosed by the cycle curve)
is the net work produced during the cycle.
Energy Analysis of the Ideal Rankine Cycle
All four components associated with the Rankine cycle (the pump, boiler, turbine, and condenser)
are steady-flow devices, and thus all four processes that make up the Rankine cycle can be
analyzed as steady-flow processes. The kinetic and potential energy changes of the steam are
usually small relative to the work and heat transfer terms and are therefore usually neglected. Then
the steady-flow energy equation per unit mass of steam reduces to
( ) ( )in out in out e iq q w w h h ( / )kJ kg (4.2)
The boiler and the condenser do not involve any work, and the pump and the turbine are assumed
to be isentropic. Then the conservation of energy relation for each device can be expressed as
follows:
Pump (q= 0) , 2 1pump inw h h Or , 2 1pump inw v P P
(4.3)
Where 11 @f Ph h and
11 @f Pv v v
Boiler (w= 0) 3 2inq h h (4.4)
Turbine (q= 0) , 3 4turb outw h h
(4.5)
Condenser (w= 0) 4 1outq h h (4.6)
The thermal efficiency of the Rankine cycle is determined from
1net outth
in in
w q
q q
(4.7)
Where , ,net in out turb out pump inw q q w w
(4.8)

Engineering Thermodynamics _________________________________________________________ _ AAiT
_____________________________________________________________________________________Compiled by Yidnekachew M. Page 6 of 54
Deviation of Actual Vapor Power Cycles from Idealized Ones
The actual vapor power cycle differs from the ideal Rankine cycle, as illustrated in Figure 4.4, as
a result of irreversibilities in various components. Fluid friction and heat loss to the surroundings
are the two common sources of irreversibilities.
Figure 4.4 (a) Deviation of actual vapor power cycle from the ideal Rankine cycle. (b) The effect
of pump and turbine irreversibilities on the ideal Rankine cycle.
Fluid friction causes pressure drops in the boiler, the condenser, and the piping between various
components. As a result, steam leaves the boiler at a somewhat lower pressure. Also, the pressure
at the turbine inlet is somewhat lower than that at the boiler exit due to the pressure drop in the
connecting pipes. The pressure drop in the condenser is usually very small. To compensate for
these pressure drops, the water must be pumped to a sufficiently higher pressure than the ideal
cycle calls for. This requires a larger pump and larger work input to the pump.
The other major source of irreversibility is the heat loss from the steam to the surroundings as the
steam flows through various components. To maintain the same level of net work output, more
heat needs to be transferred to the steam in the boiler to compensate for these undesired heat losses.
As a result, cycle efficiency decreases.

Engineering Thermodynamics _________________________________________________________ _ AAiT
_____________________________________________________________________________________Compiled by Yidnekachew M. Page 7 of 54
Of particular importance are the irreversibilities occurring within the pump and the turbine. A
pump requires a greater work input, and a turbine produces a smaller work output as a result of
irreversibilities. Under ideal conditions, the flow through these devices is isentropic. The deviation
of actual pumps and turbines from the isentropic ones can be accounted for by utilizing isentropic
efficiencies, defined as
2 1
2 1
s sP
a a
w h h
w h h
(4.9)
And
3 4
3 4
a aT
s s
w h h
w h h
(4.10)
where states 2a and 4a are the actual exit states of the pump and the turbine, respectively, and 2s
and 4s are the corresponding states for the isentropic case (Figure 4.4 b).
Other factors also need to be considered in the analysis of actual vapor power cycles. In actual
condensers, for example, the liquid is usually subcooled to prevent the onset of cavitation, the
rapid vaporization and condensation of the fluid at the low-pressure side of the pump impeller,
which may damage it. Additional losses occur at the bearings between the moving parts as a result
of friction. Steam that leaks out during the cycle and air that leaks into the condenser represent two
other sources of loss. Finally, the power consumed by the auxiliary equipment such as fans that
supply air to the furnace should also be considered in evaluating the overall performance of power
plants.
The effect of irreversibilities on the thermal efficiency of a steam power cycle is illustrated below
with an example.
4.4 Increase the Efficiency of the Rankine Cycle
Steam power plants are responsible for the production of most electric power in the world, and
even small increases in thermal efficiency can mean large savings from the fuel requirements.
Therefore, every effort is made to improve the efficiency of the cycle on which steam power plants
operate.
The basic idea behind all the modifications to increase the thermal efficiency of a power cycle is
the same: Increase the average temperature at which heat is transferred to the working fluid in the

Engineering Thermodynamics _________________________________________________________ _ AAiT
_____________________________________________________________________________________Compiled by Yidnekachew M. Page 8 of 54
boiler, or decrease the average temperature at which heat is rejected from the working fluid in the
condenser. That is, the average fluid temperature should be as high as possible during heat addition
and as low as possible during heat rejection. Next we discuss three ways of accomplishing this for
the simple ideal Rankine cycle.
Lowering the Condenser Pressure (Lowers Tlow,avg)
Steam exists as a saturated mixture in the condenser at the saturation temperature corresponding
to the pressure inside the condenser. Therefore, lowering the operating pressure of the condenser
automatically lowers the temperature of the steam, and thus the temperature at which heat is
rejected.
The effect of lowering the condenser pressure on the Rankine cycle efficiency is illustrated on a
T-s diagram in Figure (4.6). For comparison purposes, the turbine inlet state is maintained the
same. The colored area on this diagram represents the increase in net work output as a result of
lowering the condenser pressure from P4 to P’4. The heat input requirements also increase
(represented by the area under curve 2’-2), but this increase is very small. Thus the overall effect
of lowering the condenser pressure is an increase in the thermal efficiency of the cycle.
Figure 4.6 The effect of lowering the condenser pressure on the ideal Rankine cycle.
To take advantage of the increased efficiencies at low pressures, the condensers of steam power
plants usually operate well below the atmospheric pressure. This does not present a major problem
since the vapor power cycles operate in a closed loop. However, there is a lower limit on the
condenser pressure that can be used. It cannot be lower than the saturation pressure corresponding
Engineering Thermodynamics _________________________________________________________ _ AAiT
_____________________________________________________________________________________Compiled by Yidnekachew M. Page 9 of 54
to the temperature of the cooling medium. Consider, for example, a condenser that is to be cooled
by a nearby river at 15°C. Allowing a temperature difference of 10°C for effective heat transfer,
the steam temperature in the condenser must be above 25°C; thus the condenser pressure must be
above 3.2 kPa, which is the saturation pressure at 25°C.
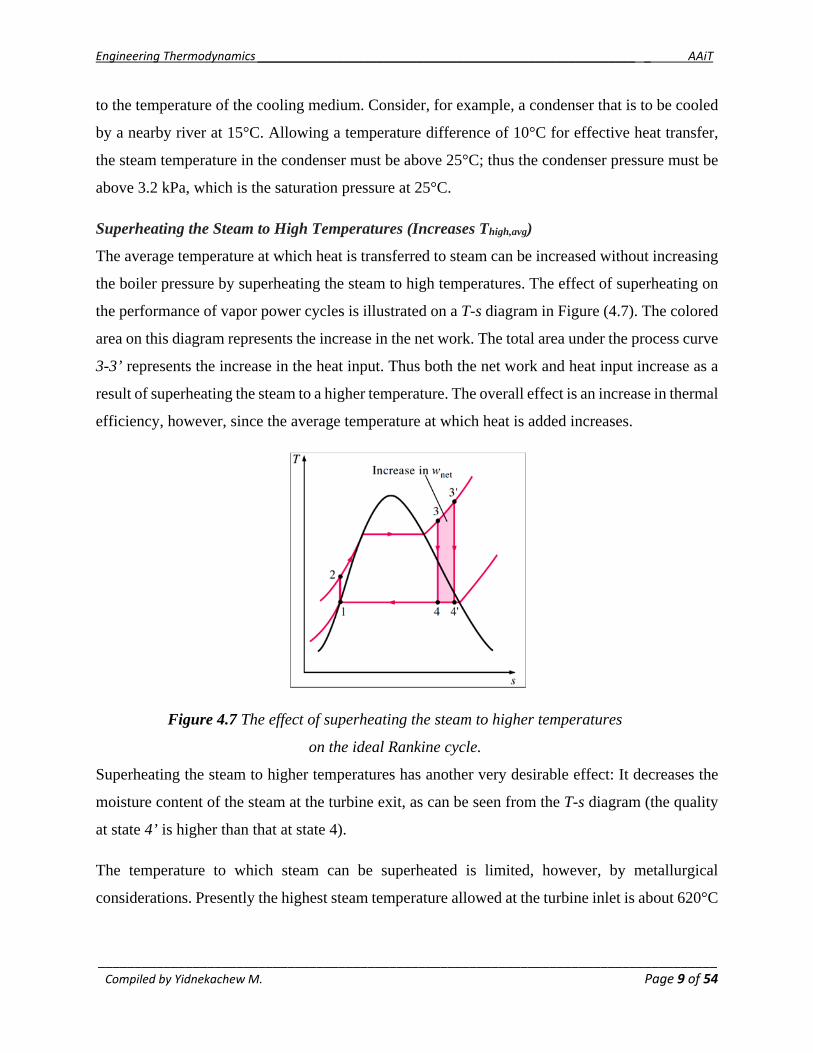
Superheating the Steam to High Temperatures (Increases Thigh,avg)
The average temperature at which heat is transferred to steam can be increased without increasing
the boiler pressure by superheating the steam to high temperatures. The effect of superheating on
the performance of vapor power cycles is illustrated on a T-s diagram in Figure (4.7). The colored
area on this diagram represents the increase in the net work. The total area under the process curve
3-3’ represents the increase in the heat input. Thus both the net work and heat input increase as a
result of superheating the steam to a higher temperature. The overall effect is an increase in thermal
efficiency, however, since the average temperature at which heat is added increases.
Figure 4.7 The effect of superheating the steam to higher temperatures
on the ideal Rankine cycle.
Superheating the steam to higher temperatures has another very desirable effect: It decreases the
moisture content of the steam at the turbine exit, as can be seen from the T-s diagram (the quality
at state 4’ is higher than that at state 4).
The temperature to which steam can be superheated is limited, however, by metallurgical
considerations. Presently the highest steam temperature allowed at the turbine inlet is about 620°C

Engineering Thermodynamics _________________________________________________________ _ AAiT
_____________________________________________________________________________________Compiled by Yidnekachew M. Page 10 of 54
(1150°F). Any increase in this value depends on improving the present materials or finding new
ones that can withstand higher temperatures. Ceramics are very promising in this regard.
Increasing the Boiler Pressure (Increases Thigh,avg)
Another way of increasing the average temperature during the heat-addition process is to increase
the operating pressure of the boiler, which automatically raises the temperature at which boiling
takes place. This, in turn, raises the average temperature at which heat is transferred to the steam
and thus raises the thermal efficiency of the cycle.
The effect of increasing the boiler pressure on the performance of vapor power cycles is illustrated
on a T-s diagram in Figure (4.8). Notice that for a fixed turbine inlet temperature, the cycle shifts
to the left and the moisture content of steam at the turbine exit increases. This undesirable side
effect can be corrected, however, by reheating the steam, as discussed in the next section.
Figure 4.8 The effect of increasing the boiler pressure on the ideal Rankine cycle.
4.5 The Ideal Reheat Rankine Cycle
We noted in the last section that increasing the boiler pressure increases the thermal efficiency of
the Rankine cycle, but it also increases the moisture content of the steam to unacceptable levels.
There is two possibilities to overcome this problem:
Superheat the steam to very high temperatures before it enters the turbine. This would be
the desirable solution since the average temperature at which heat is added would also

Engineering Thermodynamics _________________________________________________________ _ AAiT
_____________________________________________________________________________________Compiled by Yidnekachew M. Page 11 of 54
increase, thus increasing the cycle efficiency. This is not a practicable solution, however,
since it requires raising the steam temperature to metallurgically unsafe levels.
Expand the steam in the turbine in two stages, and reheat it in between. In other words,
modify the simple ideal Rankine cycle with a reheat process. Reheating is a practical
solution to the excessive moisture problem in turbines, and it is commonly used in modern
steam power plants.
The T-s diagram of the ideal reheat Rankine cycle and the schematic of the power plant operating
on this cycle are shown in Figure (4.9).
Figure 4.9 The ideal reheat Rankine cycle.
The ideal reheat Rankine cycle differs from the simple ideal Rankine cycle in that the expansion
process takes place in two stages. In the first stage (the high-pressure turbine), steam is expanded
isentropically to an intermediate pressure and sent back to the boiler where it is reheated at constant
pressure, usually to the inlet temperature of the first turbine stage. Steam then expands
isentropically in the second stage (low-pressure turbine) to the condenser pressure. Thus the total
heat input and the total turbine work output for a reheat cycle become
3 2 5 4( ) ( )in primary reheatq q q h h h h (4.11)
and
, , , 3 4 5 6( ) ( )turb out turb I turb IIw w w h h h h (4.12)
The incorporation of the single reheat in a modern power plant improves the cycle efficiency by
4 to 5 percent by increasing the average temperature at which heat is transferred to the steam.

Engineering Thermodynamics _________________________________________________________ _ AAiT
_____________________________________________________________________________________Compiled by Yidnekachew M. Page 12 of 54
The average temperature during the reheat process can be increased by increasing the number of
expansion and reheat stages. As the number of stages is increased, the expansion and reheat
processes approach an isothermal process at the maximum temperature.
The use of more than two reheat stages, however, is not practical. The theoretical improvement in
efficiency from the second reheat is about half of that which results from a single reheat. If the
turbine inlet pressure is not high enough, double reheat would result in superheated exhaust. This
is undesirable as it would cause the average temperature for heat rejection to increase and thus the
cycle efficiency to decrease. Therefore, double reheat is used only on supercritical-pressure (P >
22.06 MPa) power plants. A third reheat stage would increase the cycle efficiency by about half
of the improvement attained by the second reheat. This gain is too small to justify the added cost
and complexity.
4.6 The Ideal Regenerative Rankine Cycle
Another commonly used method for increasing the thermal efficiency of vapor power plants is
regenerative feedwater heating, or simply regeneration.
A practical regeneration process in steam power plants is accomplished by extracting, or
“bleeding,” steam from the turbine at various points. This steam, which could have produced more
work by expanding further in the turbine, is used to heat the feedwater instead. The device where
the feedwater is heated by regeneration is called a regenerator, or a feedwater heater (FWH).
Open Feedwater Heaters
An open (or direct-contact) feedwater heater is basically a mixing chamber, where the steam
extracted from the turbine mixes with the feedwater exiting the pump. Ideally, the mixture leaves
the heater as a saturated liquid at the heater pressure. The schematic of a steam power plant with
one open feedwater heater (also called single-stage regenerative cycle) and the T-s diagram of the
cycle are shown in Figure 4.10.
In an ideal regenerative Rankine cycle, steam enters the turbine at the boiler pressure (state 5) and
expands isentropically to an intermediate pressure (state 6). Some steam is extracted at this state
and routed to the feedwater heater, while the remaining steam continues to expand isentropically
to the condenser pressure (state 7). This steam leaves the condenser as a saturated liquid at the

Engineering Thermodynamics _________________________________________________________ _ AAiT
_____________________________________________________________________________________Compiled by Yidnekachew M. Page 13 of 54
condenser pressure (state 1). The condensed water, which is also called the feedwater, then enters
an isentropic pump, where it is compressed to the feedwater heater pressure (state 2) and is routed
to the feedwater heater, where it mixes with the steam extracted from the turbine. The fraction of
the steam extracted is such that the mixture leaves the heater as a saturated liquid at the heater
pressure (state 3). A second pump raises the pressure of the water to the boiler pressure (state 4).
The cycle is completed by heating the water in the boiler to the turbine inlet state (state 5).
Figure 4.10 The ideal regenerative Rankine cycle with an open feedwater heater.
In the analysis of steam power plants, it is more convenient to work with quantities expressed per
unit mass of the steam flowing through the boiler. For each 1 kg of steam leaving the boiler, y kg
expands partially in the turbine and is extracted at state 6. The remaining (1- y) kg expands
completely to the condenser pressure. Therefore, the mass flow rates are different in different
components. If the mass flow rate through the boiler is , for example, it is 1 through the
condenser. This aspect of the regenerative Rankine cycle should be considered in the analysis of
the cycle as well as in the interpretation of the areas on the T-s diagram.
5 4inq h h (4.13)
7 1(1 )( )outq y h h (4.14)
, 5 6 6 7( ) (1 )( )turb outw h h y h h (4.15)
, , ,(1 )pump in pumpI in pumpII inw y w w (4.16)

Engineering Thermodynamics _________________________________________________________ _ AAiT
_____________________________________________________________________________________Compiled by Yidnekachew M. Page 14 of 54
Where 6 5/y m m (fraction of steam extracted)
, 1 2 1( )pumpI inw v P P (4.17)
, 3 4 3( )pumpII inw v P P (4.18)
The thermal efficiency of the Rankine cycle increases as a result of regeneration. This is because
regeneration raises the average temperature at which heat is transferred to the steam in the boiler
by raising the temperature of the water before it enters the boiler. The cycle efficiency increases
further as the number of feedwater heaters is increased. Many large plants in operation today use
as many as eight feedwater heaters. The optimum number of feedwater heaters is determined from
economical considerations. The use of an additional feedwater heater cannot be justified unless it
saves more from the fuel costs than its own cost.
Closed Feedwater Heaters
Regenerative feedwater heating also can be accomplished with closed feedwater heaters. Closed
heaters are shell-and-tube-type recuperators in which the feedwater temperature increases as the
extracted steam condenses on the outside of the tubes carrying the feedwater. Since the two streams
do not mix, they can be at different pressures.
Figure 4.11 Examples of closed feedwater heaters.
The schematic of a steam power plant with one closed feedwater heater and the T-s diagram of the
cycle are shown in Figure (4.12). In an ideal closed feedwater heater, the feedwater is heated to
the exit temperature of the extracted steam, which ideally leaves the heater as a saturated liquid at
the extraction pressure. In actual power plants, the feedwater leaves the heater below the exit

Engineering Thermodynamics _________________________________________________________ _ AAiT
_____________________________________________________________________________________Compiled by Yidnekachew M. Page 15 of 54
temperature of the extracted steam because a temperature difference of at least a few degrees is
required for any effective heat transfer to take place.
Figure 4.12 The ideal regenerative Rankine cycle with a closed feedwater heater.
The condensed steam is then either pumped to the feedwater line or routed to another heater or to
the condenser through a device called a trap. A trap allows the liquid to be throttled to a lower
pressure region but traps the vapor. The enthalpy of steam remains constant during this throttling
process.
The open and closed feedwater heaters can be compared as follows. Open feedwater heaters are
simple and inexpensive and have good heat transfer characteristics. They also bring the feedwater
to the saturation state. For each heater, however, a pump is required to handle the feedwater. The
closed feedwater heaters are more complex because of the internal tubing network, and thus they
are more expensive. Heat transfer in closed feedwater heaters is also less effective since the two
streams are not allowed to be in direct contact. However, closed feedwater heaters do not require
a separate pump for each heater since the extracted steam and the feedwater can be at different
pressures. Most steam power plants use a combination of open and closed feedwater heaters, as
shown in Figure (4.13).

Engineering Thermodynamics _________________________________________________________ _ AAiT
_____________________________________________________________________________________Compiled by Yidnekachew M. Page 16 of 54
Figure 4.13 A steam power plant with one open and three closed feedwater heaters.
4.7 Cogeneration
Cogeneration is the production of more than one useful form of energy (such as process heat and
electric power) from the same energy source.
4.8 Combined Gas–vapor Power Cycles

Engineering Thermodynamics _________________________________________________________ _ AAiT
_____________________________________________________________________________________Compiled by Yidnekachew M. Page 17 of 54
Engineering Thermodynamics _________________________________________________________ _ AAiT
_____________________________________________________________________________________Compiled by Yidnekachew M. Page 18 of 54
Refrigeration cycles
6.1 Introduction
We all know from experience that heat flows in the direction of decreasing temperature, that is,
from high-temperature regions to low-temperature ones. This heat-transfer process occurs in
nature without requiring any devices. The reverse process, however, cannot occur by itself. The
transfer of heat from a low-temperature region to a high-temperature one requires special devices
called refrigerators. Refrigerators are cyclic devices, and the working fluids used in the
refrigeration cycles are called refrigerants.
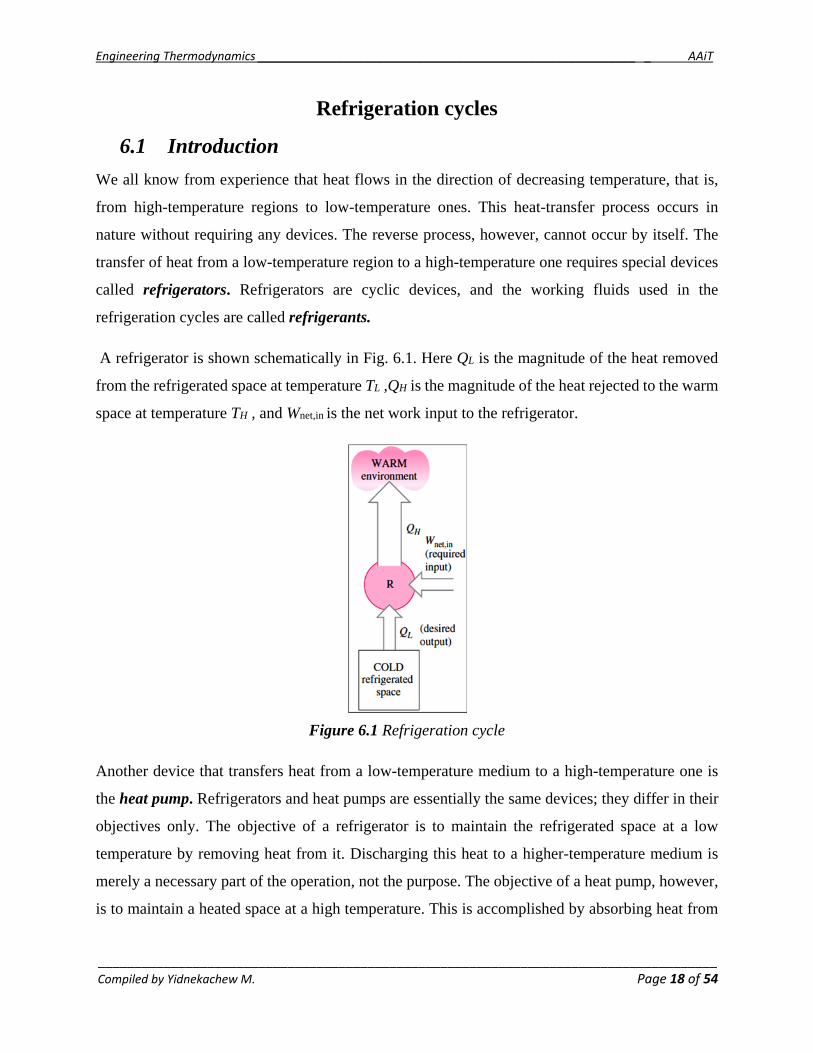
A refrigerator is shown schematically in Fig. 6.1. Here QL is the magnitude of the heat removed
from the refrigerated space at temperature TL ,QH is the magnitude of the heat rejected to the warm
space at temperature TH , and Wnet,in is the net work input to the refrigerator.
Figure 6.1 Refrigeration cycle
Another device that transfers heat from a low-temperature medium to a high-temperature one is
the heat pump. Refrigerators and heat pumps are essentially the same devices; they differ in their
objectives only. The objective of a refrigerator is to maintain the refrigerated space at a low
temperature by removing heat from it. Discharging this heat to a higher-temperature medium is
merely a necessary part of the operation, not the purpose. The objective of a heat pump, however,
is to maintain a heated space at a high temperature. This is accomplished by absorbing heat from

Engineering Thermodynamics _________________________________________________________ _ AAiT
_____________________________________________________________________________________Compiled by Yidnekachew M. Page 19 of 54
a low-temperature source, such as well water or cold outside air in winter, and supplying this heat
to a warmer medium such as a house (Fig. 6.2).
Figure 6.2 Heat pump cycle
The performance of refrigerators and heat pumps is expressed in terms of the coefficient of
performance (COP), defined as
LR
net,in
QDesired output Cooling effectCOP = = =
Required input work input W
(6.1)
HHP
net,in
QDesired output Heating effectCOP = = =
Required input work input W
(6.2)
These relations can also be expressed in the rate form by replacing the quantities QL, QH, and Wnet,in
by L, H, and net,in, respectively. Notice that both COPR and COPHP can be greater than 1. A
comparison of Eqs. 6.1 and 6.2 reveals that
1HP RCOP COP
(6.3)
The cooling capacity of a refrigeration system, that is, the rate of heat removal from the refrigerated
space, is often expressed in terms of tons of refrigeration. The capacity of a refrigeration system
that can freeze 1 ton of liquid water at 0°C (32°F) into ice at 0°C in 24 h is said to be 1 ton. One
ton of refrigeration is equivalent to 211 kJ/min. The cooling load of a typical 200 m2 residence is
in the 3-ton (10-kW) range.

Engineering Thermodynamics _________________________________________________________ _ AAiT
_____________________________________________________________________________________Compiled by Yidnekachew M. Page 20 of 54
6.2 The Ideal Vapor-Compression Refrigeration Cycle
The vapor-compression refrigeration cycle is the most widely used cycle for refrigerators, air-
conditioning systems, and heat pumps. It consists of four processes:
1-2 Isentropic compression in a compressor
2-3 Constant-pressure heat rejection in a condenser
3-4 Throttling in an expansion device
4-1 Constant-pressure heat absorption in an evaporator
In an ideal vapor-compression refrigeration cycle, the refrigerant enters the compressor at state 1
as saturated vapor and is compressed isentropically to the condenser pressure. The temperature of
the refrigerant increases during this isentropic compression process to well above the temperature
of the surrounding medium. The refrigerant then enters the condenser as superheated vapor at state
2 and leaves as saturated liquid at state 3 as a result of heat rejection to the surroundings. The
temperature of the refrigerant at this state is still above the temperature of the surroundings.
Figure 6.3 Schematic and T-s diagram for the ideal vapor-compression refrigeration cycle.
The saturated liquid refrigerant at state 3 is throttled to the evaporator pressure by passing it
through an expansion valve or capillary tube. The temperature of the refrigerant drops below the
temperature of the refrigerated space during this process. The refrigerant enters the evaporator at
state 4 as a low-quality saturated mixture, and it completely evaporates by absorbing heat from the

Engineering Thermodynamics _________________________________________________________ _ AAiT
_____________________________________________________________________________________Compiled by Yidnekachew M. Page 21 of 54
refrigerated space. The refrigerant leaves the evaporator as saturated vapor and reenters the
compressor, completing the cycle.
In a household refrigerator, the tubes in the freezer compartment where heat is absorbed by the
refrigerant serves as the evaporator. The coils behind the refrigerator, where heat is dissipated to
the kitchen air, serve as the condenser (Fig. 6.4).
Figure 6.4 An ordinary household refrigerator.
Remember that the area under the process curve on a T-s diagram represents the heat transfer for
internally reversible processes. The area under the process curve 4-1 represents the heat absorbed
by the refrigerant in the evaporator, and the area under the process curve 2-3 represents the heat
rejected in the condenser. A rule of thumb is that the COP improves by 2 to 4 percent for each °C
the evaporating temperature is raised or the condensing temperature is lowered.
Compression Process 1-2:
Isentropic compression process of the saturated water from state point l to state point 2 results in
rise of pressure from P1 to P2. The work of compression is
2 1cw h h (6.4)
Condensation Process 2 - 3:

Engineering Thermodynamics _________________________________________________________ _ AAiT
_____________________________________________________________________________________Compiled by Yidnekachew M. Page 22 of 54
Superheated vapor at state 2 is cooled at constant pressure P2 in the condenser until saturated liquid
at state 3 is obtained. The heat removed from the refrigerant is:
2 3 3 2q h h (6.5)
Throttling Process 3-4:
Throttling, which is irreversible process, proceeds along the isenthalpic 3-4. The irreversible
constant enthalpy process is represented as a dotted line and for an adiabatic expansion process:
3 4h h (6.6)
Evaporating Process 4 - 1:
The evaporation process is assumed to be a constant pressure process. To make complete use of
the latent heat of the refrigerant, evaporation is continued until the vapor is saturated at state point
1. The refrigeration effect is given by:
4 1 1 4q h h (6.7)
Another diagram frequently used in the analysis of vapor-compression refrigeration cycles is the
P-h diagram, as shown in Fig. 6.5. On this diagram, three of the four processes appear as straight
lines, and the heat transfer in the condenser and the evaporator is proportional to the lengths of the
corresponding process curves.
All four components associated with the vapor-compression refrigeration cycle are steady-flow
devices, and thus all four processes that make up the cycle can be analyzed as steady-flow
processes. The kinetic and potential energy changes of the refrigerant are usually small relative to
the work and heat transfer terms, and therefore they can be neglected. Then the steady-flow energy
equation on a unit–mass basis reduces to
( ) ( )in out in out e iq q w w h h (6.8)

Engineering Thermodynamics _________________________________________________________ _ AAiT
_____________________________________________________________________________________Compiled by Yidnekachew M. Page 23 of 54
Figure 6.5 The P-h diagram of an ideal vapor-compression refrigeration cycle.
The condenser and the evaporator do not involve any work, and the compressor can be
approximated as adiabatic. Then the COPs of refrigerators and heat pumps operating on the vapor-
compression refrigeration cycle can be expressed as
1 4
, 2 1
LR
net in
q h hCOP
W h h
(6.9)
and
2 3
, 2 1
HHP
net in
h hqCOP
W h h
(6.10)
Where h1=hg@P1 and h3=hf@P3 for the ideal case.
6.3 Actual Vapor-Compression Refrigeration Cycle
An actual vapor-compression refrigeration cycle differs from the ideal one in several ways, owing
mostly to the irreversibilities that occur in various components. Two common sources of
irreversibilities are fluid friction (causes pressure drops) and heat transfer to or from the
surroundings. The T-s diagram of an actual vapor-compression refrigeration cycle is shown in Fig.
6.6.
In the ideal cycle, the refrigerant leaves the evaporator and enters the compressor as saturated
vapor. In practice, however, it may not be possible to control the state of the refrigerant so
precisely. Instead, it is easier to design the system so that the refrigerant is slightly superheated at
the compressor inlet. This slight overdesign ensures that the refrigerant is completely vaporized

Engineering Thermodynamics _________________________________________________________ _ AAiT
_____________________________________________________________________________________Compiled by Yidnekachew M. Page 24 of 54
when it enters the compressor. Also, the line connecting the evaporator to the compressor is usually
very long; thus the pressure drop caused by fluid friction and heat transfer from the surroundings
to the refrigerant can be very significant. The result of superheating, heat gain in the connecting
line, and pressure drops in the evaporator and the connecting line is an increase in the specific
volume, thus an increase in the power input requirements to the compressor since steady-flow
work is proportional to the specific volume.
Figure 6.6 Schematic and T-s diagram for the actual vapor-compression refrigeration cycle.
The compression process in the ideal cycle is internally reversible and adiabatic, and thus
isentropic. The actual compression process, however, involves frictional effects, which increase
the entropy, and heat transfer, which may increase or decrease the entropy, depending on the
direction. Therefore, the entropy of the refrigerant may increase (process 1-2) or decrease (process
1-2) during an actual compression process, depending on which effects dominate. The
compression process 1-2_ may be even more desirable than the isentropic compression process
since the specific volume of the refrigerant and thus the work input requirement are smaller in this
case. Therefore, the refrigerant should be cooled during the compression process whenever it is
practical and economical to do so.
In the ideal case, the refrigerant is assumed to leave the condenser as saturated liquid at the
compressor exit pressure. In reality, however, it is unavoidable to have some pressure drop in the
condenser as well as in the lines connecting the condenser to the compressor and to the throttling
valve. Also, it is not easy to execute the condensation process with such precision that the
refrigerant is a saturated liquid at the end, and it is undesirable to route the refrigerant to the

Engineering Thermodynamics _________________________________________________________ _ AAiT
_____________________________________________________________________________________Compiled by Yidnekachew M. Page 25 of 54
throttling valve before the refrigerant is completely condensed. Therefore, the refrigerant is
subcooled somewhat before it enters the throttling valve. We do not mind this at all, however,
since the refrigerant in this case enters the evaporator with a lower enthalpy and thus can absorb
more heat from the refrigerated space. The throttling valve and the evaporator are usually located
very close to each other, so the pressure drop in the connecting line is small.
6.4 Innovative Vapor-Compression Refrigeration Systems
The simple vapor-compression refrigeration cycle discussed above is the most widely used
refrigeration cycle, and it is adequate for most refrigeration applications. The ordinary vapor-
compression refrigeration systems are simple, inexpensive, reliable, and practically maintenance-
free (when was the last time you serviced your household refrigerator?). However, for large
industrial applications efficiency, not simplicity, is the major concern. Also, for some applications
the simple vapor-compression refrigeration cycle is inadequate and needs to be modified. We now
discuss a few such modifications and refinements.
6.4.1 Effect of Sub-cooling the Refrigerant
A simple vapor-compression refrigeration cycle with sub-cooling shown in Fig. 6.4 When the
liquid refrigerant is sub-cooled from 3' -3, the expansion process takes place along 3 - 4 instead of
3' - 4'. The refrigeration effect increases from (h1 - h4’), to (h1 - h4) by sub-cooling, the extra
refrigeration effect being (h4’- h4). The work of co compression is considered the same for both
the simple saturated cycle as well as the sub-cooled cycle. As no extra work is required by the
compressor, the net effect of sub-cooling the refrigerant is to increase the COP of the refrigerator.
Figure 6.7 Sub-cooling the Refrigerant
Engineering Thermodynamics _________________________________________________________ _ AAiT
_____________________________________________________________________________________Compiled by Yidnekachew M. Page 26 of 54
Sub-cooling, that is increasing the refrigeration effect of the system, reduces the mass flow rate of
the refrigerant for a system having the same capacity as the simple vapor- compression
refrigeration system.
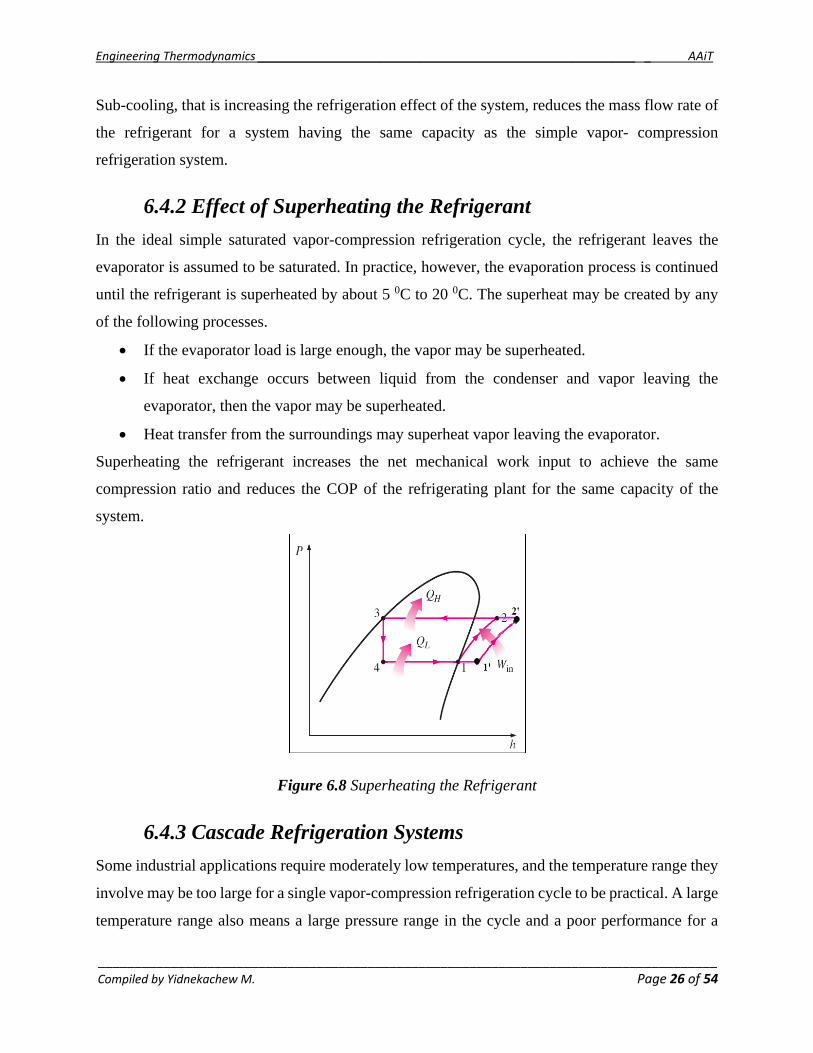
6.4.2 Effect of Superheating the Refrigerant
In the ideal simple saturated vapor-compression refrigeration cycle, the refrigerant leaves the
evaporator is assumed to be saturated. In practice, however, the evaporation process is continued
until the refrigerant is superheated by about 5 0C to 20 0C. The superheat may be created by any
of the following processes.
If the evaporator load is large enough, the vapor may be superheated.
If heat exchange occurs between liquid from the condenser and vapor leaving the
evaporator, then the vapor may be superheated.
Heat transfer from the surroundings may superheat vapor leaving the evaporator.
Superheating the refrigerant increases the net mechanical work input to achieve the same
compression ratio and reduces the COP of the refrigerating plant for the same capacity of the
system.
Figure 6.8 Superheating the Refrigerant
6.4.3 Cascade Refrigeration Systems
Some industrial applications require moderately low temperatures, and the temperature range they
involve may be too large for a single vapor-compression refrigeration cycle to be practical. A large
temperature range also means a large pressure range in the cycle and a poor performance for a
Engineering Thermodynamics _________________________________________________________ _ AAiT
_____________________________________________________________________________________Compiled by Yidnekachew M. Page 27 of 54
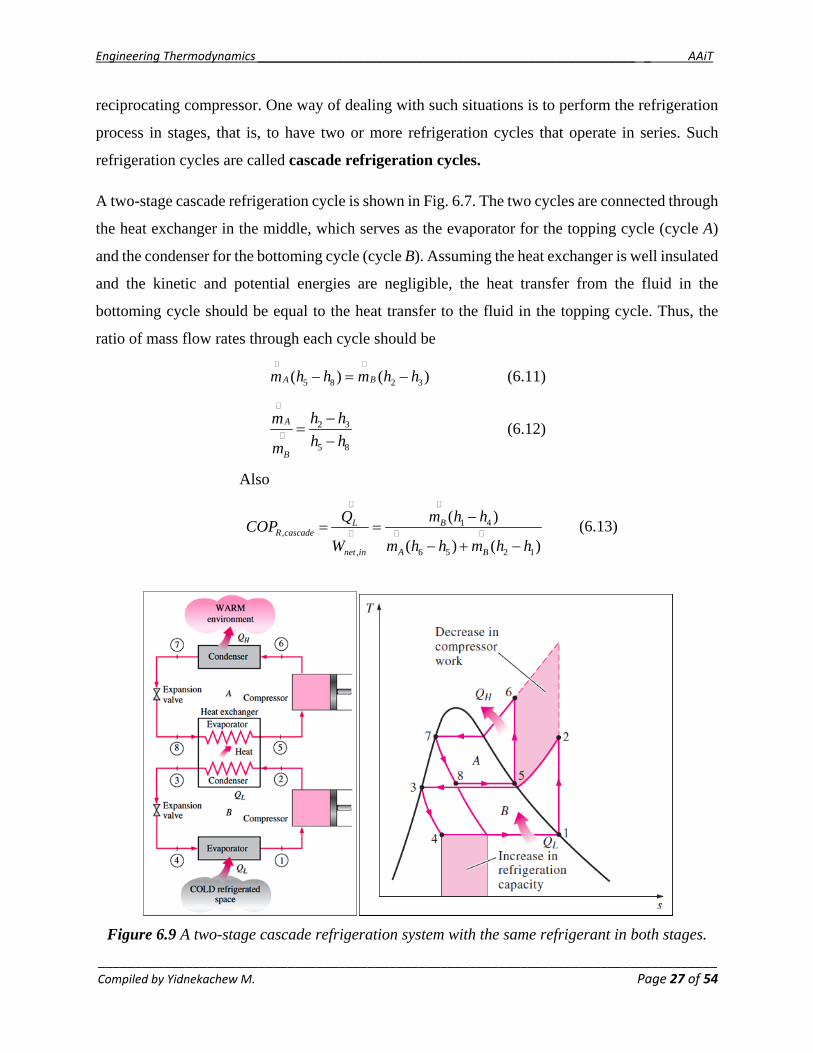
reciprocating compressor. One way of dealing with such situations is to perform the refrigeration
process in stages, that is, to have two or more refrigeration cycles that operate in series. Such
refrigeration cycles are called cascade refrigeration cycles.
A two-stage cascade refrigeration cycle is shown in Fig. 6.7. The two cycles are connected through
the heat exchanger in the middle, which serves as the evaporator for the topping cycle (cycle A)
and the condenser for the bottoming cycle (cycle B). Assuming the heat exchanger is well insulated
and the kinetic and potential energies are negligible, the heat transfer from the fluid in the
bottoming cycle should be equal to the heat transfer to the fluid in the topping cycle. Thus, the
ratio of mass flow rates through each cycle should be
5 8 2 3( ) ( )A Bm h h m h h (6.11)
2 3
5 8
A
B
h hm
h hm
(6.12)
Also
1 4,
, 6 5 2 1
( )
( ) ( )
L BR cascade
net in A B
Q m h hCOP
W m h h m h h
(6.13)
Figure 6.9 A two-stage cascade refrigeration system with the same refrigerant in both stages.

Engineering Thermodynamics _________________________________________________________ _ AAiT
_____________________________________________________________________________________Compiled by Yidnekachew M. Page 28 of 54
In the cascade system shown in the figure, the refrigerants in both cycles are assumed to be the
same. This is not necessary, however, since there is no mixing taking place in the heat exchanger.
Therefore, refrigerants with more desirable characteristics can be used in each cycle. In this case,
there would be a separate saturation dome for each fluid, and the T-s diagram for one of the cycles
would be different. Also, in actual cascade refrigeration systems, the two cycles would overlap
somewhat since a temperature difference between the two fluids is needed for any heat transfer to
take place.
It is evident from the T-s diagram in Fig. 6.7 that the compressor work decreases and the amount
of heat absorbed from the refrigerated space increases as a result of cascading. Therefore,
cascading improves the COP of a refrigeration system. Some refrigeration systems use three or
four stages of cascading.
6.4.4 Multistage Compression Refrigeration Systems
When the fluid used throughout the cascade refrigeration system is the same, the heat exchanger
between the stages can be replaced by a mixing chamber (called a flash chamber) since it has better
heat transfer characteristics. Such systems are called multistage compression refrigeration
systems. A two stage compression refrigeration system is shown in Fig. 6.8.
Figure 6.10 A two-stage compression refrigeration system with a flash chamber.
In this system, the liquid refrigerant expands in the first expansion valve to the flash chamber
pressure, which is the same as the compressor interstage pressure. Part of the liquid vaporizes

Engineering Thermodynamics _________________________________________________________ _ AAiT
_____________________________________________________________________________________Compiled by Yidnekachew M. Page 29 of 54
during this process. This saturated vapor (state 3) is mixed with the superheated vapor from the
low-pressure compressor (state 2), and the mixture enters the high-pressure compressor at state 9.
This is, in essence, a regeneration process. The saturated liquid (state 7) expands through the
second expansion valve into the evaporator, where it picks up heat from the refrigerated space.
The compression process in this system resembles a two-stage compression with intercooling, and
the compressor work decreases. Care should be exercised in the interpretations of the areas on the
T-s diagram in this case since the mass flow rates are different in different parts of the cycle.
6.4.5 Air Refrigeration cycle
Air refrigeration cycle is basically similar to the vapor-compression cycle, the exception being in
the expansion process. For air refrigeration cycles, the expansion process is provided by means of
a turbine which replaces the expansion valve of the - compression refrigeration cycles. When air
which is treated as an ideal gas expands through the turbine, its temperature is reduced.
In practice the air refrigeration cycle is commonly used for air conditioning aircraft in an open
cycle. The use of air refrigeration system has the following advantages.
Air is easily available and is cheap compared with other refrigerants
Air is non-flammable and no danger of fire
The mass of air refrigeration system per ton of refrigeration is low compared with the other
refrigeration system.
A simple air refrigeration plant arrangement is represented as schematic diagram and on a T-s
diagram in Fig. 6.11.
The COP of the air refrigerant cycle,
, , ,
L LR
net in comp in turb out
q qCOP
w w w
(6.14)
Where:-
1 4Lq h h (6.15)
, 3 4turb outw h h (6.16)
, 2 1comp inw h h (6.17)

Engineering Thermodynamics _________________________________________________________ _ AAiT
_____________________________________________________________________________________Compiled by Yidnekachew M. Page 30 of 54
Figure 6.11 Air Refrigeration cycle

Engineering Thermodynamics _________________________________________________________ _ AAiT
_____________________________________________________________________________________Compiled by Yidnekachew M. Page 31 of 54
Chapter 5
Air-Standard Power Cycle
6.5 Introduction
In this chapter engines that utilized gas as working fluid are introduced. In gas power cycles, the
working fluid remains a gas throughout the entire cycle. Spark-ignition engines, diesel engines,
and conventional gas turbines are familiar examples of devices that operate on gas cycles. In all
these engines, energy is provided by burning a fuel within the system boundaries. That is, they are
internal combustion engines. Because of this combustion process, the composition of the working
fluid changes from air and fuel to combustion products during the course of the cycle.
Even though internal combustion engines operate on a mechanical cycle (the piston returns to its
starting position at the end of each revolution), the working fluid does not undergo a complete
thermodynamic cycle. It is thrown out of the engine at some point in the cycle (as exhaust gases)
instead of being returned to the initial state. Working on an open cycle is the characteristic of all
internal combustion engines.
The actual gas power cycles are rather complex. To reduce the analysis to a manageable level, we
utilize the following approximations, commonly known as the air-standard assumptions:
The working fluid is air, which continuously circulates in a closed loop and always behaves as an ideal gas.
All the processes that make up the cycle are internally reversible.
The exhaust process is replaced by a heat-rejection process that restores the working fluid to its initial state.
The combustion process is replaced by a heat-addition process from an external source.
Figure 5.1 The combustion process is replaced by a heat-addition process in ideal
cycles.
Engineering Thermodynamics _________________________________________________________ _ AAiT
_____________________________________________________________________________________Compiled by Yidnekachew M. Page 32 of 54
Another assumption that is often utilized to simplify the analysis even more is that air has constant
specific heats whose values are determined at room temperature (25°C, or 77°F). When this
assumption is utilized, the air-standard assumptions are called the cold-air-standard assumptions.
A cycle for which the air-standard assumptions are applicable is frequently referred to as an air-
standard cycle. The air-standard assumptions previously stated provide considerable
simplification in the analysis without significantly deviating from the actual cycles. This simplified
model enables us to study qualitatively the influence of major parameters on the performance of
the actual engines.
6.6 An Overview of Reciprocating Engines
Despite its simplicity, the reciprocating engine (basically a piston–cylinder device) is one of the
rare inventions that has proved to be very versatile and to have a wide range of applications. It is
the powerhouse of the vast majority of automobiles, trucks, light aircraft, ships, and electric power
generators, as well as many other devices.
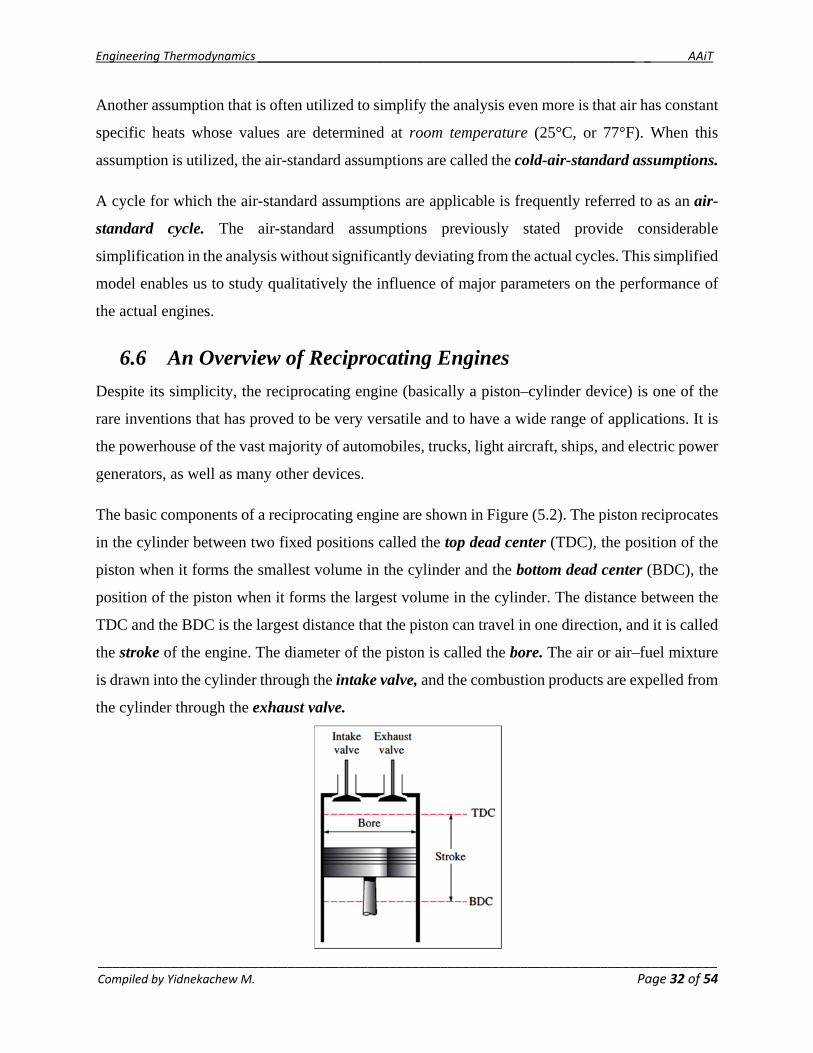
The basic components of a reciprocating engine are shown in Figure (5.2). The piston reciprocates
in the cylinder between two fixed positions called the top dead center (TDC), the position of the
piston when it forms the smallest volume in the cylinder and the bottom dead center (BDC), the
position of the piston when it forms the largest volume in the cylinder. The distance between the
TDC and the BDC is the largest distance that the piston can travel in one direction, and it is called
the stroke of the engine. The diameter of the piston is called the bore. The air or air–fuel mixture
is drawn into the cylinder through the intake valve, and the combustion products are expelled from
the cylinder through the exhaust valve.

Engineering Thermodynamics _________________________________________________________ _ AAiT
_____________________________________________________________________________________Compiled by Yidnekachew M. Page 33 of 54
Figure 5.2 Nomenclature for reciprocating engines. The minimum volume formed in the cylinder when the piston is at TDC is called the clearance
volume (Figure 5.3).
Figure 5.3 Displacement and clearance volumes of a reciprocating engine.
The volume displaced by the piston as it moves between TDC and BDC is called the displacement
volume. The ratio of the maximum volume formed in the cylinder to the minimum (clearance)
volume is called the compression ratio r of the engine.
max
min
BDC
TDC
V Vr
V V
(5.1)
Another term frequently used in conjunction with reciprocating engines is the mean effective
pressure (MEP). It is a fictitious pressure that, if it acted on the piston during the entire power
stroke, would produce the same amount of net work as that produced during the actual cycle
(Figure 5.4). That is,

Engineering Thermodynamics _________________________________________________________ _ AAiT
_____________________________________________________________________________________Compiled by Yidnekachew M. Page 34 of 54
Figure 5.4 The net work output of a cycle is equivalent to the product of the mean
effective pressure and the displacement volume.
netW = MEP× Piston area× stroke = MEP× Displacement volume
Or
max min max min
neynetwW
MEP =V V v v
( )kPa (5.2)
The mean effective pressure can be used as a parameter to compare the performances of
reciprocating engines of equal size. The engine with a larger value of MEP delivers more net work
per cycle and thus performs better.
Reciprocating engines are classified as spark-ignition (SI) engines or compression-ignition (CI)
engines, depending on how the combustion process in the cylinder is initiated. In SI engines, the
combustion of the air-fuel mixture is initiated by a spark plug. In CI engines, the air-fuel mixture
is self-ignited as a result of compressing the mixture above its self-ignition temperature. In the
next two sections, we discuss the Otto and Diesel cycles, which are the ideal cycles for the SI and
CI reciprocating engines, respectively.
6.7 Air-Standard Otto Cycle
The Otto cycle is the ideal cycle for spark-ignition reciprocating engines. It is named after Nikolaus
A. Otto, who built a successful four-stroke engine in 1876 in Germany using the cycle proposed
by Frenchman Beau de Rochas in 1862.
In most spark-ignition engines, the piston executes four complete strokes (two mechanical cycles)
within the cylinder, and the crankshaft completes two revolutions for each thermodynamic cycle.
These engines are called four-stroke internal combustion engines. A schematic of each stroke as
well as a P-v diagram for an actual four-stroke spark-ignition engine is given in Figure (5.5).

Engineering Thermodynamics _________________________________________________________ _ AAiT
_____________________________________________________________________________________Compiled by Yidnekachew M. Page 35 of 54
a) Actual four-stroke spark-ignition engine
b) Ideal Otto cycle
Figure 5.5 Actual and ideal cycles in spark-ignition engines and their P-v diagrams.
Initially, both the intake and the exhaust valves are closed, and the piston is at its lowest position
(BDC). During the compression stroke, the piston moves upward, compressing the air-fuel
mixture. Shortly before the piston reaches its highest position (TDC), the spark plug fires and the
mixture ignite, increasing the pressure and temperature of the system. The high-pressure gases
force the piston down, which in turn forces the crankshaft to rotate, producing a useful work output
during the expansion or power stroke. At the end of this stroke, the piston is at its lowest position
(the completion of the first mechanical cycle), and the cylinder is filled with combustion products.
Now the piston moves upward one more time, purging the exhaust gases through the exhaust valve
(the exhaust stroke), and down a second time, drawing in fresh air-fuel mixture through the intake
valve (the intake stroke). Notice that the pressure in the cylinder is slightly above the atmospheric
value during the exhaust stroke and slightly below during the intake stroke.
In two-stroke engines, all four functions described above are executed in just two strokes: the
power stroke and the compression stroke. In these engines, the crankcase is sealed, and the outward

Engineering Thermodynamics _________________________________________________________ _ AAiT
_____________________________________________________________________________________Compiled by Yidnekachew M. Page 36 of 54
motion of the piston is used to slightly pressurize the air–fuel mixture in the crankcase, as shown
in Figure (5.6). Also, the intake and exhaust valves are replaced by openings in the lower portion
of the cylinder wall. During the latter part of the power stroke, the piston uncovers first the exhaust
port, allowing the exhaust gases to be partially expelled, and then the intake port, allowing the
fresh air–fuel mixture to rush in and drive most of the remaining exhaust gases out of the cylinder.
This mixture is then compressed as the piston moves upward during the compression stroke and is
subsequently ignited by a spark plug.
Figure 5.6 Schematic of a two-stroke reciprocating engine.
The two-stroke engines are generally less efficient than their four-stroke counterparts because of
the incomplete expulsion of the exhaust gases and the partial expulsion of the fresh air–fuel
mixture with the exhaust gases. However, they are relatively simple and inexpensive, and they
have high power-to-weight and power-to-volume ratios, which make them suitable for applications
requiring small size and weight such as for motorcycles, chain saws, and lawn mowers.
The thermodynamic analysis of the actual four-stroke or two-stroke cycles described is not a
simple task. However, the analysis can be simplified significantly if the air-standard assumptions
are utilized. The resulting cycle, which closely resembles the actual operating conditions, is the
ideal Otto cycle.
The air-standard Otto cycle is an ideal cycle that assumes the heat addition occurs instantaneously
while the piston is at top dead center. The Otto cycle is shown on the p-v and T-s

Engineering Thermodynamics _________________________________________________________ _ AAiT
_____________________________________________________________________________________Compiled by Yidnekachew M. Page 37 of 54
Figure 5.7 p–v and T–s diagrams of the air-standard Otto cycle.
It consists of four internally reversible processes:
Process 1–2 is an isentropic compression of the air as the piston moves from bottom dead center to top dead center.
Process 2–3 is a constant-volume heat transfer to the air from an external source while the piston is at top dead center. This process is intended to represent the ignition of the fuel–air mixture and the subsequent rapid burning.
Process 3–4 is an isentropic expansion (power stroke).
Process 4–1 completes the cycle by a constant-volume process in which heat is rejected from the air while the piston is at bottom dead center.
The Otto cycle is executed in a closed system, and disregarding the changes in kinetic and potential
energies, the energy balance for any of the processes is expressed, on a unit-mass basis, as
( ) ( )in out in outq q w w u ( / )kJ kg (5.3)
No work is involved during the two heat transfer processes since both take places at constant
volume. Therefore, heat transfer to and from the working fluid can be expressed as
3 2 3 2( )in vq u u c T T (5.4)
and
4 1 4 1( )out vq u u c T T (5.5)
Then the thermal efficiency of the ideal Otto cycle under the cold air standard assumptions
becomes
,net
th Ottoin
w
q (5.6)
but net in outw q q (5.7)

Engineering Thermodynamics _________________________________________________________ _ AAiT
_____________________________________________________________________________________Compiled by Yidnekachew M. Page 38 of 54
4 1 1 4 1,
3 2 2 3 2
( / 1)1 1 1
( / 1)out
th Ottoin
q T T T T T
q T T T T T
(5.8)
Processes 1-2 and 3-4 are isentropic, and v2 = v3 and v4 = v1. Thus,
1 1
31 2 4
2 1 4 3
k kvT v T
T v v T
thus 3 4
2 1
T T
T T
(5.9)
Substituting these equations into the thermal efficiency relation and simplifying give
, 1
11th Otto kr
(5.10)
Where:
2
max 1 1
min 2
V V vr
V V v
(5.11)
is the compression ratio and k is the specific heat ratio cp /cv.
Equation 5.10 shows that under the cold-air-standard assumptions, the thermal efficiency of an
ideal Otto cycle depends on the compression ratio of the engine and the specific heat ratio of the
working fluid. The thermal efficiency of the ideal Otto cycle increases with both the compression
ratio and the specific heat ratio.
A plot of thermal efficiency versus the compression ratio is given in Figure (5.8) for k = 1.4, which
is the specific heat ratio value of air at room temperature. For a given compression ratio, the
thermal efficiency of an actual spark-ignition engine is less than that of an ideal Otto cycle because
of the irreversibilities, such as friction, and other factors such as incomplete combustion.
Figure 5.8 Thermal efficiency of the ideal Otto cycle as a function of compression ratio(k = 1.4). We can observe from Figure 5.8 that the thermal efficiency curve is rather steep at low
compression ratios but flattens out starting with a compression ratio value of about 8. Therefore,

Engineering Thermodynamics _________________________________________________________ _ AAiT
_____________________________________________________________________________________Compiled by Yidnekachew M. Page 39 of 54
the increase in thermal efficiency with the compression ratio is not as pronounced at high
compression ratios. Also, when high compression ratios are used, the temperature of the air–fuel
mixture rises above the autoignition temperature of the fuel (the temperature at which the fuel
ignites without the help of a spark) during the combustion process, causing an early and rapid burn
of the fuel at some point or points ahead of the flame front, followed by almost instantaneous
inflammation of the end gas. This premature ignition of the fuel, called autoignition, produces an
audible noise, which is called engine knock. Autoignition in spark-ignition engines cannot be
tolerated because it hurts performance and can cause engine damage. The requirement that
autoignition not be allowed places an upper limit on the compression ratios that can be used in
sparkignition internal combustion engines.
The second parameter affecting the thermal efficiency of an ideal Otto cycle is the specific heat
ratio k. For a given compression ratio, an ideal Otto cycle using a monatomic gas (such as argon
or helium, k =1.667) as the working fluid will have the highest thermal efficiency. The specific
heat ratio k, and thus the thermal efficiency of the ideal Otto cycle, decreases as the molecules of
the working fluid get larger (Figure 5.9). At room temperature it is 1.4 for air, 1.3 for carbon
dioxide, and 1.2 for ethane. The working fluid in actual engines contains larger molecules such as
carbon dioxide, and the specific heat ratio decreases with temperature, which is one of the reasons
that the actual cycles have lower thermal efficiencies than the ideal Otto cycle. The thermal
efficiencies of actual spark-ignition engines range from about 25 to 30 percent.
Figure 5.9 The thermal efficiency of the Otto cycle increases with the specific
heat ratio k of the working fluid.
6.8 Air-Standard Diesel Cycle

Engineering Thermodynamics _________________________________________________________ _ AAiT
_____________________________________________________________________________________Compiled by Yidnekachew M. Page 40 of 54
The Diesel cycle is the ideal cycle for CI reciprocating engines. The CI engine, first proposed by
Rudolph Diesel in the 1890s, is very similar to the SI engine, differing mainly in the method of
initiating combustion. In spark-ignition engines (also known as gasoline engines), the air–fuel
mixture is compressed to a temperature that is below the autoignition temperature of the fuel, and
the combustion process is initiated by firing a spark plug. In CI engines (also known as diesel
engines), the air is compressed to a temperature that is above the autoignition temperature of the
fuel, and combustion starts on contact as the fuel is injected into this hot air. Therefore, the spark
plug and carburetor are replaced by a fuel injector in diesel engines (Figure 5.10).
Figure 5.10 Gasoline and Diesel engine ignition system
In gasoline engines, a mixture of air and fuel is compressed during the compression stroke, and
the compression ratios are limited by the onset of autoignition or engine knock. In diesel engines,
only air is compressed during the compression stroke, eliminating the possibility of autoignition.
Therefore, diesel engines can be designed to operate at much higher compression ratios, typically
between 12 and 24. Not having to deal with the problem of autoignition has another benefit: many
of the stringent requirements placed on the gasoline can now be removed, and fuels that are less
refined (thus less expensive) can be used in diesel engines.
The fuel injection process in diesel engines starts when the piston approaches TDC and continues
during the first part of the power stroke. Therefore, the combustion process in these engines takes
place over a longer interval. Because of this longer duration, the combustion process in the ideal
Diesel cycle is approximated as a constant-pressure heat-addition process. In fact, this is the only
process where the Otto and the Diesel cycles differ. The remaining three processes are the same

Engineering Thermodynamics _________________________________________________________ _ AAiT
_____________________________________________________________________________________Compiled by Yidnekachew M. Page 41 of 54
for both ideal cycles. That is, process 1-2 is isentropic compression, 3-4 is isentropic expansion,
and 4-1 is constant-volume heat rejection. The similarity between the two cycles is also apparent
from the P-v and T-s diagrams of the Diesel cycle, shown in Figure (5.11).
Figure 5.11 T-s and P-v diagrams for the ideal Diesel cycle.
Noting that the Diesel cycle is executed in a piston-cylinder device, which forms a closed system,
the amount of heat transferred to the working fluid at constant pressure and rejected from it at
constant volume can be expressed as
, 3 2in b outq w u u (5.12)
2 3 2 3 2( ) ( )inq P v v u u (5.13)
3 2 3 2( )in pq h h c T T (5.14)
and
4 1 4 1( )out vq u u c T T (5.15)
Then the thermal efficiency of the ideal Diesel cycle under the cold-airstandard assumptions
becomes
4 1 1 4 1,
3 2 2 3 2
( / 1)1 1 1
( ) ( / 1)net out
th Dieselin in
w q T T T T T
q q k T T kT T T
(5.16)
We now define a new quantity, the cutoff ratio rc, as the ratio of the cylinder volumes after and before the combustion process:
3 3
2 2c
V vr
V v
(5.17)
Utilizing this definition and the isentropic ideal-gas relations for processes 1-2 and 3-4, we see that
the thermal efficiency relation reduces to

Engineering Thermodynamics _________________________________________________________ _ AAiT
_____________________________________________________________________________________Compiled by Yidnekachew M. Page 42 of 54
1
111
( 1)
kc
th kc
r
r k r
(5.18)
where r is the compression ratio defined by Equation (5.11). Looking at Equation (5.18) carefully,
one would notice that under the cold-air-standard assumptions, the efficiency of a Diesel cycle
differs from the efficiency of an Otto cycle by the quantity in the brackets. This quantity is always
greater than 1. Therefore,
, ,th Otto th Diesel
6.9 Air-Standard Dual Cycle
Approximating the combustion process in internal combustion engines as a constant-volume or a
constant-pressure heat-addition process is overly simplistic and not quite realistic. Probably a
better (but slightly more complex) approach would be to model the combustion process in both
gasoline and diesel engines as a combination of two heat-transfer processes, one at constant
volume and the other at constant pressure. The ideal cycle based on this concept is called the dual
cycle, and a P-v diagram for it is given in Figure (5.12).
Figure 5.12 p–v and T–s diagrams of the air-standard dual cycle.
As in the Otto and Diesel cycles, Process 1-2 is an isentropic compression. The heat addition occurs
in two steps, however: Process 2-3 is a constant-volume heat addition; Process 3-4 is a constant
pressure heat addition. Process 3-4 also makes up the first part of the power stroke. The isentropic
expansion from state 4 to state 5 is the remainder of the power stroke. As in the Otto and Diesel

Engineering Thermodynamics _________________________________________________________ _ AAiT
_____________________________________________________________________________________Compiled by Yidnekachew M. Page 43 of 54
cycles, the cycle is completed by a constant volume heat rejection process, Process 5-1. Areas
on the T–s and p–v diagrams can be interpreted as heat and work, respectively, as in the cases of
the Otto and Diesel cycles.
6.10 Stirling and Ericsson Cycles
Cycle which have efficiencies equal to the Carnot cycle and called Stirling and Ericsson cycles
have been defined. Although these cycles are not extensively used to model actual engines, they
are presented here to illustrate the effective use of a regenerator-a heat exchanger which utilizes
waste heat. In both the Stirling cycles as well as the Ericsson cycles, compression and expansion
processes are isothermal. The Stirling and Ericsson cycles are represented schematically figure
below.
Figure 5.13 Stirling and Ericsson cycle
For an ideal regenerator, the heat supplied to the working fluid, process2-3, is equal to the heat
rejection from the working fluid, process 4-1. The isothermal process 1-2 and 3-4 are connected
by constant volume and constant pressure process for the Stirling and Ericsson cycle, respectively.
1-2 T = constant expansion (heat addition from the external source)
2-3 v = constant regeneration (internal heat transfer from the working fluid to
the regenerator)

Engineering Thermodynamics _________________________________________________________ _ AAiT
_____________________________________________________________________________________Compiled by Yidnekachew M. Page 44 of 54
3-4 T = constant compression (heat rejection to the external sink)
4-1 v = constant regeneration (internal heat transfer from the regenerator back
to the working fluid)
Figure 5.14 T-s and P-v diagrams of Carnot, Stirling, and Ericsson cycles.
Both the Stirling and Ericsson cycles are totally reversible, as is the Carnot cycle, and thus
according to the Carnot principle, all three cycles must have the same thermal efficiency when
operating between the same temperature limits:
, , , 1 Lth Stirling th Ericsson th Carnot
H
T
T
6.11 Modeling Gas Turbine Power Plants
Gas turbine power plants may operate on either an open or closed basis. The open mode pictured
in Fig. 5.13a is more common. This is an engine in which atmospheric air is continuously drawn
into the compressor, where it is compressed to a high pressure. The air then enters a combustion
chamber, or combustor, where it is mixed with fuel and combustion occurs, resulting in
combustion products at an elevated temperature. The combustion products expand through the
turbine and are subsequently discharged to the surroundings. Part of the turbine work developed

Engineering Thermodynamics _________________________________________________________ _ AAiT
_____________________________________________________________________________________Compiled by Yidnekachew M. Page 45 of 54
is used to drive the compressor; the remainder is available to generate electricity, to propel a
vehicle, or for other purposes. In the system pictured in Fig. 5.13b, the working fluid receives an
energy input by heat transfer from an external source, for example a gas-cooled nuclear reactor.
The gas exiting the turbine is passed through a heat exchanger, where it is cooled prior to reentering
the compressor.
Figure 5.15 Simple gas turbine. (a) Open to the atmosphere. (b) Closed.
An idealization often used in the study of open gas turbine power plants is that of an air-standard
analysis. In an air-standard analysis two assumptions are always made:
The working fluid is air, which behaves as an ideal gas.
The temperature rise that would be brought about by combustion is accomplished by a
heat transfer from an external source.
6.12 Brayton Cycle: The Ideal Cycle For Gas-Turbine Engines
The Brayton cycle was first proposed by George Brayton for use in the reciprocating oil-burning
engine that he developed around 1870. Today, it is used for gas turbines only where both the
compression and expansion processes take place in rotating machinery. Gas turbines usually
operate on an open cycle, as shown in Fig. 5.13a. Fresh air at ambient conditions is drawn into the
compressor, where its temperature and pressure are raised. The high-pressure air proceeds into the
combustion chamber, where the fuel is burned at constant pressure. The resulting high-temperature

Engineering Thermodynamics _________________________________________________________ _ AAiT
_____________________________________________________________________________________Compiled by Yidnekachew M. Page 46 of 54
gases then enter the turbine, where they expand to the atmospheric pressure while producing
power. The exhaust gases leaving the turbine are thrown out (not recirculated), causing the cycle
to be classified as an open cycle.
The open gas-turbine cycle described above can be modeled as a closed cycle, as shown in Fig.
5.13b, by utilizing the air-standard assumptions. Here the compression and expansion processes
remain the same, but the combustion process is replaced by a constant-pressure heat-addition
process from an external source, and the exhaust process is replaced by a constantpressure heat-
rejection process to the ambient air. The ideal cycle that the working fluid undergoes in this closed
loop is the Brayton Cycle, which is made up of four internally reversible processes:
1-2 Isentropic compression (in a compressor) 2-3 Constant-pressure heat addition 3-4 Isentropic expansion (in a turbine) 4-1 Constant-pressure heat rejection
The T-s and P-v diagrams of an ideal Brayton cycle are shown in Fig. 5–14. Notice that all four
processes of the Brayton cycle are executed in steadyflow devices; thus, they should be analyzed
as steady-flow processes.
Figure 5.16 T-s and P-v diagrams for the ideal Brayton cycle.
When the changes in kinetic and potential energies are neglected, the energy balance for a steady-
flow process can be expressed, on a unit–mass basis, as ( ) ( )in out in out exit inletq q w w h h

Engineering Thermodynamics _________________________________________________________ _ AAiT
_____________________________________________________________________________________Compiled by Yidnekachew M. Page 47 of 54
Therefore, heat transfers to and from the working fluid are
3 2 3 2( )in pq h h c T T
and
4 1 4 1( )out pq h h c T T
Then the thermal efficiency of the ideal Brayton cycle under the cold-airstandard assumptions
becomes
4 1 1 4 1,
3 2 2 3 2
( ) ( / 1)1 1 1
( ) ( / 1)pnet out
th braytonin in p
c T Tw q T T T
q q c T T T T T
Processes 1-2 and 3-4 are isentropic, and P2 = P3 and P4 = P1. Thus,
( 1)/ ( 1)/
32 2 2
1 1 1 4
k k k kTT P P
T P P T
Substituting these equations into the thermal efficiency relation and simplifying give
, ( 1)/
11th Brayton k k
Pr
Were
2
1P
Pr
P
is the pressure ratio and k is the specific heat ratio.
Deviation of Actual Gas-Turbine Cycles from Idealized Ones
The actual gas-turbine cycle differs from the ideal Brayton cycle on several accounts. For one
thing, some pressure drop during the heat-addition and heatrejection processes is inevitable. More
importantly, the actual work input to the compressor is more, and the actual work output from the
turbine is less because of irreversibilities. The deviation of actual compressor and turbine behavior
from the idealized isentropic behavior can be accurately accounted for by utilizing the isentropic
efficiencies of the turbine and compressor as
2 1
2 1
s sC
a a
w h h
w h h
and

Engineering Thermodynamics _________________________________________________________ _ AAiT
_____________________________________________________________________________________Compiled by Yidnekachew M. Page 48 of 54
3 4
3 4
a aT
s s
w h h
w h h
Figure 5.17 The deviation of an actual gas-turbine cycle from the ideal Brayton cycle as a result of irreversibilities.
where states 2a and 4a are the actual exit states of the compressor and the turbine, respectively,
and 2s and 4s are the corresponding states for the isentropic case, as illustrated in Fig. 5.17. The
effect of the turbine and compressor efficiencies on the thermal efficiency of the gas-turbine
engines is illustrated below with an example.
6.13 The Brayton Cycle With Regeneration
In gas-turbine engines, the temperature of the exhaust gas leaving the turbine is often considerably
higher than the temperature of the air leaving the compressor. Therefore, the high-pressure air
leaving the compressor can be heated by transferring heat to it from the hot exhaust gases in a
counter-flow heat exchanger, which is also known as a regenerator or a recuperator. A sketch of
the gas-turbine engine utilizing a regenerator and the T-s diagram of the new cycle are shown in
Figs. 9–38 and 9–39, respectively.
The thermal efficiency of the Brayton cycle increases as a result of regeneration since the portion
of energy of the exhaust gases that is normally rejected to the surroundings is now used to preheat
the air entering the combustion chamber. This, in turn, decreases the heat input (thus fuel)
requirements for the same net work output. Note, however, that the use of a regenerator is
recommended only when the turbine exhaust temperature is higher than the compressor exit

Engineering Thermodynamics _________________________________________________________ _ AAiT
_____________________________________________________________________________________Compiled by Yidnekachew M. Page 49 of 54
temperature. Otherwise, heat will flow in the reverse direction (to the exhaust gases), decreasing
the efficiency. This situation is encountered in gas-turbine engines operating at very high pressure
ratios.
Figure 5.18 A gas-turbine engine with regenerator.
Figure 5.19 T-s diagram of a Brayton cycle with regeneration.
The highest temperature occurring within the regenerator is T4, the temperature of the exhaust
gases leaving the turbine and entering the regenerator. Under no conditions can the air be preheated
in the regenerator to a temperature above this value. Air normally leaves the regenerator at a lower
temperature, T5. In the limiting (ideal) case, the air exits the regenerator at the inlet temperature of
the exhaust gases T4. Assuming the regenerator to be well insulated and any changes in kinetic and
potential energies to be negligible, the actual and maximum heat transfers from the exhaust gases
to the air can be expressed as
, 5 2regen actq h h
Engineering Thermodynamics _________________________________________________________ _ AAiT
_____________________________________________________________________________________Compiled by Yidnekachew M. Page 50 of 54
and
',max 2 4 25regenq h h h h
The extent to which a regenerator approaches an ideal regenerator is called the effectiveness and
is defined as
, 5 2
,max 4 2
regen act
regen
q h h
q h h
When the cold-air-standard assumptions are utilized, it reduces to
5 2
4 2
T T
T T
Under the cold-air-standard assumptions, the thermal efficiency of an ideal Brayton cycle with
regeneration is
1 /1
,3
1k k
th regen p
Tr
T
6.14 The Brayton Cycle with Inter-cooling, Reheating, and
Regeneration
The net work of a gas-turbine cycle is the difference between the turbine work output and the
compressor work input, and it can be increased by either decreasing the compressor work or
increasing the turbine work, or both. The work required to compress a gas between two specified
pressures can be decreased by carrying out the compression process in stages and cooling the gas
in between that is, using multistage compression with inter-cooling.

Engineering Thermodynamics _________________________________________________________ _ AAiT
_____________________________________________________________________________________Compiled by Yidnekachew M. Page 51 of 54
Figure 5.20 Comparison of work inputs to a single-stage compressor (1AC) and a
two-stage compressor with inter-cooling (1ABD).
As the number of stages is increased, the compression process becomes nearly isothermal at the
compressor inlet temperature, and the compression work decreases.
Likewise, the work output of a turbine operating between two pressure levels can be increased by
expanding the gas in stages and reheating it in between—that is, utilizing multistage expansion
with reheating. This is accomplished without raising the maximum temperature in the cycle. As
the number of stages is increased, the expansion process becomes nearly isothermal. The foregoing
argument is based on a simple principle: The steady-flow compression or expansion work is
proportional to the specific volume of the fluid. Therefore, the specific volume of the working fluid
should be as low as possible during a compression process and as high as possible during an
expansion process. This is precisely what inter-cooling and reheating accomplish.
The working fluid leaves the compressor at a lower temperature, and the turbine at a higher
temperature, when intercooling and reheating are utilized. This makes regeneration more attractive
since a greater potential for regeneration exists. Also, the gases leaving the compressor can be
heated to a higher temperature before they enter the combustion chamber because of the higher
temperature of the turbine exhaust.

Engineering Thermodynamics _________________________________________________________ _ AAiT
_____________________________________________________________________________________Compiled by Yidnekachew M. Page 52 of 54
Figure 5.21 A gas-turbine engine with two-stage compression with intercooling, two-stage expansion
with reheating, and regeneration.
The gas enters the first stage of the compressor at state 1, is compressed isentropically to an
intermediate pressure P2, is cooled at constant pressure to state 3 (T3 = T1), and is compressed in
the second stage isentropically to the final pressure P4. At state 4 the gas enters the regenerator,
where it is heated to T5 at constant pressure. In an ideal regenerator, the gas leaves the regenerator
at the temperature of the turbine exhaust, that is, T5 - T9. The primary heat addition (or combustion)
process takes place between states 5 and 6. The gas enters the first stage of the turbine atstate 6
and expands isentropically to state 7, where it enters the reheater. It is reheated at constant pressure
to state 8 (T8 = T6), where it enters the second stage of the turbine. The gas exits the turbine at state

Engineering Thermodynamics _________________________________________________________ _ AAiT
_____________________________________________________________________________________Compiled by Yidnekachew M. Page 53 of 54
9 and enters the regenerator, where it is cooled to state 10 at constant pressure. The cycle is
completed by cooling the gas to the initial state (or purging the exhaust gases).
6.15 Ideal Jet-Propulsion Cycles
Gas-turbine engines are widely used to power aircraft because they are light and compact and have
a high power-to-weight ratio. Aircraft gas turbines operate on an open cycle called a jet-propulsion
cycle. The ideal jet-propulsion cycle differs from the simple ideal Brayton cycle in that the gases
are not expanded to the ambient pressure in the turbine. Instead, they are expanded to a pressure
such that the power produced by the turbine is just sufficient to drive the compressor and the
auxiliary equipment, such as a small generator and hydraulic pumps. That is, the net work output
of a jet-propulsion cycle is zero. The gases that exit the turbine at a relatively high pressure are
subsequently accelerated in a nozzle to provide the thrust to propel the aircraft.
Figure 5.22 In jet engines, the high-temperature and high-pressure gases leaving the turbine are accelerated in a nozzle to provide thrust.
A schematic of a turbojet engine and the T-s diagram of the ideal turbojet cycle are shown in Fig.
9–48. The pressure of air rises slightly as it is decelerated in the diffuser. Air is compressed by the
compressor. It is mixed with fuel in the combustion chamber, where the mixture is burned at
constant pressure. The high-pressure and high-temperature combustion gases partially expand in
the turbine, producing enough power to drive the compressor and other equipment. Finally, the
gases expand in a nozzle to the ambient pressure and leave the engine at a high velocity.
In the ideal case, the turbine work is assumed to equal the compressor work. Also, the processes
in the diffuser, the compressor, the turbine, and the nozzle are assumed to be isentropic. In the
analysis of actual cycles, however, the irreversibilities associated with these devices should be
considered. The effect of the irreversibilities is to reduce the thrust that can be obtained from a
turbojet engine.

Engineering Thermodynamics _________________________________________________________ _ AAiT
_____________________________________________________________________________________Compiled by Yidnekachew M. Page 54 of 54
Figure 5.23 Basic components of a turbojet engine and the T-s diagram for the ideal turbojet cycle.
The thrust developed in a turbojet engine is the unbalanced force that is caused by the difference
in the momentum of the low-velocity air entering the engine and the high-velocity exhaust gases
leaving the engine, and it is determined from Newton’s second law. The pressures at the inlet and
the exit of a turbojet engine are identical (the ambient pressure); thus, the net thrust developed by
the engine is
( ) ( ) ( )exit inlet exit inletF mV mV m V V ( )N
where Vexit is the exit velocity of the exhaust gases and Vinlet is the inlet velocity of the air, both
relative to the aircraft. Thus, for an aircraft cruising in still air, Vinlet is the aircraft velocity.
The power developed from the thrust of the engine is called the propulsive power , which is
the propulsive force (thrust) times the distance this force acts on the aircraft per unit time, that is,
the thrust times the aircraft velocity
( )P aircraft exit inlet aircraftW FV m V V V ( )kW