Embed Size (px)
Citation preview
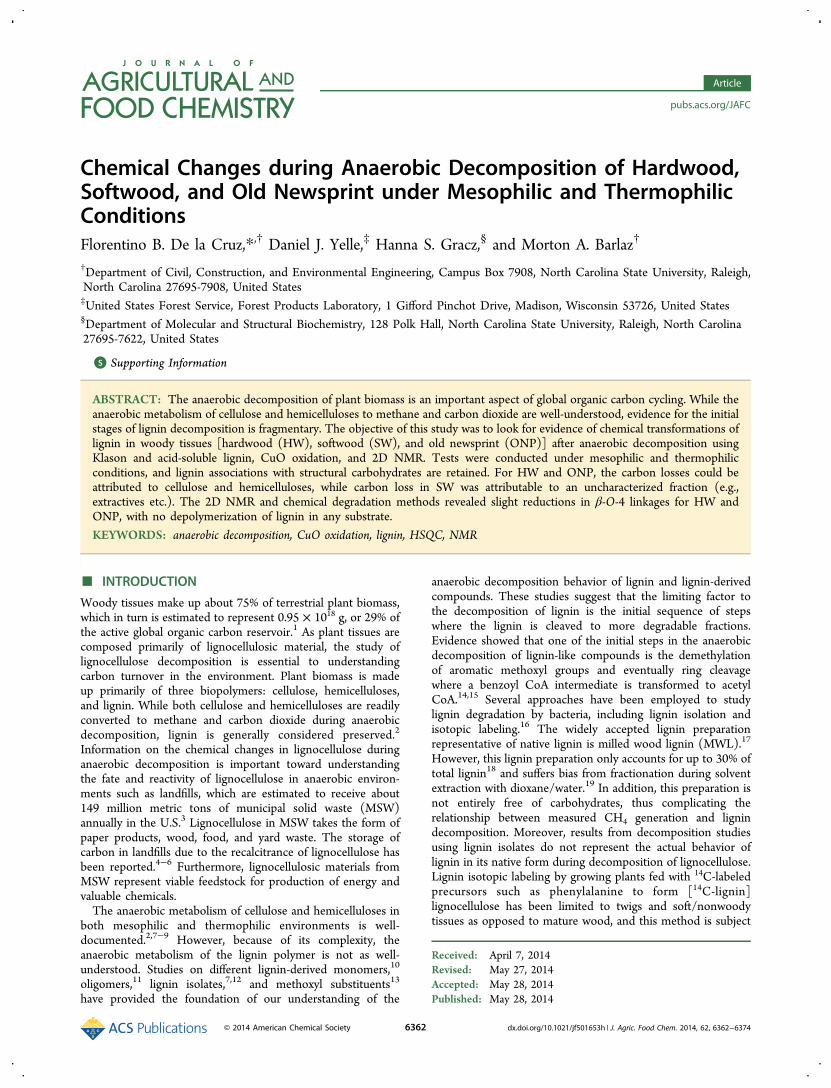
Chemical Changes during Anaerobic Decomposition of Hardwood,Softwood, and Old Newsprint under Mesophilic and ThermophilicConditionsFlorentino B. De la Cruz,*,† Daniel J. Yelle,‡ Hanna S. Gracz,§ and Morton A. Barlaz†
†Department of Civil, Construction, and Environmental Engineering, Campus Box 7908, North Carolina State University, Raleigh,North Carolina 27695-7908, United States‡United States Forest Service, Forest Products Laboratory, 1 Gifford Pinchot Drive, Madison, Wisconsin 53726, United States§Department of Molecular and Structural Biochemistry, 128 Polk Hall, North Carolina State University, Raleigh, North Carolina27695-7622, United States
*S Supporting Information
ABSTRACT: The anaerobic decomposition of plant biomass is an important aspect of global organic carbon cycling. While theanaerobic metabolism of cellulose and hemicelluloses to methane and carbon dioxide are well-understood, evidence for the initialstages of lignin decomposition is fragmentary. The objective of this study was to look for evidence of chemical transformations oflignin in woody tissues [hardwood (HW), softwood (SW), and old newsprint (ONP)] after anaerobic decomposition usingKlason and acid-soluble lignin, CuO oxidation, and 2D NMR. Tests were conducted under mesophilic and thermophilicconditions, and lignin associations with structural carbohydrates are retained. For HW and ONP, the carbon losses could beattributed to cellulose and hemicelluloses, while carbon loss in SW was attributable to an uncharacterized fraction (e.g.,extractives etc.). The 2D NMR and chemical degradation methods revealed slight reductions in β-O-4 linkages for HW andONP, with no depolymerization of lignin in any substrate.
KEYWORDS: anaerobic decomposition, CuO oxidation, lignin, HSQC, NMR
■ INTRODUCTION
Woody tissues make up about 75% of terrestrial plant biomass,which in turn is estimated to represent 0.95 × 10¹⁸ g, or 29% ofthe active global organic carbon reservoir.1 As plant tissues arecomposed primarily of lignocellulosic material, the study oflignocellulose decomposition is essential to understandingcarbon turnover in the environment. Plant biomass is madeup primarily of three biopolymers: cellulose, hemicelluloses,and lignin. While both cellulose and hemicelluloses are readilyconverted to methane and carbon dioxide during anaerobicdecomposition, lignin is generally considered preserved.2
Information on the chemical changes in lignocellulose duringanaerobic decomposition is important toward understandingthe fate and reactivity of lignocellulose in anaerobic environ-ments such as landfills, which are estimated to receive about149 million metric tons of municipal solid waste (MSW)annually in the U.S.3 Lignocellulose in MSW takes the form ofpaper products, wood, food, and yard waste. The storage ofcarbon in landfills due to the recalcitrance of lignocellulose hasbeen reported.4−6 Furthermore, lignocellulosic materials fromMSW represent viable feedstock for production of energy andvaluable chemicals.The anaerobic metabolism of cellulose and hemicelluloses in
both mesophilic and thermophilic environments is well-documented.2,7−9 However, because of its complexity, theanaerobic metabolism of the lignin polymer is not as well-understood. Studies on different lignin-derived monomers,10
oligomers,11 lignin isolates,7,12 and methoxyl substituents13
have provided the foundation of our understanding of the
anaerobic decomposition behavior of lignin and lignin-derivedcompounds. These studies suggest that the limiting factor tothe decomposition of lignin is the initial sequence of stepswhere the lignin is cleaved to more degradable fractions.Evidence showed that one of the initial steps in the anaerobicdecomposition of lignin-like compounds is the demethylationof aromatic methoxyl groups and eventually ring cleavagewhere a benzoyl CoA intermediate is transformed to acetylCoA.14,15 Several approaches have been employed to studylignin degradation by bacteria, including lignin isolation andisotopic labeling.16 The widely accepted lignin preparationrepresentative of native lignin is milled wood lignin (MWL).17
However, this lignin preparation only accounts for up to 30% oftotal lignin18 and suffers bias from fractionation during solventextraction with dioxane/water.19 In addition, this preparation isnot entirely free of carbohydrates, thus complicating therelationship between measured CH4 generation and lignindecomposition. Moreover, results from decomposition studiesusing lignin isolates do not represent the actual behavior oflignin in its native form during decomposition of lignocellulose.Lignin isotopic labeling by growing plants fed with 14C-labeledprecursors such as phenylalanine to form [14C-lignin]lignocellulose has been limited to twigs and soft/nonwoodytissues as opposed to mature wood, and this method is subject
Received: April 7, 2014Revised: May 27, 2014Accepted: May 28, 2014Published: May 28, 2014
Article
pubs.acs.org/JAFC
© 2014 American Chemical Society 6362 dx.doi.org/10.1021/jf501653h | J. Agric. Food Chem. 2014, 62, 6362−6374
to 14C-protein contamination.20 Advances in high resolutionnuclear magnetic resonance spectroscopy (NMR) and thedevelopment of methodologies to completely solubilize theentire plant cell wall21 make it possible to observe structuraltransformations of lignocellulose components. For example,this approach has been previously employed to look forevidence of lignin decomposition by brown rot fungi22 and inthe structural characterization of thermochemically treatedplant biomass.23
The objective of this study was to look for evidence ofchemical changes in lignin during anaerobic decomposition ofdifferent woody plant materials under mesophilic andthermophilic conditions. To our knowledge, this is the firsttime that high resolution 2D NMR of completely dissolved cellwalls has been used to look for evidence of chemicaltransformations during anaerobic decomposition of lignocellu-losic materials in their native state (i.e., when the naturalcomplex associations between cellulose, hemicelluloses, andlignin are retained).
■ MATERIALS AND METHODSExperimental Design. Anaerobic decomposition experiments
were conducted with lignocellulosic materials (HW, hardwood Quercusrubra; SW, softwood Pinus taeda; and ONP, old newsprintWashington Post) at mesophilic (37 °C) and thermophilic (55 °C)temperatures. ONP was selected to represent a pulp and paperproduct in which the lignin remains in the product. Copy paper wasselected as a positive control because it contains primarily celluloseand very little lignin.Each material was incubated under conditions optimal for anaerobic
decomposition in 160 mL serum bottles containing an inoculum andbiological growth medium. Decomposition was allowed to proceeduntil no significant methane production was measured so as to allowthe bioavailable substrates to be consumed. In order of preference,lignin degradation will not proceed unless readily degradablesubstrates such as cellulose and hemicelluloses have been depleted.The incubation period for different materials ranged from 467 days to585 days. At the completion of incubation, the solid residue wasrecovered by drying the entire contents of the bottle at 50 °C. Thesolid residue was subjected to the wet chemical and spectroscopicanalyses described below.Sample Collection and Preparation. Mature wood samples
(oven-dried at 105 °C for 48 h and stored at room temperature) wereobtained from the collection of Dr. Ilona Peszlen of the Department ofForest Biomaterials at NC State University. The copy paper used inthe experiments is a commercially available white paper. The ONP wasrepresented by the Washington Post and was collected in August 2011.Samples were dried at 50 °C, then ground to pass a 60-mesh screen(0.251 mm opening) in a Wiley mill, and then redried at 50 °C toconstant weight. This temperature is well below the predicted glasstransition temperature of lignin.24 Samples were stored in Mason jarsat room temperature until used.Preparation of Anaerobically Decomposed Materials. The
goal of the preparation of decomposed materials was to generate solidsfor subsequent analysis with negligible background lignin, cellulose,and hemicelluloses. Anaerobically decomposed materials wereprepared following the biochemical methane potential (BMP) testwith some modifications.9 Test material weighing 2 g was incubated ina 160 mL serum bottle with 80 mL of reduced medium and 20 mL ofinoculum according to Wang et al.9 The bottle was capped with a butylrubber stopper and then sealed with an aluminum crimp. The headspace was flushed with a mixture of CO2/N2 (20:80, v/v). Flushingwas done for about 10 min at a flow rate of at least 100 mL/min. Thiswas sufficient to replace the headspace gases with CO2/N2 (20:80, v/v). The BMP inoculum described in Wang et al.9 is rich in humicmaterials that could interfere with lignin analyses. Thus, it was
necessary to prepare mesophilic and thermophilic inocula withnegligible background lignin.
The mesophilic inoculum has been maintained on ground (<1 mm)residential MSW in our laboratory for over 15 years at 37 °C. Thethermophilic inoculum was obtained from a thermophilic anaerobicsludge digester (Carrboro, NC) operated at 55 °C and was collected inMarch 2011. Serial transfer (1:1, v/v) of the inoculum was done every2 weeks into a fresh mixture of reduced medium with copy paper asthe growth substrate until no significant lignin was detected by CuOanalysis, a process that required about 14 transfers over 7 months. Thecopy paper was initially tested for methane potential (∼250 mL ofCH4/g) to ensure that the paper does not contain inhibitorysubstances. Copy paper used in the experiments contained less than1% Klason lignin. The viability of the inoculum was monitored bymeasuring gas production.9
Analytical Methods. CuO Digestion and HPLC Detection. Asample containing 2−5 mg of C equivalent was placed in a 25 mLTeflon vial with 0.5 g of CuO powder, 0.1 g of Fe(NH4)2(SO4)2·6H2O, and 5 mL of 2 M NaOH (O2-free), sealed, and locked under aN2 headspace in an anaerobic hood. Digestion was conducted in afurnace at 150 °C for 3 h. After digestion and cooling, the liquidportion of the digestate was separated by centrifugation and thenacidified (pH ≤ 2). An aliquot of this solution was diluted as necessaryto obtain a concentration within the calibration range (0.05−25 μMfor each phenolic monomer) and was analyzed using a LC-20AT highperformance liquid chromatograph (HPLC) equipped with a degasser(DGU-20A5) and a SPD 20A photodiode array detector (PDA)(Shimadzu, Canby, OR). Chromatographic analyses were conductedusing a gradient program at 55 °C with a Kinetex 2.6u C18 100Acolumn (Phenomenex, Torrance, CA) as described previously.25,26
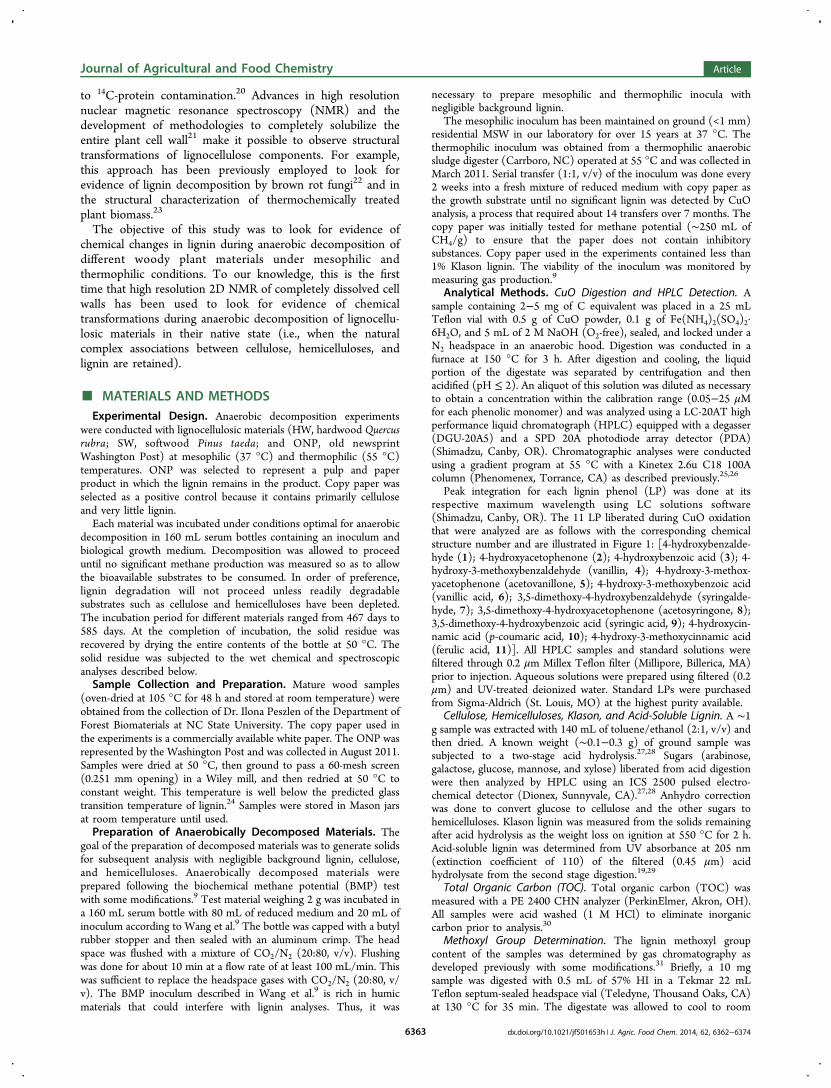
Peak integration for each lignin phenol (LP) was done at itsrespective maximum wavelength using LC solutions software(Shimadzu, Canby, OR). The 11 LP liberated during CuO oxidationthat were analyzed are as follows with the corresponding chemicalstructure number and are illustrated in Figure 1: [4-hydroxybenzalde-hyde (1); 4-hydroxyacetophenone (2); 4-hydroxybenzoic acid (3); 4-hydroxy-3-methoxybenzaldehyde (vanillin, 4); 4-hydroxy-3-methox-yacetophenone (acetovanillone, 5); 4-hydroxy-3-methoxybenzoic acid(vanillic acid, 6); 3,5-dimethoxy-4-hydroxybenzaldehyde (syringalde-hyde, 7); 3,5-dimethoxy-4-hydroxyacetophenone (acetosyringone, 8);3,5-dimethoxy-4-hydroxybenzoic acid (syringic acid, 9); 4-hydroxycin-namic acid (p-coumaric acid, 10); 4-hydroxy-3-methoxycinnamic acid(ferulic acid, 11)]. All HPLC samples and standard solutions werefiltered through 0.2 μm Millex Teflon filter (Millipore, Billerica, MA)prior to injection. Aqueous solutions were prepared using filtered (0.2μm) and UV-treated deionized water. Standard LPs were purchasedfrom Sigma-Aldrich (St. Louis, MO) at the highest purity available.
Cellulose, Hemicelluloses, Klason, and Acid-Soluble Lignin. A ∼1g sample was extracted with 140 mL of toluene/ethanol (2:1, v/v) andthen dried. A known weight (∼0.1−0.3 g) of ground sample wassubjected to a two-stage acid hydrolysis.27,28 Sugars (arabinose,galactose, glucose, mannose, and xylose) liberated from acid digestionwere then analyzed by HPLC using an ICS 2500 pulsed electro-chemical detector (Dionex, Sunnyvale, CA).27,28 Anhydro correctionwas done to convert glucose to cellulose and the other sugars tohemicelluloses. Klason lignin was measured from the solids remainingafter acid hydrolysis as the weight loss on ignition at 550 °C for 2 h.Acid-soluble lignin was determined from UV absorbance at 205 nm(extinction coefficient of 110) of the filtered (0.45 μm) acidhydrolysate from the second stage digestion.19,29
Total Organic Carbon (TOC). Total organic carbon (TOC) wasmeasured with a PE 2400 CHN analyzer (PerkinElmer, Akron, OH).All samples were acid washed (1 M HCl) to eliminate inorganiccarbon prior to analysis.30
Methoxyl Group Determination. The lignin methoxyl groupcontent of the samples was determined by gas chromatography asdeveloped previously with some modifications.31 Briefly, a 10 mgsample was digested with 0.5 mL of 57% HI in a Tekmar 22 mLTeflon septum-sealed headspace vial (Teledyne, Thousand Oaks, CA)at 130 °C for 35 min. The digestate was allowed to cool to room
Journal of Agricultural and Food Chemistry Article
dx.doi.org/10.1021/jf501653h | J. Agric. Food Chem. 2014, 62, 6362−63746363
temperature and neutralized by addition of 0.5 mL of 6 M NaOH. Theheadspace was analyzed for methyl iodide using an 7890A GC(Agilent, Santa Clara, CA) equipped with a model 7000 headspaceauto sampler (Teledyne, Thousand Oaks, CA), capillary column (30m × 0.25 mm × 0.1 μm), and flame ionization detector (FID) at 250°C. The carrier gas was 3.8 mL of He/min. Headspace gasconcentration was determined from an external calibration curveconstructed by the full evaporation technique, injecting 0.1 to 10 μL ofpure methyl iodide as previously described.31
Cell Wall Dissolution. Complete dissolution of plant cell walls forsubsequent high resolution solution state nuclear magnetic resonance(NMR) spectroscopy has been described.21,32,33 A ground sample(<60 mesh) weighing 2 g was ball-milled in toluene using aluminafortified porcelain jars charged with zirconia grinding medium (6.4 ×6.4 mm) in a 0.4 L jar mill (Cole-Parmer, Vernon Hills, IL) rotating at30 rpm under a N2 headspace.
34,35 Optimal charging of 45−55% (v/v)was used as per the manufacturer’s instructions. A ball-millingexperiment showed that complete dissolution is possible after 14−28days depending on the sample. Studies have shown that ball-millingresults in only a minor increase in detectable cleaved lignin structures,and ball-milling in toluene is recommended as it serves to regulatetemperature and acts as a radical scavenger.34,35 After ball-milling, thesample suspended in toluene was centrifuged at 2850 rpm for 15 min.The toluene layer was aspirated and the remaining solvent wasremoved by evaporation at 50 °C under vacuum.
A ball-milled sample weighing 600 mg was dissolved in 10 mL ofdimethyl sulfoxide (DMSO) and 5 mL of N-methylimidazole. A clearamber color solution was produced after stirring for at least 4 h. Thesolution was acetylated in situ by addition of 3 mL of acetic anhydrideand stirred for 1.5 h, after which a dark brown solution was formed.The acetylated cell wall solution was precipitated in 2 L of deionizedwater, stirred overnight, recovered by vacuum filtration (0.2 μm nylonfilter), washed with 250 mL of DI water, and then dried under vacuum(50 °C). The yield of acetylated cell wall was about 136% of the initialweight of material, which is typical for sample acetylation.21 Afterdrying, 90 mg of acetylated cell wall was dissolved in 0.75 mL ofDMSO-d6 (Cambridge Isotope Laboratories, Tewksbury, MA) andthen transferred to a 5 mm NMR tube for analysis.
Nuclear Magnetic Resonance (NMR) Spectroscopy. One-bond1H−13C heteronuclear single quantum coherence (HSQC) NMRspectra were obtained at the Bio-NMR facility of the Department ofMolecular and Structural Biochemistry, NC State University, using anAvance III 700 MHz spectrometer (Bruker, The Woodlands, TX)equipped with QNP cryoprobe implementing the Bruker’s hsqcetg-psisp2.2 pulse sequence program at 30 °C. HSQC is a 2D NMR
Figure 1. Suites of lignin phenols (LP) liberated during CuOoxidation of lignin.45
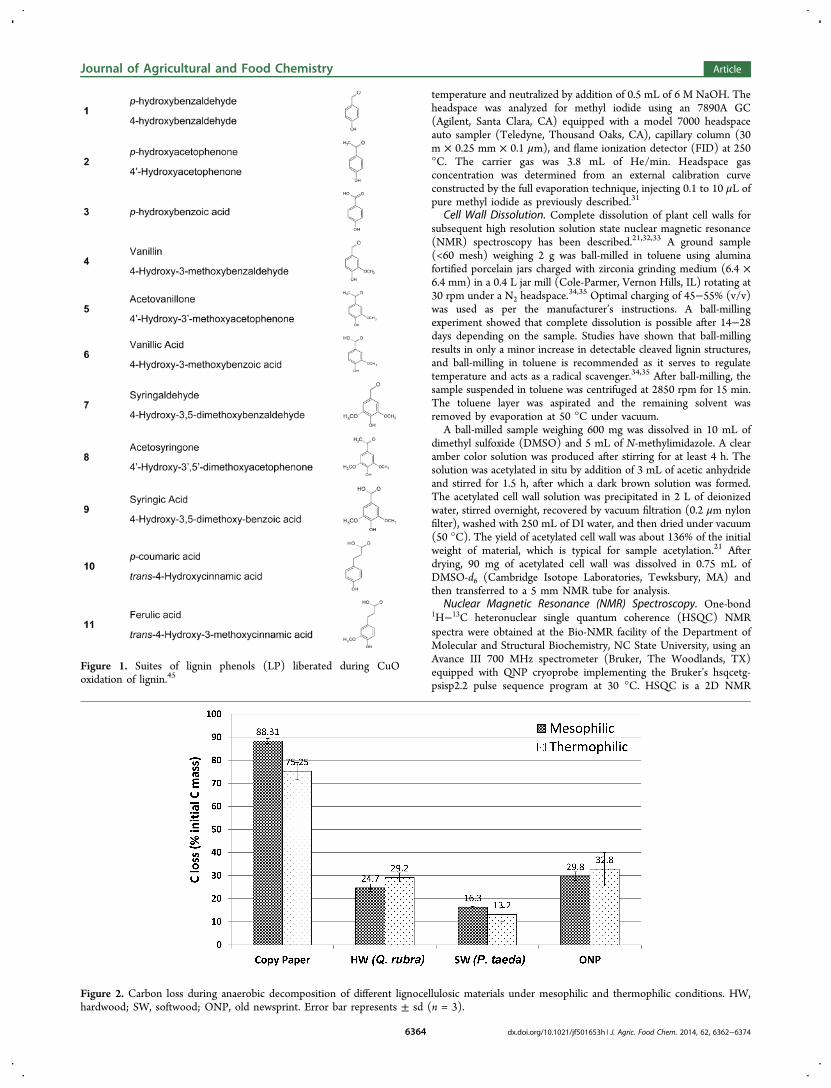
Figure 2. Carbon loss during anaerobic decomposition of different lignocellulosic materials under mesophilic and thermophilic conditions. HW,hardwood; SW, softwood; ONP, old newsprint. Error bar represents ± sd (n = 3).
Journal of Agricultural and Food Chemistry Article
dx.doi.org/10.1021/jf501653h | J. Agric. Food Chem. 2014, 62, 6362−63746364
experiment which creates cross peaks that correlate the hydrogen in amolecule with its directly attached carbon.36 The F2 acquisition timefor these NMR experiments were about 8 h with about 1 h for F1acquisition time. The DMSO-d6 peak (δH/δC = 2.49 ppm/39.5 ppm)was used for internal calibration reference. Data processing andintegration were done using Topspin 3.2. No attempts were made toconduct NMR experiments using nonacetylated samples. Acetylationof the whole cell wall does result in the loss of information on thenatural acetates found on mannan and xylan.NMR Quantitation. Peak assignment was performed using the
lignin NMR database37 and comparison with previously publishedlignin spectra for different lignin preparations.33,38−41 Calculations toobtain absolute quantitation of different substructures were done asfollows (eq 1) using the methoxyl group content obtained from wetchemical analyses as a reference.22
= ×−
−
⎡⎣⎢
⎤⎦⎥
⎡⎣⎢
⎤⎦⎥
C DC
Dmmol
g of sample2
2linkage linkage
OCHmmol
g of sample
OCH
3
3 (1)
where Clinkage [mmol/(g of sample)] = concentration of a given linkageor substructure; 2Dlinkage = HSQC volume integral of a given linkage orsubstructure; C−OCH3
[mmol/(g of sample)] = concentration ofmethoxyl group in the sample as determined by wet chemistry;2D−OCH3
= HSQC volume integral of the methoxyl group. Since theintensity of the HSQC regions are dependent on a coupling constant,comparisons of the different substructures were done on the basis oftheir Hα−Cα correlations having a similar chemical environment. Theresinol volume was divided by 2 as two correlations are involved ineach linkage unit. To quantitate the C9 units of lignin, the volumeintegral for H2/6−C2/6 correlations of the HSQC spectra was used forp-hydroxyphenyl (H) and syringyl (S) units while H2−C2 was used forguaiacyl (G) units. The volume integral of H2−C2 correlation of Gunits was logically doubled because it involves a single correlation.32
The different lignin substructures were normalized to C9 unitsassuming a molecular weight of 220 mg/mmol and 198 mg/mmol forHW and SW, respectively. The molecular weight of ONP was assumedto be equal to that of SW.
■ RESULTS AND DISCUSSIONCarbon Loss. Variation in carbon loss from anaerobic
decomposition of different lignocellulosic materials representa-tive of MSW components was observed (Figure 2). The highcarbon losses in the copy paper positive control demonstratethe viability and the suitability of the anaerobic inocula toanaerobically convert substrate to methane. While methaneyields were not measured, the gas composition data over theentire incubation period showed that the gas produced wasmethane and carbon dioxide. The carbon losses observed inHW and ONP were comparable, while the lowest carbon losswas recorded in SW. The carbon losses presented in Figure 2are higher than previously reported using laboratory-scaledecomposition experiments.42,43 The differences in carbon lossare perhaps a result of the smaller particle size and lower solidsto liquid ratio in BMP tests conducted here relative to reactorstudies designed to measure methane yields under simulatedlandfill conditions in which materials were shredded (3 × 4 cm)and had a higher solids to liquid ratio.The inoculum used in this study was enriched on copy paper
which does not contain significant amounts of lignin. This mayhave promoted changes in the relative abundance of differentmicrobial communities in the culture. However, the carbonlosses measured in this study for lignocellulosic substrates arecomparable to values reported previously in tests with aninoculum enriched on MSW that would contain lignocellulosic
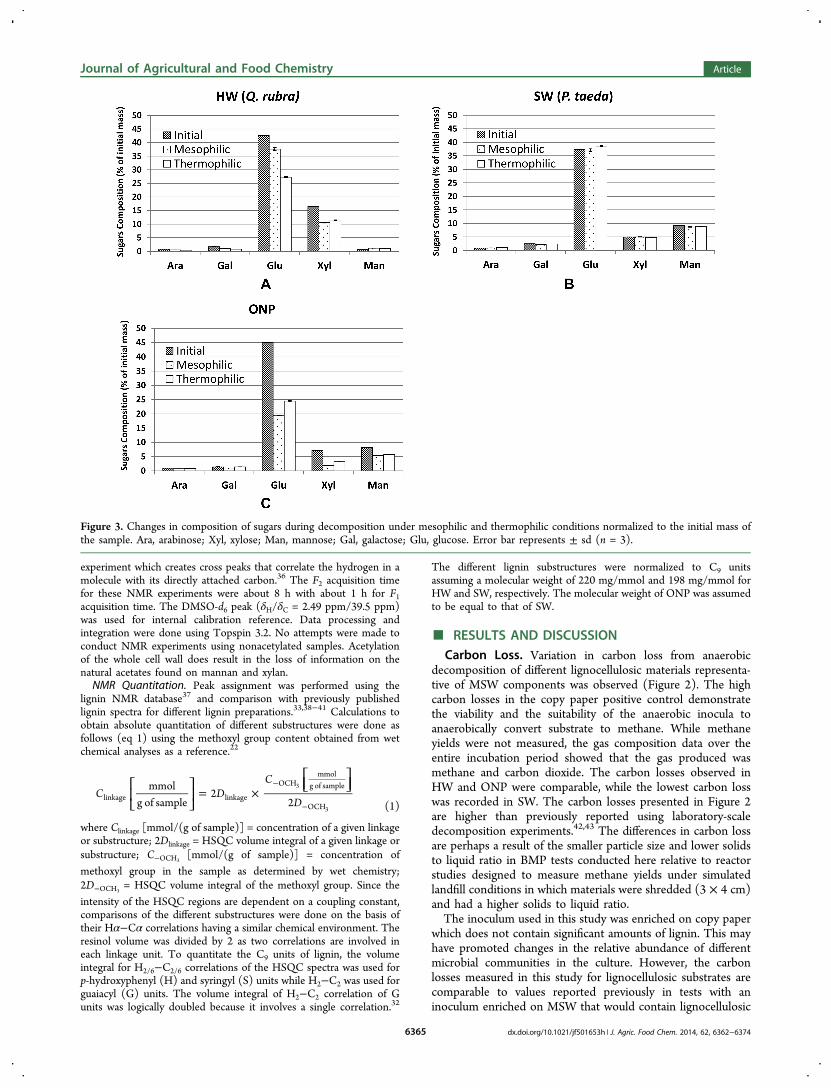
Figure 3. Changes in composition of sugars during decomposition under mesophilic and thermophilic conditions normalized to the initial mass ofthe sample. Ara, arabinose; Xyl, xylose; Man, mannose; Gal, galactose; Glu, glucose. Error bar represents ± sd (n = 3).
Journal of Agricultural and Food Chemistry Article
dx.doi.org/10.1021/jf501653h | J. Agric. Food Chem. 2014, 62, 6362−63746365
substrates.9,42,43 Thus, the use of a lignin-free inoculum did notinfluence the extent of decomposition and the measured Cconversions. This suggests that all of the readily degradablesubstrates have been depleted or that the accessibility to thereadily degradable substrates is limited by the lignin in whichthe polysaccharides are encased, putting pressure on micro-organisms to utilize more recalcitrant substrates such as lignin.Structural Carbohydrates. The plant cell wall is
composed of the structural carbohydrates cellulose andhemicelluloses, which account for the majority of its drymass. Cellulose is a homopolymer of glucose linked together byβ (1→4) glycosidic linkages. The linear structure of cellulosemakes up its crystalline tertiary structure, which is the buildingblock of cellulose microfibril. Hemicelluloses are heteropol-ymers of different sugar residues, the composition of whichvaries according to tissue type. Evidence has shown thathemicelluloses link cellulose microfibrils and lignin together,making up the cell wall lignocellulose composite.44 The plantcell wall’s rigidity and chemical reactivity is attributed to theseintricate and complex associations between lignin and structuralcarbohydrates.The changes in sugar residues after anaerobic decomposition
of different lignocellulosic materials could provide insights onthe reactivity and the preferential attack of anaerobicmicroorganisms to the different cell wall carbohydrates (Figure3). For HW, the major sugar residues are glucose from celluloseand xylose from xylan, with xylan being a major component inangiosperms. About 12% and 36% of the initial glucose andabout 36% and 30% of the initial xylose were lost aftermesophilic and thermophilic anaerobic decomposition, respec-tively.
No significant change in sugars was observed in SW (Figure3). This result is surprising because we observed relatively smallbut significant C losses in SW for both mesophilic andthermophilic decomposition (Figure 2). The result of thesugars analysis suggests that the methane and carbon dioxidemineralization in softwood did not come from cellulose andhemicelluloses.In contrast, in ONP, a SW mechanical pulp based on CuO
oxidation products (Figure 4), the glucose loss was 57% and46%, while mannose loss was about 34% and 30% formesophilic and thermophilic decomposition, respectively.Mannose sugar residue comes from glucomannan, which is amajor component of SW hemicelluloses. The data suggests thatthe conversion of cell wall sugars is highly correlated tobioavailability rather than the differences in the reactivity ofindividual sugars.While ONP was derived from SW pulp, its decomposition
behavior is significantly different from the SW that was tested.Significant carbon loss from cellulose and hemicelluloses wasrecorded in ONP. This demonstrates the effect of mechanicalpulping as well as the role of lignin on the accessibility/bioavailability of cellulose and hemicelluloses in SW. Mechan-ical pulping could involve mechanical, thermal, and somechemical processes, resulting in chemical modifications of ligninleading to disruption of the S2 layer and releasing the cellulosefiber. This process is different from Wiley milling used duringsample preparation, which is a mechanical process of particlesize reduction.
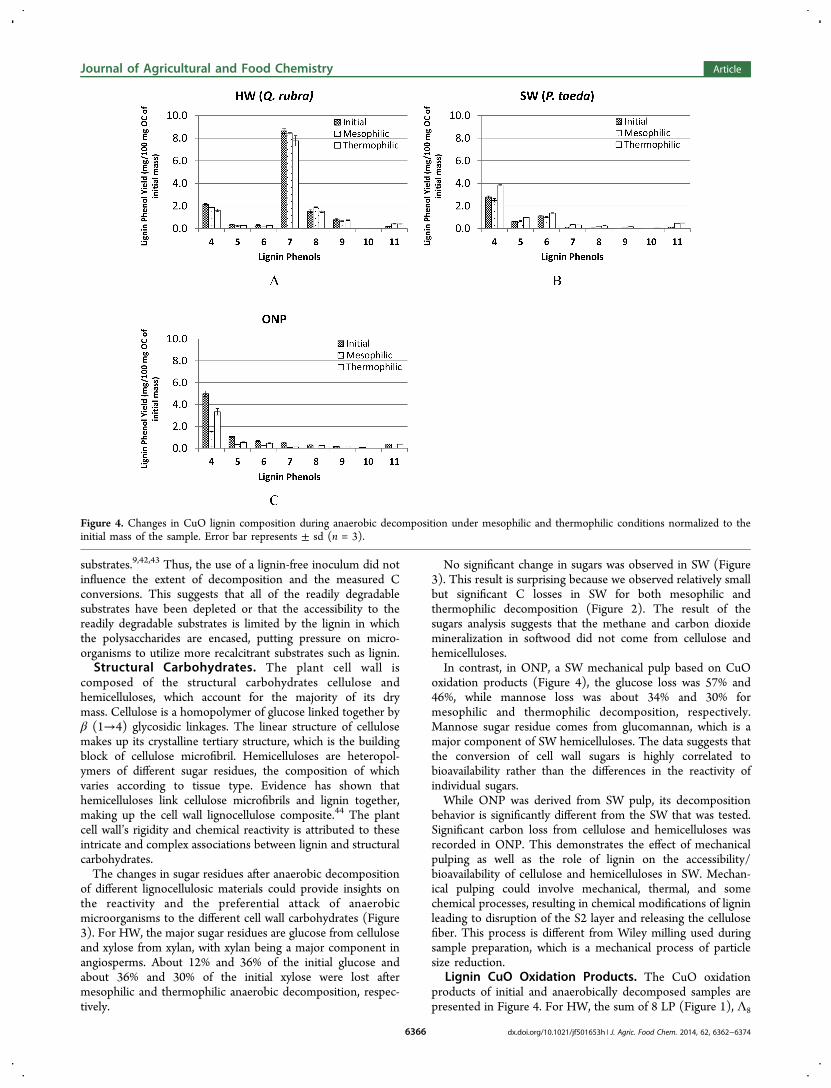
Lignin CuO Oxidation Products. The CuO oxidationproducts of initial and anaerobically decomposed samples arepresented in Figure 4. For HW, the sum of 8 LP (Figure 1), Λ8
Figure 4. Changes in CuO lignin composition during anaerobic decomposition under mesophilic and thermophilic conditions normalized to theinitial mass of the sample. Error bar represents ± sd (n = 3).
Journal of Agricultural and Food Chemistry Article
dx.doi.org/10.1021/jf501653h | J. Agric. Food Chem. 2014, 62, 6362−63746366
[Λ8 = LP 4 + LP 5 + LP 6 + LP 7 + LP 8 + LP 9 + LP 10 + LP11, mg/100 mg of organic carbon (OC)], after mesophilic andthermophilic decomposition is not significantly different whencompared with the initial material (14.0 ± 0.6 mg/100 mg ofOC). The Λ8 is a measure of total releasable CuO ligninmonomers normalized to OC and could indicate degradation/repolymerization of lignin during decomposition. The p-hydroxy phenols (LP 1, 2, and 3 in Figure 1) could havenonlignin sources such as amino acids tyrosine and phenyl-alanine and therefore were excluded from the sum of LP.Similarly, for HW, the acid (LP 6) to aldehyde (LP 4) ratios ofvanillyl phenols (Ad/Al)V of the initial material (0.15) and aftermesophilic (0.12) and thermophilic (0.17) decomposition arenot significantly different (p > 0.05) from each other. The (Ad/Al)V is a measure of the extent of degradation of lignin. Theresult suggests that HW lignin was not significantly degradedafter anaerobic decomposition.For SW, the Λ8 of mesophilic decomposed substrate (5.3 ±
0.3 mg/100 mg of OC) is not significantly different whencompared with the initial material (4.9 ± 0.2 mg/100 mg ofOC). The Λ8 increase in thermophilic (7.5 ± 0.2 mg/100 mgof OC) is anomalous, and there is no indication that it is aresult of decomposition as indicated by the constant (Ad/Al)Vof 0.4 for SW initial material, after mesophilic and afterthermophilic decomposition.The CuO oxidation products of lignin can also be used as a
biomarker to fingerprint the plant tissue source of lignin in anunknown sample.45 The ratio of S (S = LP 7 + LP 8 + LP 9) tovanillyl (V) (V = LP 4 + LP 5 + LP 6) (S/V) has been used todiscriminate between angiosperm (HW, leaves, and grasses)and gymnosperm (SW and needles) tissues while the ratio ofcinnamyl (C) (C = LP 10 + LP 11) to V phenols (C/V) hasbeen used to discriminate between woody (HW and SW) andnonwoody (leaves, grasses, and needles) tissues.45 The low C/V and low S/V ratios indicate that the source of lignin in ONPis softwood.While the lignin CuO oxidation products of ONP are similar
to those of SW, their decomposition behaviors are different.Significant loss of VAL phenols was recorded in ONP for bothmesophilic and thermophilic decomposition. The (Ad/Al)V offresh ONP (0.13) is not significantly different from those ofmaterials decomposed under mesophilic (0.15) and thermo-philic (0.14) conditions (p > 0.05). This indicates that thelignin polymer has not been significantly depolymerized duringdecomposition. The loss of VAL without a correspondingincrease in (Ad/Al)V is an indication that no significant lignincleavage occurred during anaerobic decomposition of ONP.This result suggests that reaction of VAL is limited to side chainoxidation without destruction of the aromatic structure.Lignin Methoxyl Group. Losses in lignin methoxyl group
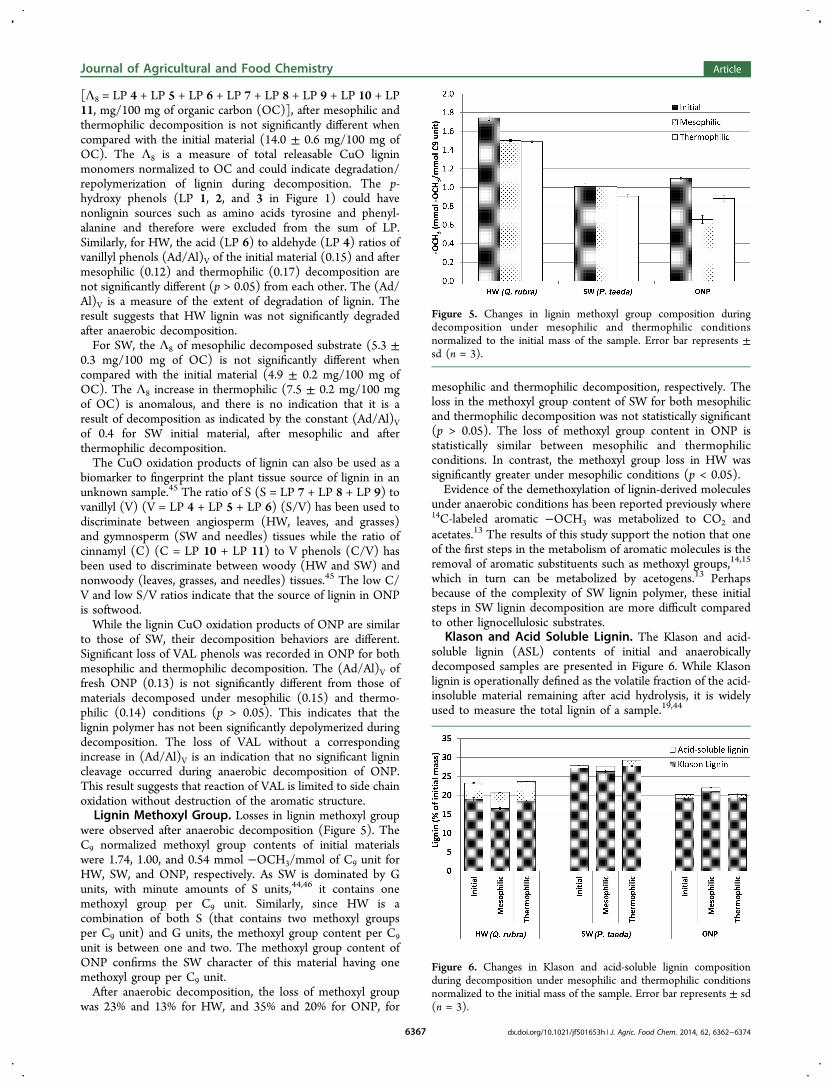
were observed after anaerobic decomposition (Figure 5). TheC9 normalized methoxyl group contents of initial materialswere 1.74, 1.00, and 0.54 mmol −OCH3/mmol of C9 unit forHW, SW, and ONP, respectively. As SW is dominated by Gunits, with minute amounts of S units,44,46 it contains onemethoxyl group per C9 unit. Similarly, since HW is acombination of both S (that contains two methoxyl groupsper C9 unit) and G units, the methoxyl group content per C9unit is between one and two. The methoxyl group content ofONP confirms the SW character of this material having onemethoxyl group per C9 unit.After anaerobic decomposition, the loss of methoxyl group
was 23% and 13% for HW, and 35% and 20% for ONP, for
mesophilic and thermophilic decomposition, respectively. Theloss in the methoxyl group content of SW for both mesophilicand thermophilic decomposition was not statistically significant(p > 0.05). The loss of methoxyl group content in ONP isstatistically similar between mesophilic and thermophilicconditions. In contrast, the methoxyl group loss in HW wassignificantly greater under mesophilic conditions (p < 0.05).Evidence of the demethoxylation of lignin-derived molecules
under anaerobic conditions has been reported previously where14C-labeled aromatic −OCH3 was metabolized to CO2 andacetates.13 The results of this study support the notion that oneof the first steps in the metabolism of aromatic molecules is theremoval of aromatic substituents such as methoxyl groups,14,15
which in turn can be metabolized by acetogens.13 Perhapsbecause of the complexity of SW lignin polymer, these initialsteps in SW lignin decomposition are more difficult comparedto other lignocellulosic substrates.
Klason and Acid Soluble Lignin. The Klason and acid-soluble lignin (ASL) contents of initial and anaerobicallydecomposed samples are presented in Figure 6. While Klasonlignin is operationally defined as the volatile fraction of the acid-insoluble material remaining after acid hydrolysis, it is widelyused to measure the total lignin of a sample.19,44
Figure 5. Changes in lignin methoxyl group composition duringdecomposition under mesophilic and thermophilic conditionsnormalized to the initial mass of the sample. Error bar represents ±sd (n = 3).
Figure 6. Changes in Klason and acid-soluble lignin compositionduring decomposition under mesophilic and thermophilic conditionsnormalized to the initial mass of the sample. Error bar represents ± sd(n = 3).
Journal of Agricultural and Food Chemistry Article
dx.doi.org/10.1021/jf501653h | J. Agric. Food Chem. 2014, 62, 6362−63746367
The loss of HW Klason lignin under mesophilic conditions(13%) was significant (p < 0.05) while no significant differencewas observed under thermophilic conditions. In contrast, lossesof HW ASL were significant only under thermophilicconditions. In some tissues such as in nonwoody angiosperms,the amount of ASL can be significant. Moreover, the amount ofASL could also be an indicator of the extent of decompositionas some lignin can be broken down to lower molecular weightfractions and then to soluble fractions rendering them moreamenable to anaerobic decomposition. There was no significantchange in either Klason lignin or ASL in ONP.There were no significant losses in either Klason lignin or
ASL for SW. As noted above, anaerobic decomposition of SWresulted in a small but significant carbon loss. It is interesting tonote, however, that, based on chemical analyses, the carbon lossrecorded in SW was not due to the cellulose, hemicelluloses, orlignin but from other components. To evaluate whether thisobservation is plausible, the amount of carbon that can beattributed to these major lignocellulosic components wasestimated assuming empirical formulas for cellulose, hemi-celluloses, and lignin as (C6H10O5)n, (C5H8O4)n, andC(9)H(7.92)O(2.40)(OCH3)(0.92), respectively. Based on theempirical formulas and their corresponding compositions,about 85% of the carbon in SW can be attributed to cellulose,hemicelluloses, and lignin. Thus, the uncharacterized cellcomponents of SW (e.g., proteins, tannins, extractives, etc.),amounting to about 15% of the total carbon (estimated bydifference), in theory could explain the observed carbon loss.This possibility is supported by the result of extractives in thesoftwood sample which was determined to be 17 ± 0.73% ofthe initial mass.
It is well-documented that SW lignin is dominated by Gunits. This lignin unit is more complex because of morebranching as a result of the availability of the 5-position inlignin phenolic units to cross-link, making the SW ligninpolymer more difficult to depolymerize.19,44 Moreover, thecomplex structure of SW lignin hinders microbial enzymeaccess to structural carbohydrates, resulting in minormineralization of cellulose, hemicelluloses, and lignin.
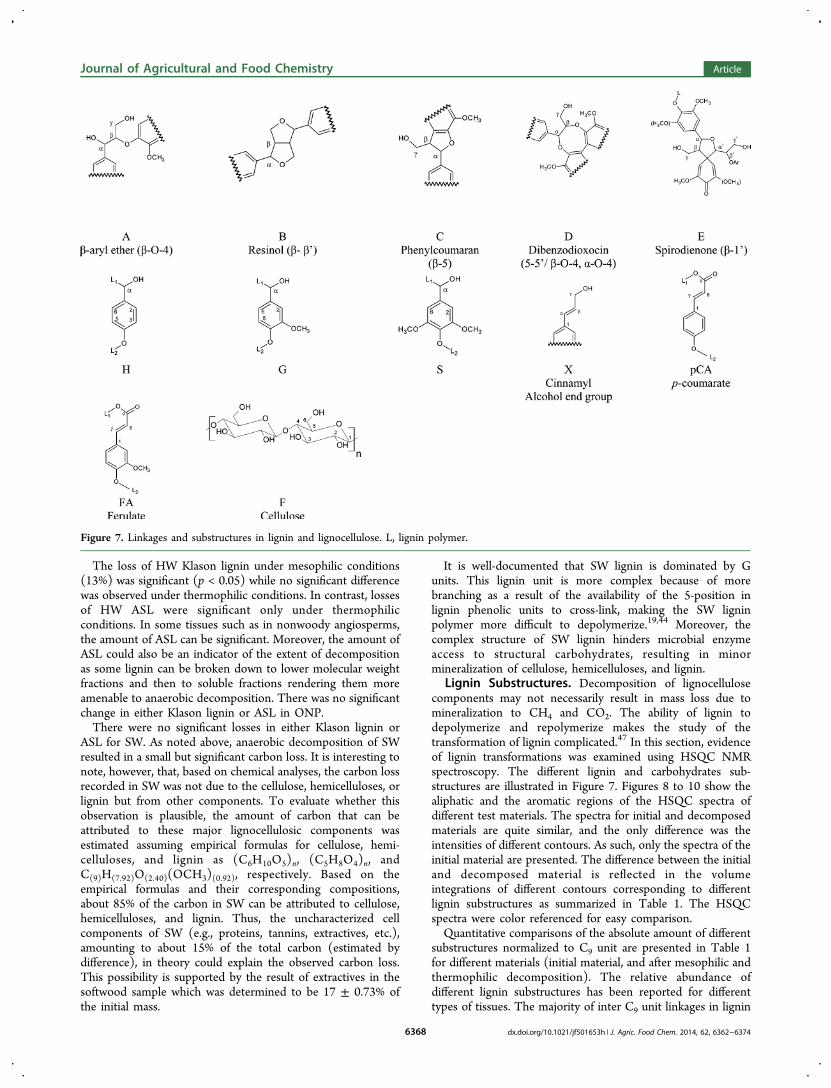
Lignin Substructures. Decomposition of lignocellulosecomponents may not necessarily result in mass loss due tomineralization to CH4 and CO2. The ability of lignin todepolymerize and repolymerize makes the study of thetransformation of lignin complicated.47 In this section, evidenceof lignin transformations was examined using HSQC NMRspectroscopy. The different lignin and carbohydrates sub-structures are illustrated in Figure 7. Figures 8 to 10 show thealiphatic and the aromatic regions of the HSQC spectra ofdifferent test materials. The spectra for initial and decomposedmaterials are quite similar, and the only difference was theintensities of different contours. As such, only the spectra of theinitial material are presented. The difference between the initialand decomposed material is reflected in the volumeintegrations of different contours corresponding to differentlignin substructures as summarized in Table 1. The HSQCspectra were color referenced for easy comparison.Quantitative comparisons of the absolute amount of different
substructures normalized to C9 unit are presented in Table 1for different materials (initial material, and after mesophilic andthermophilic decomposition). The relative abundance ofdifferent lignin substructures has been reported for differenttypes of tissues. The majority of inter C9 unit linkages in lignin
Figure 7. Linkages and substructures in lignin and lignocellulose. L, lignin polymer.
Journal of Agricultural and Food Chemistry Article
dx.doi.org/10.1021/jf501653h | J. Agric. Food Chem. 2014, 62, 6362−63746368
are β-O-4, followed by significantly smaller and varyingamounts of resinol, phenylcoumaran, spirodienone, anddibenzodioxocin structures (Figure 7). For example, in whitebirch (Betula pendula Roth) MWL, the relative abundance oflignin inter C9 unit linkages is about 69% β-O-4, 17% resinol,3% phenylcoumaran, and 4% spirodienone estimated from 2DHSQC spectra.48
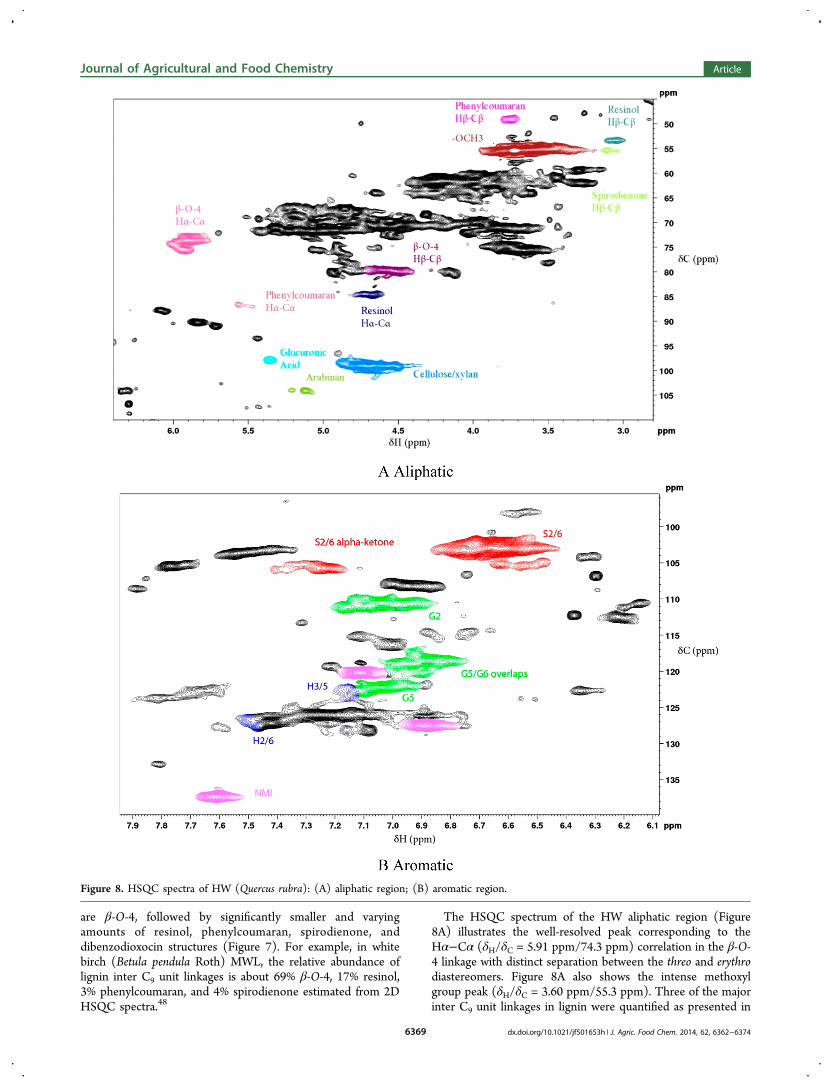
The HSQC spectrum of the HW aliphatic region (Figure8A) illustrates the well-resolved peak corresponding to theHα−Cα (δH/δC = 5.91 ppm/74.3 ppm) correlation in the β-O-4 linkage with distinct separation between the threo and erythrodiastereomers. Figure 8A also shows the intense methoxylgroup peak (δH/δC = 3.60 ppm/55.3 ppm). Three of the majorinter C9 unit linkages in lignin were quantified as presented in
Figure 8. HSQC spectra of HW (Quercus rubra): (A) aliphatic region; (B) aromatic region.
Journal of Agricultural and Food Chemistry Article
dx.doi.org/10.1021/jf501653h | J. Agric. Food Chem. 2014, 62, 6362−63746369
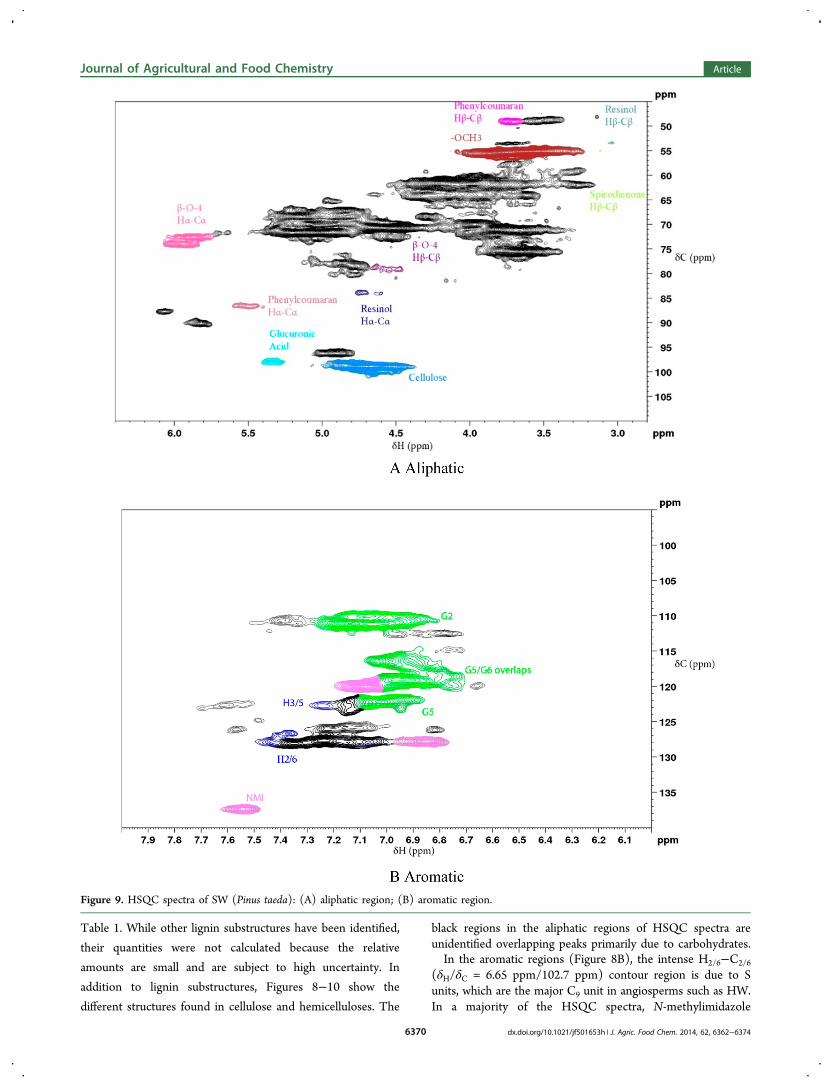
Table 1. While other lignin substructures have been identified,
their quantities were not calculated because the relative
amounts are small and are subject to high uncertainty. In
addition to lignin substructures, Figures 8−10 show the
different structures found in cellulose and hemicelluloses. The
black regions in the aliphatic regions of HSQC spectra areunidentified overlapping peaks primarily due to carbohydrates.In the aromatic regions (Figure 8B), the intense H2/6−C2/6
(δH/δC = 6.65 ppm/102.7 ppm) contour region is due to Sunits, which are the major C9 unit in angiosperms such as HW.In a majority of the HSQC spectra, N-methylimidazole
Figure 9. HSQC spectra of SW (Pinus taeda): (A) aliphatic region; (B) aromatic region.
Journal of Agricultural and Food Chemistry Article
dx.doi.org/10.1021/jf501653h | J. Agric. Food Chem. 2014, 62, 6362−63746370
contamination due to incomplete washing was detected. This
did not affect the NMR quantification as N-methylimidazole
peaks did not overlap with regions that were used for
quantification. The H2−C2 correlation in G units is also well-
resolved in the HW aromatic region of the HSQC spectra. The
low proportion of H is a characteristic of woody tissues.
As expected, the major lignin inter C9 unit linkage is β-O-4. A
slight reduction in the amount of this linkage in HW for
mesophilic and thermophilic decomposition respectively was
observed (Table 1). Anaerobic decomposition resulted in a
decrease in the amount of β-O-4 linkage brought about by α-
oxidation. For both mesophilic and thermophilic anaerobic
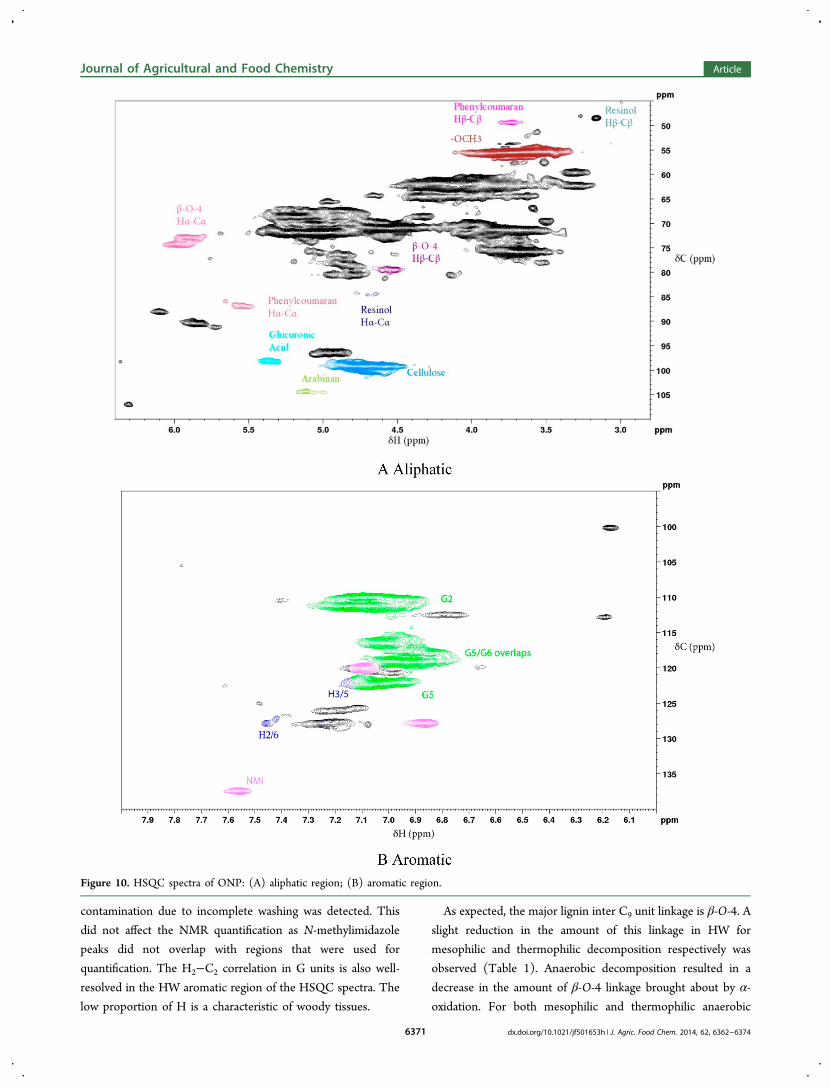
Figure 10. HSQC spectra of ONP: (A) aliphatic region; (B) aromatic region.
Journal of Agricultural and Food Chemistry Article
dx.doi.org/10.1021/jf501653h | J. Agric. Food Chem. 2014, 62, 6362−63746371
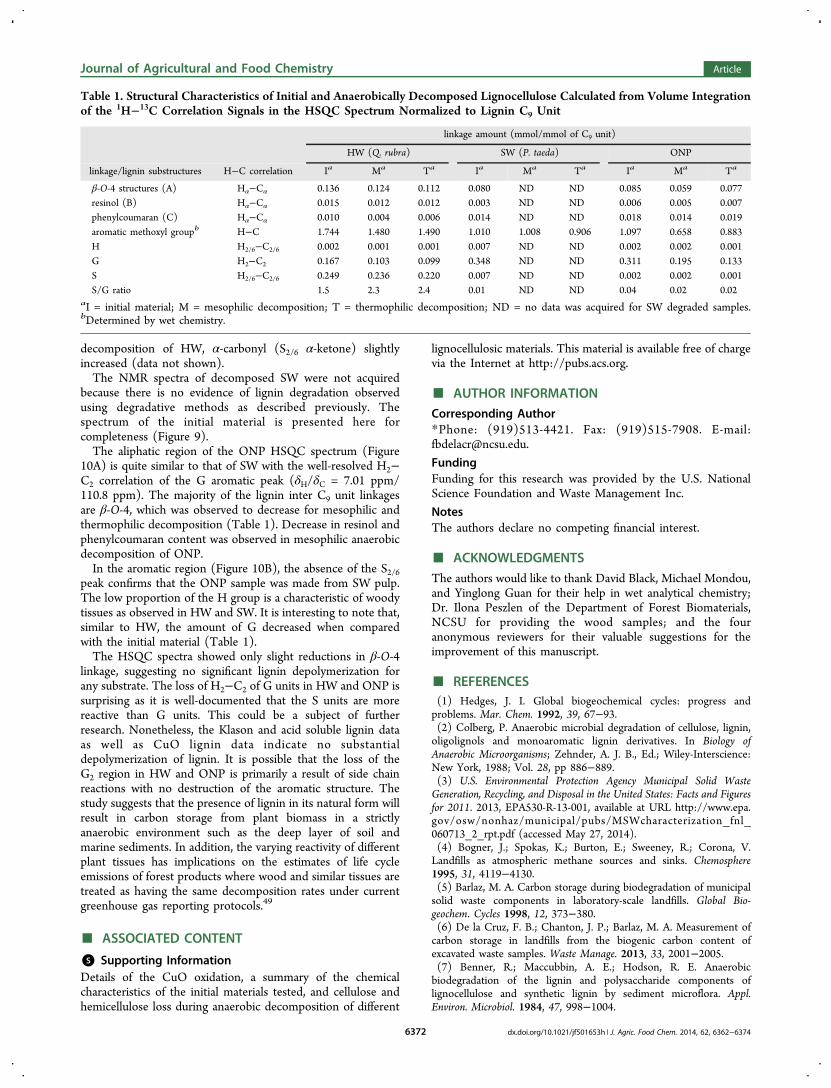
decomposition of HW, α-carbonyl (S2/6 α-ketone) slightlyincreased (data not shown).The NMR spectra of decomposed SW were not acquired
because there is no evidence of lignin degradation observedusing degradative methods as described previously. Thespectrum of the initial material is presented here forcompleteness (Figure 9).The aliphatic region of the ONP HSQC spectrum (Figure
10A) is quite similar to that of SW with the well-resolved H2−C2 correlation of the G aromatic peak (δH/δC = 7.01 ppm/110.8 ppm). The majority of the lignin inter C9 unit linkagesare β-O-4, which was observed to decrease for mesophilic andthermophilic decomposition (Table 1). Decrease in resinol andphenylcoumaran content was observed in mesophilic anaerobicdecomposition of ONP.In the aromatic region (Figure 10B), the absence of the S2/6
peak confirms that the ONP sample was made from SW pulp.The low proportion of the H group is a characteristic of woodytissues as observed in HW and SW. It is interesting to note that,similar to HW, the amount of G decreased when comparedwith the initial material (Table 1).The HSQC spectra showed only slight reductions in β-O-4
linkage, suggesting no significant lignin depolymerization forany substrate. The loss of H2−C2 of G units in HW and ONP issurprising as it is well-documented that the S units are morereactive than G units. This could be a subject of furtherresearch. Nonetheless, the Klason and acid soluble lignin dataas well as CuO lignin data indicate no substantialdepolymerization of lignin. It is possible that the loss of theG2 region in HW and ONP is primarily a result of side chainreactions with no destruction of the aromatic structure. Thestudy suggests that the presence of lignin in its natural form willresult in carbon storage from plant biomass in a strictlyanaerobic environment such as the deep layer of soil andmarine sediments. In addition, the varying reactivity of differentplant tissues has implications on the estimates of life cycleemissions of forest products where wood and similar tissues aretreated as having the same decomposition rates under currentgreenhouse gas reporting protocols.49
■ ASSOCIATED CONTENT
*S Supporting InformationDetails of the CuO oxidation, a summary of the chemicalcharacteristics of the initial materials tested, and cellulose andhemicellulose loss during anaerobic decomposition of different
lignocellulosic materials. This material is available free of chargevia the Internet at http://pubs.acs.org.
■ AUTHOR INFORMATION
Corresponding Author*Phone: (919)513-4421. Fax: (919)515-7908. E-mail:[email protected].
FundingFunding for this research was provided by the U.S. NationalScience Foundation and Waste Management Inc.
NotesThe authors declare no competing financial interest.
■ ACKNOWLEDGMENTS
The authors would like to thank David Black, Michael Mondou,and Yinglong Guan for their help in wet analytical chemistry;Dr. Ilona Peszlen of the Department of Forest Biomaterials,NCSU for providing the wood samples; and the fouranonymous reviewers for their valuable suggestions for theimprovement of this manuscript.
■ REFERENCES(1) Hedges, J. I. Global biogeochemical cycles: progress andproblems. Mar. Chem. 1992, 39, 67−93.(2) Colberg, P. Anaerobic microbial degradation of cellulose, lignin,oligolignols and monoaromatic lignin derivatives. In Biology ofAnaerobic Microorganisms; Zehnder, A. J. B., Ed.; Wiley-Interscience:New York, 1988; Vol. 28, pp 886−889.(3) U.S. Environmental Protection Agency Municipal Solid WasteGeneration, Recycling, and Disposal in the United States: Facts and Figuresfor 2011. 2013, EPA530-R-13-001, available at URL http://www.epa.gov/osw/nonhaz/municipal/pubs/MSWcharacterization_fnl_060713_2_rpt.pdf (accessed May 27, 2014).(4) Bogner, J.; Spokas, K.; Burton, E.; Sweeney, R.; Corona, V.Landfills as atmospheric methane sources and sinks. Chemosphere1995, 31, 4119−4130.(5) Barlaz, M. A. Carbon storage during biodegradation of municipalsolid waste components in laboratory-scale landfills. Global Bio-geochem. Cycles 1998, 12, 373−380.(6) De la Cruz, F. B.; Chanton, J. P.; Barlaz, M. A. Measurement ofcarbon storage in landfills from the biogenic carbon content ofexcavated waste samples. Waste Manage. 2013, 33, 2001−2005.(7) Benner, R.; Maccubbin, A. E.; Hodson, R. E. Anaerobicbiodegradation of the lignin and polysaccharide components oflignocellulose and synthetic lignin by sediment microflora. Appl.Environ. Microbiol. 1984, 47, 998−1004.
Table 1. Structural Characteristics of Initial and Anaerobically Decomposed Lignocellulose Calculated from Volume Integrationof the 1H−13C Correlation Signals in the HSQC Spectrum Normalized to Lignin C9 Unit
linkage amount (mmol/mmol of C9 unit)
HW (Q. rubra) SW (P. taeda) ONP
linkage/lignin substructures H−C correlation Ia Ma Ta Ia Ma Ta Ia Ma Ta
β-O-4 structures (A) Hα−Cα 0.136 0.124 0.112 0.080 ND ND 0.085 0.059 0.077resinol (B) Hα−Cα 0.015 0.012 0.012 0.003 ND ND 0.006 0.005 0.007phenylcoumaran (C) Hα−Cα 0.010 0.004 0.006 0.014 ND ND 0.018 0.014 0.019aromatic methoxyl groupb H−C 1.744 1.480 1.490 1.010 1.008 0.906 1.097 0.658 0.883H H2/6−C2/6 0.002 0.001 0.001 0.007 ND ND 0.002 0.002 0.001G H2−C2 0.167 0.103 0.099 0.348 ND ND 0.311 0.195 0.133S H2/6−C2/6 0.249 0.236 0.220 0.007 ND ND 0.002 0.002 0.001S/G ratio 1.5 2.3 2.4 0.01 ND ND 0.04 0.02 0.02
aI = initial material; M = mesophilic decomposition; T = thermophilic decomposition; ND = no data was acquired for SW degraded samples.bDetermined by wet chemistry.
Journal of Agricultural and Food Chemistry Article
dx.doi.org/10.1021/jf501653h | J. Agric. Food Chem. 2014, 62, 6362−63746372
(8) Benner, R.; Hodson, R. E. Thermophilic anaerobic biodegrada-tion of [C-14] lignin, [C-14] cellulose, and [C-14] lignocellulosepreparations. Appl. Environ. Microbiol. 1985, 50, 971−976.(9) Wang, Y. S.; Byrd, C. S.; Barlaz, M. Anaerobic biodegradability ofcellulose and hemicellulose in excavated refuse samples using abiochemical methane potential assay. J. Ind. Microbiol. 1994, 13, 147−153.(10) Zeikus, J.; Wellstein, A.; Kirk, T. Molecular basis for thebiodegradative recalcitrance of lignin in anaerobic environments.FEMS Microbiol. Lett. 1982, 15, 193−197.(11) Colberg, P.; Young, L. Anaerobic degradation of solublefractions of [C-14-lignin] lignocellulose. Appl. Environ. Microbiol. 1985,49, 345.(12) Stinson, J. A.; Ham, R. K. Effect of lignin on the anaerobicdecomposition of cellulose as determined through the use of abiochemical methane potential method. Environ. Sci. Technol. 1995, 29,2305−2310.(13) Young, L. Y.; Frazer, A. C. The fate of lignin and lignin-derivedcompounds in anaerobic environments. Geomicrobiol. J. 1987, 5, 261.(14) Heider, J.; Fuchs, G. Anaerobic metabolism of aromaticcompounds. Eur. J. Biochem. 1997, 243, 577−596.(15) Harwood, C. S.; Burchhardt, G.; Herrmann, H.; Fuchs, G.Anaerobic metabolism of aromatic compounds via the benzoyl-CoApathway. FEMS Microbiol. Rev. 1998, 22, 439−458.(16) Crawford, R. L. Lignin biodegradation and transformation; Wiley:New York, 1981; pp 154.(17) Lai, Y. Z.; Sarkanen, K. V. Isolation and structural studies. InLignins: occurrence, formation, structure and reactions, 1st ed.; Sarkanen,K. V., Ludwig, C. H., Eds.; Wiley-Interscience: New York, 1971; Vol. 1,pp 165−240.(18) Santos, R. B.; Capanema, E. A.; Balakshin, M. Y.; Chang, Hou-Min; Jameel, H. Effect of hardwoods characteristics on Kraft pulpingprocess: emphasis on lignin structure. BioResources 2011, 6, 3623−3637.(19) Lin, S. Y.; Dence, C. W. Methods in lignin chemistry; Springer-Verlag: Berlin, New York, 1992; pp 578.(20) Benner, R.; Mccubbin, A. E.; Hodson, R. E. Preparation,characterization, and microbial-degradation of specifically radiolabeled[C14] lignocelluloses from marine and fresh-water macrophytes. Appl.Environ. Microbiol. 1984, 47, 381.(21) Lu, F.; Ralph, J. Non-degradative dissolution and acetylation ofball-milled plant cell walls: high-resolution solution-state NMR. PlantJ. 2003, 35, 535−544.(22) Yelle, D. J.; Ralph, J.; Lu, F.; Hammel, K. E. Evidence forcleavage of lignin by a brown rot Basidiomycete. Environ. Microbiol.2008, 10, 1844−1849.(23) Chundawat, S. P. S.; Donohoe, B. S.; da Costa Sousa, L.; Elder,T.; Agarwal, U. P.; Lu, F.; Ralph, J.; Himmel, M. E.; Balan, V.; Dale, B.E. Multi-scale visualization and characterization of lignocellulosic plantcell wall deconstruction during thermochemical pretreatment. EnergyEnviron. Sci. 973−984.(24) Glasser, W. G., Sarkanen, S., Eds. Lignin: properties andmaterials; ACS Symposium Series; American Chemical Society:Washington, DC, 1989; Vol. 397, 545 pp.(25) Lobbes, J.; Fitznar, H.; Kattner, G. High-performance liquidchromatography of lignin-derived phenols in environmental sampleswith diode array detection. Anal. Chem. 1999, 71, 3008−3012.(26) Steinberg, S.; Venkatesan, M. I.; Kaplan, I. R. Analysis of theproducts of the oxidation of lignin by CuO in biological and geologicalsamples by reversed-phase high-performance liquid chromatography. J.Chromatogr. A 1984, 298, 427−434.(27) Petterson, R. C.; Schwandt, V. H. Wood sugar analysis by anionchromatography. J. Wood Chem. Technol. 1991, 11, 495−501.(28) Davis, M. W. A Rapid modified method for compositionalcarbohydrate analysis of lignocellulosics by high pH anion-exchangechromatography with pulsed amperometric detection (HPAEC/PAD).J. Wood Chem. Technol. 1998, 18, 235−252.
(29) Maekawa, E.; Ichizawa, T.; Koshijima, T. An evaluation of theacid-soluble lignin determination in analyses of lignin by the sulfuricacid method. J. Wood Chem. Technol. 1989, 9, 549−567.(30) Ryba, S. A.; Burgess, R. M. Effects of sample preparation on themeasurement of organic carbon, hydrogen, nitrogen, sulfur, andoxygen concentrations in marine sediments. Chemosphere 2002, 48,139−147.(31) Li, H.; Chai, X.; Liu, M.; Deng, Y. Novel method for thedetermination of the methoxyl content in lignin by headspace gaschromatography. J. Agric. Food Chem. 2012, 60, 5307−5310.(32) Mansfield, S. D.; Kim, H.; Lu, F.; Ralph, J. Whole plant cell wallcharacterization using solution-state 2D NMR. Nat. Protoc. 2012, 7,1579−1589.(33) Yelle, D. J.; Ralph, J.; Frihart, C. R. Characterization ofnonderivatized plant cell walls using high-resolution solution-stateNMR spectroscopy. Magn. Reson. Chem. 2008, 46, 508−517.(34) Ikeda, T.; Holtman, K.; Kadla, J. F.; Chang, H.; Jameel, H.Studies on the effect of ball milling on lignin structure using a modifiedDFRC method. J. Agric. Food Chem. 2002, 50, 129−135.(35) Holtman, K. M.; Chang, H.; Jameel, H.; Kadla, J. F. Quantitative
13C NMR characterization of milled wood lignins isolated by differentmilling techniques. J. Wood Chem. Technol. 2006, 26, 21−34.(36) Claridge, T. D. High-resolution NMR Techniques in OrganicChemistry; Elsevier Ltd.: Amsterdam, The Netherlands, 2009; Vol. 27,383 pp.(37) Ralph, S. A.; Ralph, J.; Landucci, L. L. NMR Database of Ligninand Cell Wall Model Compounds. Available at URL http://ars.usda.gov/Services/docs.htm?docid=10491. 2004 (accessed April 1, 2014).(38) Ralph, J.; Marita, J. M.; Ralph, S. A.; Hatfield, R. D.; Lu, F.; Ede,R. M.; Peng, J.; Quideau, S.; Helm, R. F.; Grabber, J. H.; Kim, H.;Jimenez- Monteon, G.; Zhang, Y.; Jung, H. G.; Landucci, L. L.;MacKay, J. J.; Sederoff, R. R.; Chapple, B.; Clint, A. M. Solution-StateNMR of Lignins. In Advances in Lignocellulosics characterization;Argyropoulos, D. S., Williams, P. A., Eds.; TAPPI Press: Atlanta, GA,1999; pp 55−108.(39) Ralph, J.; Lundquist, K.; Brunow, G.; Lu, F.; Kim, H.; Schatz, P.;Marita, J.; Hatfield, R.; Ralph, S.; Christensen, J.; Boerjan, W. Lignins:Natural polymers from oxidative coupling of 4-hydroxyphenyl-propanoids. Phytochem. Rev. 2004, 3, 29−60.(40) Ibarra, D.; Chavez, M. I.; Rencoret, J.; del Río, J. C.; Gutierrez,A.; Romero, J.; Camarero, S.; Martínez, M. J.; Jimenez-Barbero, J.;Martínez, A. T. Structural modification of eucalypt pulp lignin in atotally chlorine-free bleaching sequence including a laccase-mediatorstage. Holzforschung 2007, 61, 634.(41) Rencoret, J.; Marques, G.; Gutierrez, A.; Nieto, L.; Santos, I. J.;Jimenez-Barbero, J.; Martínez, A. T.; del Río, J. C. HSQC-NMRanalysis of lignin in woody (Eucalyptus globulus and Picea abies) andnon-woody (Agave sisalana) ball-milled plant materials at the gel state.Holzforschung 2009, 63, 691−698.(42) Wang, X.; Padgett, J. M.; De la Cruz, F. B.; Barlaz, M. A. Woodbiodegradation in laboratory-scale landfills. Environ. Sci. Technol. 2011,45, 6864−6871.(43) Eleazer, W. E.; Odle, W. S.; Wang, Y. S.; Barlaz, M. A.Biodegradability of municipal solid waste components in laboratory-scale landfills. Environ. Sci. Technol. 1997, 31, 911−917.(44) Sarkanen, K. V.; Ludwig, C. H. Lignins: occurrence, formation,structure and reactions; Wiley-Interscience: New York, 1971; 916 pp.(45) Hedges, J. I.; Mann, D. C. The characterization of plant tissuesby their lignin oxidation products. Geochim. Cosmochim. Acta 1979, 43,1803−1807.(46) Obst, J. R.; Landucci, L. L. The syringyl content of softwoodlignin. J. Wood Chem. Technol. 1986, 6, 311−327.(47) Li, J.; Henriksson, G.; Gellerstedt, G. Lignin depolymerization/repolymerization and its critical role for delignification of aspen woodby steam explosion. Bioresour. Technol. 2007, 98, 3061−3068.(48) Rencoret, J.; del Rio, J. C.; Gutierrez, A.; Martinez, A. T.; Li, S.;Parkas, J.; Lundquist, K. Origin of the acetylated structures present inwhite birch (Betula pendula Roth) milled wood lignin. Wood Sci.Technol. 2012, 46, 459−471.
Journal of Agricultural and Food Chemistry Article
dx.doi.org/10.1021/jf501653h | J. Agric. Food Chem. 2014, 62, 6362−63746373
(49) IPCC Intergovernmental Panel on Climate Change: 2006 IPCCGuidelines for National Greenhouse Gas Inventories: ReferenceManual (Volume 3). IPCC National Greenhouse Gas InventoryProgram. 2006.
Journal of Agricultural and Food Chemistry Article
dx.doi.org/10.1021/jf501653h | J. Agric. Food Chem. 2014, 62, 6362−63746374