Embed Size (px)
Citation preview
China Hotel Market Outlook
Produced in conjunction with the China Tourist Hotel Association | Issue 4 2013Hotels & Hospitality Group
At the end 2012, the new leaders of the Chinese Communist Party were elected on the 18th Party Congress held in Beijing. Since then, the leaders of the 12th NPC (National People’s Congress) Standing Committee were elected on the First Session of the National People’s Congress. During this period, new policies have been carried out during the leadership transition. Faced with a new government structure and political framework, China’s hotel industry has been affected to some extent. Regardless, the tourism industry is still an important foundation of the local economy and a key driver of long term growth.
Last year, the total number of tourist visits reached one billion globally, a record high. The Tourism industry in China maintained strong growth, especially for domestic travel, the largest component of overall tourism growth in 2012. Outbound tourism growth continued to gather pace, while inbound showed an overall decline on the growth levels observed in 2011.
Using some of the cities in China’s New Top 50 Cities Report as a reference, Jones Lang LaSalle Hotels and Hospitality Group (JLL H&H) analysed the supply and demand indicators for China’s hotel market as part of The China Hotel Outlook 2012. In addition, the analysis includes the wider Chinese hotel market fundamentals, taking into consideration the consumer market cycle, hotel asset management and the development of tourism destinations.
Based on the identity and support of respondents to this report over the past three years, China Tourism Hotel Association (CTHA) and Jones Lang LaSalle Hotels and Hospitality Group continued their cooperation and conducted surveys to members of CTHA. Seven additional cities and four new tourist destinations were added to the list of 35 selected cities in the 2012 report. Based on the results from the surveys conducted in these cities and JLL H&H internal databases were used for the research and form the basis of our conclusions.
China Hotel Market Outlook 3
1.1 Survey Background
Amongst the surveys sent to hotels across China, 224 responses were received, representing a total of 63,120 guestrooms. Of the hotels polled, 37.4% were located in North China, 24.6% in East China, 20.1% in West China, 9.4% in South China and the remaining in Central China (8.5%). The geographical distribution of this survey is generally consistent with that of the 2012 questionnaire.
In terms of star rating, 42.0% were 5-star hotels, 33.5% were 4-star hotels, 18.3% were 3-star hotels and the remaining 6.2% were hotels of two-star rating or lower.
For hotel ownership, 41.4% of the properties were state-owned, 38.4% were privately owned and 20.5% were held under other ownership structures, such as joint ventures and foreign-owned enterprises.
With regards to the operational model, 52.7% of hotels were owner-managed, 28.6% operated under a third party management agreement, 6.7% franchised and 12.0% leased or operated under a different model.
1. China Hotel Market – Survey Results
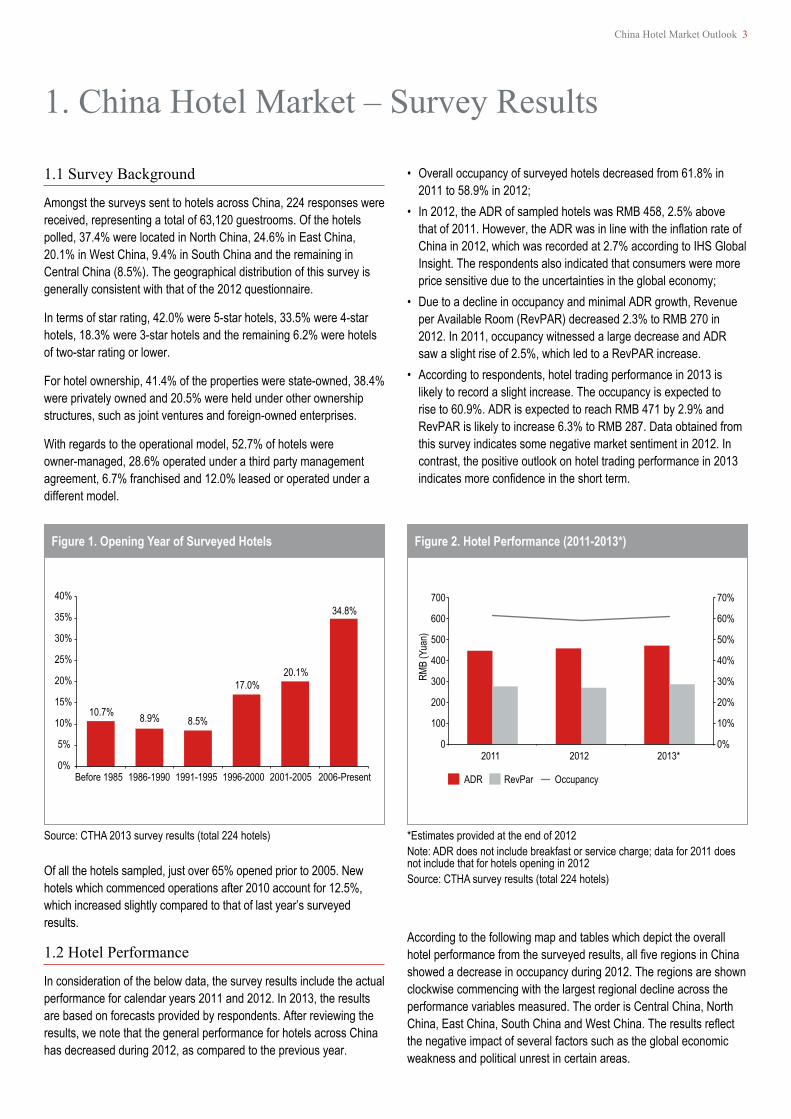
• Overall occupancy of surveyed hotels decreased from 61.8% in 2011 to 58.9% in 2012;
• In 2012, the ADR of sampled hotels was RMB 458, 2.5% above thatof2011.However,theADRwasinlinewiththeinflationrateofChina in 2012, which was recorded at 2.7% according to IHS Global Insight. The respondents also indicated that consumers were more price sensitive due to the uncertainties in the global economy;
• Due to a decline in occupancy and minimal ADR growth, Revenue per Available Room (RevPAR) decreased 2.3% to RMB 270 in 2012. In 2011, occupancy witnessed a large decrease and ADR saw a slight rise of 2.5%, which led to a RevPAR increase.
• According to respondents, hotel trading performance in 2013 is likely to record a slight increase. The occupancy is expected to rise to 60.9%. ADR is expected to reach RMB 471 by 2.9% and RevPAR is likely to increase 6.3% to RMB 287. Data obtained from this survey indicates some negative market sentiment in 2012. In contrast, the positive outlook on hotel trading performance in 2013 indicatesmoreconfidenceintheshortterm.
Of all the hotels sampled, just over 65% opened prior to 2005. New hotels which commenced operations after 2010 account for 12.5%, which increased slightly compared to that of last year’s surveyed results.
1.2 Hotel Performance
In consideration of the below data, the survey results include the actual performance for calendar years 2011 and 2012. In 2013, the results are based on forecasts provided by respondents. After reviewing the results, we note that the general performance for hotels across China has decreased during 2012, as compared to the previous year.
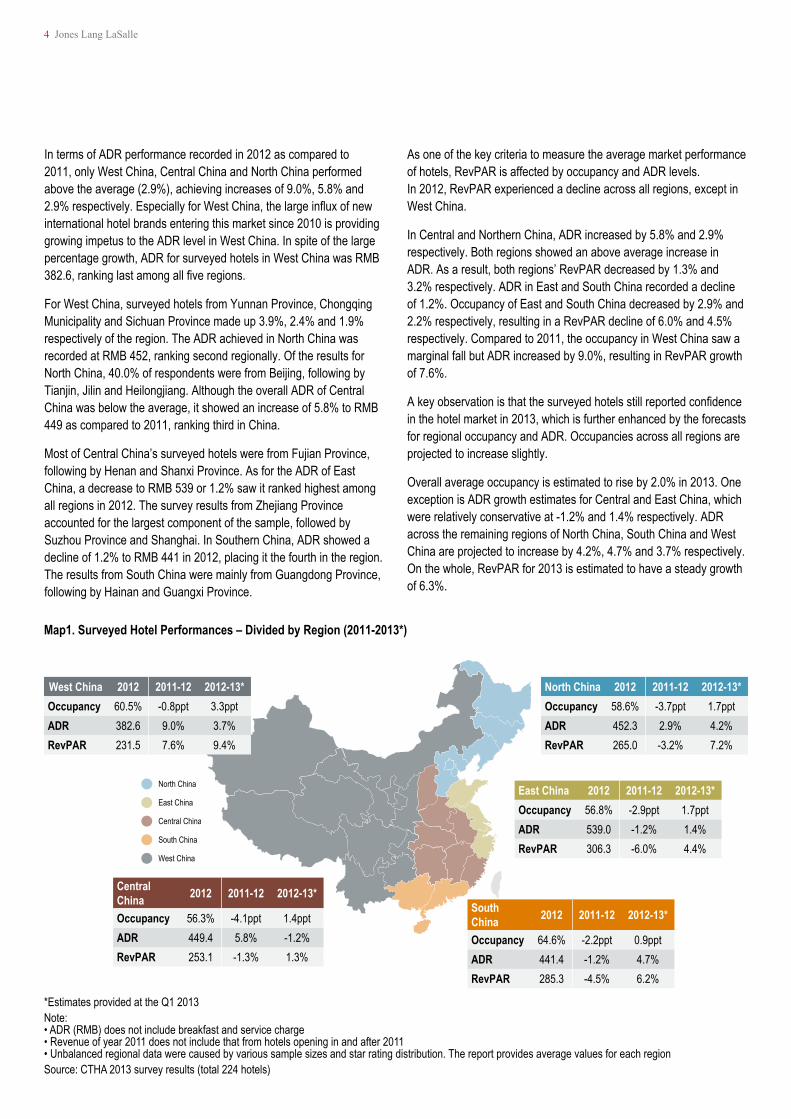
According to the following map and tables which depict the overall hotelperformancefromthesurveyedresults,allfiveregionsinChinashowed a decrease in occupancy during 2012. The regions are shown clockwise commencing with the largest regional decline across the performance variables measured. The order is Central China, North China,EastChina,SouthChinaandWestChina.Theresultsreflectthe negative impact of several factors such as the global economic weakness and political unrest in certain areas.
Source: CTHA 2013 survey results (total 224 hotels)
Figure 1. Opening Year of Surveyed Hotels
10.7% 8.9% 8.5%
17.0% 20.1%
34.8%
0%
5%
10%
15%
20%
25%
30%
35%
40%
Before 1985 1986-1990 1991-1995 1996-2000 2001-2005 2006-Present
*Estimates provided at the end of 2012Note: ADR does not include breakfast or service charge; data for 2011 does not include that for hotels opening in 2012Source: CTHA survey results (total 224 hotels)
Figure 2. Hotel Performance (2011-2013*)
0%
10%
20%
30%
40%
50%
60%
70%
0
100
200
300
400
500
600
700
2011 2012 2013*
RMB
(Yua
n)
ADR RevPar Occupancy
4 Jones Lang LaSalle
In terms of ADR performance recorded in 2012 as compared to 2011, only West China, Central China and North China performed above the average (2.9%), achieving increases of 9.0%, 5.8% and 2.9%respectively.EspeciallyforWestChina,thelargeinfluxofnewinternational hotel brands entering this market since 2010 is providing growing impetus to the ADR level in West China. In spite of the large percentage growth, ADR for surveyed hotels in West China was RMB 382.6,rankinglastamongallfiveregions.
For West China, surveyed hotels from Yunnan Province, Chongqing Municipality and Sichuan Province made up 3.9%, 2.4% and 1.9% respectively of the region. The ADR achieved in North China was recorded at RMB 452, ranking second regionally. Of the results for North China, 40.0% of respondents were from Beijing, following by Tianjin, Jilin and Heilongjiang. Although the overall ADR of Central China was below the average, it showed an increase of 5.8% to RMB 449 as compared to 2011, ranking third in China.
Most of Central China’s surveyed hotels were from Fujian Province, following by Henan and Shanxi Province. As for the ADR of East China, a decrease to RMB 539 or 1.2% saw it ranked highest among all regions in 2012. The survey results from Zhejiang Province accounted for the largest component of the sample, followed by Suzhou Province and Shanghai. In Southern China, ADR showed a decline of 1.2% to RMB 441 in 2012, placing it the fourth in the region. The results from South China were mainly from Guangdong Province, following by Hainan and Guangxi Province.
As one of the key criteria to measure the average market performance of hotels, RevPAR is affected by occupancy and ADR levels. In 2012, RevPAR experienced a decline across all regions, except in West China.
In Central and Northern China, ADR increased by 5.8% and 2.9% respectively. Both regions showed an above average increase in ADR. As a result, both regions’ RevPAR decreased by 1.3% and 3.2% respectively. ADR in East and South China recorded a decline of 1.2%. Occupancy of East and South China decreased by 2.9% and 2.2% respectively, resulting in a RevPAR decline of 6.0% and 4.5% respectively. Compared to 2011, the occupancy in West China saw a marginal fall but ADR increased by 9.0%, resulting in RevPAR growth of 7.6%.
Akeyobservationisthatthesurveyedhotelsstillreportedconfidencein the hotel market in 2013, which is further enhanced by the forecasts for regional occupancy and ADR. Occupancies across all regions are projected to increase slightly.
Overall average occupancy is estimated to rise by 2.0% in 2013. One exception is ADR growth estimates for Central and East China, which were relatively conservative at -1.2% and 1.4% respectively. ADR across the remaining regions of North China, South China and West China are projected to increase by 4.2%, 4.7% and 3.7% respectively. On the whole, RevPAR for 2013 is estimated to have a steady growth of 6.3%.
Map1. Surveyed Hotel Performances – Divided by Region (2011-2013*)
North China
East China
Central China
South China
West China
North China
East China
Central China
South China
West China
North China 2012 2011-12 2012-13*Occupancy 58.6% -3.7ppt 1.7pptADR 452.3 2.9% 4.2%RevPAR 265.0 -3.2% 7.2%
East China 2012 2011-12 2012-13*Occupancy 56.8% -2.9ppt 1.7pptADR 539.0 -1.2% 1.4%RevPAR 306.3 -6.0% 4.4%
South China 2012 2011-12 2012-13*
Occupancy 64.6% -2.2ppt 0.9pptADR 441.4 -1.2% 4.7%RevPAR 285.3 -4.5% 6.2%
West China 2012 2011-12 2012-13*Occupancy 60.5% -0.8ppt 3.3pptADR 382.6 9.0% 3.7%RevPAR 231.5 7.6% 9.4%
Central China 2012 2011-12 2012-13*
Occupancy 56.3% -4.1ppt 1.4pptADR 449.4 5.8% -1.2%RevPAR 253.1 -1.3% 1.3%
*Estimates provided at the Q1 2013Note: •ADR(RMB)doesnotincludebreakfastandservicecharge •Revenueofyear2011doesnotincludethatfromhotelsopeninginandafter2011 •Unbalancedregionaldatawerecausedbyvarioussamplesizesandstarratingdistribution.ThereportprovidesaveragevaluesforeachregionSource: CTHA 2013 survey results (total 224 hotels)
China Hotel Market Outlook 5
1.3 Business Mix
Among the surveyed hotels, corporate business travellers were still the leading segment in the business mix, making up 62.0% and increasing by 0.3 percentage points from 2011.
In terms of leisure demand, there was little or no change recorded in the proportion of the individual leisure traveler segment as compared to 2011. The proportion of group leisure travellers decreased by 0.4 percentage points. Increasing demand from the leisure traveler segmenthasledtolesspricesensitivity.Theresultsidentifiedthatguests tend to choose higher quality hotels with personalised service.
In addition, private and quiet living environments and the presence of local cultural activities are also preferred. In comparison, long-stay guests and other segments increased slightly in 2012. The long-stay segment accounted for 4.9%. Other segments accounted for 12.0%, increasing by 0.4 percentage points.
1.4 Revenue Mix
According to the survey results by revenue mix, there are no obvious changes on proportion accounted by rooms, F&B and by others in 2012 compared to those in 2011. Room revenue made up almost half (48.0%), which was larger than that from F&B and remained the leading component in the revenue mix. We expect this trend to continue in 2013. Room revenue percentage was estimated to increase to 48.8%.
The data provided via the surveyed results shows that F&B revenue accounted for 40.9% of hotels’ general revenue, which is consistent with the 41.0% recorded in 2011. This is also projected to remain consistent in 2013. Conferences and exhibitions are usually the
Source: CTHA 2013 survey results (total 224 hotels)
Figure 3. Business Mix (2011-2012)
0% 5% 10% 15% 20% 25% 30% 35% 40%
Corporate FIT
Corporate Group
Leisure FIT
Others
Leisure Group
Long-stay Guests
2011 2012
*Estimates provided at the Q1 2013Notes: Revenue from hotels opening in or after 2011were not included in revenue mix calculationSource: CTHA 2013 survey results (total 224 hotels)
Figure 4. Revenue Mix (2011-2013*)
48.2%
48.0%
48.8%
22.8%
23.3%
22.2%
18.2%
17.6%
18.3%
10.8%
11.1%
10.7%
0% 10% 20% 30% 40% 50% 60% 70% 80% 90% 100%
2011
2012
2013*
Rooms Revenue F&B Revenue (Meeting and Banquent parts)
F&B Revenue (Restaurant and Bar parts) Other Revenue
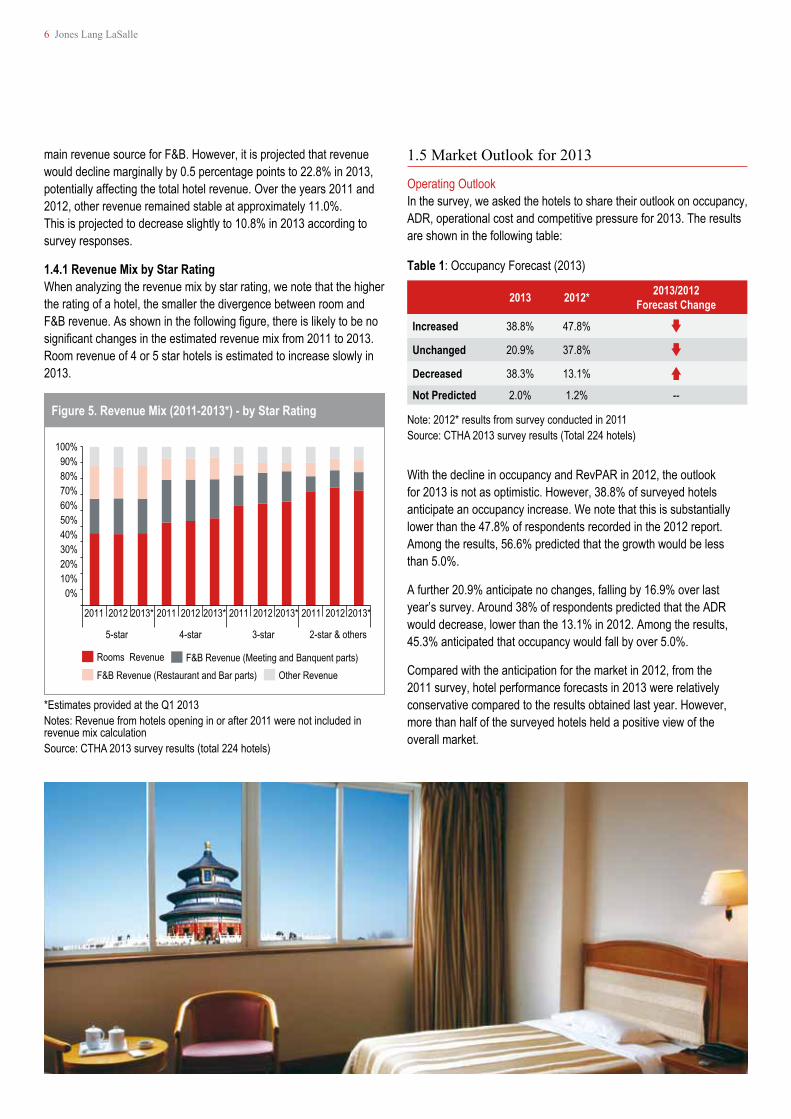
Figure 5. Revenue Mix (2011-2013*) - by Star Rating
0% 10% 20% 30% 40% 50% 60% 70% 80% 90%
100%
2011 2012 2013* 2011 2012 2013* 2011 2012 2013* 2011 2012 2013*
5-star 4-star 3-star 2-star & others
Rooms Revenue F&B Revenue (Meeting and Banquent parts) F&B Revenue (Restaurant and Bar parts) Other Revenue
6 Jones Lang LaSalle
main revenue source for F&B. However, it is projected that revenue would decline marginally by 0.5 percentage points to 22.8% in 2013, potentially affecting the total hotel revenue. Over the years 2011 and 2012, other revenue remained stable at approximately 11.0%. This is projected to decrease slightly to 10.8% in 2013 according to survey responses.
1.4.1 Revenue Mix by Star Rating When analyzing the revenue mix by star rating, we note that the higher the rating of a hotel, the smaller the divergence between room and F&Brevenue.Asshowninthefollowingfigure,thereislikelytobenosignificantchangesintheestimatedrevenuemixfrom2011to2013.Room revenue of 4 or 5 star hotels is estimated to increase slowly in 2013.
Table 1: Occupancy Forecast (2013)
1.5 Market Outlook for 2013
Operating Outlook In the survey, we asked the hotels to share their outlook on occupancy, ADR, operational cost and competitive pressure for 2013. The results are shown in the following table:
2013 2012* 2013/2012 Forecast Change
Increased 38.8% 47.8%
Unchanged 20.9% 37.8%
Decreased 38.3% 13.1%
Not Predicted 2.0% 1.2% --
With the decline in occupancy and RevPAR in 2012, the outlook for 2013 is not as optimistic. However, 38.8% of surveyed hotels anticipate an occupancy increase. We note that this is substantially lower than the 47.8% of respondents recorded in the 2012 report. Among the results, 56.6% predicted that the growth would be less than 5.0%.
A further 20.9% anticipate no changes, falling by 16.9% over last year’s survey. Around 38% of respondents predicted that the ADR would decrease, lower than the 13.1% in 2012. Among the results, 45.3% anticipated that occupancy would fall by over 5.0%.
Compared with the anticipation for the market in 2012, from the 2011 survey, hotel performance forecasts in 2013 were relatively conservative compared to the results obtained last year. However, more than half of the surveyed hotels held a positive view of the overall market.
Note: 2012* results from survey conducted in 2011 Source: CTHA 2013 survey results (Total 224 hotels)
*Estimates provided at the Q1 2013Notes: Revenue from hotels opening in or after 2011 were not included in revenue mix calculationSource: CTHA 2013 survey results (total 224 hotels)
China Hotel Market Outlook 7
2013 2012* 2013/2012 Forecast Change
Increased 64.8% 78.9%
Unchanged 17.9% 13.1%
Decreased 11.7% 3.6%
Not Predicted 5.6% 4.4% --
In some regions, a large number of guestrooms have been added to the market, outpacing short-term market demand projections. This has resulted in a noticeable level of oversupply. In order to improve occupancy, hotels might reduce room rates to maintain market share, which is likely to restrict growth in ADR.
In response to 2013 ADR projections, 37.8% of surveyed hotels anticipate an increase, which is lower as compared to 62.9% of surveyed hotels which expected an increase in last year’s survey. Amongst the surveyed hotels which expected an increase, 62.2% believed that the growth would be less than 5.0%.
Surveyed hotels (35.7%) expect ADR to remain at the current level while 24.5% forecast a decrease, substantially above the 4.8% recorded in 2012. Amongst the sampled data, 66.7% anticipate the decline to be less than 5.0%. As compared to the 2012 sampled data, the anticipated growth in ADR was relatively conservative.
Moreover, operational costs are estimated to rise or remain stable in 2013 by 82.6% of surveyed hotels. This is 9.3% lower than that in the 2012 report. According to the surveyed responses with regards to revenue mix, most hotels forecasted that room revenue would increase while F&B revenue via conference and banquets would decrease slightly.
Room operational costs account for a smaller proportion of a hotel’s total revenue as compared to F&B operational costs. The indicative change in revenue mix should be considered when forecasting operational costs in 2013.
Note: 2012* results from survey conducted in 2011 Source: CTHA 2013 survey results (Total 224 hotels)
2013 2012* 2013/2012 Forecast Change
Increased 37.8% 62.9%
Unchanged 35.7% 31.1%
Decreased 24.5% 4.8%
Not Predicted 2.0% 1.2% --
Note: 2012* results from survey conducted in 2011 Source: CTHA 2013 survey results (Total 224 hotels)
Table 2: ADR Forecast (2013)
Table 3: Operating Cost (2013)
8 Jones Lang LaSalle
More than 94% of respondents indicated that a hotel’s competitive market pressure would be higher or will remain unchanged in 2013. The main reasons were increasing operational costs, growing capital market values and existing hotels which have not been renovated feature dated products and are unable to compete with newer hotels. Approximately 1.6% of respondents anticipated the competitive pressure in the marketplace to decrease. Other respondents indicated that it depends on implementation of government policies.
Demand Drivers An analysis of surveyed results on potential demand drivers shows that large-scale conferences, events and exhibitions account for the largest proportion of lodging demand (30.2%), maintaining the same level as reported in 2012. Demand driven by major tourism project developments / improvements increased by 4.2% to 24.2%.
Surveyed hotels regarded it as an important tourism demand motivation. The number of respondents choosing “the expansion ofdeveloping/high-techzonesandincreasingofficesupply”asthedemand driver shows a 3.2 percentage points higher than that of 2012. According to statistical data, government generated demand recorded a decline of 12.2 percentage points to 5.8% in 2012. From the latter halfof2012,mostsurveyedhotelsareundertakinga“wait-and-see”approach on government demand, which is different from last year’s response.
With the announcement of The National Eight-point Rule, government-led travel demand is estimated to fall. Sales initiatives and efforts to target other market segments and the expansion of sales distribution channels are anticipated measures to make up for the shortfall in government demand.
Theconstructionandexpansionoftraffichubswasanewfactorinfluencingguestroomdemandmotivation.Theresultshowsthatthisfactor ranked in fourth with 15.0%. The result indicates the importance of ease of accessibility on guestroom demand.
Future Challenges Opinions on future challenges were also asked in the survey. Responses were ranked with that in the China Hotel Market Outlook 2012. The results are as follows:
At the top of the list, increasing costs have become the focus of attention, including increasing hotel operation and human resource costs.Inrecentyears,withthelargeinfluxofnewhotels,recruitingand training costs have been affected by higher employer turnover. More competitive remuneration packages can be offered to attract qualifiedemployees.
Respondents noted that given the shortage of labour and increased labour cost, measures such as reasonable arrangement of positions shouldbeconsideredtomaximizeworkefficiency.Anincreaseinstafftraining would also be important to improve service quality and product experience.
Note: 2012* results from survey conducted in 2011 Source: CTHA 2013 survey results (Total 224 hotels)
Note: 2012* results from survey conducted in 2011 Source: CTHA 2013 survey results (Total 224 hotels)
Note: 2012* results from survey conducted in 2011 Source: CTHA 2013 survey results (Total 224 hotels)
Table 4: Competitive Pressure (2013) Table 5: Lodging Demand Drivers (2013)
Table 6: Challenges to Future Operations
2013 2012* 2013/2012 Forecast Change
Increased 89.0% 72.9%
Unchanged 5.5% 19.9%
Decreased 1.6% 7.2%
Not Predicted 3.9% N/A --
% 2013 Rankings
2012* Rankings
Rising inflation, increased operating costs 18.0% 1 1
Increased labor costs 17.6% 2 2
Pressure on occupancy due to new hotel supply 15.3% 3 3
Economy / policy uncertainty 10.6% 4 7Guests’ ADR sensitivity 10.0% 5 8
2013 2012*
Large scale meeting / activities / exhibitions 30.2% 30.0%Major tourism project developments / improvements 24.2% 20.0%
Expansion of development / high-tech zones 15.2% 12.0%Development and expansion of transportation hub 15.0% N/AIncreased office supply 9.7% 6.0%Increased government demand 5.8% 18.0%
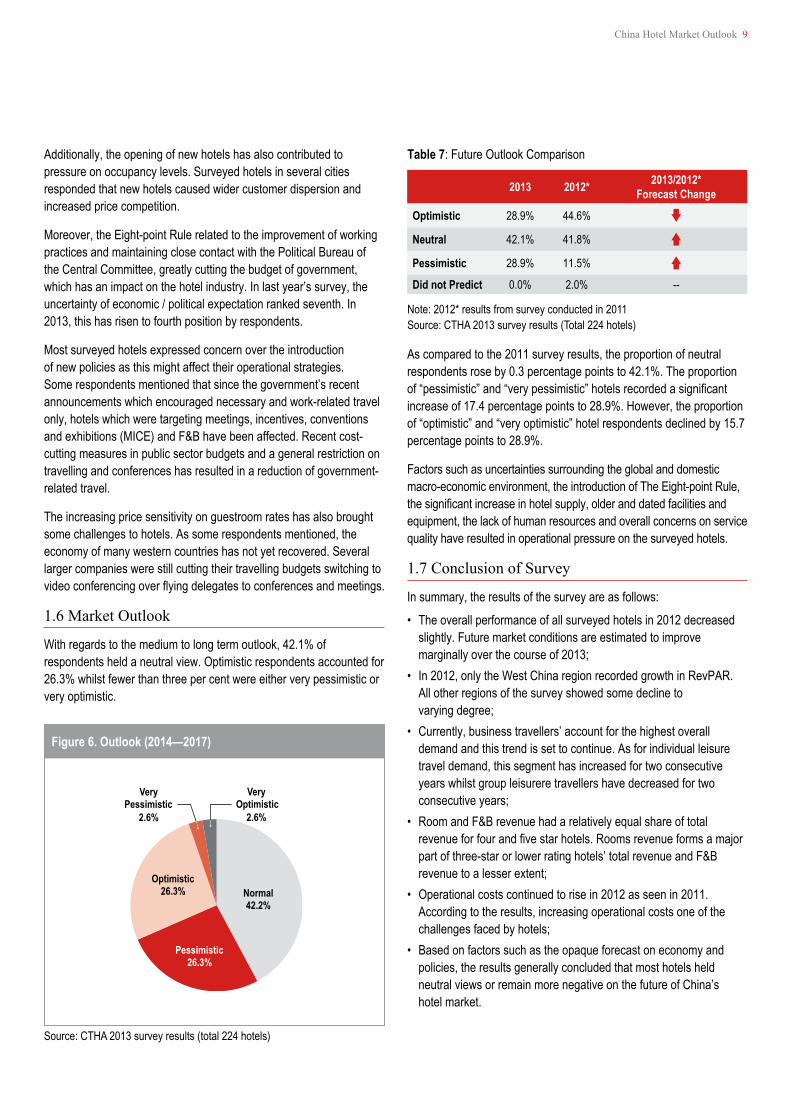
Figure 6. Outlook (2014—2017)
Normal 42.2%
Pessimistic 26.3%
Optimistic 26.3%
Very Pessimistic
2.6%
Very Optimistic
2.6%
Source: CTHA 2013 survey results (total 224 hotels)
China Hotel Market Outlook 9
Additionally, the opening of new hotels has also contributed to pressure on occupancy levels. Surveyed hotels in several cities responded that new hotels caused wider customer dispersion and increased price competition.
Moreover, the Eight-point Rule related to the improvement of working practices and maintaining close contact with the Political Bureau of the Central Committee, greatly cutting the budget of government, which has an impact on the hotel industry. In last year’s survey, the uncertainty of economic / political expectation ranked seventh. In 2013, this has risen to fourth position by respondents.
Most surveyed hotels expressed concern over the introduction of new policies as this might affect their operational strategies. Some respondents mentioned that since the government’s recent announcements which encouraged necessary and work-related travel only, hotels which were targeting meetings, incentives, conventions and exhibitions (MICE) and F&B have been affected. Recent cost-cutting measures in public sector budgets and a general restriction on travelling and conferences has resulted in a reduction of government-related travel.
The increasing price sensitivity on guestroom rates has also brought some challenges to hotels. As some respondents mentioned, the economy of many western countries has not yet recovered. Several larger companies were still cutting their travelling budgets switching to videoconferencingoverflyingdelegatestoconferencesandmeetings.
1.6 Market Outlook
With regards to the medium to long term outlook, 42.1% of respondents held a neutral view. Optimistic respondents accounted for 26.3% whilst fewer than three per cent were either very pessimistic or very optimistic.
As compared to the 2011 survey results, the proportion of neutral respondents rose by 0.3 percentage points to 42.1%. The proportion of“pessimistic”and“verypessimistic”hotelsrecordedasignificantincrease of 17.4 percentage points to 28.9%. However, the proportion of“optimistic”and“veryoptimistic”hotelrespondentsdeclinedby15.7percentage points to 28.9%.
Factors such as uncertainties surrounding the global and domestic macro-economic environment, the introduction of The Eight-point Rule, thesignificantincreaseinhotelsupply,olderanddatedfacilitiesandequipment, the lack of human resources and overall concerns on service quality have resulted in operational pressure on the surveyed hotels.
1.7 Conclusion of Survey
In summary, the results of the survey are as follows:
• The overall performance of all surveyed hotels in 2012 decreased slightly. Future market conditions are estimated to improve marginally over the course of 2013;
• In 2012, only the West China region recorded growth in RevPAR. All other regions of the survey showed some decline to varying degree;
• Currently, business travellers’ account for the highest overall demand and this trend is set to continue. As for individual leisure travel demand, this segment has increased for two consecutive years whilst group leisurere travellers have decreased for two consecutive years;
• Room and F&B revenue had a relatively equal share of total revenueforfourandfivestarhotels.Roomsrevenueformsamajorpart of three-star or lower rating hotels’ total revenue and F&B revenue to a lesser extent;
• Operational costs continued to rise in 2012 as seen in 2011. According to the results, increasing operational costs one of the challenges faced by hotels;
• Based on factors such as the opaque forecast on economy and policies, the results generally concluded that most hotels held neutral views or remain more negative on the future of China’s hotel market.
2013 2012* 2013/2012* Forecast Change
Optimistic 28.9% 44.6%
Neutral 42.1% 41.8%
Pessimistic 28.9% 11.5%
Did not Predict 0.0% 2.0% --
Note: 2012* results from survey conducted in 2011 Source: CTHA 2013 survey results (Total 224 hotels)
Table 7: Future Outlook Comparison
10 Jones Lang LaSalle
2.1 Hotel Markets and Cities Development
With the continuation of China's economic reforms amidst an uncertain global economy, the development of cities from different tiersinChinawillbeinfluencedbydomesticdemandandpoliciesaswellasfactorsuniquetotheChinesemarket.Undertheimpactofmacroeconomic policies and new opportunities for real estate markets, wedevelopedthisreportonthebasisofcitiesin“China50”,toprovide
2. China Hotel Market – Supply and Demand Factors
a better understanding of hotel market performance and investment opportunities of cities from different tiers.
To illustrate the difference, we analyzed 42 cities from Tier 1, Tier 1.5, Tier 2 and Tier 3 in detail. In addition, four other cities where tourism is a core economic driver and strong hotel development levels have been seen were added to this list. In this section, supply and demand factors will be analyzed.
Note: Ranking of Tier I,1.5, II, III cities are from China 50, Jones Lang LaSalle
Table 8: 46 Hotel Markets
Tier I Tier 1.5 & Tier II Tier III Other additional cities Other Capital citiesBeijing Tianjin Wuhan Changsha Fuzhou Kunming Lijiang YinchuanShanghai Suzhou Qingdao Zhengzhou Foshan Taiyuan SanyaGuangzhou Chongqing Dalian Dongguan Harbin Shijiazhuang Huangshan Shenzhen Hangzhou Nanjing Jinan Changchun Guiyang Lhasa
Wuxi Ningbo Xi’an Changzhou Xuzhou Chengdu Shenyang Hefei Wenzhou Haikou
Xiamen Guilin Nanning Zhuhai Nanchang Urumqi Hohhot
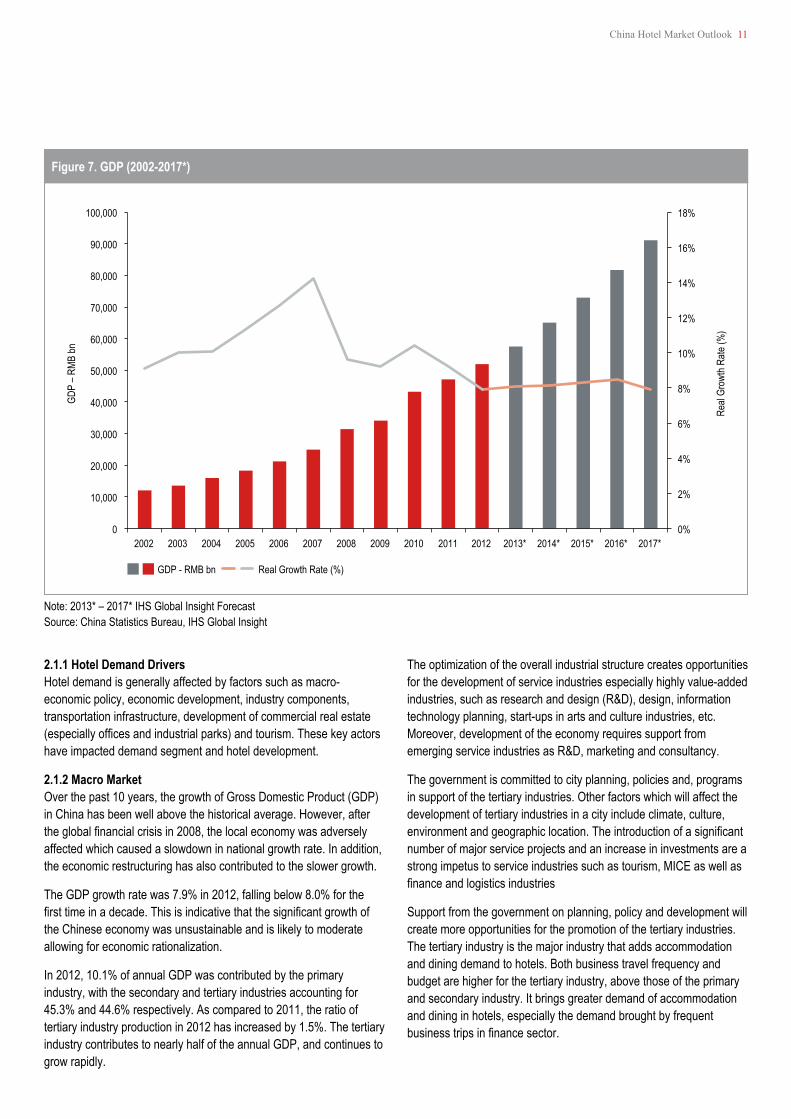
Figure 7. GDP (2002-2017*)
0%
2%
4%
6%
8%
10%
12%
14%
16%
18%
0
10,000
20,000
30,000
40,000
50,000
60,000
70,000
80,000
90,000
100,000
2002 2003 2004 2005 2006 2007 2008 2009 2010 2011 2012 2013* 2014* 2015* 2016* 2017*
Real
Grow
th Ra
te (%
)
GDP
– RMB
bn
GDP - RMB bn Real Growth Rate (%)
Note: 2013* – 2017* IHS Global Insight ForecastSource: China Statistics Bureau, IHS Global Insight
China Hotel Market Outlook 11
2.1.1 Hotel Demand Drivers Hotel demand is generally affected by factors such as macro-economic policy, economic development, industry components, transportation infrastructure, development of commercial real estate (especiallyofficesandindustrialparks)andtourism.Thesekeyactorshave impacted demand segment and hotel development.
2.1.2 Macro Market Over the past 10 years, the growth of Gross Domestic Product (GDP) in China has been well above the historical average. However, after theglobalfinancialcrisisin2008,thelocaleconomywasadverselyaffected which caused a slowdown in national growth rate. In addition, the economic restructuring has also contributed to the slower growth.
The GDP growth rate was 7.9% in 2012, falling below 8.0% for the firsttimeinadecade.Thisisindicativethatthesignificantgrowthofthe Chinese economy was unsustainable and is likely to moderate allowing for economic rationalization.
In 2012, 10.1% of annual GDP was contributed by the primary industry, with the secondary and tertiary industries accounting for 45.3% and 44.6% respectively. As compared to 2011, the ratio of tertiary industry production in 2012 has increased by 1.5%. The tertiary industry contributes to nearly half of the annual GDP, and continues to grow rapidly.
The optimization of the overall industrial structure creates opportunities for the development of service industries especially highly value-added industries, such as research and design (R&D), design, information technology planning, start-ups in arts and culture industries, etc. Moreover, development of the economy requires support from emerging service industries as R&D, marketing and consultancy.
The government is committed to city planning, policies and, programs in support of the tertiary industries. Other factors which will affect the development of tertiary industries in a city include climate, culture, environmentandgeographiclocation.Theintroductionofasignificantnumber of major service projects and an increase in investments are a strong impetus to service industries such as tourism, MICE as well as financeandlogisticsindustries
Support from the government on planning, policy and development will create more opportunities for the promotion of the tertiary industries. The tertiary industry is the major industry that adds accommodation and dining demand to hotels. Both business travel frequency and budget are higher for the tertiary industry, above those of the primary and secondary industry. It brings greater demand of accommodation and dining in hotels, especially the demand brought by frequent businesstripsinfinancesector.
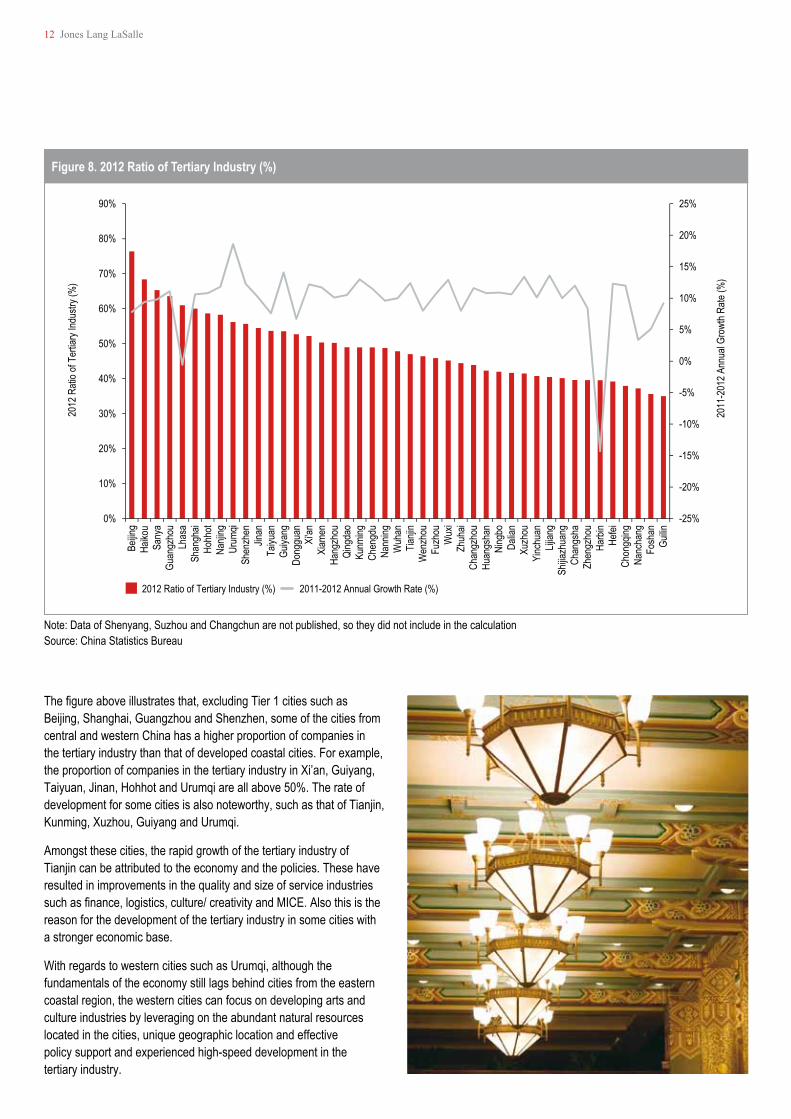
Figure 8. 2012 Ratio of Tertiary Industry (%)
2011
-201
2 Ann
ual G
rowt
h Rate
(%)
2012
Rati
o of T
ertia
ry Ind
ustry
(%)
2012 Ratio of Tertiary Industry (%) 2011-2012 Annual Growth Rate (%)
-25%
-20%
-15%
-10%
-5%
0%
5%
10%
15%
20%
25%
0%
10%
20%
30%
40%
50%
60%
70%
80%
90%
Beijin
gHa
ikou
Sany
aGu
angz
hou
Lhas
aSh
angh
aiHo
hhot
Nanji
ngUr
umqi
Shen
zhen
Jinan
Taiyu
anGu
iyang
Dong
guan
Xi'an
Xiam
enHa
ngzh
ouQi
ngda
oKu
nming
Chen
gdu
Nann
ingW
uhan
Tianji
nW
enzh
ouFu
zhou
Wux
iZh
uhai
Chan
gzho
uHu
angs
han
Ning
boDa
lian
Xuzh
ouYi
nchu
anLij
iang
Shijia
zhua
ngCh
angs
haZh
engz
hou
Harb
inHe
feiCh
ongq
ingNa
ncha
ngFo
shan
Guilin
Note: Data of Shenyang, Suzhou and Changchun are not published, so they did not include in the calculationSource: China Statistics Bureau
12 Jones Lang LaSalle
Thefigureaboveillustratesthat,excludingTier1citiessuchasBeijing, Shanghai, Guangzhou and Shenzhen, some of the cities from central and western China has a higher proportion of companies in the tertiary industry than that of developed coastal cities. For example, the proportion of companies in the tertiary industry in Xi’an, Guiyang, Taiyuan,Jinan,HohhotandUrumqiareallabove50%.Therateofdevelopment for some cities is also noteworthy, such as that of Tianjin, Kunming,Xuzhou,GuiyangandUrumqi.
Amongst these cities, the rapid growth of the tertiary industry of Tianjin can be attributed to the economy and the policies. These have resulted in improvements in the quality and size of service industries suchasfinance,logistics,culture/creativityandMICE.Alsothisisthereason for the development of the tertiary industry in some cities with a stronger economic base.
WithregardstowesterncitiessuchasUrumqi,althoughthefundamentals of the economy still lags behind cities from the eastern coastal region, the western cities can focus on developing arts and culture industries by leveraging on the abundant natural resources located in the cities, unique geographic location and effective policy support and experienced high-speed development in the tertiary industry.
Figure 9. China Visitor Arrivals (2003-2012)
-10%
-5%
0%
5%
10%
15%
20%
25%
30%
0
5
10
15
20
25
30
35
2003 2004 2005 2006 2007 2008 2009 2010 2011 2012
Numb
er of
Visi
tor A
rriva
ls (m
il)
Domestic Visitor Arrivals (mil) International Visitor Arrivals (mil)
Annual Change of Domestic Visitor Arrivals (%) Annual Change of International Visitor Arrivals (%)
Annu
al Ch
ange
of In
terna
tiona
l Visi
tor A
rriva
ls (%
)
Source: China National Tourism Administration
China Hotel Market Outlook 13
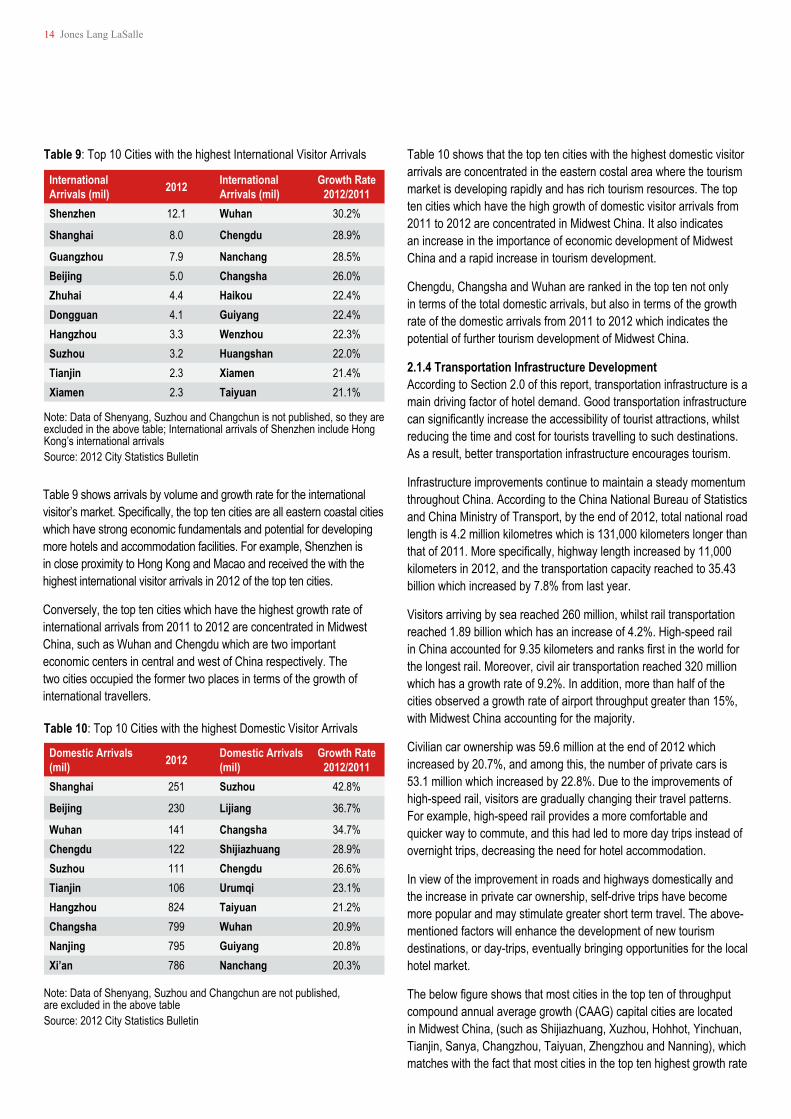
2.1.3 Tourism Market Development In 2012, the global economy began a slow recovery in the face of strong headwinds limiting growth as a result of the European sovereign debt crisis. Inbound international visitor arrivals continued to decline in China over 2012, more than that recorded in 2011.
Inaddition,Chinaisshowingslowergrowthandrisinginflationisresulting in cost cutting measures being employed in local companies to limit unnecessary travel. This in turn will affect the development of domestic tourism. However, in terms of domestic tourism growth, Chinese residents are still driving local demand for travel on the back of improvements in disposable income levels.
According to the China National Tourism Administration, domestic visitation witnessed a steady upward trend, recording 3.1 billion domestic visitors in 2012. In contrast international arrivals recorded a decline which can be attributed to the global economic slowdown.
Domestic tourism revenue has increased by more than 14.5 percentage points. In addition, total visitors reached above eight million for outbound tourism in 2012 (a growth rate of 15%). This is reflectiveoftheincreasedspendingpowerofChinesetourists.
14 Jones Lang LaSalle
Table 9 shows arrivals by volume and growth rate for the international visitor’smarket.Specifically,thetoptencitiesarealleasterncoastalcitieswhich have strong economic fundamentals and potential for developing more hotels and accommodation facilities. For example, Shenzhen is in close proximity to Hong Kong and Macao and received the with the highest international visitor arrivals in 2012 of the top ten cities.
Conversely, the top ten cities which have the highest growth rate of international arrivals from 2011 to 2012 are concentrated in Midwest China, such as Wuhan and Chengdu which are two important economic centers in central and west of China respectively. The two cities occupied the former two places in terms of the growth of international travellers.
Table 10 shows that the top ten cities with the highest domestic visitor arrivals are concentrated in the eastern costal area where the tourism market is developing rapidly and has rich tourism resources. The top ten cities which have the high growth of domestic visitor arrivals from 2011 to 2012 are concentrated in Midwest China. It also indicates an increase in the importance of economic development of Midwest China and a rapid increase in tourism development.
Chengdu, Changsha and Wuhan are ranked in the top ten not only in terms of the total domestic arrivals, but also in terms of the growth rate of the domestic arrivals from 2011 to 2012 which indicates the potential of further tourism development of Midwest China.
2.1.4 Transportation Infrastructure Development According to Section 2.0 of this report, transportation infrastructure is a main driving factor of hotel demand. Good transportation infrastructure cansignificantlyincreasetheaccessibilityoftouristattractions,whilstreducing the time and cost for tourists travelling to such destinations. As a result, better transportation infrastructure encourages tourism.
Infrastructure improvements continue to maintain a steady momentum throughout China. According to the China National Bureau of Statistics and China Ministry of Transport, by the end of 2012, total national road length is 4.2 million kilometres which is 131,000 kilometers longer than thatof2011.Morespecifically,highwaylengthincreasedby11,000kilometers in 2012, and the transportation capacity reached to 35.43 billion which increased by 7.8% from last year.
Visitors arriving by sea reached 260 million, whilst rail transportation reached 1.89 billion which has an increase of 4.2%. High-speed rail inChinaaccountedfor9.35kilometersandranksfirstintheworldforthe longest rail. Moreover, civil air transportation reached 320 million which has a growth rate of 9.2%. In addition, more than half of the cities observed a growth rate of airport throughput greater than 15%, with Midwest China accounting for the majority.
Civilian car ownership was 59.6 million at the end of 2012 which increased by 20.7%, and among this, the number of private cars is 53.1 million which increased by 22.8%. Due to the improvements of high-speed rail, visitors are gradually changing their travel patterns. For example, high-speed rail provides a more comfortable and quicker way to commute, and this had led to more day trips instead of overnight trips, decreasing the need for hotel accommodation.
In view of the improvement in roads and highways domestically and the increase in private car ownership, self-drive trips have become more popular and may stimulate greater short term travel. The above-mentioned factors will enhance the development of new tourism destinations, or day-trips, eventually bringing opportunities for the local hotel market.
Thebelowfigureshowsthatmostcitiesinthetoptenofthroughputcompound annual average growth (CAAG) capital cities are located in Midwest China, (such as Shijiazhuang, Xuzhou, Hohhot, Yinchuan, Tianjin, Sanya, Changzhou, Taiyuan, Zhengzhou and Nanning), which matches with the fact that most cities in the top ten highest growth rate
Note: Data of Shenyang, Suzhou and Changchun is not published, so they are excluded in the above table; International arrivals of Shenzhen include Hong Kong’s international arrivalsSource: 2012 City Statistics Bulletin
Note: Data of Shenyang, Suzhou and Changchun are not published, are excluded in the above tableSource: 2012 City Statistics Bulletin
Table 9: Top 10 Cities with the highest International Visitor Arrivals
Table 10: Top 10 Cities with the highest Domestic Visitor Arrivals
International Arrivals (mil) 2012 International
Arrivals (mil)Growth Rate
2012/2011 Shenzhen 12.1 Wuhan 30.2%
Shanghai 8.0 Chengdu 28.9%
Guangzhou 7.9 Nanchang 28.5%Beijing 5.0 Changsha 26.0%Zhuhai 4.4 Haikou 22.4%Dongguan 4.1 Guiyang 22.4%Hangzhou 3.3 Wenzhou 22.3%Suzhou 3.2 Huangshan 22.0%Tianjin 2.3 Xiamen 21.4%Xiamen 2.3 Taiyuan 21.1%
Domestic Arrivals (mil) 2012 Domestic Arrivals
(mil)Growth Rate
2012/2011 Shanghai 251 Suzhou 42.8%
Beijing 230 Lijiang 36.7%
Wuhan 141 Changsha 34.7%Chengdu 122 Shijiazhuang 28.9%Suzhou 111 Chengdu 26.6%Tianjin 106 Urumqi 23.1%Hangzhou 824 Taiyuan 21.2%Changsha 799 Wuhan 20.9%Nanjing 795 Guiyang 20.8%Xi’an 786 Nanchang 20.3%
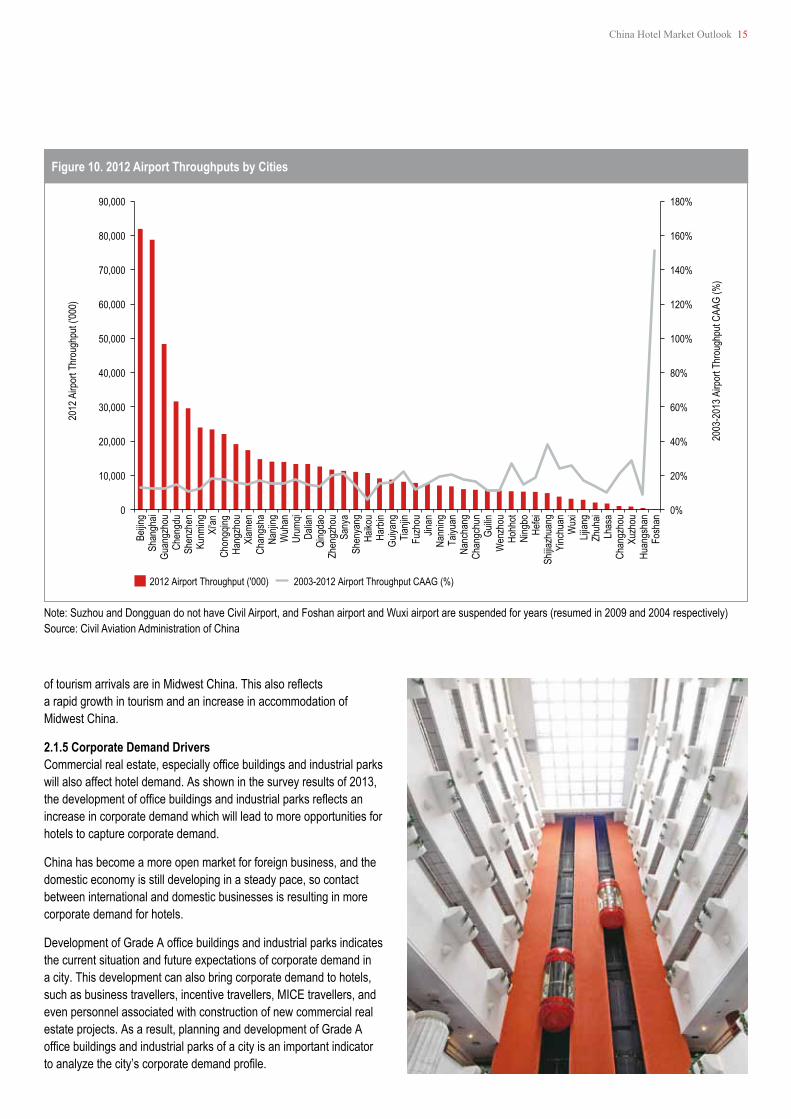
Figure 10. 2012 Airport Throughputs by Cities
0%
20%
40%
60%
80%
100%
120%
140%
160%
180%
0
10,000
20,000
30,000
40,000
50,000
60,000
70,000
80,000
90,000
2003
-201
3 Airp
ort T
hrou
ghpu
t CAA
G (%
)
2012
Airp
ort T
hrou
ghpu
t ('00
0)
2012 Airport Throughput ('000) 2003-2012 Airport Throughput CAAG (%)
Beijin
gSh
angh
aiGu
angz
hou
Chen
gdu
Shen
zhen
Kunm
ingXi
'anCh
ongq
ingHa
ngzh
ouXi
amen
Chan
gsha
Nanji
ngW
uhan
Urum
qiDa
lian
Qing
dao
Zhen
gzho
uSa
nya
Shen
yang
Haiko
uHa
rbin
Guiya
ngTia
njin
Fuzh
ouJin
anNa
nning
Taiyu
anNa
ncha
ngCh
angc
hun
Guilin
Wen
zhou
Hohh
otNi
ngbo
Hefei
Shijia
zhua
ngYi
nchu
anW
uxi
Lijian
gZh
uhai
Lhas
aCh
angz
hou
Xuzh
ouHu
angs
han
Fosh
an
Note: Suzhou and Dongguan do not have Civil Airport, and Foshan airport and Wuxi airport are suspended for years (resumed in 2009 and 2004 respectively)Source: Civil Aviation Administration of China
China Hotel Market Outlook 15
oftourismarrivalsareinMidwestChina.Thisalsoreflects a rapid growth in tourism and an increase in accommodation of Midwest China.
2.1.5 Corporate Demand Drivers Commercialrealestate,especiallyofficebuildingsandindustrialparkswill also affect hotel demand. As shown in the survey results of 2013, thedevelopmentofofficebuildingsandindustrialparksreflectsanincrease in corporate demand which will lead to more opportunities for hotels to capture corporate demand.
China has become a more open market for foreign business, and the domestic economy is still developing in a steady pace, so contact between international and domestic businesses is resulting in more corporate demand for hotels.
DevelopmentofGradeAofficebuildingsandindustrialparksindicatesthe current situation and future expectations of corporate demand in a city. This development can also bring corporate demand to hotels, such as business travellers, incentive travellers, MICE travellers, and even personnel associated with construction of new commercial real estate projects. As a result, planning and development of Grade A officebuildingsandindustrialparksofacityisanimportantindicatortoanalyzethecity’scorporatedemandprofile.
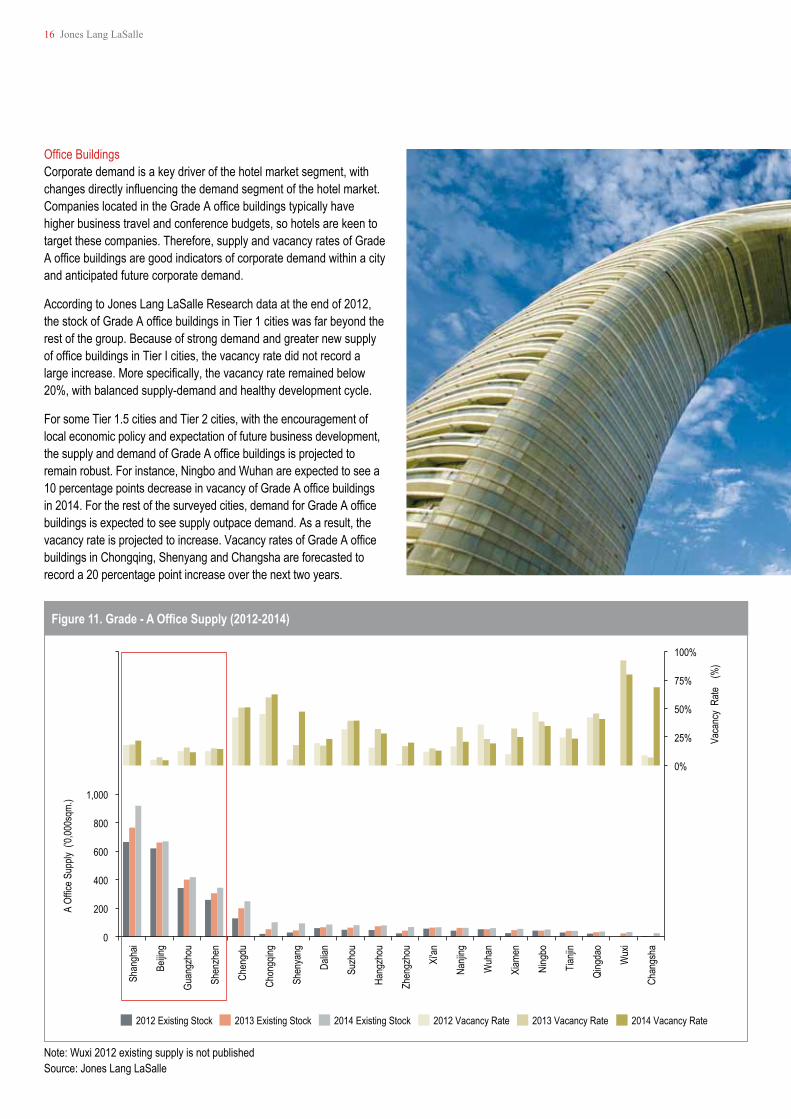
Figure 11. Grade - A Office Supply (2012-2014)
0%
25%
50%
75%
100%
0
200
400
600
800
1,000
Shan
ghai
Beijin
g
Guan
gzho
u
Shen
zhen
Chen
gdu
Chon
gqing
Shen
yang
Dalia
n
Suzh
ou
Hang
zhou
Zhen
gzho
u
Xi'an
Nanji
ng
Wuh
an
Xiam
en
Ning
bo
Tianji
n
Qing
dao
Wux
i
Chan
gsha
Vac
ancy
Rate
(%
)
A Of
fice S
upply
('0,
000s
qm.)
2012 Existing Stock 2013 Existing Stock 2014 Existing Stock 2012 Vacancy Rate 2013 Vacancy Rate 2014 Vacancy Rate
Note: Wuxi 2012 existing supply is not publishedSource: Jones Lang LaSalle
16 Jones Lang LaSalle
OfficeBuildings Corporate demand is a key driver of the hotel market segment, with changesdirectlyinfluencingthedemandsegmentofthehotelmarket.CompanieslocatedintheGradeAofficebuildingstypicallyhavehigher business travel and conference budgets, so hotels are keen to target these companies. Therefore, supply and vacancy rates of Grade Aofficebuildingsaregoodindicatorsofcorporatedemandwithinacityand anticipated future corporate demand.
According to Jones Lang LaSalle Research data at the end of 2012, thestockofGradeAofficebuildingsinTier1citieswasfarbeyondtherest of the group. Because of strong demand and greater new supply ofofficebuildingsinTierΙcities,thevacancyratedidnotrecordalargeincrease.Morespecifically,thevacancyrateremainedbelow20%, with balanced supply-demand and healthy development cycle.
For some Tier 1.5 cities and Tier 2 cities, with the encouragement of local economic policy and expectation of future business development, thesupplyanddemandofGradeAofficebuildingsisprojectedtoremain robust. For instance, Ningbo and Wuhan are expected to see a 10percentagepointsdecreaseinvacancyofGradeAofficebuildingsin2014.Fortherestofthesurveyedcities,demandforGradeAofficebuildings is expected to see supply outpace demand. As a result, the vacancyrateisprojectedtoincrease.VacancyratesofGradeAofficebuildings in Chongqing, Shenyang and Changsha are forecasted to record a 20 percentage point increase over the next two years.
China Hotel Market Outlook 17
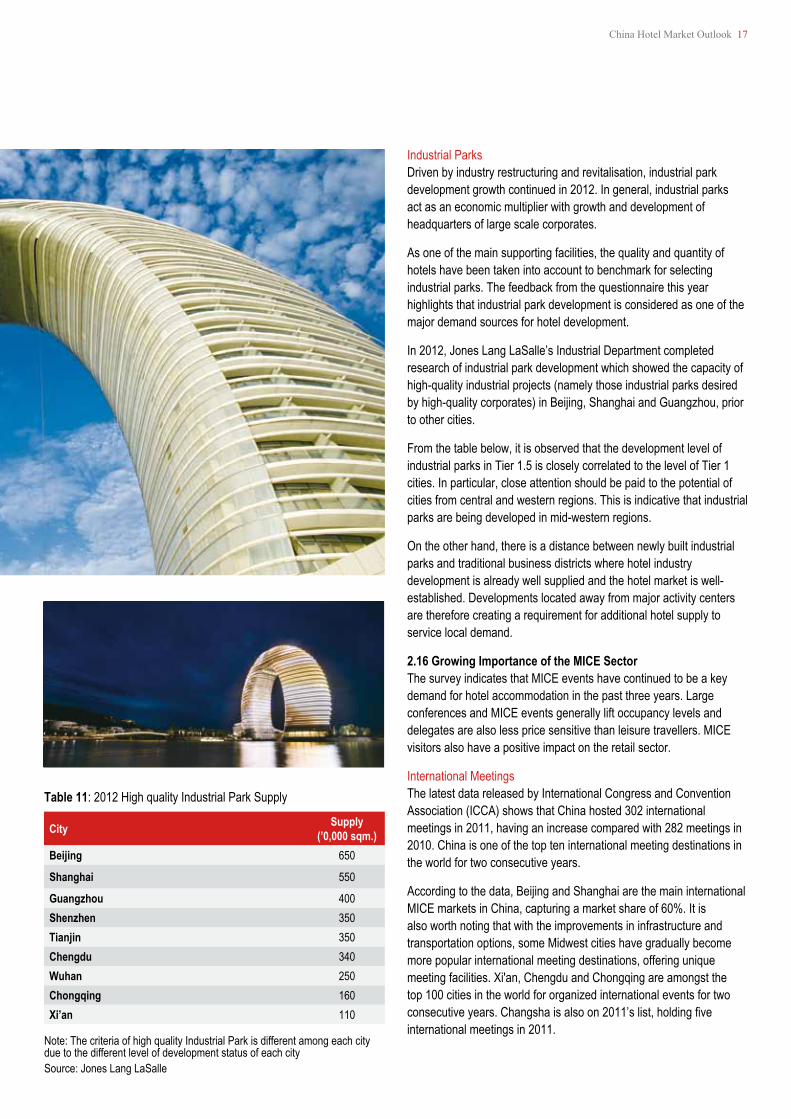
Industrial Parks Driven by industry restructuring and revitalisation, industrial park development growth continued in 2012. In general, industrial parks act as an economic multiplier with growth and development of headquarters of large scale corporates.
As one of the main supporting facilities, the quality and quantity of hotels have been taken into account to benchmark for selecting industrial parks. The feedback from the questionnaire this year highlights that industrial park development is considered as one of the major demand sources for hotel development.
In 2012, Jones Lang LaSalle’s Industrial Department completed research of industrial park development which showed the capacity of high-quality industrial projects (namely those industrial parks desired by high-quality corporates) in Beijing, Shanghai and Guangzhou, prior to other cities.
From the table below, it is observed that the development level of industrial parks in Tier 1.5 is closely correlated to the level of Tier 1 cities. In particular, close attention should be paid to the potential of cities from central and western regions. This is indicative that industrial parks are being developed in mid-western regions.
On the other hand, there is a distance between newly built industrial parks and traditional business districts where hotel industry development is already well supplied and the hotel market is well-established. Developments located away from major activity centers are therefore creating a requirement for additional hotel supply to service local demand.
2.16 Growing Importance of the MICE Sector The survey indicates that MICE events have continued to be a key demand for hotel accommodation in the past three years. Large conferences and MICE events generally lift occupancy levels and delegates are also less price sensitive than leisure travellers. MICE visitors also have a positive impact on the retail sector.
International Meetings The latest data released by International Congress and Convention Association (ICCA) shows that China hosted 302 international meetings in 2011, having an increase compared with 282 meetings in 2010. China is one of the top ten international meeting destinations in the world for two consecutive years.
According to the data, Beijing and Shanghai are the main international MICE markets in China, capturing a market share of 60%. It is also worth noting that with the improvements in infrastructure and transportation options, some Midwest cities have gradually become more popular international meeting destinations, offering unique meeting facilities. Xi'an, Chengdu and Chongqing are amongst the top 100 cities in the world for organized international events for two consecutiveyears.Changshaisalsoon2011’slist,holdingfiveinternational meetings in 2011.
Note: The criteria of high quality Industrial Park is different among each city due to the different level of development status of each citySource: Jones Lang LaSalle
Table 11: 2012 High quality Industrial Park Supply
City Supply (’0,000 sqm.)
Beijing 650
Shanghai 550
Guangzhou 400 Shenzhen 350 Tianjin 350 Chengdu 340 Wuhan 250 Chongqing 160 Xi’an 110
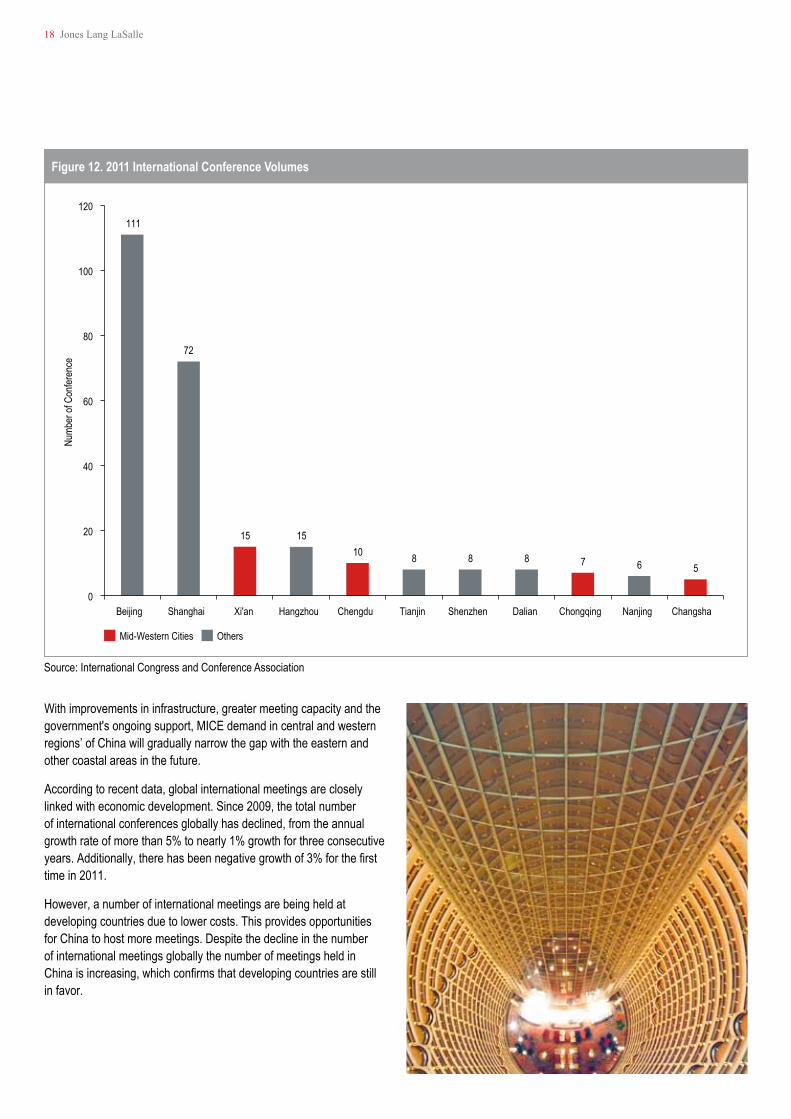
Figure 12. 2011 International Conference Volumes
111
72
15 15 10 8 8 8 7 6 5
0
20
40
60
80
100
120
Beijing Shanghai Xi'an Hangzhou Chengdu Tianjin Shenzhen Dalian Chongqing Nanjing Changsha
Numb
er of
Con
feren
ce
Mid-Western Cities Others
Source: International Congress and Conference Association
18 Jones Lang LaSalle
With improvements in infrastructure, greater meeting capacity and the government's ongoing support, MICE demand in central and western regions’ of China will gradually narrow the gap with the eastern and other coastal areas in the future.
According to recent data, global international meetings are closely linked with economic development. Since 2009, the total number of international conferences globally has declined, from the annual growth rate of more than 5% to nearly 1% growth for three consecutive years.Additionally,therehasbeennegativegrowthof3%forthefirsttime in 2011.
However, a number of international meetings are being held at developing countries due to lower costs. This provides opportunities for China to host more meetings. Despite the decline in the number of international meetings globally the number of meetings held in Chinaisincreasing,whichconfirmsthatdevelopingcountriesarestillin favor.
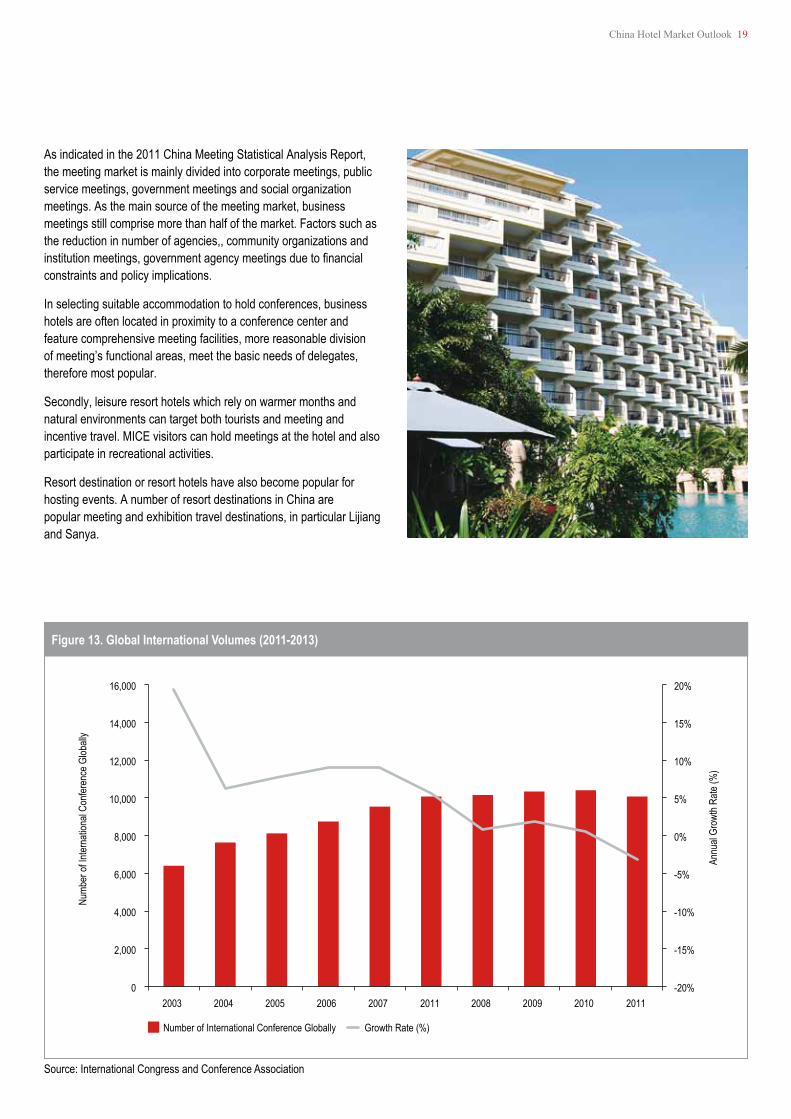
Figure 13. Global International Volumes (2011-2013)
-20%
-15%
-10%
-5%
0%
5%
10%
15%
20%
0
2,000
4,000
6,000
8,000
10,000
12,000
14,000
16,000
2003 2004 2005 2006 2007 2011 2008 2009 2010 2011
Annu
al Gr
owth
Rate
(%)
Numb
er of
Inter
natio
nal C
onfer
ence
Glob
ally
Number of International Conference Globally Growth Rate (%)
Source: International Congress and Conference Association
China Hotel Market Outlook 19
As indicated in the 2011 China Meeting Statistical Analysis Report, the meeting market is mainly divided into corporate meetings, public service meetings, government meetings and social organization meetings. As the main source of the meeting market, business meetings still comprise more than half of the market. Factors such as the reduction in number of agencies,, community organizations and institutionmeetings,governmentagencymeetingsduetofinancialconstraints and policy implications.
In selecting suitable accommodation to hold conferences, business hotels are often located in proximity to a conference center and feature comprehensive meeting facilities, more reasonable division of meeting’s functional areas, meet the basic needs of delegates, therefore most popular.
Secondly, leisure resort hotels which rely on warmer months and natural environments can target both tourists and meeting and incentive travel. MICE visitors can hold meetings at the hotel and also participate in recreational activities.
Resort destination or resort hotels have also become popular for hosting events. A number of resort destinations in China are popular meeting and exhibition travel destinations, in particular Lijiang and Sanya.
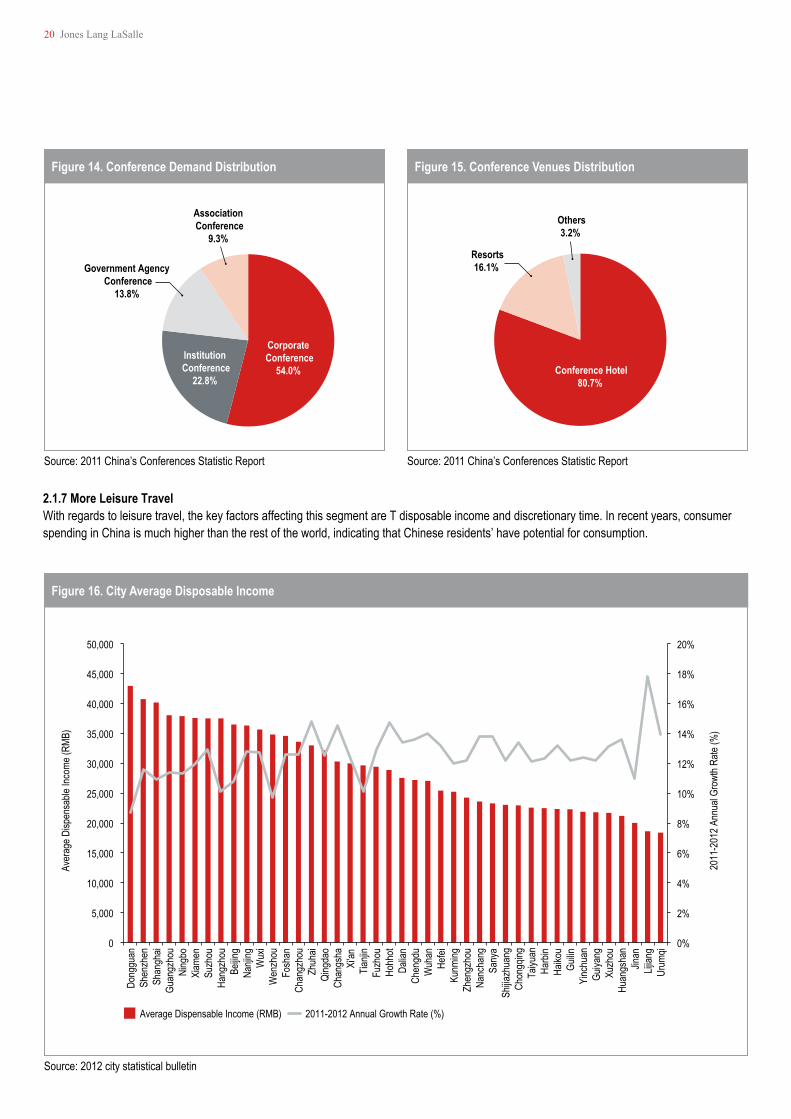
Figure 14. Conference Demand Distribution Figure 15. Conference Venues Distribution
Corporate Conference
54.0% Institution Conference
22.8%
Government Agency Conference
13.8%
Association Conference
9.3%
Conference Hotel80.7%
Resorts16.1%
Others3.2%
Source: 2011 China’s Conferences Statistic Report Source: 2011 China’s Conferences Statistic Report
Figure 16. City Average Disposable Income
0%
2%
4%
6%
8%
10%
12%
14%
16%
18%
20%
0
5,000
10,000
15,000
20,000
25,000
30,000
35,000
40,000
45,000
50,000
Dong
guan
Sh
enzh
en
Shan
ghai
Guan
gzho
u Ni
ngbo
Xi
amen
Su
zhou
Ha
ngzh
ou
Beijin
g Na
njing
W
uxi
Wen
zhou
Fo
shan
Ch
angz
hou
Zhuh
ai Qi
ngda
o Ch
angs
ha
Xi'an
Tia
njin
Fuzh
ou
Hohh
ot Da
lian
Chen
gdu
Wuh
an
Hefei
Ku
nming
Zh
engz
hou
Nanc
hang
Sa
nya
Shijia
zhua
ng
Chon
gqing
Ta
iyuan
Ha
rbin
Haiko
u Gu
ilin
Yinc
huan
Gu
iyang
Xu
zhou
Hu
angs
han
Jinan
Lij
iang
Urum
qi
2011
-201
2 Ann
ual G
rowt
h Rate
(%)
Aver
age D
ispen
sable
Inco
me (R
MB)
Average Dispensable Income (RMB) 2011-2012 Annual Growth Rate (%)
Source: 2012 city statistical bulletin
20 Jones Lang LaSalle
2.1.7 More Leisure Travel With regards to leisure travel, the key factors affecting this segment are T disposable income and discretionary time. In recent years, consumer spending in China is much higher than the rest of the world, indicating that Chinese residents’ have potential for consumption.
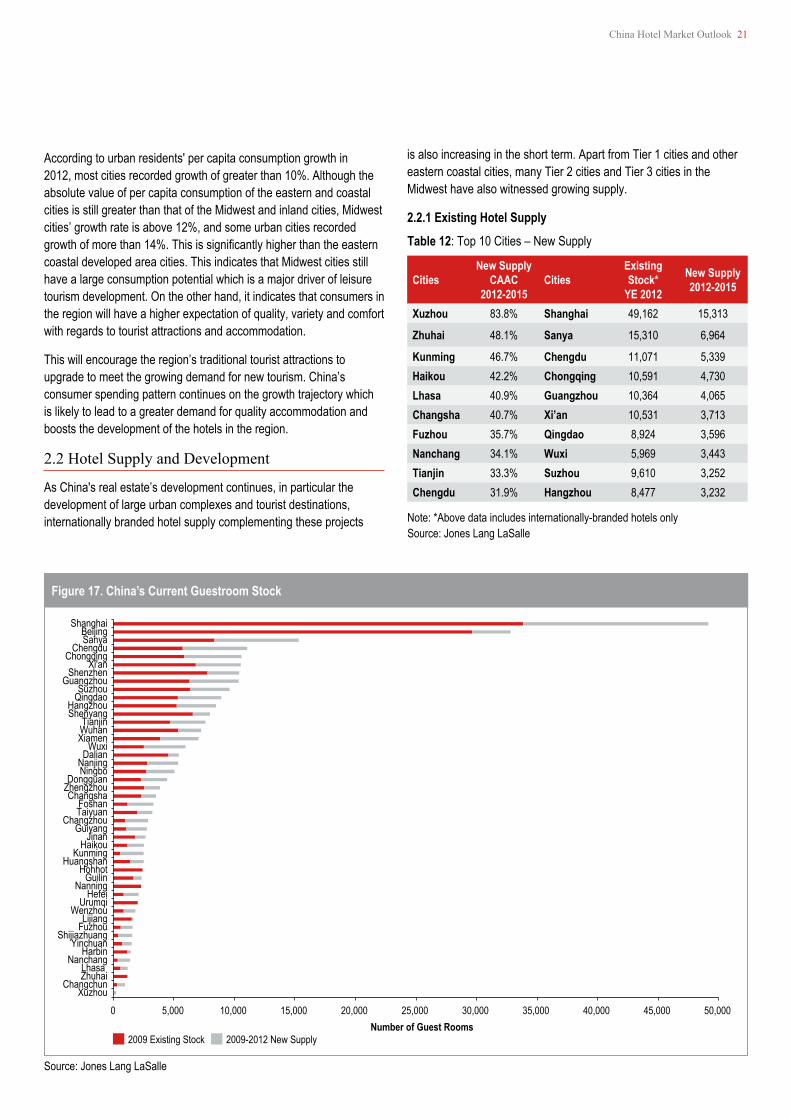
Figure 17. China’s Current Guestroom Stock
0 5,000 10,000 15,000 20,000 25,000 30,000 35,000 40,000 45,000 50,000 Xuzhou
ChangchunZhuhaiLhasa
NanchangHarbin
YinchuanShijiazhuang
FuzhouLijiang
WenzhouUrumqi
HefeiNanning
GuilinHohhot
HuangshanKunming
HaikouJinan
GuiyangChangzhou
TaiyuanFoshan
ChangshaZhengzhouDongguan
NingboNanjingDalian
WuxiXiamenWuhanTianjin
ShenyangHangzhou
QingdaoSuzhou
GuangzhouShenzhen
Xi'anChongqing
ChengduSanyaBeijing
Shanghai
Number of Guest Rooms2009 Existing Stock 2009-2012 New Supply
Source: Jones Lang LaSalle
China Hotel Market Outlook 21
According to urban residents' per capita consumption growth in 2012, most cities recorded growth of greater than 10%. Although the absolute value of per capita consumption of the eastern and coastal cities is still greater than that of the Midwest and inland cities, Midwest cities’ growth rate is above 12%, and some urban cities recorded growthofmorethan14%.Thisissignificantlyhigherthantheeasterncoastal developed area cities. This indicates that Midwest cities still have a large consumption potential which is a major driver of leisure tourism development. On the other hand, it indicates that consumers in the region will have a higher expectation of quality, variety and comfort with regards to tourist attractions and accommodation.
This will encourage the region’s traditional tourist attractions to upgrade to meet the growing demand for new tourism. China’s consumer spending pattern continues on the growth trajectory which is likely to lead to a greater demand for quality accommodation and boosts the development of the hotels in the region.
2.2 Hotel Supply and Development
As China's real estate’s development continues, in particular the development of large urban complexes and tourist destinations, internationally branded hotel supply complementing these projects
is also increasing in the short term. Apart from Tier 1 cities and other eastern coastal cities, many Tier 2 cities and Tier 3 cities in the Midwest have also witnessed growing supply.
2.2.1 Existing Hotel Supply
Note: *Above data includes internationally-branded hotels onlySource: Jones Lang LaSalle
Table 12: Top 10 Cities – New Supply
CitiesNew Supply
CAAC 2012-2015
CitiesExisting Stock*
YE 2012
New Supply 2012-2015
Xuzhou 83.8% Shanghai 49,162 15,313
Zhuhai 48.1% Sanya 15,310 6,964
Kunming 46.7% Chengdu 11,071 5,339Haikou 42.2% Chongqing 10,591 4,730Lhasa 40.9% Guangzhou 10,364 4,065Changsha 40.7% Xi’an 10,531 3,713Fuzhou 35.7% Qingdao 8,924 3,596Nanchang 34.1% Wuxi 5,969 3,443Tianjin 33.3% Suzhou 9,610 3,252Chengdu 31.9% Hangzhou 8,477 3,232
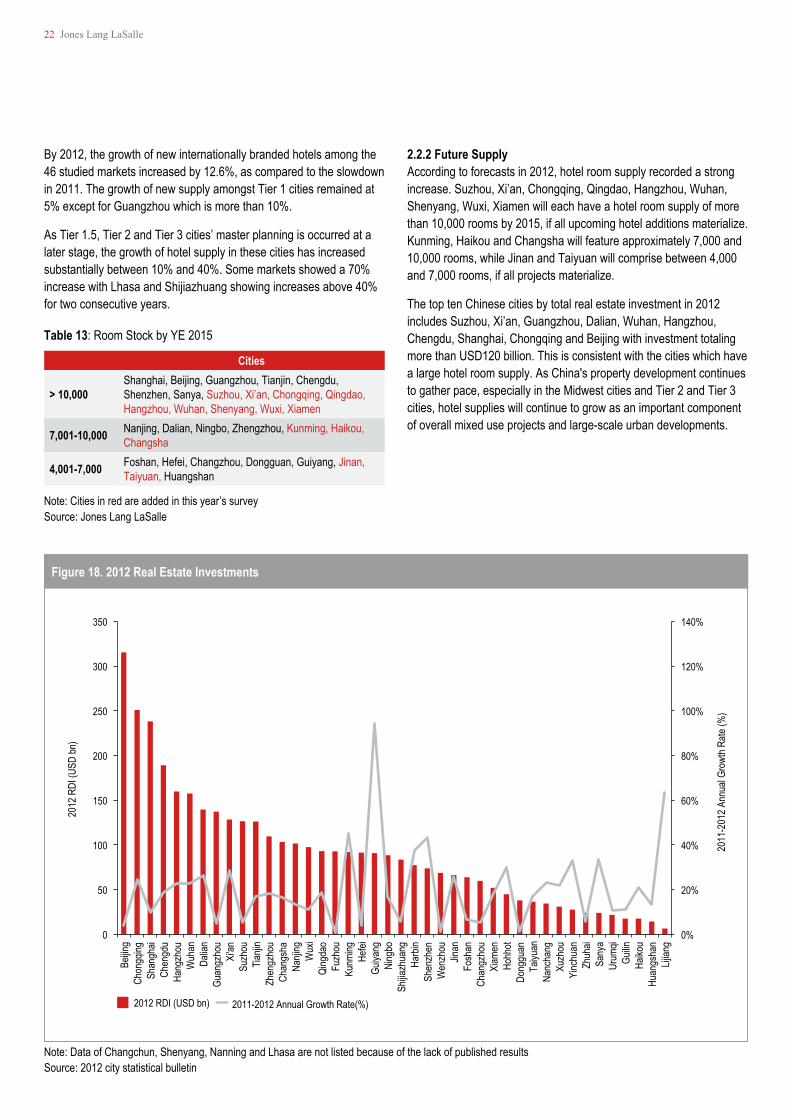
Figure 18. 2012 Real Estate Investments
0%
20%
40%
60%
80%
100%
120%
140%
0
50
100
150
200
250
300
350
Beijin
g Ch
ongq
ingSh
angh
ai Ch
engd
u Ha
ngzh
ou
Wuh
an
Dalia
n Gu
angz
hou
Xi'an
Su
zhou
Tia
njin
Zhen
gzho
uCh
angs
ha
Nanji
ng
Wux
i Qi
ngda
o Fu
zhou
Ku
nming
He
fei
Guiya
ng
Ning
bo
Shijia
zhua
ngHa
rbin
Shen
zhen
W
enzh
ou
Jinan
Fo
shan
Ch
angz
hou
Xiam
en
Hohh
ot Do
nggu
an
Taiyu
an
Nanc
hang
Xu
zhou
Yi
nchu
an
Zhuh
ai Sa
nya
Urum
qi Gu
ilin
Haiko
u Hu
angs
han
Lijian
g
2011
-201
2 Ann
ual G
rowt
h Rate
(%)
2012
RDI
(USD
bn)
2012 RDI (USD bn) 2011-2012 Annual Growth Rate(%)
Note: Data of Changchun, Shenyang, Nanning and Lhasa are not listed because of the lack of published resultsSource: 2012 city statistical bulletin
22 Jones Lang LaSalle
By 2012, the growth of new internationally branded hotels among the 46 studied markets increased by 12.6%, as compared to the slowdown in 2011. The growth of new supply amongst Tier 1 cities remained at 5% except for Guangzhou which is more than 10%.
As Tier 1.5, Tier 2 and Tier 3 cities’ master planning is occurred at a later stage, the growth of hotel supply in these cities has increased substantially between 10% and 40%. Some markets showed a 70% increase with Lhasa and Shijiazhuang showing increases above 40% for two consecutive years.
2.2.2 Future Supply According to forecasts in 2012, hotel room supply recorded a strong increase. Suzhou, Xi’an, Chongqing, Qingdao, Hangzhou, Wuhan, Shenyang, Wuxi, Xiamen will each have a hotel room supply of more than 10,000 rooms by 2015, if all upcoming hotel additions materialize. Kunming, Haikou and Changsha will feature approximately 7,000 and 10,000 rooms, while Jinan and Taiyuan will comprise between 4,000 and 7,000 rooms, if all projects materialize.
The top ten Chinese cities by total real estate investment in 2012 includes Suzhou, Xi’an, Guangzhou, Dalian, Wuhan, Hangzhou, Chengdu, Shanghai, Chongqing and Beijing with investment totaling morethanUSD120billion.Thisisconsistentwiththecitieswhichhavea large hotel room supply. As China's property development continues to gather pace, especially in the Midwest cities and Tier 2 and Tier 3 cities, hotel supplies will continue to grow as an important component of overall mixed use projects and large-scale urban developments.
Note: Cities in red are added in this year’s surveySource: Jones Lang LaSalle
Table 13: Room Stock by YE 2015
Cities
> 10,000Shanghai, Beijing, Guangzhou, Tianjin, Chengdu, Shenzhen, Sanya, Suzhou, Xi’an, Chongqing, Qingdao, Hangzhou, Wuhan, Shenyang, Wuxi, Xiamen
7,001-10,000 Nanjing, Dalian, Ningbo, Zhengzhou, Kunming, Haikou, Changsha
4,001-7,000 Foshan, Hefei, Changzhou, Dongguan, Guiyang, Jinan, Taiyuan, Huangshan
China Hotel Market Outlook 23
3. China Hotel Market Observations
3.1 Points of Focus in 2012
After China entered a new development cycle in 2012, changes in relation to overall market demand and operational pressure were seen. Accommodation demand was further enhanced by the continued growth of China’s tourism industry. Additionally, a more competitive market has resulted in the debut of new international brands, improving the overall experience for hotel guests.
The short-term supply and demand imbalance will bring some operational pressure to hotels. However, this phenomenon will gradually fade with the stability of demand market and stimulus policies longer term. On the other hand, China’s level services, room rate and management systems improved due to the entry of international brands into the market.
In the survey for this year, respondents highlighted the following points:
• The large volume of hotel supply that entered the market with demand to come under pressure as a result of decreased inbound international tourists, despite increased domestic tourism. What measures should hotels take to respond to the supply-demand imbalance?
• How to survive under an increasing cost and operational pressure environment?
• How to deal with increased guests’ expectations and price sensitivity on products and services.
Facing these changes and challenges, surveyed hoteliers still held optimistic or unchanged views of the market. Some of the respondents mentioned that they will handle the challenges by exploring new target markets, expanding marketing distribution channels and by enforcing internal management deal with the competition.
3.2 Breakthrough—Opportunity
Quality Improvement Most surveyed hotels stated an improvement in quality of hotels and market opportunities in light of an increase in competition from the increasing supply and changing demand. Hotels typically use measures such as facility optimization, sales strategy completion and soft service improvement to handle new challenges.
Hotels, especially domestic brands, have made improvements on various aspects, including interior design with themes, guest experience, and detail-oriented customer service and room furniture design and technology advancements.
Although domestic hotel brands do not have a strong distribution networkorglobalmarketingofficesascomparedtointernationalbrands, they can differentiate their products through other with their unique knowledge of the local markets. In recent years, domestic brands not only pay more attention to the improvement of tangible assets such as providing extensive facilities but also focusing on providing good customer service.
Themes and design improvements are just one aspect of customer service. The local expertise which domestic hotels have gathered over the years is also advantageous and is transferring from extensive managementtoscientificmanagementpractices.Localhotelbrandsare also beginning to realize the importance of asset management.
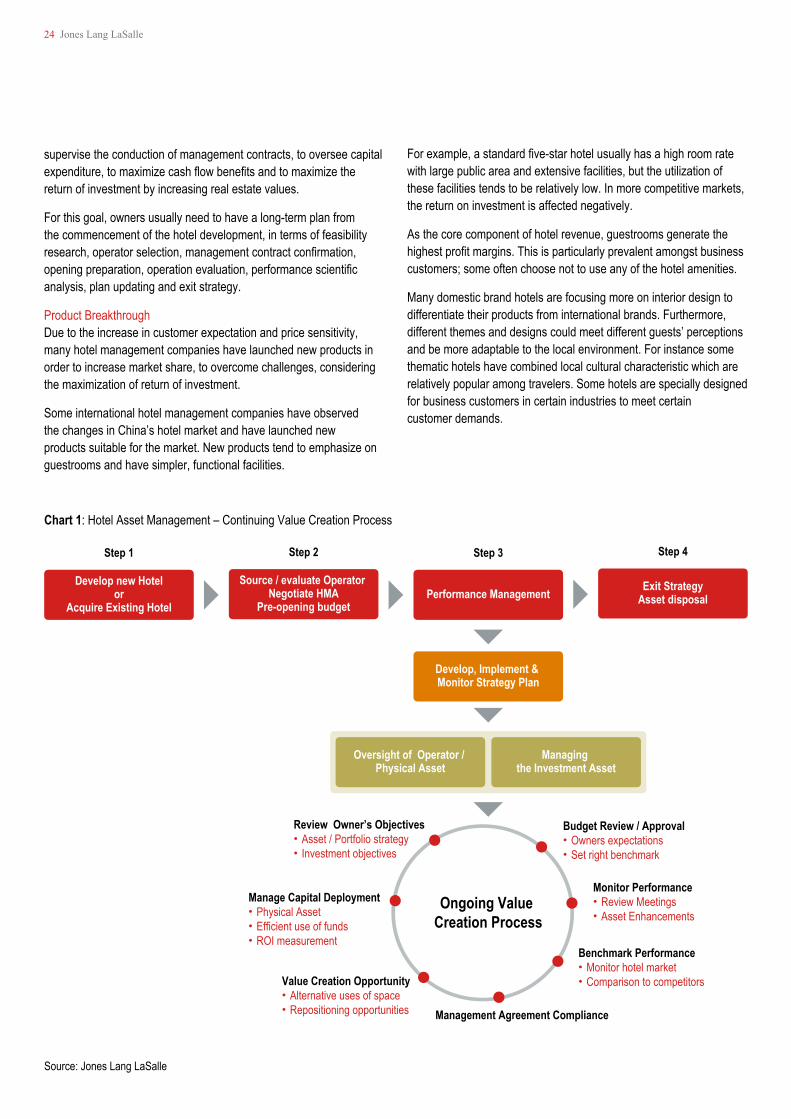
Focus on Asset Management Inaddition,facedwiththeintensifiedcompetitionasaresultofincreased operating costs, hotels have focused on controlling costs andexpenses.Tomaximizecashflowsinthehotel,properhotelassetmanagement of the hotel is critical. The purpose of asset management is to monitor hotel operations, for service standards realization, to
24 Jones Lang LaSalle
supervise the conduction of management contracts, to oversee capital expenditure,tomaximizecashflowbenefitsandtomaximizethereturn of investment by increasing real estate values.
For this goal, owners usually need to have a long-term plan from the commencement of the hotel development, in terms of feasibility research,operatorselection,managementcontractconfirmation,openingpreparation,operationevaluation,performancescientificanalysis, plan updating and exit strategy.
Product Breakthrough Due to the increase in customer expectation and price sensitivity, many hotel management companies have launched new products in order to increase market share, to overcome challenges, considering the maximization of return of investment.
Some international hotel management companies have observed the changes in China’s hotel market and have launched new products suitable for the market. New products tend to emphasize on guestrooms and have simpler, functional facilities.
Forexample,astandardfive-starhotelusuallyhasahighroomratewith large public area and extensive facilities, but the utilization of these facilities tends to be relatively low. In more competitive markets, the return on investment is affected negatively.
As the core component of hotel revenue, guestrooms generate the highestprofitmargins.Thisisparticularlyprevalentamongstbusinesscustomers; some often choose not to use any of the hotel amenities.
Many domestic brand hotels are focusing more on interior design to differentiate their products from international brands. Furthermore, different themes and designs could meet different guests’ perceptions and be more adaptable to the local environment. For instance some thematic hotels have combined local cultural characteristic which are relatively popular among travelers. Some hotels are specially designed for business customers in certain industries to meet certain customer demands.
Source: Jones Lang LaSalle
Chart 1: Hotel Asset Management – Continuing Value Creation Process
Ongoing Value Creation Process
Budget Review / Approval● Owners expectations● Set right benchmark
Monitor Performance ● Review Meetings● Asset Enhancements
Benchmark Performance ● Monitor hotel market ● Comparison to competitors
Management Agreement Compliance
Value Creation Opportunity ● Alternative uses of space● Repositioning opportunities
Manage Capital Deployment● Physical Asset● Efficient use of funds● ROI measurement
Review Owner’s Objectives● Asset / Portfolio strategy● Investment objectives
Develop new Hotelor
Acquire Existing Hotel
Step 1
Source / evaluate Operator Negotiate HMA
Pre-opening budget
Step 2
Performance Management
Step 3
Develop, Implement & Monitor Strategy Plan
Oversight of Operator / Physical Asset
Managing the Investment Asset
Exit StrategyAsset disposal
Step 4
China Hotel Market Outlook 25
3.3 Constant Attention – Tourist Destination Developing
Besides factors such as national real estate policies and developers’ strong interests in hospitality real estate, the large growth of hotel supply, the slow increase of inbound tourism and increased price sensitivity on business travelling are considerations underpinning demand for accommodation. Compared with improving cities’ industrial offering and the increasing quality and quantity of enterprises, developing tourist destinations and the improving leisure tourist demand are all current motivations.
Thedefinitionoftourismandrelatedaccommodationassetshasnotbeenaswelldefined.Wesummarizedseveralfactorsdefiningatouristdestination as follows:
• A real space that travellers stay for at least one day;• The space includes complete tourist infrastructure, tourist
attractions and demand for one-day trip;• There is real administrative boundaries for management confirmationandunifiedimageforthemarketcompetition;
• The destination includes multiple owners and usually have a principle body to form a larger destination; and
• It could be of any size: a country, a region or island, a village, a town or city, or a scenic spot.
Thesefactorsreflectthecoreinfluenceoftouristresourceasattractions.Tourist resources are key factors to active the whole tourist system.
Additionally, tourist destinations are places to meet the demands of travellers by service and facilities and a carrier of tourist reception. Consequently, besides the attraction of tourist resources, the capability of the tourist destination determines its general quality. Accordingly, the planning and management of tourist destinations, especially for reception facilities, became a key factor of the overall success.
In order to satisfy the sustainable development demand, both tourist destinations with existing tourism resources and the ones required for manufactured tourist resource are advised to consider the resource integrationandscientificplanningforthesixbasicelementsoftourism - food, accommodation, transportation, travel, shopping and entertainment. Following on, we will go through the development of two tourism destinations and discuss the considerations and experiences for a successful tourist destination during its development period.
26 Jones Lang LaSalle
Chart 2: Yalong Bay - Six Elements of Tourism Chart 3: Changbaishan International Resort - Six Elements of Tourism
Dinning
Accommodation
Transportation
Tourism Attraction
Shopping
Entertainment
Dinning
Accommodation
Transportation
Tourism Attraction
Shopping
Entertainment
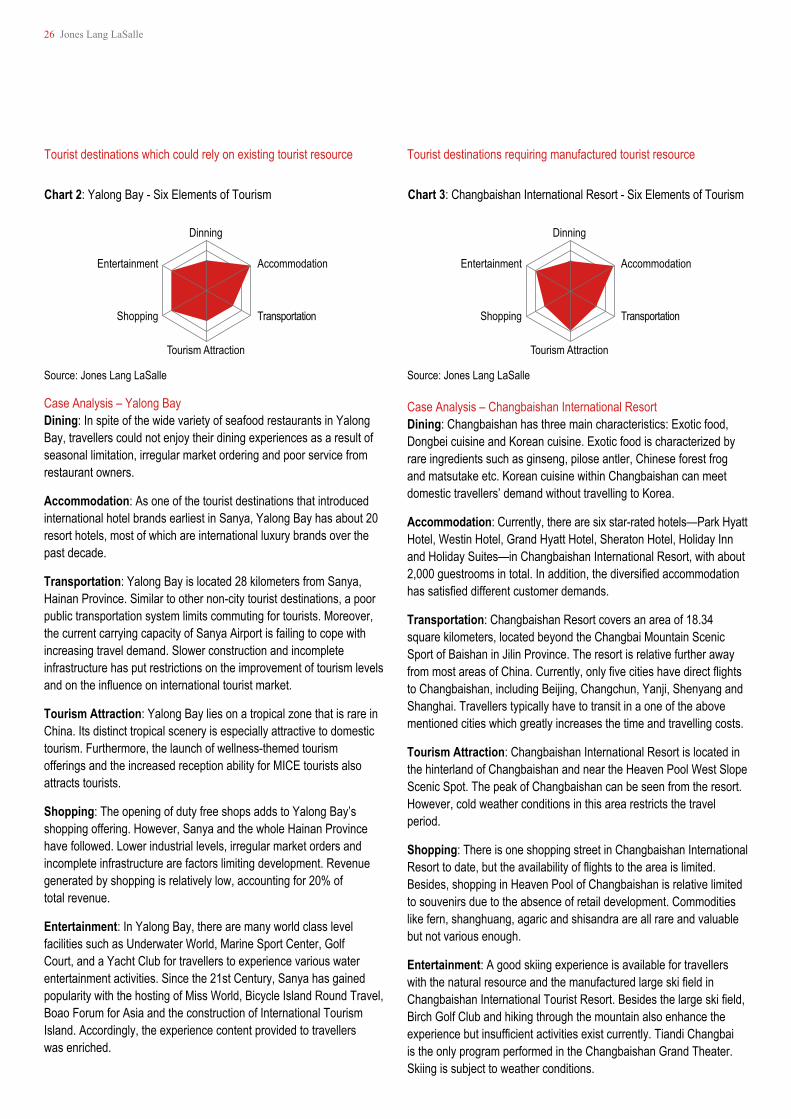
Tourist destinations which could rely on existing tourist resource
Case Analysis – Yalong Bay Dining: In spite of the wide variety of seafood restaurants in Yalong Bay, travellers could not enjoy their dining experiences as a result of seasonal limitation, irregular market ordering and poor service from restaurant owners.
Accommodation: As one of the tourist destinations that introduced international hotel brands earliest in Sanya, Yalong Bay has about 20 resort hotels, most of which are international luxury brands over the past decade.
Transportation: Yalong Bay is located 28 kilometers from Sanya, Hainan Province. Similar to other non-city tourist destinations, a poor public transportation system limits commuting for tourists. Moreover, the current carrying capacity of Sanya Airport is failing to cope with increasing travel demand. Slower construction and incomplete infrastructure has put restrictions on the improvement of tourism levels andontheinfluenceoninternationaltouristmarket.
Tourism Attraction: Yalong Bay lies on a tropical zone that is rare in China. Its distinct tropical scenery is especially attractive to domestic tourism. Furthermore, the launch of wellness-themed tourism offerings and the increased reception ability for MICE tourists also attracts tourists.
Shopping: The opening of duty free shops adds to Yalong Bay’s shopping offering. However, Sanya and the whole Hainan Province have followed. Lower industrial levels, irregular market orders and incomplete infrastructure are factors limiting development. Revenue generated by shopping is relatively low, accounting for 20% of total revenue.
Entertainment: In Yalong Bay, there are many world class level facilitiessuchasUnderwaterWorld,MarineSportCenter,GolfCourt, and a Yacht Club for travellers to experience various water entertainment activities. Since the 21st Century, Sanya has gained popularity with the hosting of Miss World, Bicycle Island Round Travel, Boao Forum for Asia and the construction of International Tourism Island. Accordingly, the experience content provided to travellers was enriched.
Tourist destinations requiring manufactured tourist resource
Case Analysis – Changbaishan International Resort Dining: Changbaishan has three main characteristics: Exotic food, Dongbei cuisine and Korean cuisine. Exotic food is characterized by rare ingredients such as ginseng, pilose antler, Chinese forest frog and matsutake etc. Korean cuisine within Changbaishan can meet domestic travellers’ demand without travelling to Korea.
Accommodation: Currently, there are six star-rated hotels—Park Hyatt Hotel, Westin Hotel, Grand Hyatt Hotel, Sheraton Hotel, Holiday Inn and Holiday Suites—in Changbaishan International Resort, with about 2,000guestroomsintotal.Inaddition,thediversifiedaccommodationhassatisfieddifferentcustomerdemands.
Transportation: Changbaishan Resort covers an area of 18.34 square kilometers, located beyond the Changbai Mountain Scenic Sport of Baishan in Jilin Province. The resort is relative further away frommostareasofChina.Currently,onlyfivecitieshavedirectflightsto Changbaishan, including Beijing, Changchun, Yanji, Shenyang and Shanghai. Travellers typically have to transit in a one of the above mentioned cities which greatly increases the time and travelling costs.
Tourism Attraction: Changbaishan International Resort is located in the hinterland of Changbaishan and near the Heaven Pool West Slope Scenic Spot. The peak of Changbaishan can be seen from the resort. However, cold weather conditions in this area restricts the travel period.
Shopping: There is one shopping street in Changbaishan International Resorttodate,buttheavailabilityofflightstotheareaislimited.Besides, shopping in Heaven Pool of Changbaishan is relative limited to souvenirs due to the absence of retail development. Commodities like fern, shanghuang, agaric and shisandra are all rare and valuable but not various enough.
Entertainment: A good skiing experience is available for travellers withthenaturalresourceandthemanufacturedlargeskifieldinChangbaishanInternationalTouristResort.Besidesthelargeskifield,Birch Golf Club and hiking through the mountain also enhance the experiencebutinsufficientactivitiesexistcurrently.TiandiChangbaiis the only program performed in the Changbaishan Grand Theater. Skiing is subject to weather conditions.
Source: Jones Lang LaSalle Source: Jones Lang LaSalle
China Hotel Market Outlook 27
Several points can be summarized from the case studies above:
• The construction of transportation infrastructure can directly influencetheaccessibilityandsustainabilityoftouristdestinations.Convenient transportation increases the comfort of travelling and is also critical in integrating all the facilities within the tourist destination.
• Seasonality is one of the main issues. One of the solutions is to increase tourist activities during the off-peak season. Currently, the most commonly used measure is to introduce activities related to the culture and characteristic of the destination. For example, hot spring and spa are projects related to the wellness theme. Besides, tourist festival activities could be held in conjunction with local cultural resources. For instance, Yudeng Festival was developed by Penglai National Tourist Resort in Shandong Province, according totheSeaSacrificialCeremony.Toensureall-yearroundactivities,there needs to be efforts by the tourism board in macro planning and technology support. Supporting policies from governments are also critical success factors.
• In terms of shopping and entertainment, this is crucial to extending the travel period and the maximising tourist revenue. Entertainment projects suitable for travellers of all ages would attract visitors from different age groups. Shopping and entertainment facilities are also important tourist attractions, particularly during the off-peak season.
• Developing before detailed planning would affect the overall image of tourist destinations and resources, which can be avoided. The development of Jiuzhaigou is a typical case study. Even though Jiuzhaigou is a protected area, the lack of detailed planning resulted in the development of facilities which might not be suitable for the tourist destination. . For instance, there is a surplus of middle and low end hotels, an inadequate development of luxury hotels andinsufficienttouristsupportingfacilitiesresultinginapricewar.However, the construction of Changbaishan International Resort is an important milestone in China’s tourism industry in this day and age.
• Nowadays, domestic tourism is transferring to recreation from sight-seeing gradually. Travelers pay more attention on the experience in tourist destination and the general quality of the whole trip. Besides the main tourist attractions and infrastructure, tourists are also increasingly concerned about the supporting facilities and infrastructure offered by the tourist destination.
28 Jones Lang LaSalle
In recent years, China's tourism market continued to develop and tourism demand is increasingly diversifying and constantly improving with the enhancements in tourist destinations. Traditional tourist destinations, such as Huangshan, Jiuzhaigou, and Zhangjiajie have a need to enhance the attractiveness of these destinations. The core of these upgrades is developing new tourist attractions, expanding and refurbishing tourism facilities. New tourism projects can meet the higher demand with the support of related tourist infrastructure, which can increase the attractiveness and affect the overall marketability of the tourist destination.
The tourism market is gradually moving from sightseeing to more focus on overall experience and comfort. Therefore, while recreational projects and activities could be used to increase participation and to extend the average length of stay, on the other hand, there is a need to improve the tourist’s overall experience. Since hotels occupy at least
threeofthe“sixelementsoftourism”,thesearekeyfactorstoenhancetravel experience and are important in retaining high-end customers. Thus, some well-established tourist destinations which rely on tourism resources such as natural resources or manmade resources need to adapt to new market demands. New market demands can be met through the development of upscale and luxury hotels to enhance the image of the tourist destination.
Inaddition,influencedbypolicyandstrategicadjustmentofdevelopers, there are several emerging tourist destinations such as Hangzhou Xixi National Wetland Park, Sanya Haitang Bay and Jilin’s Changbaishan International Leisure Zone etc. These projects have conducted pre-planning combining with the government planning, analyzed needs from a market perspective to determine the components of the development to ensure that it will be a sustainable tourist development.
China Hotel Market Outlook 29
4. SummaryIn the face of new challenges including slowing inbound tourism, the impact of new domestic policies, the increasing number of hotel rooms and rising operating costs, hotel respondents this year expressed some concern across the results.
However, according to the results associated with demand motivation, the eastern region has been affected by the impact of slower economic growth and development. The central and western regions are showing stronger momentum in development with new opportunities to the development of China's hotel industry.
In addition, as more internationally-branded hotels continue to enter China, hotel markets in most cities were impacted. This will enhance the level of each region's hospitality offering and improve hotel management at the same time, thus contributing to the overall quality and development of China's hotel industry.
Domestic hotels are also paying more attention to themed hotels, differentiation in asset management and creating hotel products that meet the needs of different market segments to cope with increased competition in response to new challenges. Improved operational efficiencyandmaximizationofthevalueofassetsbyplanningandmanagement is also highlighted.
Finally, as developers and investors remain concerned about city-based hotels, they have set their sights on resort destinations at the same time and especially the development of higher quality destinations. The report analyzed integrating elements and experiences to build a successful tourist destination via case studies, as a special component of this report.
30 Jones Lang LaSalle
ContributorsAndreas Flaig Managing Director, Advisory Asia Jones Lang LaSalle Hotels & Hospitality Group, China +86 21 6133 5549 [email protected]
Tina Jin Senior Associate Jones Lang LaSalle Hotels & Hospitality Group, China +86 10 5922 1359 [email protected]
Monica Wang Analyst Jones Lang LaSalle Hotels & Hospitality Group, China +86 28 6559 6222 [email protected]
ADR Average Daily Rate OCC Occupancy RevPAR Revenue Per Available Room GDP Gross Domestic Product
Attachment: List of Provinces in each region North China: Heilongjiang, Jilin, Liaoning, Tianjin, Hebei East China: Shanghai, Jiangsu, Zhejiang, Shandong Central China: Shanxi, Anhui, Jiangxi, Henan, Hubei, Hunan, Fujian South China: Guangdong, Hainan, Guangxi West China: Inner Mongolia, Chongqing, Sichuan, Guizhou, Yunnan, Tibet, Shaanxi, Gansu, Qinghai, Ningxia, Xinjiang
China Hotel Market Outlook 31
Disclaimer
Thisreportisconfidentialtotherecipientofthereport.Noreferencetothereportoranypartofitmaybepublishedinanydocument,statement or circular or in any communication with third parties without the prior written consent of Jones Lang LaSalle Hotels & HospitalityGroup,includingspecificallyinrelationtotheformandcontextinwhichitwillappear.
We stress that forecasting is a problematical exercise which at best should be regarded as an indicative assessment of possibilities rather than absolute certainties. The process of making forward projections involves assumptions in respect of a considerable number ofvariableswhichareacutelysensitivetochangingconditions,variationsinanyoneofwhichmaysignificantlyaffecttheoutcomeandwe draw your attention to this factor. Jones Lang LaSalle Hotels & Hospitality Group makes no representation, warranty, assurance or guarantee with respect to any material with which this report may be issued and this report should not be taken as an endorsement of or recommendation on any participation by any intending investor or any other party in any transaction whatsoever.
Thisreporthasbeenproducedsolelyasageneralguideanddoesnotconstituteadvice.Usersshouldnotrelyonthisreportandmustmake their own enquiries to verify and satisfy themselves of all aspects of information set out in the report. We have used and relied upon information from sources generally regarded as authoritative and reputable, but the information obtained from these sources may nothavebeenindependentlyverifiedbyJonesLangLaSalleHotels&HospitalityGroup.
Whilst the material contained in the report has been prepared in good faith and with due care, no representation or warranty is made in relation to the accuracy, currency, completeness, suitability or otherwise of the whole or any part of the report. Jones Lang LaSalle Hotels&HospitalityGroup,itsofficers,employees,subcontractorsandagentsshallnotbeliable(totheextentpermittedbylaw)toanypersonforanyloss,liability,damageorexpense(“liability”)arisingdirectlyorindirectlyfromorconnectedinanywaywithanyuseoforreliance on this report. If any liability is established, notwithstanding this exclusion, it shall not exceed $1,000.
Jones Lang LaSalle Hotels & Hospitality Group
Jones Lang LaSalle’s Hotels & Hospitality Group serves as the hospitality industry’s global leader in real estate services for luxury, upscale, select service and budget hotels; timeshare and fractional ownership properties; convention centers; mixed-use developments andotherhospitalityproperties.Thefirm’smorethan265dedicatedhotelandhospitalityexpertspartnerwithinvestorsandowner/operators around the globe to support and shape investment strategies that deliver maximum value throughout the entire lifecycle of an asset.Inthelastfiveyears,theteamcompletedmoretransactionsthananyotherhotelsandhospitalityrealestateadvisorintheworldtotalingnearlyUS$25billion,whilealsocompletingapproximately4,000advisoryandvaluationassignments.Thegroup’shotelsandhospitality specialists provide independent and expert advice to clients, backed by industry-leading research.
For more news, videos and research from Jones Lang LaSalle’s Hotels & Hospitality Group, please visit: www.jll.com/hospitality
China Tourist Hotel Association (CTHA)
EstablishedinFebruary1982,theCTHAisanationalnon-profitindustryorganizationformed,inavoluntarymanner,bytheassociationof tourist hotels, local hotels, hotel management companies, hotel equipment & supplies providers and other relevant organizations in China as well as the hotel experts and senior scholars, under the operational guidance, supervision and management of the China National Tourism Administration. The CTHA’s mission is to act in compliance with local law, protect its members’ legal rights and interests and serve as a bridge between its members and the Government. Today, the CTHA counts 2,700 members, 333 directors, 115 standing directors and 25 vice presidents. Mr. Zhang Run Gang is the president of the Association. The CTHA serves its members by strengthening communication amongst its members, collecting information on the domestic and international hotel market, providing hotel training programs and forums and by liaising with overseas hotel & tourism organizations. In 1994, the CTHA joined the International Hotel & Restaurant Association as one of its directors.
COPYRIGHT © JONES LANG LASALLE 2013 All rights reserved. No part of this publication may be published without prior written permission from Jones Lang LaSalle. The information in this publication should be regarded solely as a general guide. Whilst care has been taken in its preparation no representation is made or responsibility accepted for the accuracy of the whole or any part. We stress that forecasting is a problematical exercise which at best should be regarded as an indicative assessment of possibilities rather than absolute certainties. The process of making forward projections involves assumptions regarding numerous variables which are acutely sensitive to changing conditions, variations in any one of which may significantly affect the outcome, and we draw your attention to this factor.
www.jll.com/hospitality
Hotels & Hospitality’s Dedicated Offices
Atlanta 3344 Peachtree Road, Suite 1200 Atlanta,GA30326,UnitedStates tel +1 404 995 2100 fax +1 404 995 2109Bangkok 19/F Sathorn City Tower 175 South Sathorn Road Tungmahamek, Sathorn Bangkok 10120, Thailand tel +66 2 624 6400 fax +66 2 679 6519Barcelona Passeig de Gracia 11 4a Planta, Esc. A 08007 Barcelona, Spain tel +34 93 318 5353 fax +34 93 301 2999Beijing 11/F China World Tower 1 Jianguomenwai Avenue Beijing 100004, China (PRC) tel +86 10 5922 1300 fax +86 10 5922 1346Brisbane Level 33, Central Plaza One 345 Queen Street Brisbane QLD 4000, Australia tel +61 7 3231 1400 fax +61 7 3231 1411Buenos Aires Av Cordoba 673 7th Floor C1054AAS Buenos Aires, Argentina tel +54 11 4893 2600 fax +54 11 4893 2080Chengdu 30/F, Tower 1, Plaza Central 8 Shuncheng Avenue Chengdu 610016 Sichuan, China (PRC) tel +86 28 6680 5000 fax +86 28 6680 5096Chicago 200 E Randolph Drive ChicagoIL60601,UnitedStates tel +1 312 782 5800 fax +1 312 782 4339
Dallas 8343 Douglas Avenue, Suite 100 DallasTX75225,UnitedStates tel +1 214 438 6100 fax +1 214 438 6101Denver 1225 Seventeenth Street Suite 1900 Denver,CO80202,UnitedStates tel +1 303 260 6500 fax +1 303 260 6501Dubai Emaar Square, Building1Office403, Sheikh Zayed Road, POBox214029,Dubai,UAE tel +971 4 426 6999 fax +971 4 365 3260 Düsseldorf Kaistrasse 5 40221 Düsseldorf, Germany tel +49 211 13006 0 fax +49 211 13399 0Exeter Keble House, Southernhay East Exeter EX1 1NT tel +44 1392 423696 fax +44 1392 423698Frankfurt Wilhelm-Leuschner-Strasse 78 60329 Frankfurt, Germany tel +49 69 2003 0 fax +49 69 2003 1040Glasgow 150 St Vincent Street GlasgowG25ND,UnitedKingdom tel +44 141 248 6040 fax +44 141 567 6678 Istanbul Yesim Sk. No:2 Akatlar - Levent Istanbul 34335, Turkey tel +90 212 350 0800 fax +90 212 350 0806
Jakarta Jakarta Stock Exchange Building Tower 2, 19th Floor, Sudirman Central, Business District Jl. Jend Sudirman Kav 52-53 Jakarta 12190, Indonesia tel +62 21 2922 3888 fax +62 21 515 3232Leeds St Paul’s House, Park Square LeedsLS12ND,UnitedKingdom tel +44 113 244 6440 fax +44 113 245 4664London 30 Warwick Street LondonW1B5NH,UnitedKingdom tel +44 20 7493 6040 fax +44 20 7399 5694Los Angeles 515 South Flower Street, Suite 1300 LosAngeles,CA90071,UnitedStates tel +1 213 239 6000 fax +1 213 239 6100Lyon 55 Avenue Foch 69006 Lyon, France tel +33 4 7889 2626 fax +33 4 7889 0476Madrid Paseo de la Castellana, 51 Planta 5, 28046 Madrid, Spain tel +34 91 789 1100 fax +34 91 789 1200Manchester 1 Piccadilly Gardens Manchester,M11RG,UnitedKingdom tel +44 161 828 6440 fax +44 161 828 6490Marseille 2 Place Sadi-Carnot 13002 Marseille, France tel +33 4 9509 1313 fax +33 4 9509 1300Melbourne Level 21, Bourke Place 600 Bourke Street Melbourne VIC 3000, Australia tel +61 3 9672 6666 fax +61 3 9600 1715
Mexico City Monte Pelvoux 111, Piso 5 Lomas de Chapultepec México, DF 11000, Mexico tel +52 55 5980 8054 fax +52 55 5202 4377Miami 2333 Ponce de Leon Blvd, Suite 1000 Coral Gables, Florida 33134 UnitedStates tel +1 305 529 6345 fax +1 305 529 6398Milan Via Agnello 8 20121 Milan, Italy tel +39 2 8586 8672 fax +39 2 8586 8670Moscow Kosmodamianskaya Nab. 52/3 Moscow 115054, Russia tel +7 495 737 8000 fax +7 495 737 8011Munich Ludwigpalais Ludwigstrasse 6 80539 Munich, Germany tel +49 89 2900 8882 fax +49 89 2900 8888 New Delhi Level 9 Tower A Global Business Park, Mehrauli Gurgaon Road, Sector 26, Gurgaon 122002 Haryana, India tel +91 124 4605000 fax +91 124 4605001New York 330 Madison Avenue NewYorkNY10017,UnitedStates tel +1 212 812 5700 fax + 1 212 421 5640Paris 40-42, rue La Boétie 75008 Paris, France tel +33 1 4055 1718 fax +33 1 4055 1868
Perth Level 29, Central Park 152-158 St Georges Terrace Perth WA 6000 tel +61 8 9322 5111 fax +61 8 9481 0107Rome Via Bissolati 20 00187 Rome, Italy tel +39 6 4200 6771 fax +39 6 4200 6720San Francisco One Front Street, Suite 300 SanFrancisco,CA94111,UnitedStates tel +1 415 395 4900 fax +1 415 955 1150São Paulo Rua Joaquim Floriano, 72 – cj. 97 04534-000 São Paulo, SP, Brazil tel +55 11 3071 0747 fax +55 11 3071 4766Shanghai 25/F Tower 2 Plaza 66 1366 Nanjing Road (West) Jing An District Shanghai 200040, China (PRC) tel +86 21 6393 3333 fax +86 21 62888 2246Singapore 9RafflesPlace,#38-01RepublicPlaza Singapore 048619 tel +65 6536 0606 fax +65 6533 2107Sydney Level 26, 420 George Street Sydney NSW 2000, Australia tel +61 2 9220 8777 fax +61 2 9220 8765Tokyo 4th Floor, Prudential Tower 2-13-10 Nagatacho, Chiyoda-ku Tokyo 100-0014, Japan tel +81 3 5501 9240 fax +81 3 5501 9211Washington D.C. 1801 K Street NW, Suite 1000 Washington,DC20006,UnitedStates tel +1 202 719 5000 fax +1 202 719 5001