Embed Size (px)
Citation preview
CIMA Paper P2
Advanced Management Accounting
Study Text
Published by: Kaplan Publishing UK
Unit 2 The Business Centre, Molly Millars Lane, Wokingham, Berkshire RG41 2QZ
Copyright © 2015 Kaplan Financial Limited. All rights reserved.
No part of this publication may be reproduced, stored in a retrieval system or transmitted in any form or by any means electronic, mechanical, photocopying, recording or otherwise without the prior written permission of the publisher.
Acknowledgements
We are grateful to the CIMA for permission to reproduce past examination questions. The answers to CIMA Exams have been prepared by Kaplan Publishing, except in the case of the CIMA November 2010 and subsequent CIMA Exam answers where the official CIMA answers have been reproduced.
Notice
The text in this material and any others made available by any Kaplan Group company does not amount to advice on a particular matter and should not be taken as such. No reliance should be placed on the content as the basis for any investment or other decision or in connection with any advice given to third parties. Please consult your appropriate professional adviser as necessary. Kaplan Publishing Limited and all other Kaplan group companies expressly disclaim all liability to any person in respect of any losses or other claims, whether direct, indirect, incidental, consequential or otherwise arising in relation to the use of such materials.
Kaplan is not responsible for the content of external websites. The inclusion of a link to a third party website in this text should not be taken as an endorsement.
British Library Cataloguing in Publication Data
A catalogue record for this book is available from the British Library.
ISBN: 9781784153007
Printed and bound in Great Britain.
ii
Contents
Page
Chapter 1 ActivityBased Costing and ActivityBased Management
1
Chapter 2 The Modern Business Environment 53
Chapter 3 Costing Techniques 93
Chapter 4 Learning Curves 123
Chapter 5 Responsibility Centres 151
Chapter 6 Performance Measures and Budgetary Control 177
Chapter 7 Alternative measures of performance 207
Chapter 8 The Pricing Decision 243
Chapter 9 Transfer Pricing 297
Chapter 10 Investment appraisal techniques 347
Chapter 11 Further aspects of investment appraisal 413
Chapter 12 The treatment of uncertainty and risk in decision making
495
Chapter 13 Risk Management 559
Chapter 14 Collecting and using information 589
iii

iv

Introduction
v
chapterIntro
How to use the materials
These official CIMA learning materials have been carefully designed to make your learning experience as easy as possible and to give you the best chances of success in your Objective Test Examination.
The product range contains a number of features to help you in the study process. They include:
This Study Text has been designed with the needs of home study and distance learning candidates in mind. Such students require very full coverage of the syllabus topics, and also the facility to undertake extensive question practice. However, the Study Text is also ideal for fully taught courses.
The main body of the text is divided into a number of chapters, each of which is organised on the following pattern:
• a detailed explanation of all syllabus areas;
• extensive ‘practical’ materials;
• generous question practice, together with full solutions.
• Detailed learning outcomes. These describe the knowledge expected after your studies of the chapter are complete. You should assimilate these before beginning detailed work on the chapter, so that you can appreciate where your studies are leading.
• Stepbystep topic coverage. This is the heart of each chapter, containing detailed explanatory text supported where appropriate by worked examples and exercises. You should work carefully through this section, ensuring that you understand the material being explained and can tackle the examples and exercises successfully. Remember that in many cases knowledge is cumulative: if you fail to digest earlier material thoroughly, you may struggle to understand later chapters.
• Activities. Some chapters are illustrated by more practical elements, such as comments and questions designed to stimulate discussion.
vivi
If you work conscientiously through this Official CIMA Study Text according to the guidelines above you will be giving yourself an excellent chance of success in your Objective Test Examination. Good luck with your studies!
Quality and accuracy are of the utmost importance to us so if you spot an error in any of our products, please send an email to [email protected] with full details, or follow the link to the feedback form in MyKaplan.
Our Quality Coordinator will work with our technical team to verify the error and take action to ensure it is corrected in future editions.
• Question practice. The text contains three styles of question: – Examstyle objective test questions (OTQs)
– ‘Integration’ questions – these test your ability to understand topics within a wider context. This is particularly important with calculations where OTQs may focus on just one element but an integration question tackles the full calculation, just as you would be expected to do in the workplace.
– ‘Case’ style questions – these test your ability to analyse and discuss issues in greater depth, particularly focusing on scenarios that are less clear cut than in the Objective Test Examination, and thus provide excellent practice for developing the skills needed for success in the Management Level Case Study Examination.
• Solutions. Avoid the temptation merely to ‘audit’ the solutions provided. It is an illusion to think that this provides the same benefits as you would gain from a serious attempt of your own. However, if you are struggling to get started on a question you should read the introductory guidance provided at the beginning of the solution, where provided, and then make your own attempt before referring back to the full solution.
Icon Explanations
Definition – These sections explain important areas of knowledge which must be understood and reproduced in an assessment environment.
Key point – Identifies topics which are key to success and are often examined.
Supplementary reading – These sections will help to provide a deeper understanding of core areas. The supplementary reading is NOT optional reading. It is vital to provide you with the breadth of knowledge you will need to address the wide range of topics within your syllabus that could feature in an assessment question. Reference to this text is vital when self studying.
Test your understanding – Following key points and definitions are exercises which give the opportunity to assess the understanding of these core areas.
vii

Illustration – To help develop an understanding of particular topics. The illustrative examples are useful in preparing for the Test your understanding exercises.
Exclamation mark – This symbol signifies a topic which can be more difficult to understand. When reviewing these areas, care should be taken.
Study technique
Passing exams is partly a matter of intellectual ability, but however accomplished you are in that respect you can improve your chances significantly by the use of appropriate study and revision techniques. In this section we briefly outline some tips for effective study during the earlier stages of your approach to the Objective Test Examination. We also mention some techniques that you will find useful at the revision stage.
Planning
To begin with, formal planning is essential to get the best return from the time you spend studying. Estimate how much time in total you are going to need for each subject you are studying. Remember that you need to allow time for revision as well as for initial study of the material.
With your study material before you, decide which chapters you are going to study in each week, and which weeks you will devote to revision and final question practice.
Prepare a written schedule summarising the above and stick to it!
It is essential to know your syllabus. As your studies progress you will become more familiar with how long it takes to cover topics in sufficient depth. Your timetable may need to be adapted to allocate enough time for the whole syllabus.
Students are advised to refer to the notice of examinable legislation published regularly in CIMA’s magazine (Financial Management), the students enewsletter (Velocity) and on the CIMA website, to ensure they are uptodate.
The amount of space allocated to a topic in the Study Text is not a very good guide as to how long it will take you. The syllabus weighting is the better guide as to how long you should spend on a syllabus topic.
Tips for effective studying
(1) Aim to find a quiet and undisturbed location for your study, and plan as far as possible to use the same period of time each day. Getting into a routine helps to avoid wasting time. Make sure that you have all the materials you need before you begin so as to minimise interruptions.
viii
(2) Store all your materials in one place, so that you do not waste time searching for items every time you want to begin studying. If you have to pack everything away after each study period, keep your study materials in a box, or even a suitcase, which will not be disturbed until the next time.
(3) Limit distractions. To make the most effective use of your study periods you should be able to apply total concentration, so turn off all entertainment equipment, set your phones to message mode, and put up your ‘do not disturb’ sign.
(4) Your timetable will tell you which topic to study. However, before diving in and becoming engrossed in the finer points, make sure you have an overall picture of all the areas that need to be covered by the end of that session. After an hour, allow yourself a short break and move away from your Study Text. With experience, you will learn to assess the pace you need to work at. Each study session should focus on component learning outcomes – the basis for all questions.
(5) Work carefully through a chapter, making notes as you go. When you have covered a suitable amount of material, vary the pattern by attempting a practice question. When you have finished your attempt, make notes of any mistakes you made, or any areas that you failed to cover or covered more briefly. Be aware that all component learning outcomes will be tested in each examination.
(6) Make notes as you study, and discover the techniques that work best for you. Your notes may be in the form of lists, bullet points, diagrams, summaries, ‘mind maps’, or the written word, but remember that you will need to refer back to them at a later date, so they must be intelligible. If you are on a taught course, make sure you highlight any issues you would like to follow up with your lecturer.
(7) Organise your notes. Make sure that all your notes, calculations etc. can be effectively filed and easily retrieved later.
Objective Test
Objective Test questions require you to choose or provide a response to a question whose correct answer is predetermined.
The most common types of Objective Test question you will see are:
• Multiple choice, where you have to choose the correct answer(s) from a list of possible answers. This could either be numbers or text.
• Multiple choice with more choices and answers, for example, choosing two correct answers from a list of eight possible answers. This could either be numbers or text.
• Single numeric entry, where you give your numeric answer, for example, profit is $10,000.
• Multiple entry, where you give several numeric answers.
ix
In every chapter of this Study Text we have introduced these types of questions, but obviously we have had to label answers A, B, C etc rather than using click boxes. For convenience we have retained quite a few questions where an initial scenario leads to a number of subquestions. There will be questions of this type in the Objective Test Examination but they will rarely have more than three subquestions.
Guidance re CIMA onscreen calculator
As part of the CIMA Objective Test software, candidates are now provided with a calculator. This calculator is onscreen and is available for the duration of the assessment. The calculator is available in each of the Objective Test Examinations and is accessed by clicking the calculator button in the top left hand corner of the screen at any time during the assessment.
All candidates must complete a 15minute tutorial before the assessment begins and will have the opportunity to familiarise themselves with the calculator and practise using it.
Candidates may practise using the calculator by downloading and installing the practice exam at http://www.vue.com/athena/. The calculator can be accessed from the fourth sample question (of 12).
Please note that the practice exam and tutorial provided by Pearson VUE at http://www.vue.com/athena/ is not specific to CIMA and includes the full range of question types the Pearson VUE software supports, some of which CIMA does not currently use.
Fundamentals of Objective Tests
The Objective Tests are 90minute assessments comprising 60 compulsory questions, with one or more parts. There will be no choice and all questions should be attempted.
• True/false questions, where you state whether a statement is true or false.
• Matching pairs of text, for example, matching a technical term with the correct definition.
• Other types could be matching text with graphs and labelling graphs/diagrams.
Structure of subjects and learning outcomes
Each subject within the syllabus is divided into a number of broad syllabus topics. The topics contain one or more lead learning outcomes, related component learning outcomes and indicative knowledge content.
x

A learning outcome has two main purposes:
The learning outcomes are part of a hierarchy of learning objectives. The verbs used at the beginning of each learning outcome relate to a specific learning objective, e.g.
Calculate the breakeven point, profit target, margin of safety and profit/volume ratio for a single product or service.
The verb ‘calculate’ indicates a level three learning objective. The following tables list the verbs that appear in the syllabus learning outcomes and examination questions.
(a) To define the skill or ability that a well prepared candidate should be able to exhibit in the examination.
(b) To demonstrate the approach likely to be taken in examination questions.
CIMA VERB HIERARCHY
CIMA place great importance on the definition of verbs in structuring Objective Test Examinations. It is therefore crucial that you understand the verbs in order to appreciate the depth and breadth of a topic and the level of skill required. The Objective Tests will focus on levels one, two and three of the CIMA hierarchy of verbs. However they will also test levels four and five, especially at the management and strategic levels. You can therefore expect to be tested on knowledge, comprehension, application, analysis and evaluation in these examinations.
Level 1: KNOWLEDGE
What you are expected to know.
For example you could be asked to make a list of the advantages of a particular information system by selecting all options that apply from a given set of possibilities. Or you could be required to define relationship marketing by selecting the most appropriate option from a list.
VERBS USED
DEFINITION
List Make a list of.
State Express, fully or clearly, the details of/facts of.
Define Give the exact meaning of.
xi
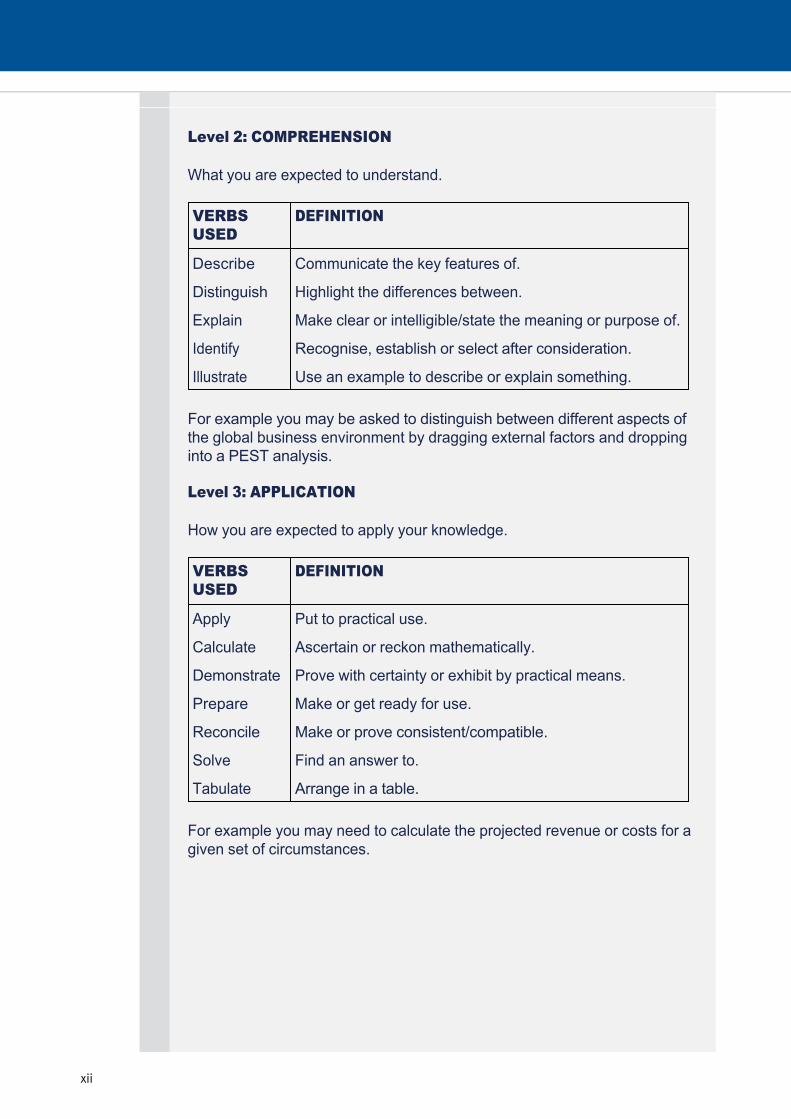
Level 2: COMPREHENSION
What you are expected to understand.
For example you may be asked to distinguish between different aspects of the global business environment by dragging external factors and dropping into a PEST analysis.
Level 3: APPLICATION
How you are expected to apply your knowledge.
For example you may need to calculate the projected revenue or costs for a given set of circumstances.
VERBS USED
DEFINITION
Describe Communicate the key features of.
Distinguish Highlight the differences between.
Explain Make clear or intelligible/state the meaning or purpose of.
Identify Recognise, establish or select after consideration.
Illustrate Use an example to describe or explain something.
VERBS USED
DEFINITION
Apply Put to practical use.
Calculate Ascertain or reckon mathematically.
Demonstrate Prove with certainty or exhibit by practical means.
Prepare Make or get ready for use.
Reconcile Make or prove consistent/compatible.
Solve Find an answer to.
Tabulate Arrange in a table.
xii

Level 4: ANALYSIS
How you are expected to analyse the detail of what you have learned.
For example you may be required to interpret an inventory ratio by selecting the most appropriate statement for a given set of circumstances and data.
Level 5: EVALUATION
How you are expected to use your learning to evaluate, make decisions or recommendations.
For example you may be asked to recommend and select an appropriate course of action based on a short scenario.
VERBS USED
DEFINITION
Analyse Examine in detail the structure of.
Categorise Place into a defined class or division.
Compare/ contrast Show the similarities and/or differences between.
Construct Build up or compile.
Discuss Examine in detail by argument.
Interpret Translate into intelligible or familiar terms.
Prioritise Place in order of priority or sequence for action.
Produce Create or bring into existence.
VERBS USED
DEFINITION
Advise Counsel, inform or notify.
Evaluate Appraise or assess the value of.
Recommend Propose a course of action.
xiii

xiv
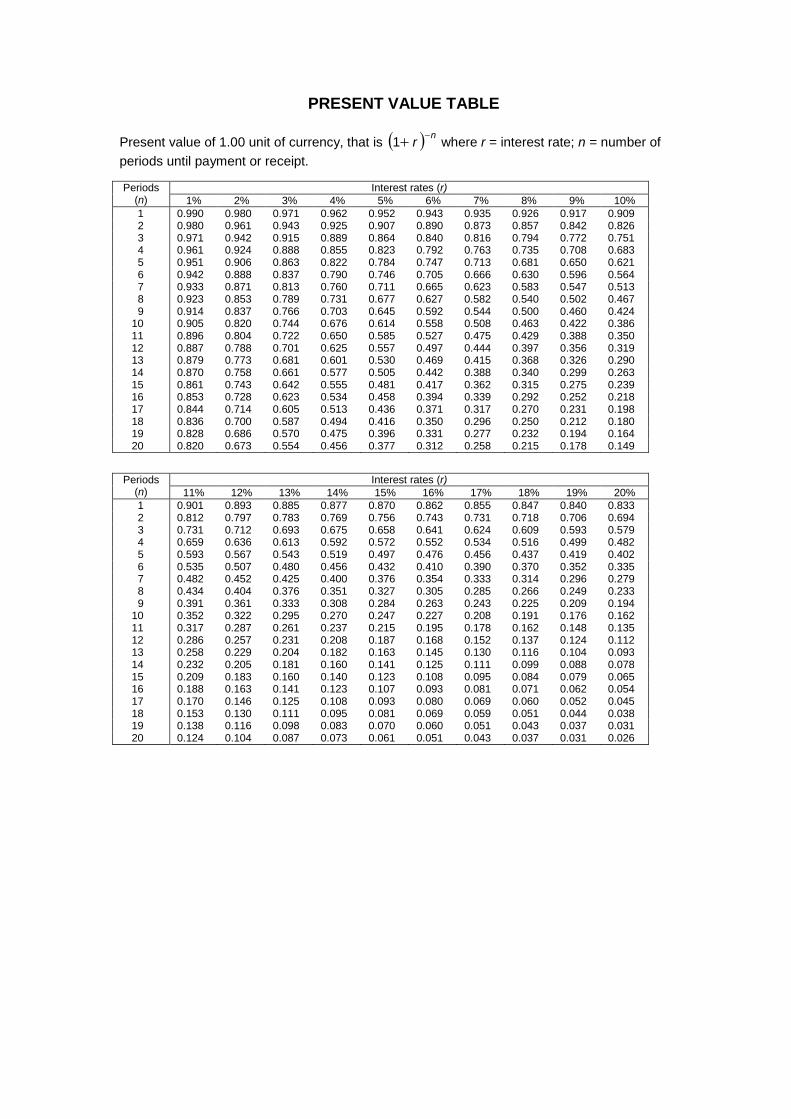
PRESENT VALUE TABLE
Present value of 1.00 unit of currency, that is ( ) nr −+1 where r = interest rate; n = number of periods until payment or receipt. Periods
(n) Interest rates (r)
1% 2% 3% 4% 5% 6% 7% 8% 9% 10% 1 0.990 0.980 0.971 0.962 0.952 0.943 0.935 0.926 0.917 0.909 2 0.980 0.961 0.943 0.925 0.907 0.890 0.873 0.857 0.842 0.826 3 0.971 0.942 0.915 0.889 0.864 0.840 0.816 0.794 0.772 0.751 4 0.961 0.924 0.888 0.855 0.823 0.792 0.763 0.735 0.708 0.683 5 0.951 0.906 0.863 0.822 0.784 0.747 0.713 0.681 0.650 0.621 6 0.942 0.888 0.837 0.790 0.746 0.705 0.666 0.630 0.596 0.564 7 0.933 0.871 0.813 0.760 0.711 0.665 0.623 0.583 0.547 0.513 8 0.923 0.853 0.789 0.731 0.677 0.627 0.582 0.540 0.502 0.467 9 0.914 0.837 0.766 0.703 0.645 0.592 0.544 0.500 0.460 0.424 10 0.905 0.820 0.744 0.676 0.614 0.558 0.508 0.463 0.422 0.386 11 0.896 0.804 0.722 0.650 0.585 0.527 0.475 0.429 0.388 0.350 12 0.887 0.788 0.701 0.625 0.557 0.497 0.444 0.397 0.356 0.319 13 0.879 0.773 0.681 0.601 0.530 0.469 0.415 0.368 0.326 0.290 14 0.870 0.758 0.661 0.577 0.505 0.442 0.388 0.340 0.299 0.263 15 0.861 0.743 0.642 0.555 0.481 0.417 0.362 0.315 0.275 0.239 16 0.853 0.728 0.623 0.534 0.458 0.394 0.339 0.292 0.252 0.218 17 0.844 0.714 0.605 0.513 0.436 0.371 0.317 0.270 0.231 0.198 18 0.836 0.700 0.587 0.494 0.416 0.350 0.296 0.250 0.212 0.180 19 0.828 0.686 0.570 0.475 0.396 0.331 0.277 0.232 0.194 0.164 20 0.820 0.673 0.554 0.456 0.377 0.312 0.258 0.215 0.178 0.149
Periods
(n) Interest rates (r)
11% 12% 13% 14% 15% 16% 17% 18% 19% 20% 1 0.901 0.893 0.885 0.877 0.870 0.862 0.855 0.847 0.840 0.833 2 0.812 0.797 0.783 0.769 0.756 0.743 0.731 0.718 0.706 0.694 3 0.731 0.712 0.693 0.675 0.658 0.641 0.624 0.609 0.593 0.579 4 0.659 0.636 0.613 0.592 0.572 0.552 0.534 0.516 0.499 0.482 5 0.593 0.567 0.543 0.519 0.497 0.476 0.456 0.437 0.419 0.402 6 0.535 0.507 0.480 0.456 0.432 0.410 0.390 0.370 0.352 0.335 7 0.482 0.452 0.425 0.400 0.376 0.354 0.333 0.314 0.296 0.279 8 0.434 0.404 0.376 0.351 0.327 0.305 0.285 0.266 0.249 0.233 9 0.391 0.361 0.333 0.308 0.284 0.263 0.243 0.225 0.209 0.194 10 0.352 0.322 0.295 0.270 0.247 0.227 0.208 0.191 0.176 0.162 11 0.317 0.287 0.261 0.237 0.215 0.195 0.178 0.162 0.148 0.135 12 0.286 0.257 0.231 0.208 0.187 0.168 0.152 0.137 0.124 0.112 13 0.258 0.229 0.204 0.182 0.163 0.145 0.130 0.116 0.104 0.093 14 0.232 0.205 0.181 0.160 0.141 0.125 0.111 0.099 0.088 0.078 15 0.209 0.183 0.160 0.140 0.123 0.108 0.095 0.084 0.079 0.065 16 0.188 0.163 0.141 0.123 0.107 0.093 0.081 0.071 0.062 0.054 17 0.170 0.146 0.125 0.108 0.093 0.080 0.069 0.060 0.052 0.045 18 0.153 0.130 0.111 0.095 0.081 0.069 0.059 0.051 0.044 0.038 19 0.138 0.116 0.098 0.083 0.070 0.060 0.051 0.043 0.037 0.031 20 0.124 0.104 0.087 0.073 0.061 0.051 0.043 0.037 0.031 0.026

Cumulative present value of 1.00 unit of currency per annum, Receivable or Payable at the end of
each year for n years rr n−+− )(11
Periods
(n) Interest rates (r)
1% 2% 3% 4% 5% 6% 7% 8% 9% 10% 1 0.990 0.980 0.971 0.962 0.952 0.943 0.935 0.926 0.917 0.909 2 1.970 1.942 1.913 1.886 1.859 1.833 1.808 1.783 1.759 1.736 3 2.941 2.884 2.829 2.775 2.723 2.673 2.624 2.577 2.531 2.487 4 3.902 3.808 3.717 3.630 3.546 3.465 3.387 3.312 3.240 3.170 5 4.853 4.713 4.580 4.452 4.329 4.212 4.100 3.993 3.890 3.791 6 5.795 5.601 5.417 5.242 5.076 4.917 4.767 4.623 4.486 4.355 7 6.728 6.472 6.230 6.002 5.786 5.582 5.389 5.206 5.033 4.868 8 7.652 7.325 7.020 6.733 6.463 6.210 5.971 5.747 5.535 5.335 9 8.566 8.162 7.786 7.435 7.108 6.802 6.515 6.247 5.995 5.759 10 9.471 8.983 8.530 8.111 7.722 7.360 7.024 6.710 6.418 6.145 11 10.368 9.787 9.253 8.760 8.306 7.887 7.499 7.139 6.805 6.495 12 11.255 10.575 9.954 9.385 8.863 8.384 7.943 7.536 7.161 6.814 13 12.134 11.348 10.635 9.986 9.394 8.853 8.358 7.904 7.487 7.103 14 13.004 12.106 11.296 10.563 9.899 9.295 8.745 8.244 7.786 7.367 15 13.865 12.849 11.938 11.118 10.380 9.712 9.108 8.559 8.061 7.606 16 14.718 13.578 12.561 11.652 10.838 10.106 9.447 8.851 8.313 7.824 17 15.562 14.292 13.166 12.166 11.274 10.477 9.763 9.122 8.544 8.022 18 16.398 14.992 13.754 12.659 11.690 10.828 10.059 9.372 8.756 8.201 19 17.226 15.679 14.324 13.134 12.085 11.158 10.336 9.604 8.950 8.365 20 18.046 16.351 14.878 13.590 12.462 11.470 10.594 9.818 9.129 8.514
Periods
(n) Interest rates (r)
11% 12% 13% 14% 15% 16% 17% 18% 19% 20% 1 0.901 0.893 0.885 0.877 0.870 0.862 0.855 0.847 0.840 0.833 2 1.713 1.690 1.668 1.647 1.626 1.605 1.585 1.566 1.547 1.528 3 2.444 2.402 2.361 2.322 2.283 2.246 2.210 2.174 2.140 2.106 4 3.102 3.037 2.974 2.914 2.855 2.798 2.743 2.690 2.639 2.589 5 3.696 3.605 3.517 3.433 3.352 3.274 3.199 3.127 3.058 2.991 6 4.231 4.111 3.998 3.889 3.784 3.685 3.589 3.498 3.410 3.326 7 4.712 4.564 4.423 4.288 4.160 4.039 3.922 3.812 3.706 3.605 8 5.146 4.968 4.799 4.639 4.487 4.344 4.207 4.078 3.954 3.837 9 5.537 5.328 5.132 4.946 4.772 4.607 4.451 4.303 4.163 4.031 10 5.889 5.650 5.426 5.216 5.019 4.833 4.659 4.494 4.339 4.192 11 6.207 5.938 5.687 5.453 5.234 5.029 4.836 4.656 4.486 4.327 12 6.492 6.194 5.918 5.660 5.421 5.197 4.988 4.793 4.611 4.439 13 6.750 6.424 6.122 5.842 5.583 5.342 5.118 4.910 4.715 4.533 14 6.982 6.628 6.302 6.002 5.724 5.468 5.229 5.008 4.802 4.611 15 7.191 6.811 6.462 6.142 5.847 5.575 5.324 5.092 4.876 4.675 16 7.379 6.974 6.604 6.265 5.954 5.668 5.405 5.162 4.938 4.730 17 7.549 7.120 6.729 6.373 6.047 5.749 5.475 5.222 4.990 4.775 18 7.702 7.250 6.840 6.467 6.128 5.818 5.534 5.273 5.033 4.812 19 7.839 7.366 6.938 6.550 6.198 5.877 5.584 5.316 5.070 4.843 20 7.963 7.469 7.025 6.623 6.259 5.929 5.628 5.353 5.101 4.870


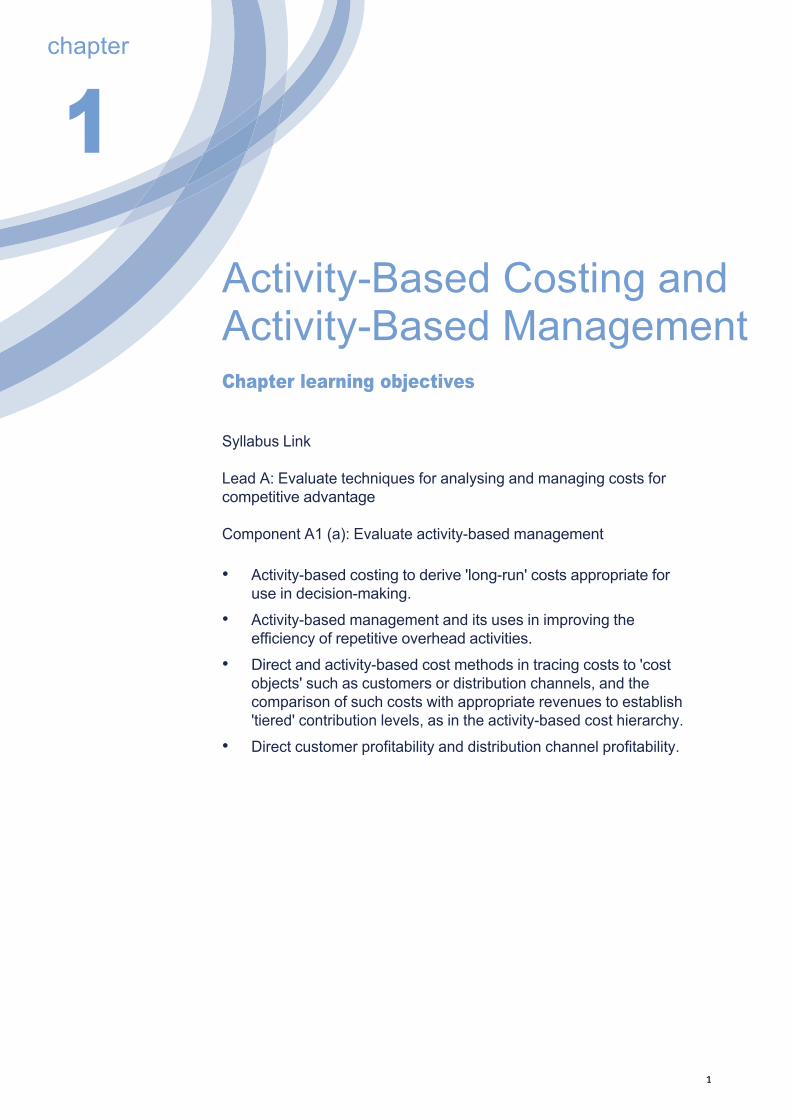
ActivityBased Costing and ActivityBased Management Chapter learning objectives
Syllabus Link
Lead A: Evaluate techniques for analysing and managing costs for competitive advantage
Component A1 (a): Evaluate activitybased management
• Activitybased costing to derive 'longrun' costs appropriate for use in decisionmaking.
• Activitybased management and its uses in improving the efficiency of repetitive overhead activities.
• Direct and activitybased cost methods in tracing costs to 'cost objects' such as customers or distribution channels, and the comparison of such costs with appropriate revenues to establish 'tiered' contribution levels, as in the activitybased cost hierarchy.
• Direct customer profitability and distribution channel profitability.
1
chapter
1
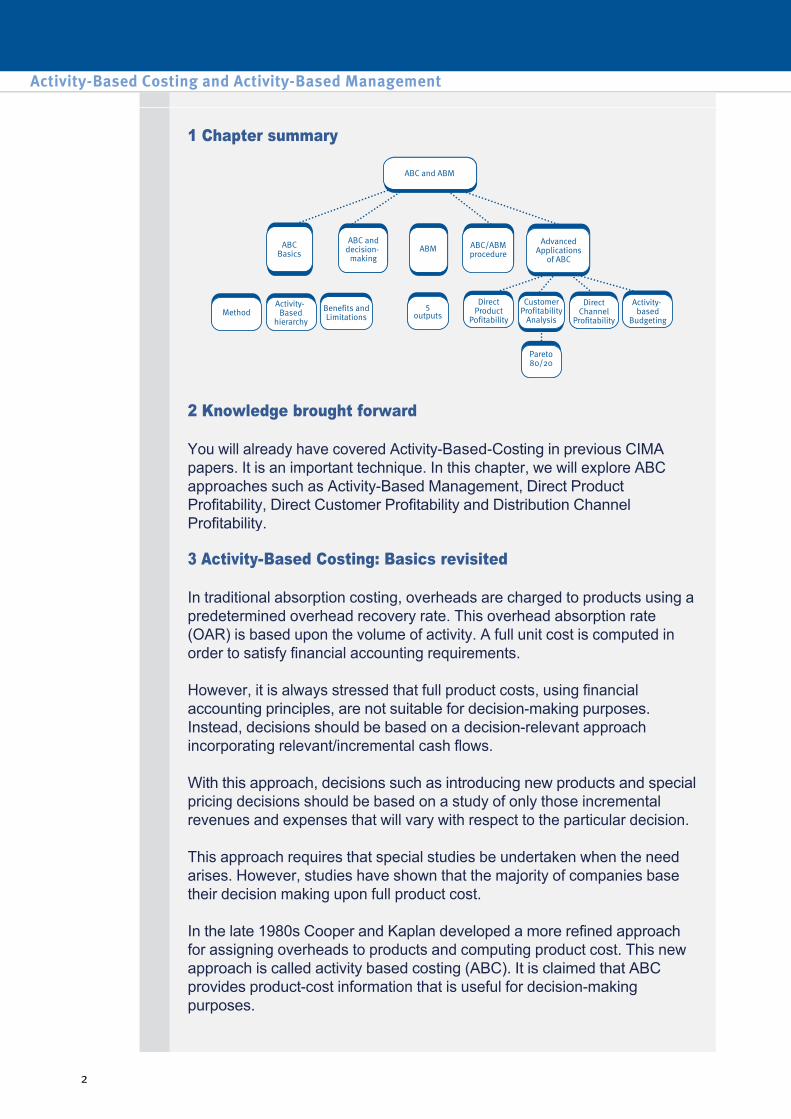
1 Chapter summary
2 Knowledge brought forward
You will already have covered ActivityBasedCosting in previous CIMA papers. It is an important technique. In this chapter, we will explore ABC approaches such as ActivityBased Management, Direct Product Profitability, Direct Customer Profitability and Distribution Channel Profitability.
3 ActivityBased Costing: Basics revisited
In traditional absorption costing, overheads are charged to products using a predetermined overhead recovery rate. This overhead absorption rate (OAR) is based upon the volume of activity. A full unit cost is computed in order to satisfy financial accounting requirements.
However, it is always stressed that full product costs, using financial accounting principles, are not suitable for decisionmaking purposes. Instead, decisions should be based on a decisionrelevant approach incorporating relevant/incremental cash flows.
With this approach, decisions such as introducing new products and special pricing decisions should be based on a study of only those incremental revenues and expenses that will vary with respect to the particular decision.
This approach requires that special studies be undertaken when the need arises. However, studies have shown that the majority of companies base their decision making upon full product cost.
In the late 1980s Cooper and Kaplan developed a more refined approach for assigning overheads to products and computing product cost. This new approach is called activity based costing (ABC). It is claimed that ABC provides productcost information that is useful for decisionmaking purposes.
Activity-Based Costing and Activity-Based Management
22

ActivityBased Costing is 'an approach to the costing and monitoring of activities which involves tracing resource consumption and costing final outputs. Resources are assigned to activities, and activities to cost objects based on consumption estimates. The latter utilise cost drivers to attach activity costs to outputs'.
CIMA Official Terminology
Traditional systems accurately measure volumerelated resources that are consumed in proportion to the number of units produced of the individual products. Such resources include direct labour, materials, energy and machinerelated costs.
However, many organisational resources exist for activities that are unrelated to physical volume. Nonvolume related activities consist of support activities such as:
Traditional productcost systems, which assume that products consume all activities in proportion to their production volumes, thus report distorted product costs.
• materials handling
• material procurement
• setups
• production scheduling
• firstitem inspection activities.
The distortions arising from the use of traditional productcosting systems are most pronounced in organisations that produce a diverse range of products which differ in volume and complexity. Cooper and Kaplan (1991) use the following example to illustrate the inability of traditional systems to report accurate product costs:
chapter 1
3
Cooper and Kaplan – The Pen Factory

'Consider two hypothetical plants turning out a simple product: ballpoint pens. The factories are the same size and have the same capital equipment. Every year plant I makes 1 million units of only one product: blue pens. Plant II, a fullline producer, also produces blue pens, but only 100,000 a year. Plant II also produces a variety of similar products: 80,000 black pens, 30,000 red pens, 5,000 green pens, 500 lavender pens, and so on. In a typical year plant II produces up to 1,000 product variations, with volumes ranging between 100 and 100,000 units. Its aggregate annual output equals the 1 million pens of plant I'.
The first plant has a simple production environment and requires limited manufacturing support facilities. With its higher diversity and complexity of operations, the second plant requires a much larger support structure. For example 1,000 different products must be scheduled through the plant, and this requires more people for scheduling the machines, performing the setups, inspecting items, purchasing, receiving and handling materials, and handling a large number of individual requests. Expenditure on support overheads will therefore be much higher in the second plant, even though the number of units produced and sold by both plants is identical. Furthermore, since the number of units produced is identical, both plants will have approximately the same number of direct labour hours, machine hours and material purchases. The much higher expenditure on support overheads in the second plant cannot therefore be explained in terms of direct labour, machine hours operated or the amount of materials purchased.
Traditional costing systems, however, use volume bases to allocate support overheads to products. In fact, if each pen requires approximately the same number of machine hours, direct labour hours or material cost, the reported cost per pen will be identical in plant II. Thus blue and lavender pens will have identical product costs, even though the lavender pens are ordered, manufactured, packaged and despatched in much lower volumes.
The smallvolume products place a much higher relative demand on the support departments than a low share of volume might suggest. Intuitively, it must cost more to produce the lowvolume lavender pen than the highvolume blue pen. Traditional volumebased costing systems therefore tend to overcost highvolume products and undercost lowvolume products. To remedy this discrepancy ABC expands the second stage assignment bases for assigning overheads to products.
Activity-Based Costing and Activity-Based Management
4

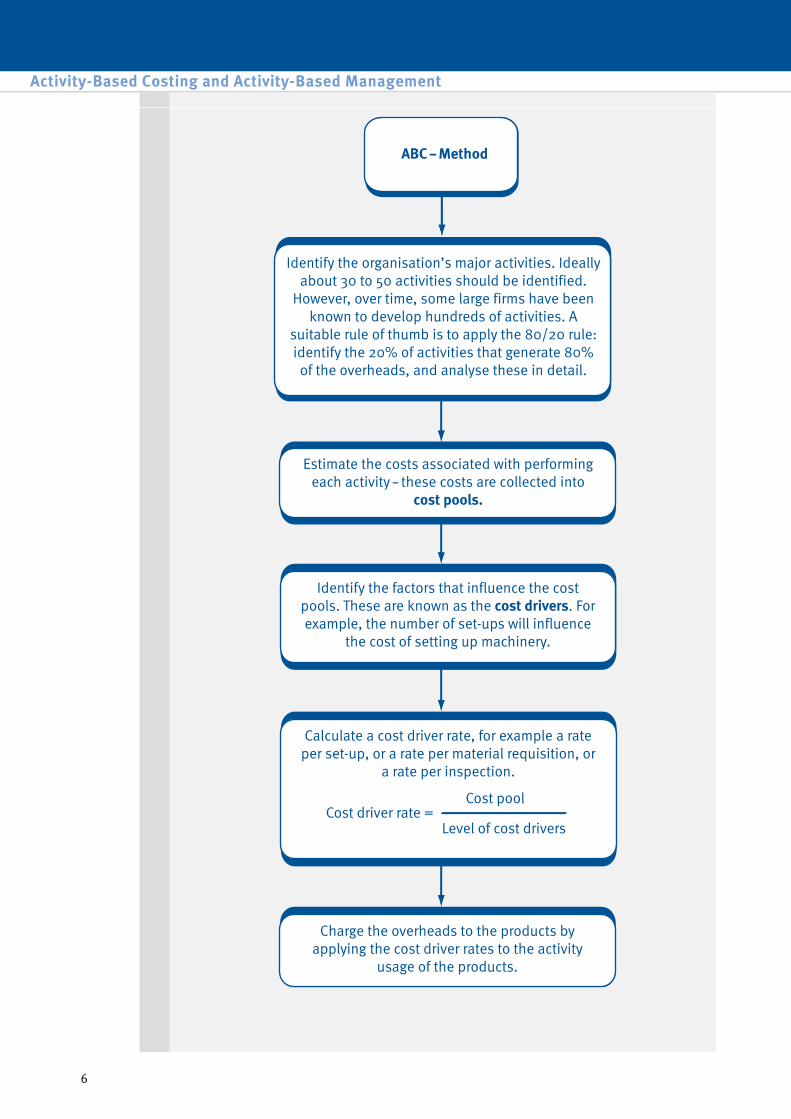
4 The ABC procedure
Cooper and Kaplan stated that it was the support activities that were the cause of many overheads, for example, material handling, quality inspection, setting up machinery, material acquisition, etc. Thus a simple threestep philosophy was developed:
• support activities cause cost
• the products consume these activities
• cost should, therefore, be charged on the basis of consumption of the activities.
chapter 1
5
Activity-Based Costing and Activity-Based Management
6
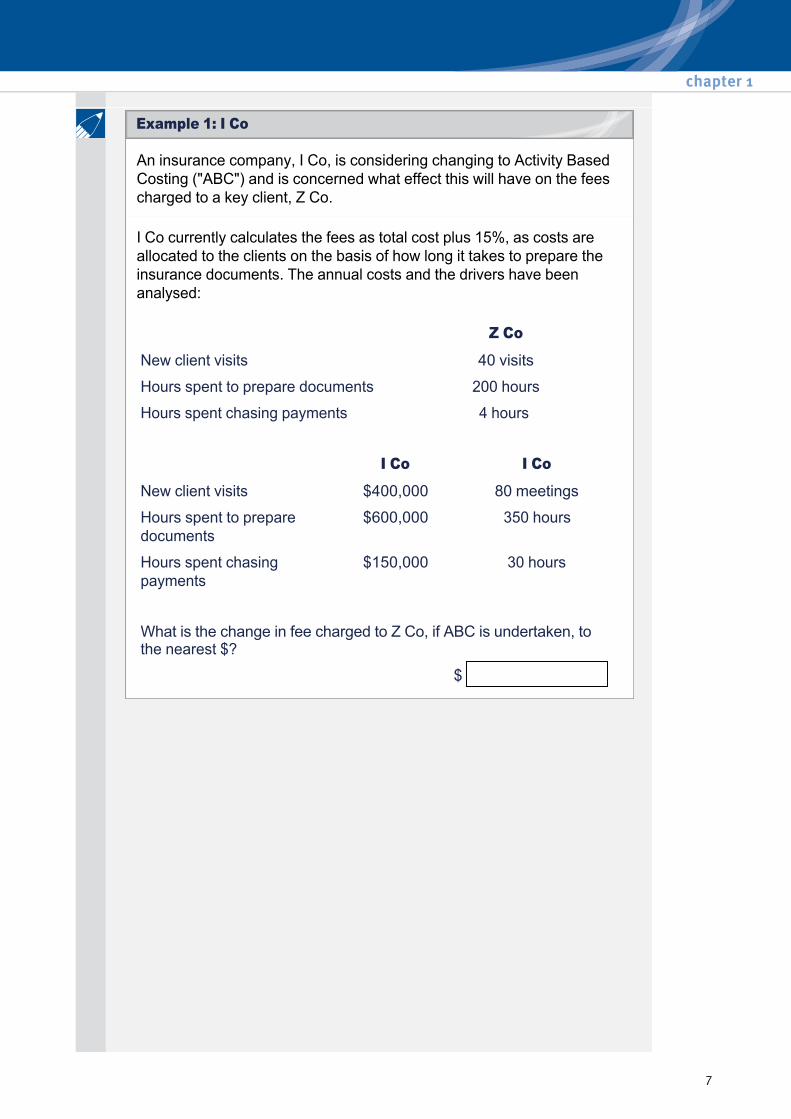
An insurance company, I Co, is considering changing to Activity Based Costing ("ABC") and is concerned what effect this will have on the fees charged to a key client, Z Co.
I Co currently calculates the fees as total cost plus 15%, as costs are allocated to the clients on the basis of how long it takes to prepare the insurance documents. The annual costs and the drivers have been analysed:
Z Co
New client visits 40 visits
Hours spent to prepare documents 200 hours
Hours spent chasing payments 4 hours
I Co I Co
New client visits $400,000 80 meetings
Hours spent to prepare documents
$600,000 350 hours
Hours spent chasing payments
$150,000 30 hours
What is the change in fee charged to Z Co, if ABC is undertaken, to the nearest $?
$
chapter 1
7
Example 1: I Co
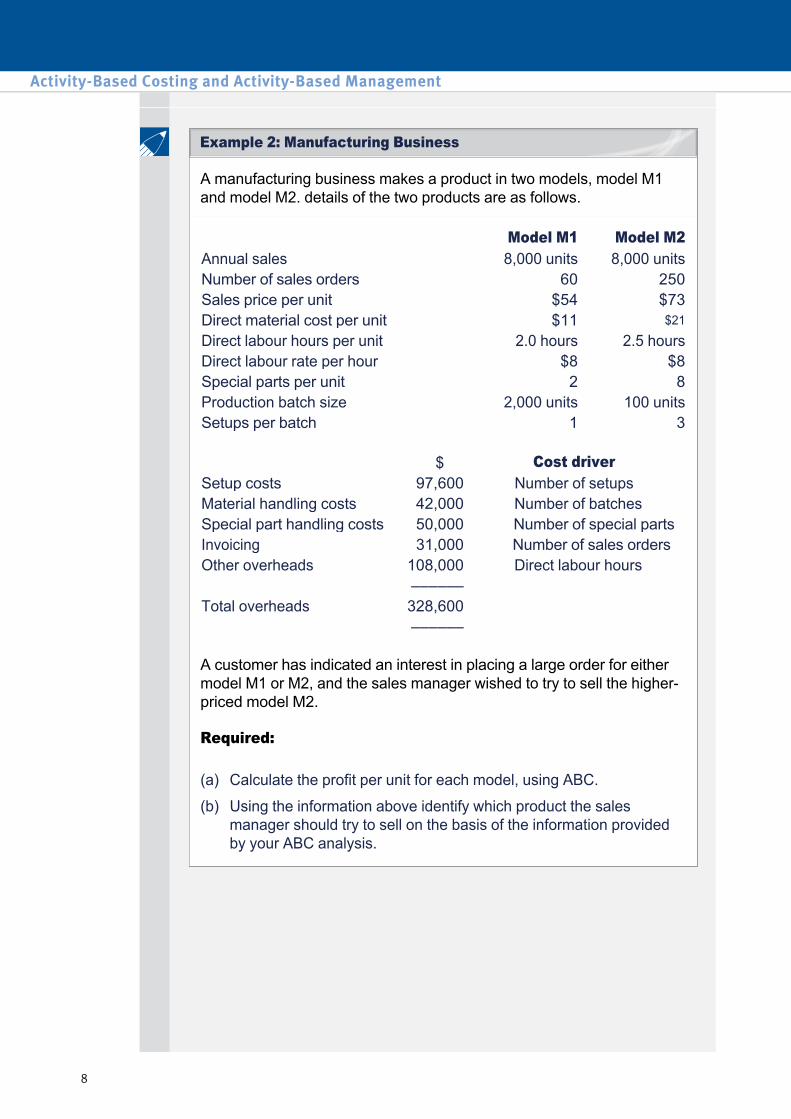
A manufacturing business makes a product in two models, model M1 and model M2. details of the two products are as follows.
A customer has indicated an interest in placing a large order for either model M1 or M2, and the sales manager wished to try to sell the higherpriced model M2.
Required:
Model M1 Model M2 Annual sales 8,000 units 8,000 units Number of sales orders 60 250 Sales price per unit $54 $73 Direct material cost per unit $11 $21
Direct labour hours per unit 2.0 hours 2.5 hours Direct labour rate per hour $8 $8 Special parts per unit 2 8 Production batch size 2,000 units 100 units Setups per batch 1 3
$ Cost driver Setup costs 97,600 Number of setups Material handling costs 42,000 Number of batches Special part handling costs 50,000 Number of special parts Invoicing 31,000 Number of sales orders Other overheads 108,000 Direct labour hours
–––––– Total overheads 328,600
––––––
(a) Calculate the profit per unit for each model, using ABC.
(b) Using the information above identify which product the sales manager should try to sell on the basis of the information provided by your ABC analysis.
Activity-Based Costing and Activity-Based Management
8
Example 2: Manufacturing Business
The purpose of moving from a traditional costing system to an activitybased system should be based on the premise that the new information provided will lead to action that will increase the overall profitability of the business.
This is most likely to occur when the analysis provided under the ABC system differs significantly from that which was provided under the traditional system, which is most likely to occur under the following conditions:
Information from an ABC analysis may indicate opportunities to increase profitability in a variety of ways, many of which are longterm. For example, an activitybased analysis may reveal that smallbatch items are relatively expensive to produce, and are therefore unprofitable at current prices.
A number of responses to this information could be adopted. The first response might be to consider stopping production of such items, and concentrate on the apparently more profitable highvolume lines. Another approach would be to investigate how the production process could be organised in such a way as to bring the cost of producing smallbatch items closer to that of producing highvolume goods.
By identifying the cost of carrying out particular activities, the new approach provides opportunities for directing attention to matters of cost control. It can therefore be viewed as a much longerterm technique than the word ‘costing’ in the title suggests. The establishment of an ABC product cost may thus be considered to be the beginning of the process, rather than an end in itself. The recent use of the term activitybased management suggests this forwardlooking orientation, which is assuming increasing importance.
• when production overheads are high relative to direct costs, particularly direct labour
• where there is great diversity in the product range
• where there is considerable diversity of overhead resource input to products
• when consumption of overhead resources is not driven primarily by volume.
chapter 1
9
Favourable conditions for ABC
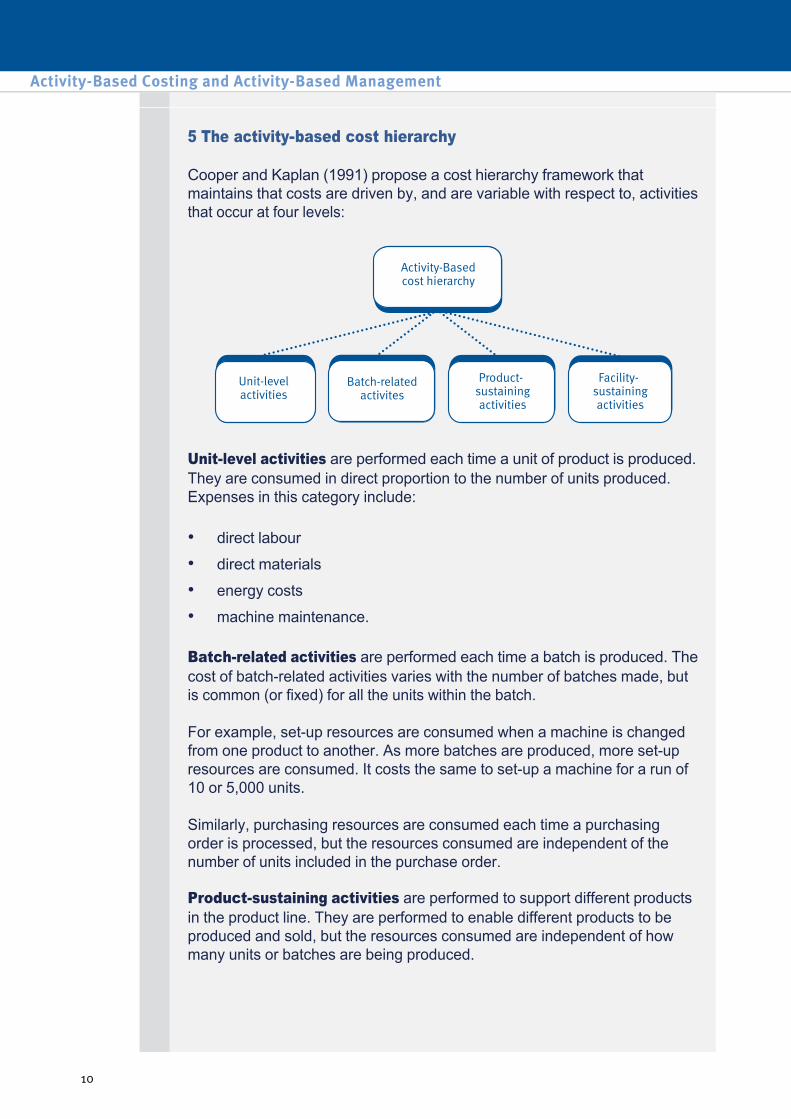
5 The activitybased cost hierarchy
Cooper and Kaplan (1991) propose a cost hierarchy framework that maintains that costs are driven by, and are variable with respect to, activities that occur at four levels:
Unitlevel activities are performed each time a unit of product is produced. They are consumed in direct proportion to the number of units produced. Expenses in this category include:
Batchrelated activities are performed each time a batch is produced. The cost of batchrelated activities varies with the number of batches made, but is common (or fixed) for all the units within the batch.
For example, setup resources are consumed when a machine is changed from one product to another. As more batches are produced, more setup resources are consumed. It costs the same to setup a machine for a run of 10 or 5,000 units.
Similarly, purchasing resources are consumed each time a purchasing order is processed, but the resources consumed are independent of the number of units included in the purchase order.
Productsustaining activities are performed to support different products in the product line. They are performed to enable different products to be produced and sold, but the resources consumed are independent of how many units or batches are being produced.
• direct labour
• direct materials
• energy costs
• machine maintenance.
Activity-Based Costing and Activity-Based Management
10
Cooper and Kaplan (1991) identify engineering resources devoted to maintaining accurate bills of materials and routing each product as an example of productsustaining activities. Product design costs and advertising costs of the specific product would also be counted as productsustaining costs. The expenses of productsustaining activities will tend to increase as the number of products manufactured increases.
Facilitysustaining activities. Some costs cannot be related to a particular product line, instead they are related to maintaining buildings and the facilities. Examples include:
• maintenance of the building
• plant security
• business rates.
6 ABC: Benefits and limitations
Benefits
Limitations
(1) Provides more accurate productline costings particularly where nonvolumerelated overheads are significant and a diverse product line is manufactured.
(2) Is flexible enough to analyse costs by cost objects other than products such as processes, areas of managerial responsibility and customers.
(3) Provides a reliable indication of longrun variable product cost which is particularly relevant to managerial decision making at a strategic level.
(4) Provides meaningful financial (periodic cost driver rates) and nonfinancial (periodic cost driver volumes) measures which are relevant for cost management and performance assessment at an operational level.
(5) Aids identification and understanding of cost behaviour and thus has the potential to improve cost estimation.
(6) Provides a more logical, acceptable and comprehensible basis for costing work.
(1) Little evidence to date that ABC improves corporate profitability.
(2) ABC information is historic and internally orientated and therefore lacks direct relevance for future strategic decisions.
(3) Practical problems such as cost driver selection.
(4) Its novelty is questionable. It may be viewed as simply a rigorous application of conventional costing procedures.
chapter 1
11
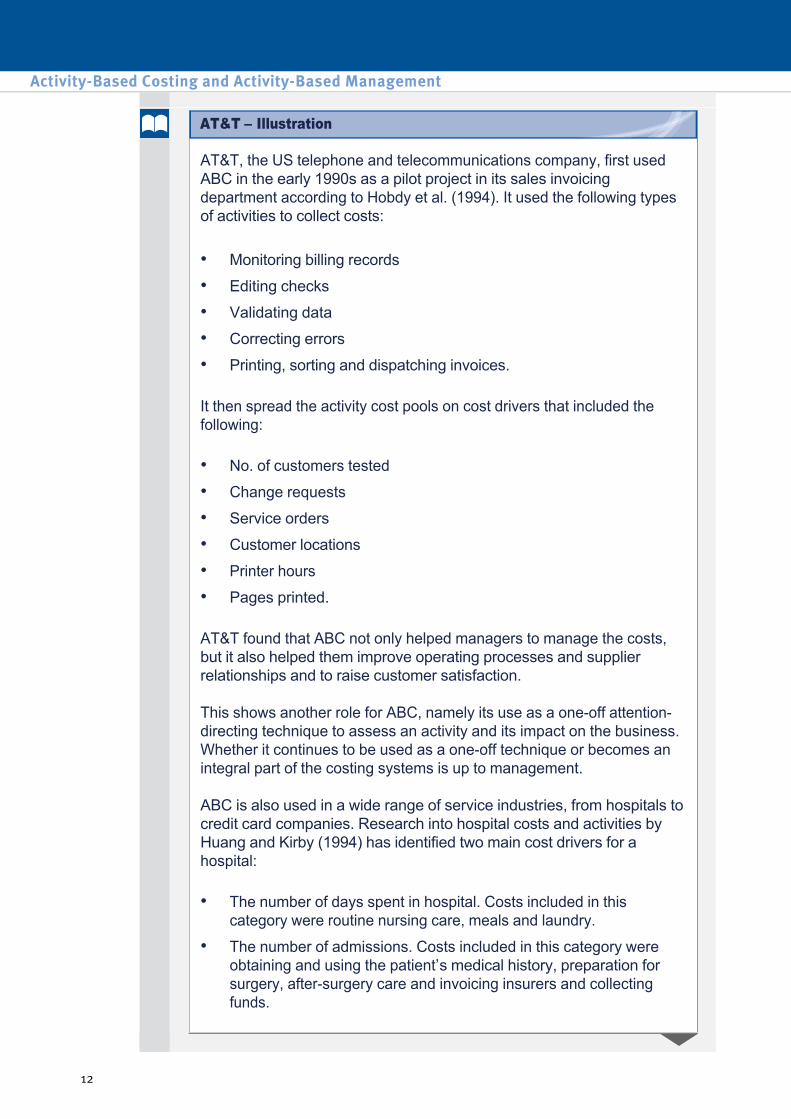
AT&T, the US telephone and telecommunications company, first used ABC in the early 1990s as a pilot project in its sales invoicing department according to Hobdy et al. (1994). It used the following types of activities to collect costs:
It then spread the activity cost pools on cost drivers that included the following:
AT&T found that ABC not only helped managers to manage the costs, but it also helped them improve operating processes and supplier relationships and to raise customer satisfaction.
This shows another role for ABC, namely its use as a oneoff attentiondirecting technique to assess an activity and its impact on the business. Whether it continues to be used as a oneoff technique or becomes an integral part of the costing systems is up to management.
ABC is also used in a wide range of service industries, from hospitals to credit card companies. Research into hospital costs and activities by Huang and Kirby (1994) has identified two main cost drivers for a hospital:
• Monitoring billing records
• Editing checks
• Validating data
• Correcting errors
• Printing, sorting and dispatching invoices.
• No. of customers tested
• Change requests
• Service orders
• Customer locations
• Printer hours
• Pages printed.
• The number of days spent in hospital. Costs included in this category were routine nursing care, meals and laundry.
• The number of admissions. Costs included in this category were obtaining and using the patient’s medical history, preparation for surgery, aftersurgery care and invoicing insurers and collecting funds.
Activity-Based Costing and Activity-Based Management
12
AT&T – Illustration
This particular piece of research found that Medicare (i.e. the government reimbursement scheme) had been considerably overcharged because it dealt with older patients who stayed longer in hospital than others on private insurance. As a consequence the absorption rate used prior to ABC, which was a single day rate, gave a charge which was too high for longstay patients.
7 ABC and decision making
ActivityBased Costing has a role in longerterm decisionmaking.
ABC systems are primarily designed to furnish management with cost information relating to an organisation's products.
However, the production of this information is not an end in itself. Indeed it is the use to which such activitybased information is put that represents its real purpose, and its value should be assessed against this endresult.
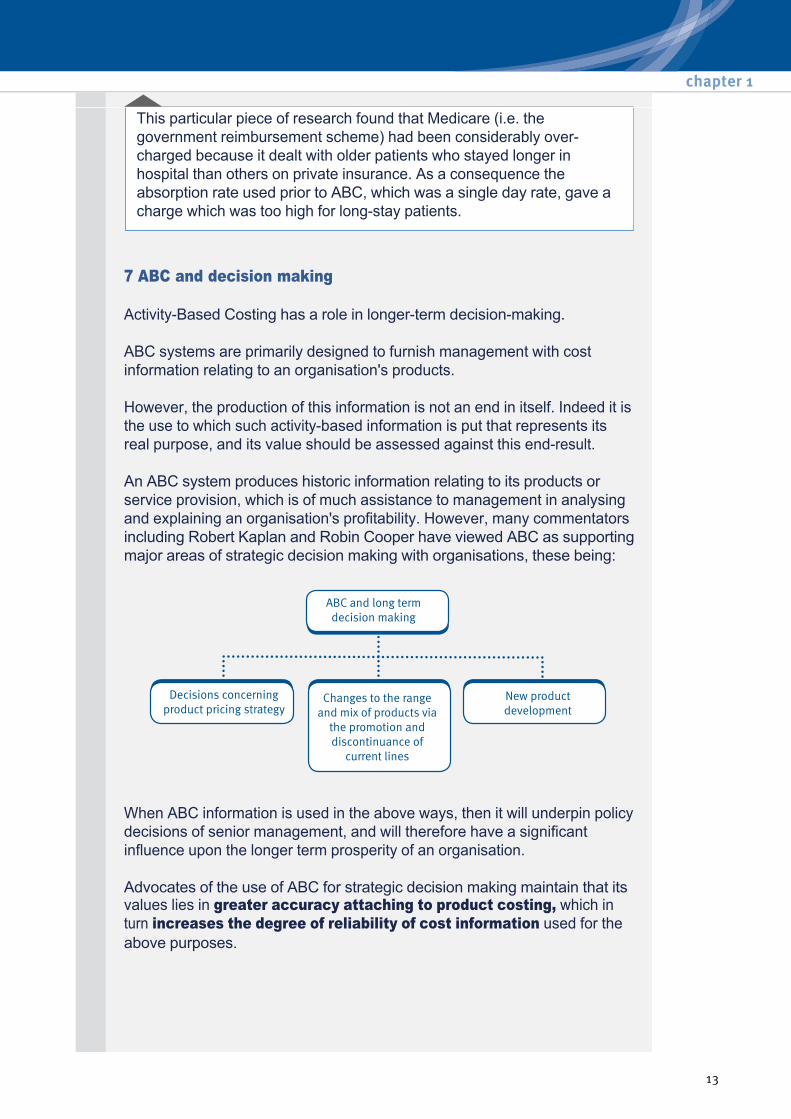
An ABC system produces historic information relating to its products or service provision, which is of much assistance to management in analysing and explaining an organisation's profitability. However, many commentators including Robert Kaplan and Robin Cooper have viewed ABC as supporting major areas of strategic decision making with organisations, these being:
When ABC information is used in the above ways, then it will underpin policy decisions of senior management, and will therefore have a significant influence upon the longer term prosperity of an organisation.
Advocates of the use of ABC for strategic decision making maintain that its values lies in greater accuracy attaching to product costing, which in turn increases the degree of reliability of cost information used for the above purposes.
chapter 1
13
They further maintain that the use of ABC may give an indication for the longterm variable cost of products, which arguably is the most relevant cost information for use in decisions of the above type. Given the inherent uncertainty involved in strategic decision making, management may use ABC information in decisionmodelling and sensitivity analysis to assist in the making of such decisions.
The end product of an ABC system is an estimate of the historic cost of each of an organisation's products. However, strategic decision making involves future time periods and thus it is future outlay costs that need to be taken into consideration, as opposed to historic costs.
Therefore, it is arguable that the results obtained from an ABC system should be aimed at assisting in the making of longerterm decisions. This is especially the case if ABC based product costs are viewed as estimates of longer term product costs as 'nothing is forever' and historic costs are susceptible to substantial change, since all factors of production become variable in the longer term.
Any cost information which has been produced based on past activities must be used with caution with regard to longer term decisions. Even so, ABC information may provide a sound starting point for the preparation of cost information to be used in strategic decision making. It has been argued that a significant advantage of ABC over conventional costing systems lies in its suitability for strategic decision making. Kaplan has argued that for decisions of a strategic nature, a longterm perspective is usual and maintains that an ABC system gives product cost information which matches this requirement particularly well.
This is evidenced by his assertion that 'conventional notions of fixed and variable costs are ignored because, for the purpose of product cost analysis, the time period is long enough to warrant treatment of virtually all costs as variable.'
8 Activity Based Management
ActivityBased Management is a ‘System of management which uses activitybased cost information for a variety of purposes including cost reduction, cost modelling and customer profitability analysis.’
CIMA Official Terminology
ABM is simply using the information derived from an ABC analysis for cost management. ABM seeks to classify each activity within a process as a valueadded or nonvalueadded activity:
Nonvalueadded activities are unnecessary and represent waste. The aim should be to eliminate them. For example, time spent dealing with customer complaints is wasted time, but cannot be reduced until the customers have nothing to complain about!
Activity-Based Costing and Activity-Based Management
14
ABM focuses on activities within a process, decision making and planning relative to those activities and the need for continuous improvement of all organisational activity. Management and staff must determine which activities are critical to success and decide how these are to be clearly defined across all functions.
Everyone must cooperate in defining:
They must be trained and empowered to act; all must be fairly treated and success recognised.
• cost pools
• cost drivers
• key performance indicators.
9 Outputs from the ABM Information System
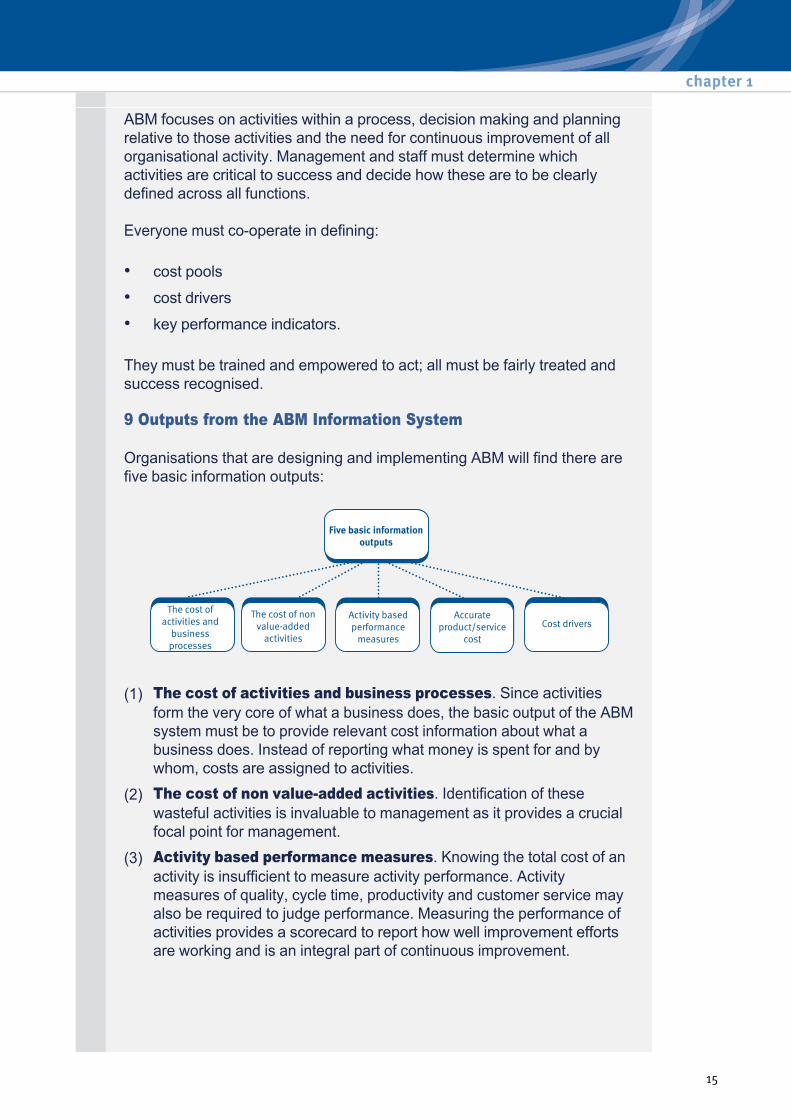
Organisations that are designing and implementing ABM will find there are five basic information outputs:
(1) The cost of activities and business processes. Since activities
form the very core of what a business does, the basic output of the ABM system must be to provide relevant cost information about what a business does. Instead of reporting what money is spent for and by whom, costs are assigned to activities.
(2) The cost of non valueadded activities. Identification of these wasteful activities is invaluable to management as it provides a crucial focal point for management.
(3) Activity based performance measures. Knowing the total cost of an activity is insufficient to measure activity performance. Activity measures of quality, cycle time, productivity and customer service may also be required to judge performance. Measuring the performance of activities provides a scorecard to report how well improvement efforts are working and is an integral part of continuous improvement.
chapter 1
15
ABM can be used in assessing strategic decisions such as:
Clearly ABM and employee empowerment takes a critical step forward beyond ABC by recognising the contribution that people make as the key resource in any organisation’s success.
ABM will not reduce costs, it will only help the manager understand costs better.
Strategic activity management recognises that individual activities are part of a wider process. Activities are grouped to form a total process or service.
For example, serving a particular customer involves a number of discrete activities that form the total service. Strategic activity management attempts to classify each activity within the whole as a valueadded or nonvalueadded activity. Nonvalueadded activities are unnecessary and should be eliminated.
BellisJones (1992) noted that typically prior to the introduction of ABM, 35% of staff time was spent on diversionary (nonvalueadded) activities. After the introduction of ABM, total staff time declined and the percentage of time spent on diversionary activities fell to 20% of the reduced time.
Nonvalueadded activities are often caused by inadequacies within the existing processes and cannot be eliminated unless the inadequacy is addressed.
(4) Accurate product/service cost. Products and services are provided to markets and customers through various distribution channels or contractual relationships. Because products and services consume resources at different rates and require different levels of support, costs must be accurately determined.
(5) Cost drivers. The final output from the ABM system is cost driver information. With this information it is possible to understand and manage these activity levels.
• whether to continue with a particular activity
• how cost structures measure up to those of competitors
• how changes in activities and components affect the suppliers and value chain.
• It nurtures good communication and team work.
• It develops quality decision making.
• It leads to quality control and continuous improvement.
Activity-Based Costing and Activity-Based Management
16
For example, dealing with customer complaints is a diversionary activity, but it cannot be eliminated unless the source of the complaints is eliminated. Another example is machine setup time. Better product design so that fewer components or more standard components are used will reduce the setup time between component runs. So management must concentrate on eliminating nonvalueadded activities.
But strategic activity management is more than just eliminating nonvalueadded activities, important though this is.
By identifying the cost and value drivers for each activity, the firm can develop both the activities and the linkages between them, and so better differentiate the firm from its competitors. In addition, by understanding the factors which influence the costs of each activity, the firm can take action to minimize those costs in the medium term.
ABC information can be used in an ABM system to assist strategic decisions, such as:
The value chain is simply a large activity map for the organisation and its position in the industry chain. It is covered in a later chapter of this Text.
(1) Whether to continue with a particular activity.
(2) The effect on cost structure of a change in strategy, e.g. from mass production to smaller production runs.
(3) How changes in activities and components affect the suppliers and the value chain.
10 Problems with implementing ABC/ABM
Much has been written in academic journals of the benefits of using ABC and ABM. The majority of organisations still do not use either. Why, if the majority of academics consider it to be so useful, do practitioners not employ ABC?
The obvious reason is that they do not agree on its usefulness or cost effectiveness in terms of costs and benefits. For ABC to be effective an accurate system is required with as many as 50 different activities identified and costs attributed to them. This requires considerable time and effort.
A certain amount of research has focused on the problems of implementing the system. Friedman and Lyne (1999) provide some clues as to why ABC has not been taken up with more enthusiasm from case study research they carried out. Some reasons they draw attention to are:
(1) Where it was devised for a single project that was not taken up the system got dropped as well. As communication between business units in a large organisation is often not very good, the work was not developed further by other units.
chapter 1
17
Of course, if organisations do not have reliable ABC information then they also forgo the cost management advantages of an ABM system. Since ABC provides the basic building blocks of activities, without ABC there can be no ABM.
(2) Finance department opposed its implementation. Often finance staff appear less than dynamic and unable to perceive the needs of the production staff.
(3) General ledger information too poor to provide reliable ABC information. The resulting figures would have been no better than traditional absorption methods.
Tool of the trade
Financial Management; London; Nov 2001; Stephanie Gourdie;
A company in New Zealand is one of the few to have implemented activitybased management successfully but it needed careful planning and a radical rethink of company culture.
Since professors Robert Cooper and Robert Kaplan codified and developed activitybased costing, many organisations have implemented it, but few are using it for cost management. The original emphasis of ABC was on developing more accurate product costs. It was based on the principle that resourceconsuming activities caused costs, not volume of products, as assumed by traditional costallocation methods. Overhead costs were allocated and traced back to activities that consumed resources, such as purchasing, setups and material handling.
A cost driver was then selected for each activity centre. The choice of driver was based on two things: it had to measure the resources a product used for a particular set of activities; and it had to be linked to the changes of costs in the activity centre (causeeffect relationship).
Cost drivers can include the number of purchase orders, material movements or setup hours. The overhead rate for each activity was worked out by dividing the activity cost by the capacity of the cost driver. The costs of products were determined by multiplying the number of the cost driver of the activity used by the product, by the overhead rate for that activity, for all activities used by that product.
ABC systems could then be applied to cost management. This was labelled activity based management (ABM), defined by Don Hansen and Maryanne Mowen as "a systemwide, integrated approach that focuses management's attention on activities with the objective of improving customer value and the profit achieved by providing this value".
Activity-Based Costing and Activity-Based Management
18
Illustration – ABC and ABM
The progression to ABM involved a shift in focus from the original ABC system – producing information on activitybased product costs to producing information to improve management of processes. The idea is to analyse the activities that make up a company's processes and the cost drivers of those activities, then question why the activities are being carried out and how well they are being performed. ABM provides the activity information and the costs of inefficient activities, and quantifies the benefits of continuous improvements.
Companies can then improve operations by reengineering (complete redesign of processes), redesigning plant layouts, using common parts, outsourcing or strengthening supplier and customer relationships and developing alternative product designs.
Research on the implementation of ABC in Europe, shows that adoption of ABM remains low. One organisation in New Zealand has used ABM to improve the way it manages some of its processes, to get rid of nonvalue added activities and to reduce costs substantially through efficiencies. It has achieved this by following certain "dos and don'ts" in implementing accounting systems.
The organisation provides information services, recordkeeping, testing, research and advisory services for New Zealand's agriculture sector. Its mission is to lead the world with its research and create wealth for its stakeholders, and its profit objective is to have enough resources to fund research and development. It has been through the same changes, including restructuring, that many New Zealand public sector organisations went through in the 1980s.
The drive to implement ABM began with calls for more efficiency and accountability and a need to be seen to have efficient business practices and be more customerorientated. The emphasis was on efficiency, total quality and effectiveness – all of which were in the firm's mission statements and business plans.
The board constantly requested more information and ABM offered the management accounting team a way of providing better quality service. But ABM was a major undertaking and the team had to proceed carefully.
ABM required a major investment in time and resources. Apart from the cost of the software, staff had to be taken away from their existing jobs and trained to set up and use the system. The activity analysis stage, for example, was long and sometimes arduous: it took three people nine months to implement.
Since ABM's introduction, the models have been reviewed annually for budgets and actuals and updated for budgets, forecasts and actuals. This process takes three people between five and 10 weeks depending on the number and complexity of process changes.
chapter 1
19

Managers had to be clear about the potential benefits of ABM and what information the organisation wanted. Members of the management accounting team attended seminars and investigated several packages. They knew they wanted more than just an ABC package. They needed to establish product profitability, improve distribution of overheads, activities and costs of processes and find out how to improve these.
The organisation's clients, who were also its shareholders, believed they had the right to query prices. So the system had to provide information about the relationship between prices and costs. It also needed an integrated decision support system that could carry out business process efficiency simulations.
There are plans to extend the system to include calculations of customer profitability, activitybased budgeting, and the balanced scorecard. The balanced scorecard "translates an organisation's mission and strategy into operational objectives and performance measures for four different perspectives: the financial perspective; the customer perspective; the internal business process perspective; and the learning and growth perspective'. In other words, activities carried out in an organisation should be linked to its strategic objectives.
The next step was to decide which model to use. Some organisations operate standalone ABM systems using either spreadsheets or thirdparty packaged software. Others integrate the system in their wider information systems. The maximum business advantage cannot be achieved until ABM is an integral part of an organisation's reporting system.
The New Zealand organisation chose a software package that could map the process. This approach would suit any organisation with inputs, demands, processes and constrained resources. It already had a mainframe database of activity data and a separate accounting system. The use of datawarehousing allowed summary information from its two systems to be stored and accessed for multidimensional modelling, including accounting models for budgeting ABC costs, ABM information, simulations and forecasting.
It is important to pick a model that emphasises the operational understanding of all activities in the business. Instead of going down the financial decomposition analysis route – which analyses the accounting records of the organisation – the organisation chose the process model approach. This analyses the operations, identifying the key activities and resources consumed, by asking what people do, what resources are consumed and how. From the answers, appropriate activity drivers can be established, as can the inputs and outputs to each activity and the relationship between activities.
Activity-Based Costing and Activity-Based Management
20
Managers gathered data from both operational and financial sources and carried out interviews to find out about processes. Some costs were allocated on traditional cost drivers, such as area, others on transactional cost drivers, such as number of visits by truck or technician. For each cost driver, costs were divided into fixed and variable. Some were more obvious than others and work was done to find an approximate division.
A pilot project was recommended in order to achieve results in six to eight weeks, develop a team of experts and convince managers of the benefits. The pilot chosen had defined inputs and outputs and was contained with simple and clear process flows. There was also clear output from each activity.
First, the project mapped the process showing different activities outside the ABM software. This procedure was useful as it helped the "mapper" to understand the components of the process and how they interacted. The pilot study initially involved highlevel mapping but, with hindsight, it would have been easier if it had been less detailed.
A key point is to involve people other than just the management accounting team. The model approach enables this because much of the original information must be obtained from people in the field. So the organisation used the management accounting team to implement the system, but seconded members from the field to use local expertise.
As part of the new system, ownership of cost management had to be transferred from the accounting department to the departments and processes where costs were incurred. Some units were not happy about this, but since there was a shift in performance criteria meaning divisional managers' salaries depended on results, they were motivated to make it work. Perceptions of how different departments in the company worked had not changed, so staff did not feel threatened. People were keen to contribute, perhaps because of the good relationship between management accounts and other staff.
Agreement was obtained on criteria for measuring overheads and it turned out to be pretty straightforward to put numbers to activities and capacity levels. Tests showed that figures were generally reasonable and it is unlikely that investing far more time and resources would have made them significantly more accurate. Reports and graphs were prepared for each division so they could monitor their progress.
Implementing ABM meant a change in the culture of the whole organisation. It had to change from a publicsectorstyle company into a commercial enterprise (there is still ambivalence about how much profit it should make). The firm also had to worry about budgets and costs for the first time – it had never before had management accounting systems for cost management and budgeting.
chapter 1
21
Transition to the ABM system had to be gradual. First, the firm developed a cash objective budget system. From this, it built a simple ABC system model. Few products were dropped and the firm still expected to make a profit or break even. Economic conditions and other external factors were taken into account since there was a high proportion of fixed costs, but the new ABM philosophy made it clear to managers that the size of the "cake" was fixed.
The information from the ABM system was used to show managers where divisions were unprofitable. It was left to them to cut costs and become more efficient. At the moment, part of the general divisional managers' salaries is performancerelated, but the aim is to extend this to more layers of management. Managers and staff are more aware of their portfolios.
Reports are made to the board twice a year, so the accounting system is particularly important. The first report is for the budget, detailed forecast and product profitability, and the second for actual compared with previous. The forecasting and budgeting processes both take two months. In January, managers are asked for their capital budgeting requirements and forecasts for the year until the end of May. Departments meet the following February to finalise their budgets. Budgets are completed by midApril and the dollars are fed into the ABM model.
Senior managers have also had to change focus. The new system gives them more information about what is going on in divisions and they have had to adjust their management practices accordingly. The systems did create some concern about how big a slice of cake people would have, and operational divisions now question expenditure on overheads.
The organisation needed to link ABM to corporate objectives in the form of increased product profitability and improved value for customers. Performance measures for divisional managers included ABM improvements. Introducing ABM was not seen as a costcutting exercise and the processes were seen to be important and effective at meeting the needs of customers.
Overall, ABM was used to ensure the organisation was doing the thing right. The introduction of the balanced scorecard will ensure it is also doing the right thing.
TIPS FOR ABM
• Get the support of senior management
• Recognise that ABM requires a major investment in time and resources
• Know what ABM can achieve and what information you want from the system
Activity-Based Costing and Activity-Based Management
22

• Decide which model to use
• Choose the model approach that emphasises the operational understanding of all activities in the business
• Involve people in the field
• Transfer ownership of cost management from the accounts department to the departments and processes where costs are incurred
• Don't underestimate the need to manage the change process
• Link ABM to corporate objectives in the form of increased product profitability and added value for customers.
11 Direct Product Profitability (DPP)
As traditional absorption costing, which normally uses labour hours as a basis for absorption, is rarely suitable for service and retail organisations other methods had to be devised. One relatively new way of spreading overheads in retail organisations, which is used in the grocery trade in particular, is direct product profitability (DPP).
Direct Product Profitability is 'used primarily within the retail sector...DPP involves the attribution of both the purchase price and other indirect costs (for example distribution, warehousing and retailing) to each product line. Thus a net profit, as opposed to a gross profit, can be identified for each product. The cost attribution process utilises a variety of measures (for example warehousing space and transport time) to reflect the resource consumption of individual products'.
CIMA Official Terminology
DPP started in the USA in the 1960s at General Electric, and was then taken up and used by Proctor and Gamble in the 1980s. In 1985 the Food Marketing Institute in the USA laid down a standard approach to the system and two years later DPP was taken up by the Institute of Grocery Distribution in the UK. The system described below was introduced in the late 1980s and has since undergone transformation as activitybased costing has developed.
chapter 1
23
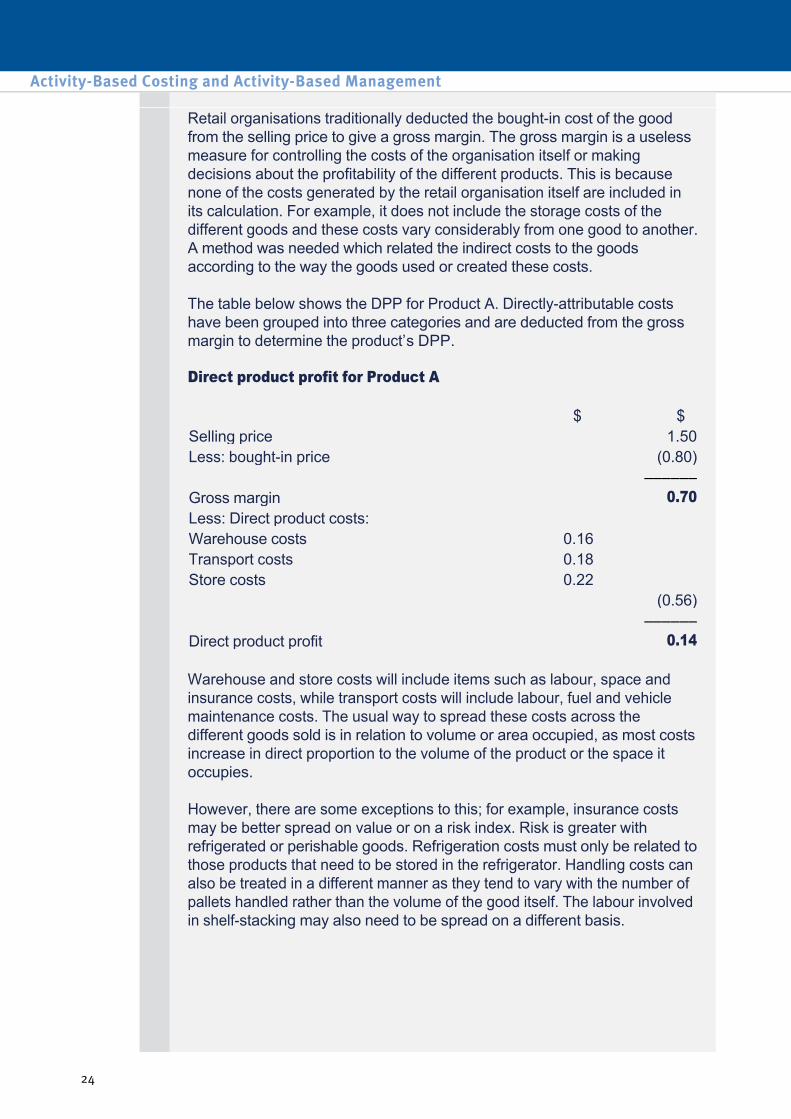
Retail organisations traditionally deducted the boughtin cost of the good from the selling price to give a gross margin. The gross margin is a useless measure for controlling the costs of the organisation itself or making decisions about the profitability of the different products. This is because none of the costs generated by the retail organisation itself are included in its calculation. For example, it does not include the storage costs of the different goods and these costs vary considerably from one good to another. A method was needed which related the indirect costs to the goods according to the way the goods used or created these costs.
The table below shows the DPP for Product A. Directlyattributable costs have been grouped into three categories and are deducted from the gross margin to determine the product’s DPP.
Direct product profit for Product A
Warehouse and store costs will include items such as labour, space and insurance costs, while transport costs will include labour, fuel and vehicle maintenance costs. The usual way to spread these costs across the different goods sold is in relation to volume or area occupied, as most costs increase in direct proportion to the volume of the product or the space it occupies.
However, there are some exceptions to this; for example, insurance costs may be better spread on value or on a risk index. Risk is greater with refrigerated or perishable goods. Refrigeration costs must only be related to those products that need to be stored in the refrigerator. Handling costs can also be treated in a different manner as they tend to vary with the number of pallets handled rather than the volume of the good itself. The labour involved in shelfstacking may also need to be spread on a different basis.
$ $ Selling price 1.50 Less: boughtin price (0.80) –––––– Gross margin 0.70 Less: Direct product costs: Warehouse costs 0.16 Transport costs 0.18 Store costs 0.22 (0.56) –––––– Direct product profit 0.14
Activity-Based Costing and Activity-Based Management
24
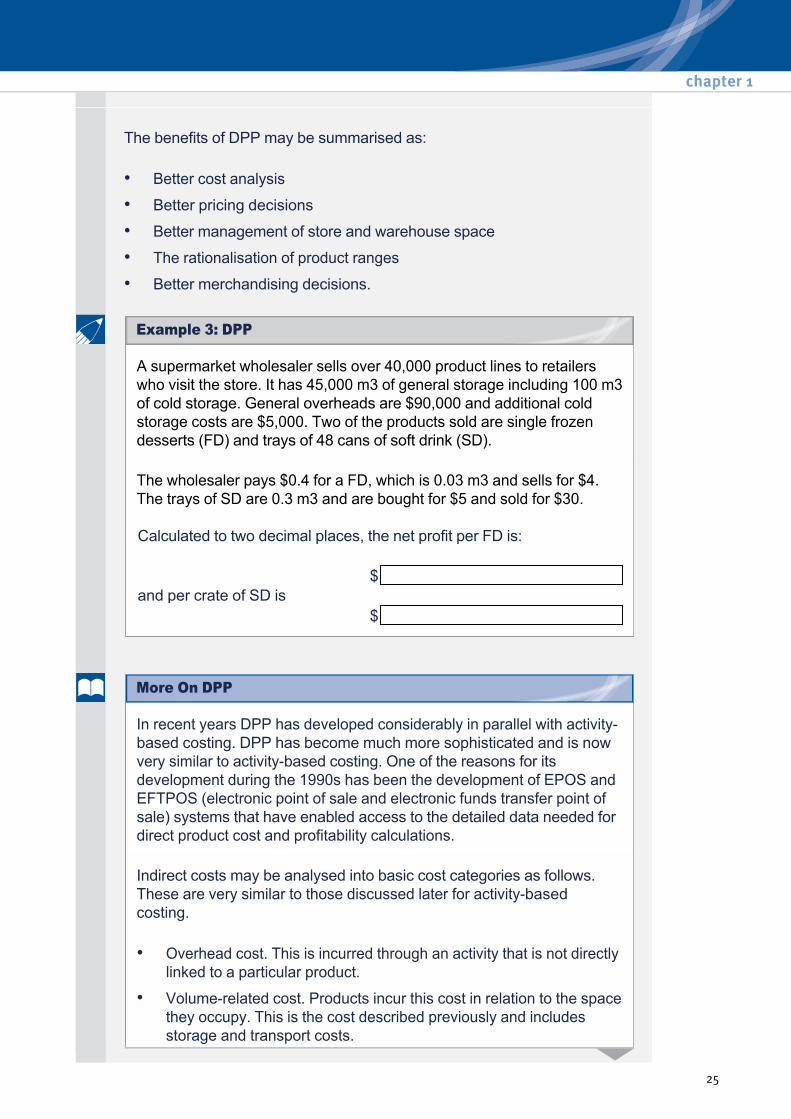
The benefits of DPP may be summarised as:
• Better cost analysis
• Better pricing decisions
• Better management of store and warehouse space
• The rationalisation of product ranges
• Better merchandising decisions.
A supermarket wholesaler sells over 40,000 product lines to retailers who visit the store. It has 45,000 m3 of general storage including 100 m3 of cold storage. General overheads are $90,000 and additional cold storage costs are $5,000. Two of the products sold are single frozen desserts (FD) and trays of 48 cans of soft drink (SD).
The wholesaler pays $0.4 for a FD, which is 0.03 m3 and sells for $4. The trays of SD are 0.3 m3 and are bought for $5 and sold for $30.
Calculated to two decimal places, the net profit per FD is:
$ and per crate of SD is
$
In recent years DPP has developed considerably in parallel with activitybased costing. DPP has become much more sophisticated and is now very similar to activitybased costing. One of the reasons for its development during the 1990s has been the development of EPOS and EFTPOS (electronic point of sale and electronic funds transfer point of sale) systems that have enabled access to the detailed data needed for direct product cost and profitability calculations.
Indirect costs may be analysed into basic cost categories as follows. These are very similar to those discussed later for activitybased costing.
• Overhead cost. This is incurred through an activity that is not directly linked to a particular product.
• Volumerelated cost. Products incur this cost in relation to the space they occupy. This is the cost described previously and includes storage and transport costs.
chapter 1
25
More On DPP
Example 3: DPP

DPP software systems can be purchased to model costs. They require a number of key variables to analyse different situations. The variables are:
• Product batch cost. This is often a timebased cost. If product items (i.e. a number of identical products which are handled together as a batch) are stacked on shelves, a labour time cost is incurred. If shipping documents have to be prepared for an order or batch, this again is a labour time cost.
• Inventory financing costs. This is the cost of tying up money in inventory and is the cost of the product multiplied by the company’s cost of capital per day or per week.
• Each of the categories above will contain a number of individual activities, such as:
(1) Checking incoming goods
(2) Repacking or packing out for storing
(3) Inspecting products
(4) Refilling store shelf.
(a) Buying and selling prices. The retailer has the option to adjust the selling price. A price increase from a supplier can always be used to increase the gross margin, but the higher the selling price relative to other retailers the slower inventory movement is likely to be.
(b) Rate of sale. This is critical and needs to be as fast as possible in order to minimise space costs at the warehouse and the store, and to avoid loss of interest on money tied up in inventory.
(c) Inventoryholding size. The aim is to hold as little inventory as possible in keeping with JIT principles without running out of inventory.
(d) Product size. This is the cubic area that the product occupies and is important because space costs per item will be incurred according to size.
(e) Pallet configuration. The larger the number of cases on the pallet the cheaper handling costs per unit will be.
(f) Ordering costs. Obviously fewer orders will be cheaper but fewer orders will mean holding more inventory.
(g) Distribution routes. Are the goods transported direct to the store or is a central warehouse used? Transporting goods direct to the store is a high cost activity for the supplier and it is usually better to use a central warehouse, even for goods with a short shelf life.
Activity-Based Costing and Activity-Based Management
26
12 Customer Profitability Analysis
In many organisations, it is just as important to cost customers as it is to cost products. Different customers or groups of customers differ in their profitability. This is a relatively new technique that ABC makes possible because it creates cost pools for activities. Customers use some activities but not all, and different groups of customers have different ‘activity profiles’.
Customer Profitability Analysis is 'the analysis of revenue streams and service costs associated with specific customers or customer groups'.
CIMA Official Terminology
Service organisations such as a bank or a hotel in particular need to cost customers. A bank’s activities for a customer will include the following types of activities:
Different customers or categories of customers will each use different amounts of these activities and so customer profitability profiles can be built up, and customers can be charged according to the cost to serve them.
• Withdrawal of cash
• Unauthorised overdraft
• Request for a statement
• Stopping a cheque
• Returning a cheque because of insufficient funds.
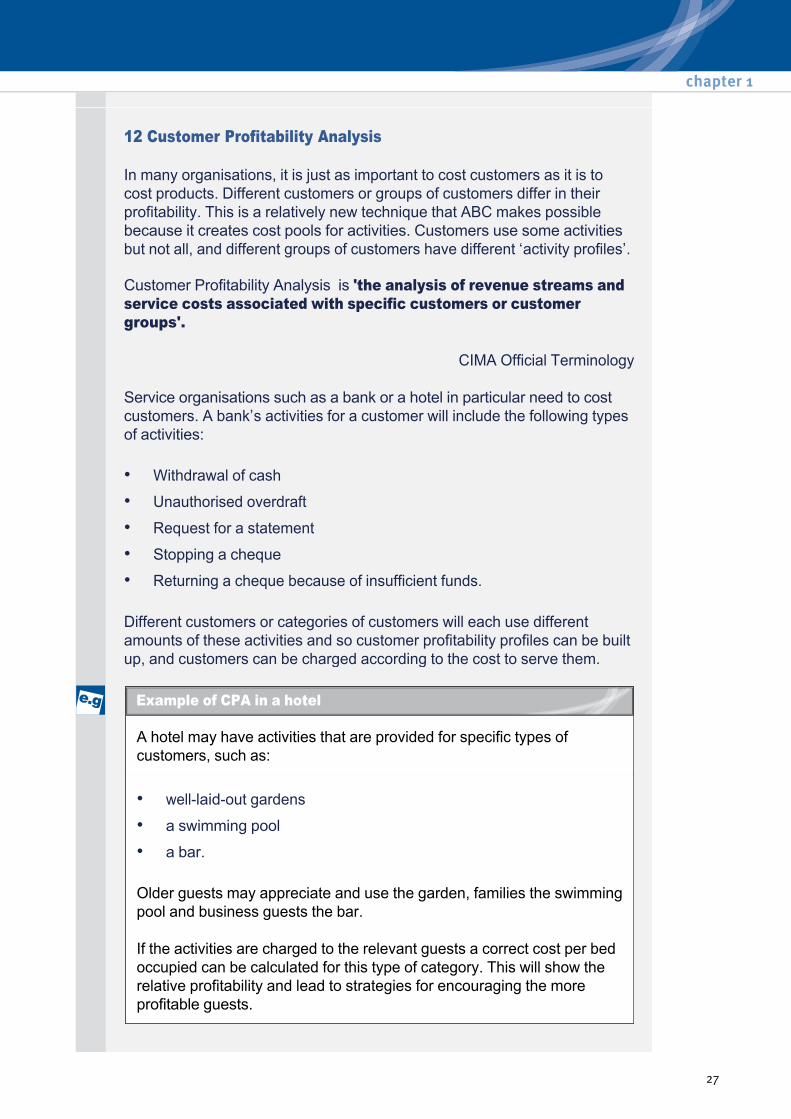
A hotel may have activities that are provided for specific types of customers, such as:
Older guests may appreciate and use the garden, families the swimming pool and business guests the bar.
If the activities are charged to the relevant guests a correct cost per bed occupied can be calculated for this type of category. This will show the relative profitability and lead to strategies for encouraging the more profitable guests.
• welllaidout gardens
• a swimming pool
• a bar.
chapter 1
27
Example of CPA in a hotel
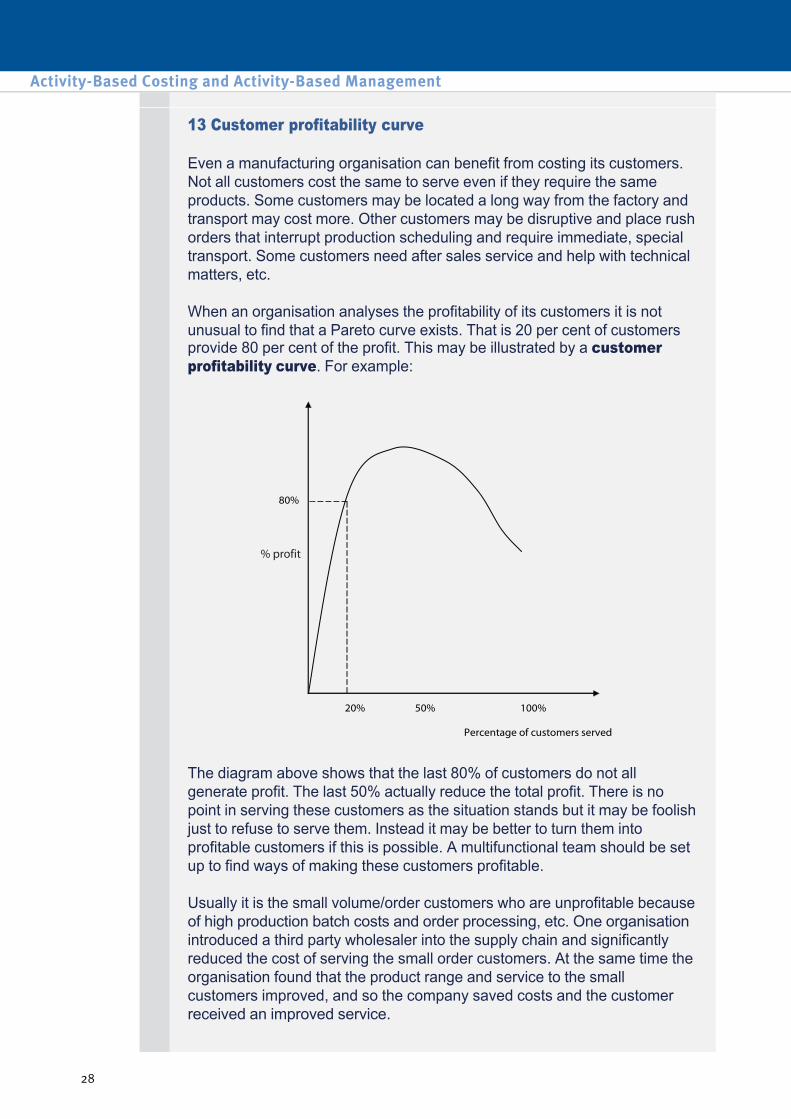
13 Customer profitability curve
Even a manufacturing organisation can benefit from costing its customers. Not all customers cost the same to serve even if they require the same products. Some customers may be located a long way from the factory and transport may cost more. Other customers may be disruptive and place rush orders that interrupt production scheduling and require immediate, special transport. Some customers need after sales service and help with technical matters, etc.
When an organisation analyses the profitability of its customers it is not unusual to find that a Pareto curve exists. That is 20 per cent of customers provide 80 per cent of the profit. This may be illustrated by a customer profitability curve. For example:
The diagram above shows that the last 80% of customers do not all generate profit. The last 50% actually reduce the total profit. There is no point in serving these customers as the situation stands but it may be foolish just to refuse to serve them. Instead it may be better to turn them into profitable customers if this is possible. A multifunctional team should be set up to find ways of making these customers profitable.
Usually it is the small volume/order customers who are unprofitable because of high production batch costs and order processing, etc. One organisation introduced a third party wholesaler into the supply chain and significantly reduced the cost of serving the small order customers. At the same time the organisation found that the product range and service to the small customers improved, and so the company saved costs and the customer received an improved service.
Activity-Based Costing and Activity-Based Management
28

XY provides accountancy services and has three different categories of client:
XY currently charges its clients a fee by adding a 20% markup to total costs. Currently, the costs are attributed to each client based on the hours spent on preparing accounts and providing advice. XY is considering changing to an activity based costing system. The annual costs and the causes of these costs have been analysed as follows:
The following details relate to three of XY’s clients and to XY as a whole:
Required:
Prepare calculations to show the effect on fees charged to each of these three clients of changing to the new costing system.
• limited companies
• self employed individuals
• employed individuals requiring taxation advice.
Accounts preparation and advice $580,000 Requesting missing information $30,000 Issuing fee payment reminders $15,000 Holding client meetings $60,000 Travelling to clients $40,000
Client XY
A B C
Hours spent on preparing accounts and providing advice
1,000 250 340 18,000
Requests for missing information 4 10 6 250
Payment reminders sent 2 8 10 400
Client meetings held 4 1 2 250
Miles travelled to clients 150 600 0 10,000
chapter 1
29
Illustration – CPA
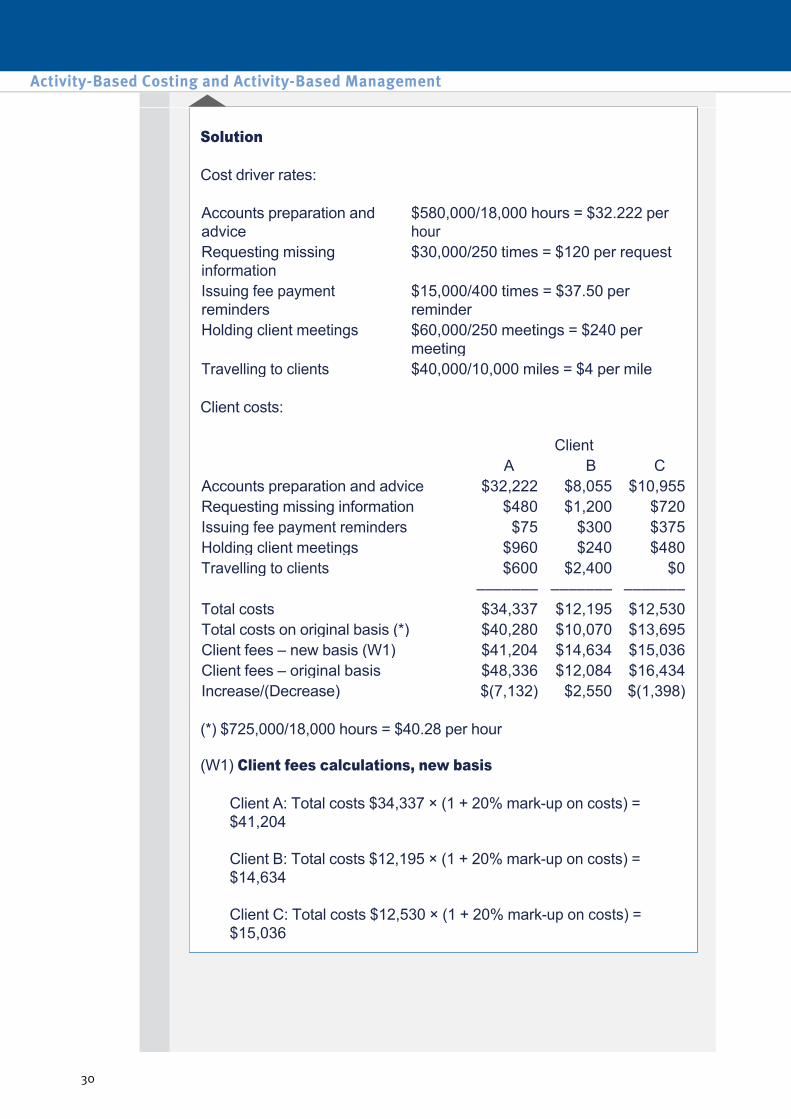
Solution
Cost driver rates:
Client costs:
(*) $725,000/18,000 hours = $40.28 per hour
(W1) Client fees calculations, new basis
Client A: Total costs $34,337 × (1 + 20% markup on costs) = $41,204
Client B: Total costs $12,195 × (1 + 20% markup on costs) = $14,634
Client C: Total costs $12,530 × (1 + 20% markup on costs) = $15,036
Accounts preparation and advice
$580,000/18,000 hours = $32.222 per hour
Requesting missing information
$30,000/250 times = $120 per request
Issuing fee payment reminders
$15,000/400 times = $37.50 per reminder
Holding client meetings $60,000/250 meetings = $240 per meeting
Travelling to clients $40,000/10,000 miles = $4 per mile
Client A B C
Accounts preparation and advice $32,222 $8,055 $10,955 Requesting missing information $480 $1,200 $720 Issuing fee payment reminders $75 $300 $375 Holding client meetings $960 $240 $480 Travelling to clients $600 $2,400 $0
––––––– ––––––– ––––––– Total costs $34,337 $12,195 $12,530 Total costs on original basis (*) $40,280 $10,070 $13,695 Client fees – new basis (W1) $41,204 $14,634 $15,036 Client fees – original basis $48,336 $12,084 $16,434 Increase/(Decrease) $(7,132) $2,550 $(1,398)
Activity-Based Costing and Activity-Based Management
30
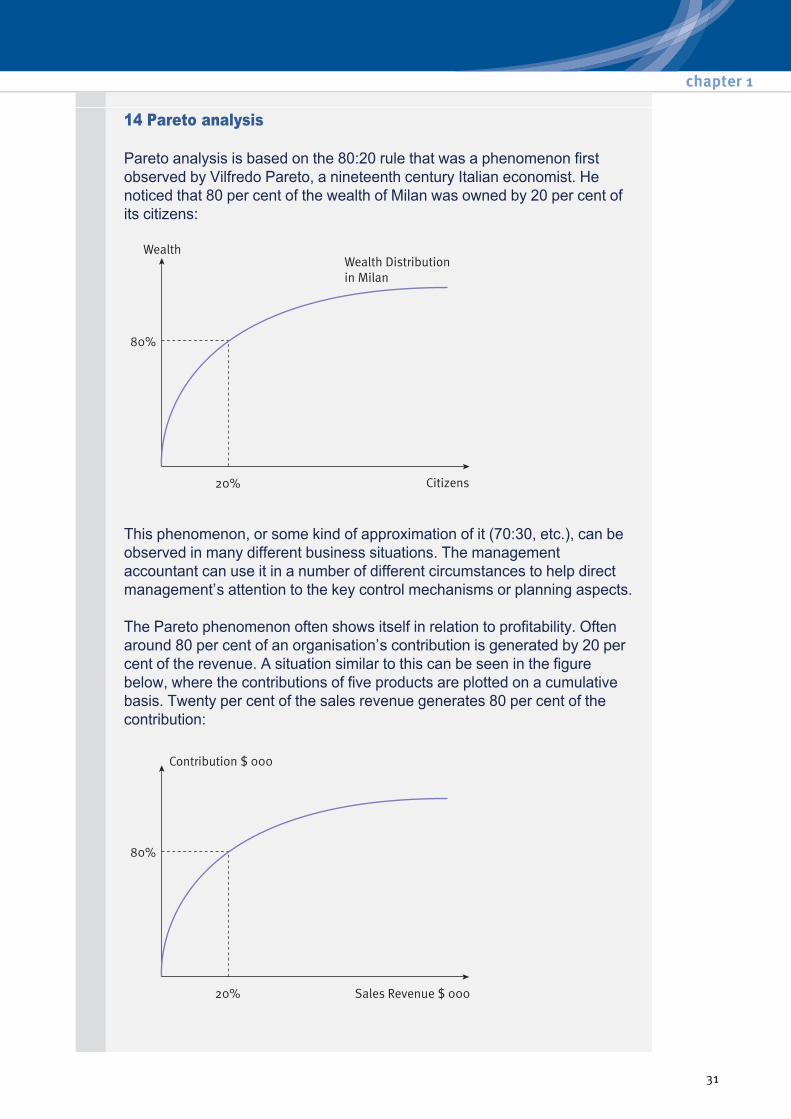
14 Pareto analysis
Pareto analysis is based on the 80:20 rule that was a phenomenon first observed by Vilfredo Pareto, a nineteenth century Italian economist. He noticed that 80 per cent of the wealth of Milan was owned by 20 per cent of its citizens:
This phenomenon, or some kind of approximation of it (70:30, etc.), can be observed in many different business situations. The management accountant can use it in a number of different circumstances to help direct management’s attention to the key control mechanisms or planning aspects.
The Pareto phenomenon often shows itself in relation to profitability. Often around 80 per cent of an organisation’s contribution is generated by 20 per cent of the revenue. A situation similar to this can be seen in the figure below, where the contributions of five products are plotted on a cumulative basis. Twenty per cent of the sales revenue generates 80 per cent of the contribution:
chapter 1
31

It is not always advisable to delete products from the range if they are not very profitable or their price cannot be increased, without carrying out careful analysis. The poor performers may be new products establishing themselves in the market and they may have a profitable future. However, the products that generate the largest proportion of the contribution need to be looked after. One reason for their profitability may be a high degree of branding which increases the contribution margin per unit. The company must continue to spend money promoting the brand so as to keep it in front of the public.
Pareto analysis has a number of different uses in business:
Another use for Pareto analysis is in inventory control where it may be found that only a few of the goods in inventory make up most of the value. A typical analysis of inventory may reveal the situation shown as follows:
• Instead of analysing products, customers can be analysed for their relative profitability to the organisation. Again, it is often found that approximately 20 per cent of customers generate 80 per cent of the profit. There will always be some customers who are less profitable than others, just as some products are less profitable than others.
• The key with customers is to make sure that the overall profile does not degenerate and the aim should be to improve the profile. This can be seen in the figure below, where the solid line represents the present position and the two dotted lines represent a change in performance for the better and worse. The 'better profile' dotted line shows improved performance in the sense that customers are contributing more evenly to the profit, thus stabilising the position of the organisation. With the ‘worse profile’, the loss of, say, two of the best customers might seriously jeopardise the organisation’s future:
Product Value % of value % of volume Action A High value 70% 10 Control carefully B Medium value 20% 20 Medium control C Little value 10% 70 No control
Activity-Based Costing and Activity-Based Management
32

The outcome of this type of analysis may be to increase control and safeguards on the 10 per cent of the inventory that is of a particularly high value and to remove or reduce the controls on the inventory that is of little value. Alternatively it may be found that a few items take up most of the storage space and therefore storage costs are unduly high for these items. It may be possible to move towards a justintime system for these items only, thus saving money and space.
Another study might relate to activitybased costing and overheads. It may show that 20 per cent of an organisation’s cost drivers are responsible for 80 per cent of the total cost. By analysing, monitoring and controlling those cost drivers that cause most cost, a better control and understanding of overheads will be obtained.
Procedure
(1) Rank the data in descending order.
(2) Find each figure as a percentage of the total.
(3) Turn this into a cumulative percentage.
(4) It is possible to draw a diagram to illustrate the principle, e.g. a component bar chart or a cumulative frequency graph.
ABC Limited manufactures and sells seven products. The following data relates to the latest period:
Product Contribution in $000
P 96 Q 36 R 720 S 240 T 12 U 60 V 24 –––––
1,188 –––––
chapter 1
33
Pareto analysis and charts

To prepare a Pareto chart of product contribution and comment on the results, the first step is to rearrange the products in descending order of contribution and calculate the cumulative contribution:
The cumulative data can now be used to produce the required Pareto chart showing product contribution:
The analysis shows that more than 80 per cent of the total contribution is earned by two products: R and S. The position of these products needs protecting, perhaps through careful attention to branding and promotion. The other products require investigation to see whether their contribution can be improved through increased prices, reduced costs or increased volumes.
The term ‘Pareto diagram’ usually refers to a histogram or frequency chart on product quality – see figure below. In the 1950s Juran observed that a few causes of poor quality usually accounted for most of the quality problems – hence the name Pareto. The figure below shows a frequency chart for poor quality in boxed cakes, and it can easily be imagined how it could be turned into a Pareto chart.
Product Contribution in $
Cumulative Contribution in
$000
Cumulative %
R 720 720 61 S 240 960 81 P 96 1,056 89 U 60 1,116 94 Q 36 1,152 97 V 24 1,176 99 T 12 1,188 100
––––– 1,188 –––––
Activity-Based Costing and Activity-Based Management
34

The purpose of the analysis, in this case, is to direct attention to the area where the best returns can be achieved by solving most of the quality problems, perhaps just with a single action. In this case more accurate grading of eggs by volume by the supplier may solve about 40 per cent of the total quality problem and if the mixing time is made more accurate at least 75 per cent of the problems will be removed.
15 Distribution channel profitability
Distribution channels are in simple terms the means of transacting with customers. The channel is the point of purchase which need not necessarily be the point of communication, payment, delivery and after sales support. Companies may transact with their customers through direct channels e.g. sales teams, telephone, shops, Internet or through indirect channels e.g. retailers, wholesalers, resellers, agents.
Regardless of whether a company’s channels are direct or indirect they should always consider the ultimate needs of the customer and therefore use the channels to ensure that those needs are satisfied. Customers will look for ease of access to the supplier, reciprocal communication, products and services which satisfy their needs, prompt delivery, after sales support to name but a few.
The channel a company selects is therefore a critical driver to business profitability. A company should not only aim to satisfy the needs of the customer but must also ensure that the products and services that they are providing are profitable. The method of channel distribution chosen can account for a significant proportion of total cost and choosing the wrong channel can result in significant losses for that particular product or service. Key aspects that the company needs to consider in relation to their distribution channels include; access to the customer base, brand awareness, competitiveness, achieving sales and market targets, speed of payment, customer retention rates and most importantly of all profitability.
chapter 1
35
In companies it is just as important to cost channels as it is to cost products and customers. Different channels will differ in profitability.
Activity based costing information makes this possible because it creates cost pools for activities. Channels will use some activities but not all, and different channels will have different ‘activity profiles’. This makes channel profitability analysis possible and allows companies to build up distribution channel profitability profiles. It can be possible therefore for a company to identify costly distribution channels for low margin products or services which they are supplying through direct channels, and which may best be offered through indirect channels. This would result in reduced channel distribution costs, and a better profitability profile for the product or service.
16 Activity – Based Budgeting
As its name should suggest, activitybased budgeting (ABB) takes a similar approach to activitybased costing.
ABB is 'a method of budgeting based on an activity framework and utilising cost driver data in the budgetsetting and variance feedback processes'.
CIMA Official Terminology
Whereas ZeroBased Budgeting (ZBB) is based on budgets (decision packages) prepared by responsibility centre managers, ABB is based on budgeting for activities.
The basic approach of ABB is to budget the costs for each cost pool or activity.
There will also be some general overhead costs that are not activityrelated, such as factory rental costs and the salary cost of the factory manager. General overhead costs are budgeted separately.
(1) The cost driver for each activity is identified. A forecast is made of the number of units of the cost driver that will occur in the budget period.
(2) Given the estimate of the activity level for the cost driver, the activity cost is estimated. Where appropriate, a cost per unit of activity is calculated.
Activity-Based Costing and Activity-Based Management
36
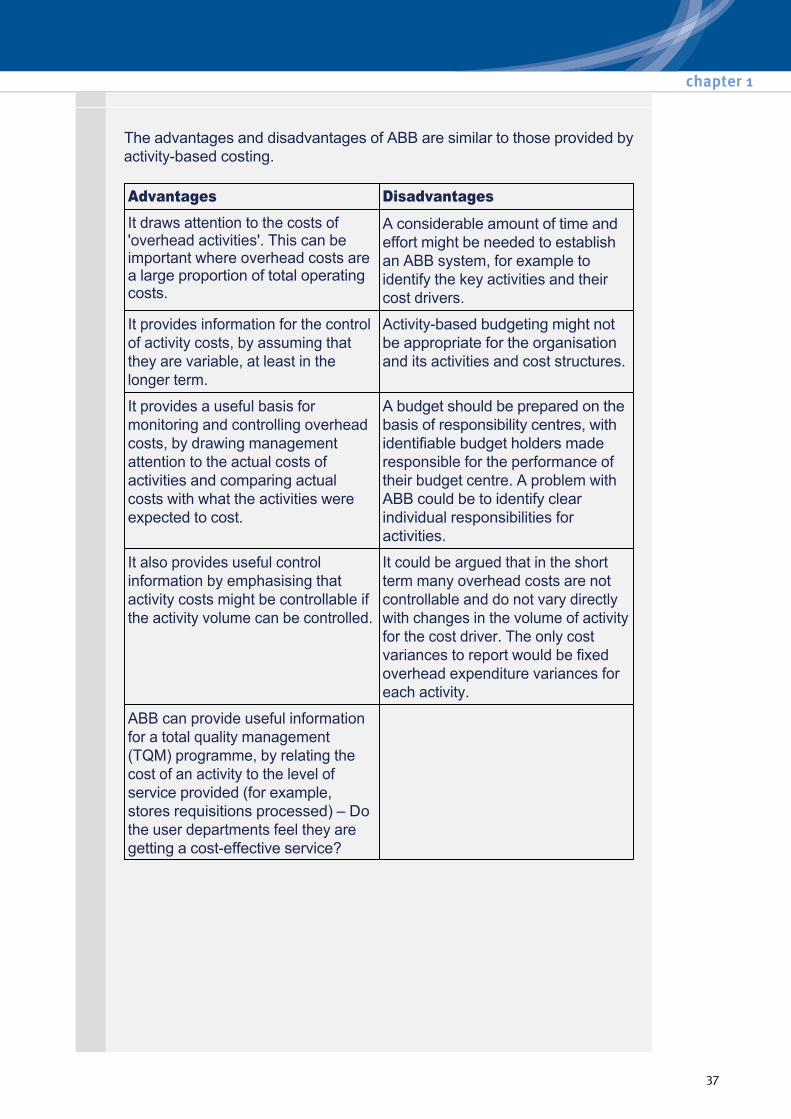
The advantages and disadvantages of ABB are similar to those provided by activitybased costing.
Advantages Disadvantages It draws attention to the costs of 'overhead activities'. This can be important where overhead costs are a large proportion of total operating costs.
A considerable amount of time and effort might be needed to establish an ABB system, for example to identify the key activities and their cost drivers.
It provides information for the control of activity costs, by assuming that they are variable, at least in the longer term.
Activitybased budgeting might not be appropriate for the organisation and its activities and cost structures.
It provides a useful basis for monitoring and controlling overhead costs, by drawing management attention to the actual costs of activities and comparing actual costs with what the activities were expected to cost.
A budget should be prepared on the basis of responsibility centres, with identifiable budget holders made responsible for the performance of their budget centre. A problem with ABB could be to identify clear individual responsibilities for activities.
It also provides useful control information by emphasising that activity costs might be controllable if the activity volume can be controlled.
It could be argued that in the short term many overhead costs are not controllable and do not vary directly with changes in the volume of activity for the cost driver. The only cost variances to report would be fixed overhead expenditure variances for each activity.
ABB can provide useful information for a total quality management (TQM) programme, by relating the cost of an activity to the level of service provided (for example, stores requisitions processed) – Do the user departments feel they are getting a costeffective service?
chapter 1
37

17 Practice Questions
Company A manufactures three smartphones. Company A currently operates a traditional absorption costing system, but has decided to use an activity based costing (ABC) system on a trial basis for its procurement operation. A timebased cost driver is used to charge the procurement costs to the smartphones under the ABC system. The following unit manufacturing costs have been determined using both traditional absorption costing and activity based costing:
Place each of the following statements in a grey cell, against the product to which it is most likely to relate:
Traditional absorption
costing
Activity Based Costing
Smartphone Type 1 $90 $108
Smartphone Type 2 $102 $104
Smartphone Type 3 $95 $85
Smartphone Type 1
Smartphone Type 2
Smartphone Type 3
This smartphone uses a lot of parts and materials that are readily available. It does not require any special order: only one supplier is involved, who has been supplying
Company A for years. All the components are readily available in the warehouse. Assembling
the phone is very straightforward, and does not incur any specific
costs.
This smartphone has relatively few components that are generally
purchased in bulk. However, the camera
components require a special order to a supplier
overseas.
This smartphone uses a lot of parts and materials that are difficult to
obtain, and so puts the buying
department under pressure.
Activity-Based Costing and Activity-Based Management
38
Objective Test Question 1: ABC vs. traditional costing
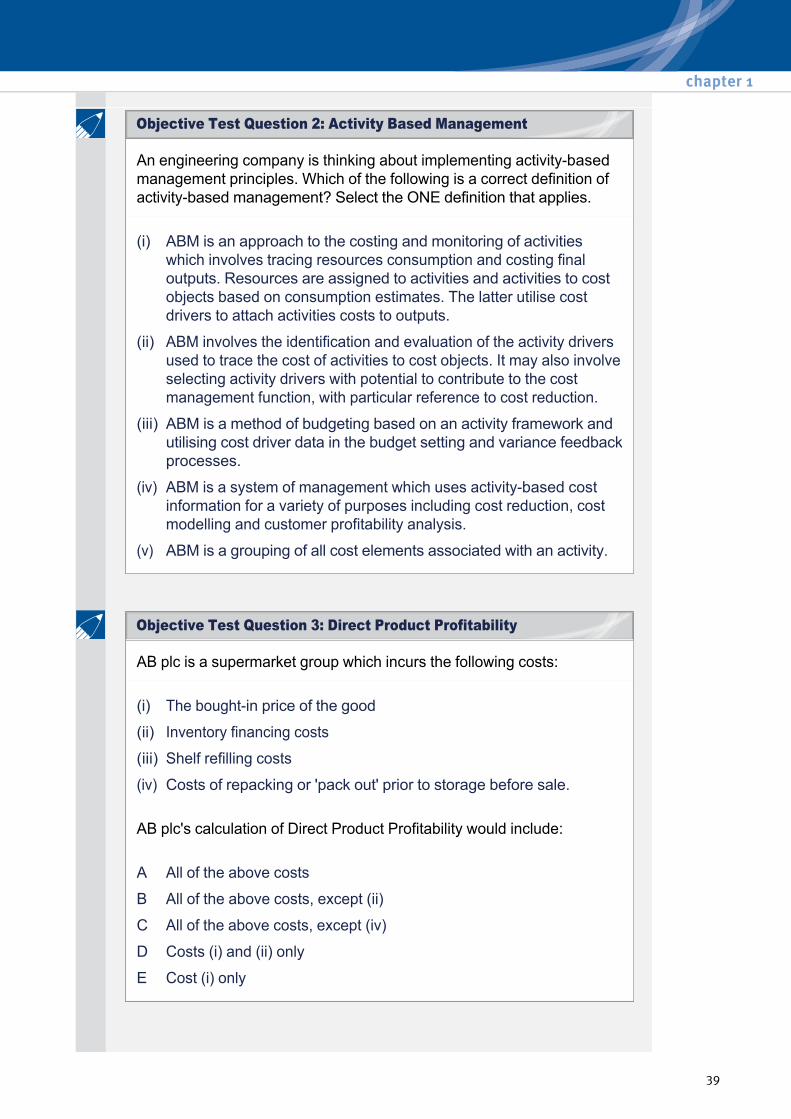
An engineering company is thinking about implementing activitybased management principles. Which of the following is a correct definition of activitybased management? Select the ONE definition that applies.
(i) ABM is an approach to the costing and monitoring of activities which involves tracing resources consumption and costing final outputs. Resources are assigned to activities and activities to cost objects based on consumption estimates. The latter utilise cost drivers to attach activities costs to outputs.
(ii) ABM involves the identification and evaluation of the activity drivers used to trace the cost of activities to cost objects. It may also involve selecting activity drivers with potential to contribute to the cost management function, with particular reference to cost reduction.
(iii) ABM is a method of budgeting based on an activity framework and utilising cost driver data in the budget setting and variance feedback processes.
(iv) ABM is a system of management which uses activitybased cost information for a variety of purposes including cost reduction, cost modelling and customer profitability analysis.
(v) ABM is a grouping of all cost elements associated with an activity.
AB plc is a supermarket group which incurs the following costs:
AB plc's calculation of Direct Product Profitability would include:
(i) The boughtin price of the good
(ii) Inventory financing costs
(iii) Shelf refilling costs
(iv) Costs of repacking or 'pack out' prior to storage before sale.
A All of the above costs
B All of the above costs, except (ii)
C All of the above costs, except (iv)
D Costs (i) and (ii) only
E Cost (i) only
chapter 1
39
Objective Test Question 2: Activity Based Management
Objective Test Question 3: Direct Product Profitability
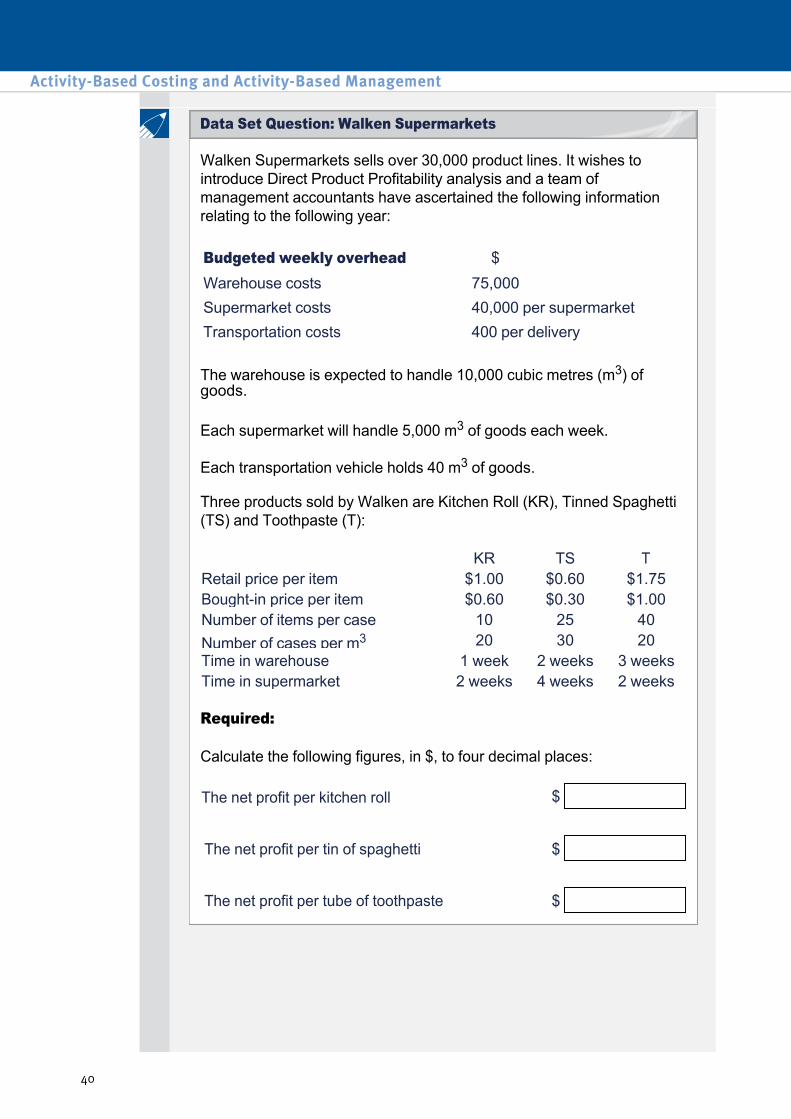
Walken Supermarkets sells over 30,000 product lines. It wishes to introduce Direct Product Profitability analysis and a team of management accountants have ascertained the following information relating to the following year:
The warehouse is expected to handle 10,000 cubic metres (m3) of goods.
Each supermarket will handle 5,000 m3 of goods each week.
Each transportation vehicle holds 40 m3 of goods.
Three products sold by Walken are Kitchen Roll (KR), Tinned Spaghetti (TS) and Toothpaste (T):
Required:
Calculate the following figures, in $, to four decimal places:
Budgeted weekly overhead $ Warehouse costs 75,000 Supermarket costs 40,000 per supermarket Transportation costs 400 per delivery
KR TS T Retail price per item $1.00 $0.60 $1.75 Boughtin price per item $0.60 $0.30 $1.00 Number of items per case 10 25 40 Number of cases per m3 20 30 20 Time in warehouse 1 week 2 weeks 3 weeks Time in supermarket 2 weeks 4 weeks 2 weeks
The net profit per kitchen roll $
The net profit per tin of spaghetti $
The net profit per tube of toothpaste $
Activity-Based Costing and Activity-Based Management
40
Data Set Question: Walken Supermarkets
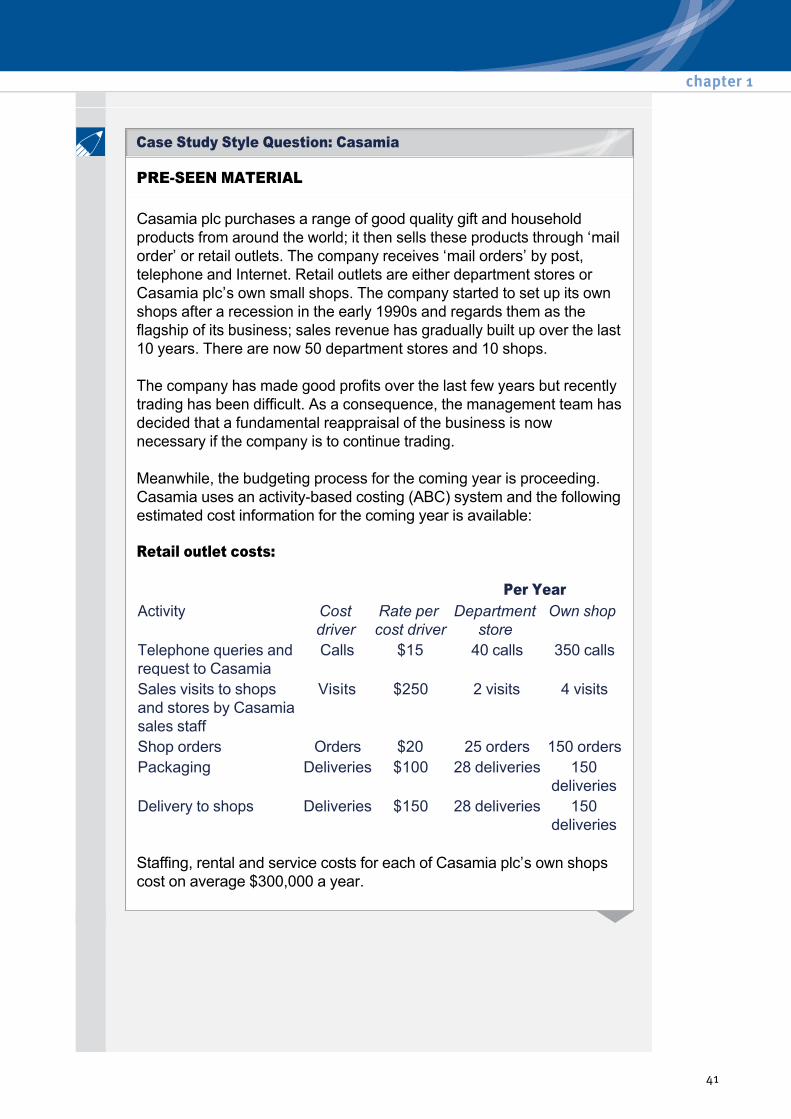
PRESEEN MATERIAL
Casamia plc purchases a range of good quality gift and household products from around the world; it then sells these products through ‘mail order’ or retail outlets. The company receives ‘mail orders’ by post, telephone and Internet. Retail outlets are either department stores or Casamia plc’s own small shops. The company started to set up its own shops after a recession in the early 1990s and regards them as the flagship of its business; sales revenue has gradually built up over the last 10 years. There are now 50 department stores and 10 shops.
The company has made good profits over the last few years but recently trading has been difficult. As a consequence, the management team has decided that a fundamental reappraisal of the business is now necessary if the company is to continue trading.
Meanwhile, the budgeting process for the coming year is proceeding. Casamia uses an activitybased costing (ABC) system and the following estimated cost information for the coming year is available:
Retail outlet costs:
Staffing, rental and service costs for each of Casamia plc’s own shops cost on average $300,000 a year.
Per Year Activity Cost
driverRate per cost driver
Department store
Own shop
Telephone queries and request to Casamia
Calls $15 40 calls 350 calls
Sales visits to shops and stores by Casamia sales staff
Visits $250 2 visits 4 visits
Shop orders Orders $20 25 orders 150 orders Packaging Deliveries $100 28 deliveries 150
deliveries Delivery to shops Deliveries $150 28 deliveries 150
deliveries
chapter 1
41
Case Study Style Question: Casamia

Mail order costs:
The total number of orders through the whole 'mail order' business for the coming year is expected to be 80,000. The maintenance of the internet link is estimated to cost $80,000 for the coming year. The following additional information for the coming year has been prepared:
Expected Head office and warehousing costs for the coming year:
Rate per cost driver Activity Cost
driverPost Telephone Internet
Processing 'mail orders' Orders $5 $6 $3 Dealing with 'mail order' queries Orders $4 $4 $1
Number of packages per order
Packaging and deliveries for 'mail orders' – cost per package $10
Packages 2 2 1
Department store
Own shop Post Telephone Internet
Sales revenue per outlet
$50,000 $1,000,000
Sales revenue per order
$150 $300 $100
Gross margin: markup on purchase costs
30% 40% 40% 40% 40%
Number of outlets 50 10 Percentage of 'mail orders'
30% 60% 10%
$ Warehouse $2,750,000 IT $550,000 Administration $750,000 Personnel $300,000
––––––––– Total $4,350,000
–––––––––
Activity-Based Costing and Activity-Based Management
42
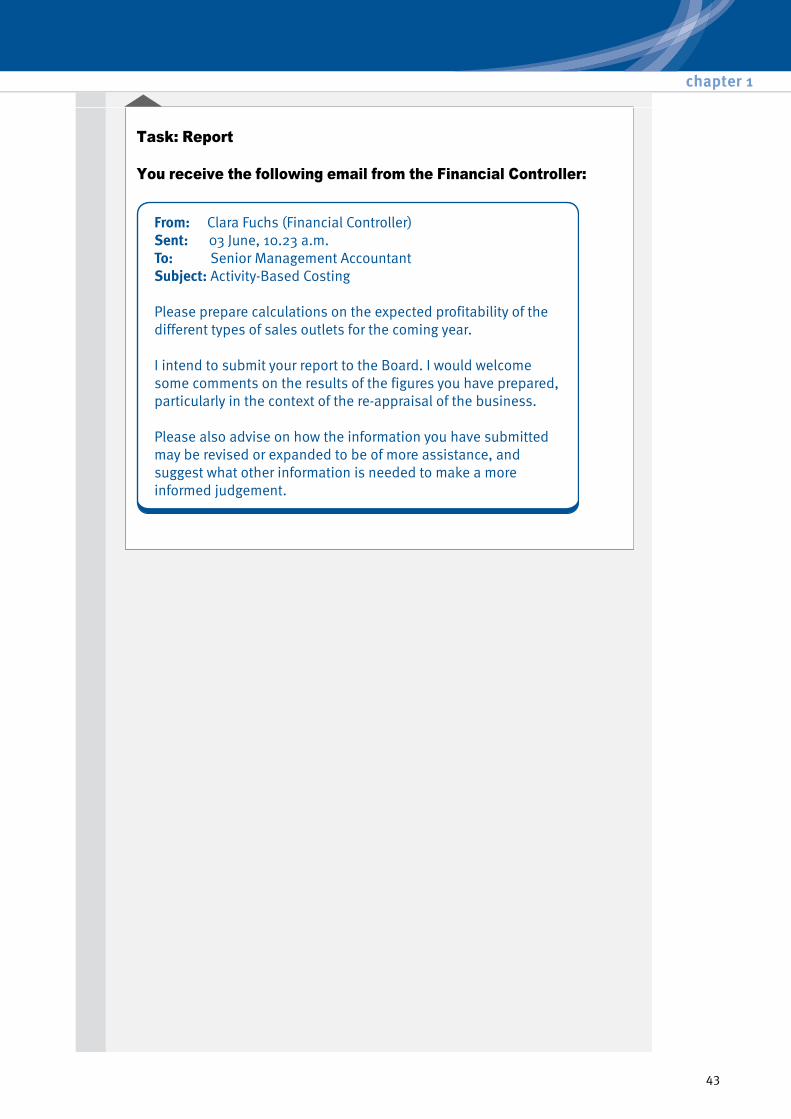
Task: Report
You receive the following email from the Financial Controller:
chapter 1
43
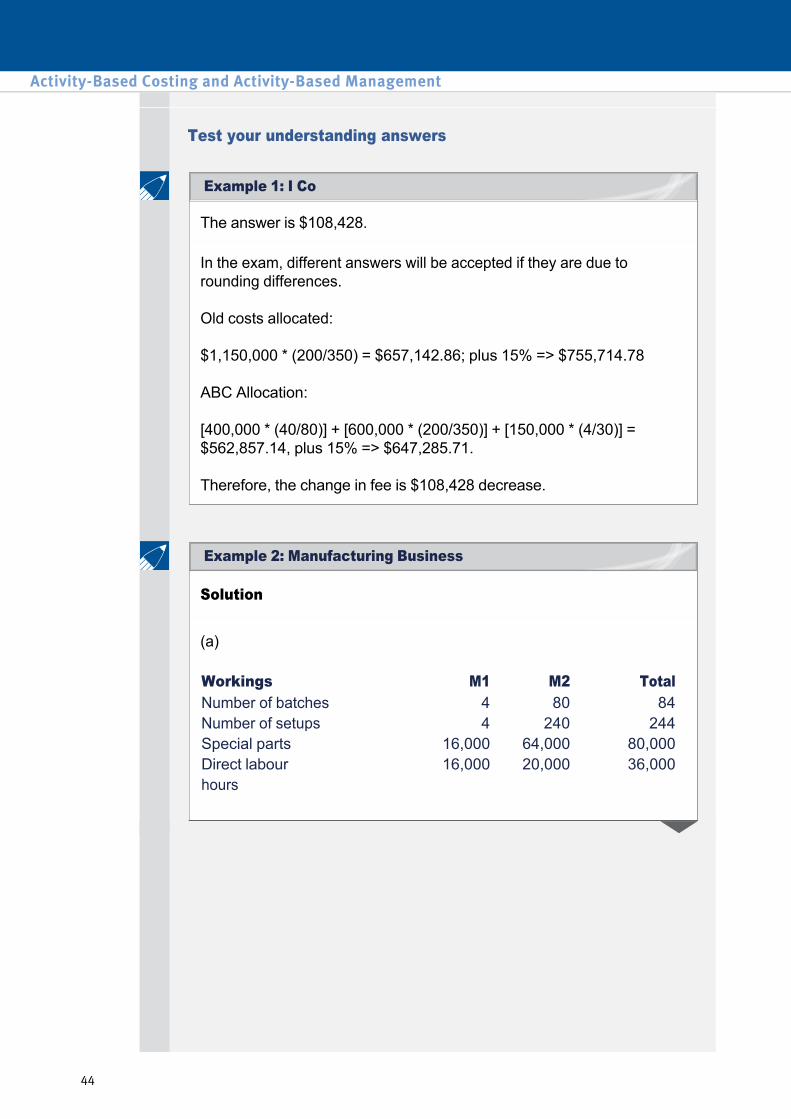
Test your understanding answers
The answer is $108,428.
In the exam, different answers will be accepted if they are due to rounding differences.
Old costs allocated:
$1,150,000 * (200/350) = $657,142.86; plus 15% => $755,714.78
ABC Allocation:
[400,000 * (40/80)] + [600,000 * (200/350)] + [150,000 * (4/30)] = $562,857.14, plus 15% => $647,285.71.
Therefore, the change in fee is $108,428 decrease.
Solution
(a)
Workings M1 M2 Total Number of batches 4 80 84 Number of setups 4 240 244 Special parts 16,000 64,000 80,000 Direct labour 16,000 20,000 36,000 hours
Activity-Based Costing and Activity-Based Management
44
Example 2: Manufacturing Business
Example 1: I Co

Activity Cost M1 M2 $ $ $
Setups 97,600 Cost per setup $400 1,600 96,000 Materials handling 42,000 Cost per batch $500 2,000 40,000 Special parts handling 50,000 Cost per part $0.625 10,000 40,000 Invoicing 31,000 Cost per order $100 6,000 25,000 Other overheads 108,000 Cost per hour $3 48,000 60,000
–––––– –––––– –––––– 328,600 67,600 261,000 –––––– –––––– ––––––
M1 M2 $ $ $ $
Sales $432,000 584,000 Direct materials 88,000 168,000 Direct labour 128,000 160,000 Overheads 67,600 261,000
––––––– ––––––– Total costs 283,600 589,000
––––––– ––––––– Profit/(loss) 148,400 (5,000)
––––––– ––––––– Profit/loss per unit 18.55 (0.625)
––––––– –––––––
(b) The figures suggest that model M2 is less profitable than M1. The sales manager should try to persuade the customer to buy model M1. Note that the apparent loss on M2 does not necessarily mean that production should be ceased. To assess this management should consider the incremental relevant cash flows involved – e.g. is the product making positive contribution, how many overheads are avoidable? They could also consider ways to reduce the cost drivers for the product to reduce its share of the overheads and convert the product loss into a profit.
chapter 1
45

The cold storage was included in the space of general storage, and therefore the frozen desserts should be allocated a share of the general costs as well as the cold storage costs.
General storage = $90,000/45,000 = $2 m3
Cold storage = $5,000/100 = $50 m3
Net profit of FD = $4 – $0.4 – 0.03 m3 × ($50 + $2) = $2.04
Net profit of SD = $30 – $5 – (0.3 m3 × $2) = $24.40
Smartphone Type 1 This smartphone uses a lot of parts and materials that are difficult to obtain, and so puts the buying department under pressure.
Smartphone Type 2 This smartphone has relatively few components that are generally purchased in bulk. However, the camera components require a special order to a supplier overseas.
Smartphone Type 3 This smartphone uses a lot of parts and materials that are readily available. It does not require any special order : only one supplier is involved, who has been supplying Company A for years. All the components are readily available in the warehouse. Assembling the phone is very straightforward, and does not incur any specific costs.
Smartphone 1 has a higher cost under ABC, which suggests a more complex item using specific parts and materials.
Smartphone 2 has a marginally higher cost under ABC, which suggests the use of mostly readily available components.
Smartphone 3 has a lower cost under ABC, which suggests a standard product using few, if any, specific or complex components.
Activity-Based Costing and Activity-Based Management
46
Objective Test Question 1: ABC vs. traditional costing
Example 3: DPP

The answer is (iv): ABM uses the information provided by an ABC analysis to improve organisational profitability.
Option (i) defines ABC.
Option (ii) defines activity driver analysis.
Option (iii) defines activity based budgeting.
Option (v) defines an activity cost pool.
The answer is A: All of the costs described can be identified with specific goods and would be deducted from the selling price to determine the direct product profit.
Warehouse cost $75,000 ÷ 10,000 = $7.50 per m3
Supermarket cost $40,000 ÷ 5,000 = $8.00 per m3
Transportation cost $400 ÷ 40 = $10 per m3
KR $ TS $ T $ Retail price 1.00 0.60 1.75 Less boughtin price (0.60) (0.30) (1.00) ––––– ––––– ––––– Gross margin 0.40 0.30 0.75 Less overheads:
Warehouse costs (see workings) 0.0375 0.02 0.0281 Supermarket costs (see workings) 0.08 0.0427 0.02 Transportation costs (see workings) 0.05 0.0133 0.0125
––––––– ––––––– ––––––– Net profit 0.2325 0.2240 0.6894 ––––––– ––––––– –––––––
chapter 1
47
Data Set Question: Walken Supermarkets
Objective Test Question 3: Direct Product Profitability
Objective Test Question 2: Activity Based Management

Warehouse charge:
Kitchen roll ($7.50 ÷ 200) × 1 week = 0.0375
Tinned spaghetti ($7.50 ÷ 750) × 2 weeks = 0.02
Toothpaste ($7.50 ÷ 800) × 3 weeks = 0.028125
Supermarket cost:
Kitchen roll ($8.00 ÷ 200) × 2 weeks = 0.08
Tinned spaghetti ($8.00 ÷ 750) × 4 weeks = 0.0427
Toothpaste ($8.00 ÷ 800) × 2 weeks = 0.02
Transportation costs:
Kitchen roll $10 per m3 (÷ 20 cases per m3) (÷ 10 items per case) = 0.05 per item
Tinned spaghetti $10 per m3 (÷ 30 cases per m3) (÷ 25 items per case) = 0.0133 per item
Toothpaste $10 per m3 (÷ 20 cases per m3)(÷ 40 items per case)=0.0125 per item
Workings:
Number of items per m3
10 × 20 = 200 25 × 30 = 750 40 × 20 = 800
Activity-Based Costing and Activity-Based Management
48
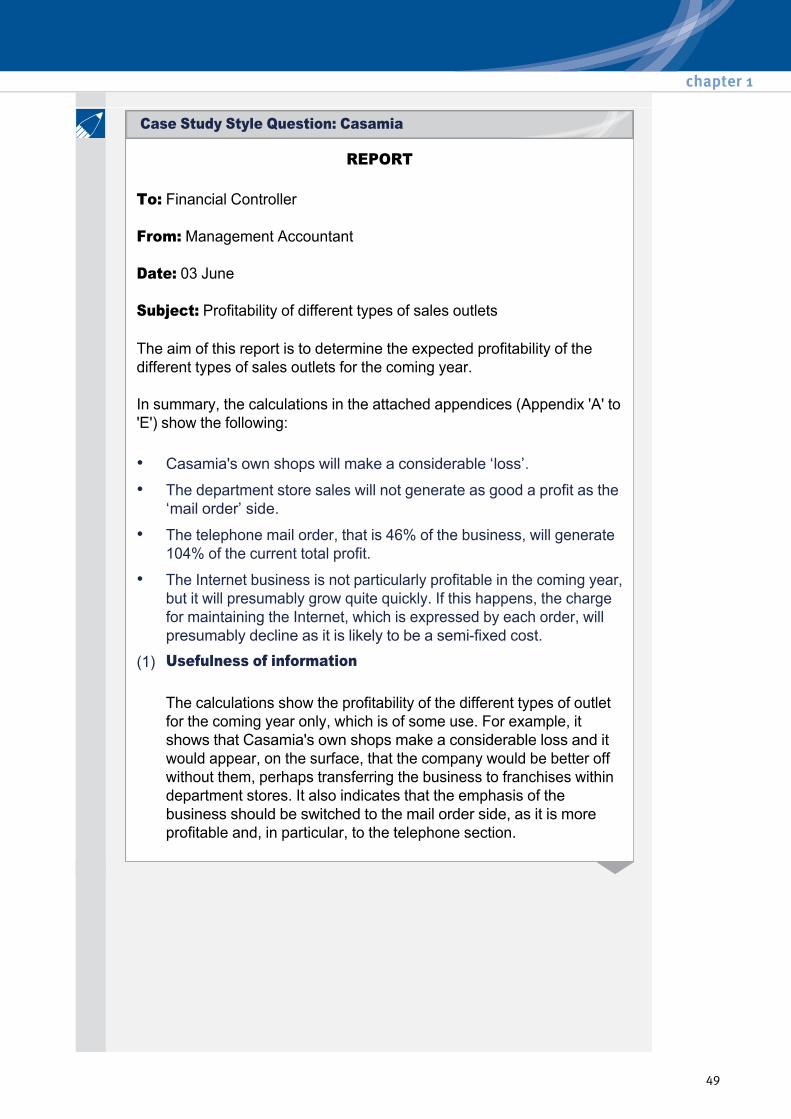
REPORT
To: Financial Controller
From: Management Accountant
Date: 03 June
Subject: Profitability of different types of sales outlets
The aim of this report is to determine the expected profitability of the different types of sales outlets for the coming year.
In summary, the calculations in the attached appendices (Appendix 'A' to 'E') show the following:
The calculations show the profitability of the different types of outlet for the coming year only, which is of some use. For example, it shows that Casamia's own shops make a considerable loss and it would appear, on the surface, that the company would be better off without them, perhaps transferring the business to franchises within department stores. It also indicates that the emphasis of the business should be switched to the mail order side, as it is more profitable and, in particular, to the telephone section.
• Casamia's own shops will make a considerable ‘loss’.
• The department store sales will not generate as good a profit as the ‘mail order’ side.
• The telephone mail order, that is 46% of the business, will generate 104% of the current total profit.
• The Internet business is not particularly profitable in the coming year, but it will presumably grow quite quickly. If this happens, the charge for maintaining the Internet, which is expressed by each order, will presumably decline as it is likely to be a semifixed cost.
(1) Usefulness of information
chapter 1
49
Case Study Style Question: Casamia

However, the latter shows how dangerous this kind of assumption can be because the telephone section may have peaked and, in future, growth in the Internet section may be at the expense of the telephone section. Therefore, decisions about future strategies cannot be made on predicted shortterm costs and revenues. Any attempt to do so could prove disastrous. Growth in the market, competitors’ moves, customers’ needs and requirements must be the basis for any decisions.
The ABC costs could, however, be used to highlight areas for cost reduction and procedural changes which could assist longerterm profitability. ABC is a method for apportioning costs and it suffers from the same defects as every absorption method. In Casamia's case, the analysis does not look very detailed/accurate and so may be little better than a traditional absorption system.
The head office and warehousing costs need to be examined in detail to determine which type of outlet incurs what part of the cost, as these costs may be caused and used more by some types of outlets than others. If this is so, what would happen to cost if one type of outlet was abandoned and others increased in size?
Customers’ changing purchasing habits
Same customer purchases across outlet types, that is, do customers buy from shops and order by telephone
Competitors’ moves
New entrants into the market – especially in the Internet business
Future economic conditions
Exchange rate movements – as some goods are imported
Increase in disposable income
The image created by the different types of outlet, that is do their own shops create the brand or company name
(2) The need for further information
(3) Other information needed to make a more informed judgement is likely to be:
Activity-Based Costing and Activity-Based Management
50

Past data to establish trends.
Then, specific information will need to be collected for the fundamental reappraisal of the business. For example, if the decision to close Casamia's own shops was being considered, a detailed study of the interrelationship between outlets should be carried out, as having the products on display in shops might be necessary in order to maintain the high level of telephone orders. For instance, potential customers may visit to see colours, quality, and so on.
Products on display are also a form of advertising for the company and this would be lost if the shops were closed.
Appendix A: Calculation of net margin per type of outlet
Mail order Department
Store Own shop Post Telephone Internet
Sales revenue 50,000 1,000,000 150.00 300.00 100.00
Gross margin1 (50,000 + 1.30, etc)
11,538 285,714 42.86 85.71 28.57
Less: Staffing etc. 300,000 Telephone queries ($15 × 40, etc)
600 5,250
Sales visits ($250 × 2, etc) 500 1,000 Orders ($20 × 25, etc) 500 3,000 Packaging ($100 × 28, etc) 2,800 15,000 Delivery ($150 × 28, etc) 4,200 22,500 Order cost 5.00 6.00 3.00 Queries 4.00 4.00 1.00 Packing & delivery ($10 × 2, etc)
20.00 20.00 10.00
Internet cost2 10.00 ––––––
8,600 346,750 29.00 30.00 24.00 –––––– ––––––– ––––– ––––– ––––––
Net margin 2,938 (61,036) 13.86 55.71 4.57 Net margin/sales 5.9% 9.2% 18.6% 4.6%
4th 5th 2nd 1st 3rd
chapter 1
51

Appendix B: Calculation of total margin for each type of outlet
Appendix C: Gross margin calculation for 30% of purchase cost
Appendix D: Mail order
Total number of mail orders = 80,000. So number of Internet orders = 80,000 × 10% = 8,000
Internet link cost per order = $80,000/8,000 orders = $10
Appendix E: Calculation of total revenues and net margins ($000)
Department Stores
Own shops
Mail order Total
$000 $000 Post $000
Telephone $000
Internet $000
$000
Total revenue 2,500 10,000 3,600 14,400 800 31,300 Total net margin 146.90 (610.36) 332.64 2,674.08 36.56 2,579.82
100 = 0.3X + X X = 76.92%
0.3 X = 23.076% $50,000 × 23.076% = $11.538
Total revenue
Total net margin
Department Stores 50 outlets (× $50,000) $2,500 (× 2,938) 146.9 Own shops 10 outlets (× $1,000,000) 10,000 (× $61,036) (610.36) Mail order – post 80,000 × 30% = 24,000 orders (× $150) 3,600 (× $13.86) 332.64 Mail order – telephone 80,000 × 60% = 48,000 orders (× $300) 14,400 (× $55.71) 2,674.08 Mail order – Internet 80,000 × 10% = 8,000 orders (× $100) 800 (× $4.57) $36.56
Activity-Based Costing and Activity-Based Management
52