Embed Size (px)
Citation preview
ANNUAL REPORT 2002
ANN
UAL
REP
OR
T 20
02
SUSTAINABLEGROWTH
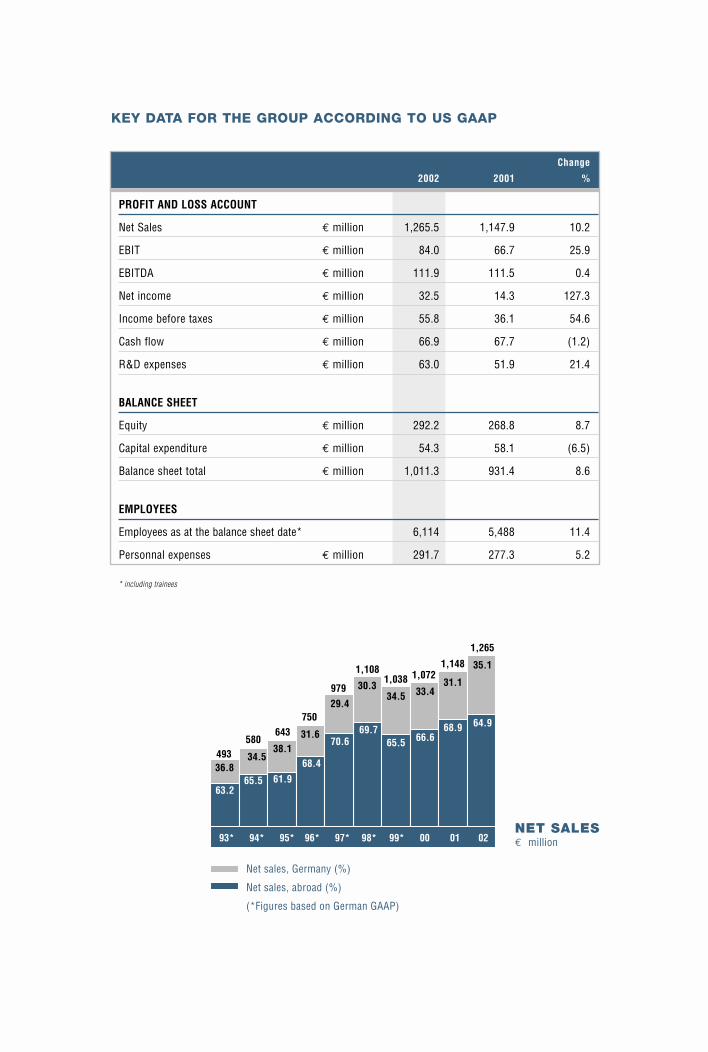
KEY DATA FOR THE GROUP ACCORDING TO US GAAP
Change
2002 2001 %
PROFIT AND LOSS ACCOUNT
Net Sales € million 1,265.5 1,147.9 10.2
EBIT € million 84.0 66.7 25.9
EBITDA € million 111.9 111.5 0.4
Net income € million 32.5 14.3 127.3
Income before taxes € million 55.8 36.1 54.6
Cash flow € million 66.9 67.7 (1.2)
R&D expenses € million 63.0 51.9 21.4
BALANCE SHEET
Equity € million 292.2 268.8 8.7
Capital expenditure € million 54.3 58.1 (6.5)
Balance sheet total € million 1,011.3 931.4 8.6
EMPLOYEES
Employees as at the balance sheet date* 6,114 5,488 11.4
Personnal expenses € million 291.7 277.3 5.2
* including trainees
33.434.530.3
35.1
31.11,0721,038
1,108
1,265
1,148
Net sales, Germany (%)
Net sales, abroad (%)
(*Figures based on German GAAP)
NET SALES € million
66.665.569.7
64.968.9
38.134.5
36.8
29.4
31.6643580
493
979
750
61.965.563.2
70.6
68.4
98 * 99* 00 01 02 93* 94* 95* 96 * 97*
CONTACT
CLAAS KGaA mbHP.O. Box 1163Münsterstrasse 33D-33426 HarsewinkelGermany
www.claas.com
Additional copies of this report and further information aboutCLAAS are available free of charge on request.
PUBLIC/INVESTOR RELATIONS
Tel.: (05247) 12-1743Fax: (05247) 12-1751E-mail: [email protected]
This annual report is available in German and English. Both versions may be downloaded onthe Internet at www.claas.com.
DEFINITIONS
Return on sales = Income before taxes
Net sales
EBIT = Net income + taxes on income + minority interest -/+ income from changes
in accounting principles + interest expense + profit transferred under a partial profit transfer
agreement (CMG) + remuneration participating certificates
EBITDA = EBIT + depreciation of tangible assets + amortization of intangible assets
Return on equity =Net income
Equity
Return on total capital employed =EBIT
Balance sheet total
Cash flow according to DVFA/SG = Net income + depreciation of tangible assets + amortization of intangible assets
+/- changes of pension provisions and other long-term provisions +/-
other expenses/ income without cash flow impact
Equity ratio =Equity
Balance sheet total
First-degree liquidity =Liquidity
Short-term liabilities
Equity to fixed assets ratio =Equity + funds similar to equity + long-term liabilities
Fixed assets
Working capital = Inventories ./. advance payments received +/- accounts receivable/ trade payables +/-
accounts receivable/payable to investments/associates +/- notes receivable/
notes payable
CONCEPT & DESIGN
Kirchhoff Consult AGHamburg, Germany
ANNUAL REPORT 2002
ANN
UAL
REP
OR
T 20
02
SUSTAINABLEGROWTH
KEY DATA FOR THE GROUP ACCORDING TO US GAAP
Change
2002 2001 %
PROFIT AND LOSS ACCOUNT
Net Sales € million 1,265.5 1,147.9 10.2
EBIT € million 84.0 66.7 25.9
EBITDA € million 111.9 111.5 0.4
Net income € million 32.5 14.3 127.3
Income before taxes € million 55.8 36.1 54.6
Cash flow € million 66.9 67.7 (1.2)
R&D expenses € million 63.0 51.9 21.4
BALANCE SHEET
Equity € million 292.2 268.8 8.7
Capital expenditure € million 54.3 58.1 (6.5)
Balance sheet total € million 1,011.3 931.4 8.6
EMPLOYEES
Employees as at the balance sheet date* 6,114 5,488 11.4
Personnal expenses € million 291.7 277.3 5.2
* including trainees
33.434.530.3
35.1
31.11,0721,038
1,108
1,265
1,148
Net sales, Germany (%)
Net sales, abroad (%)
(*Figures based on German GAAP)
NET SALES € million
66.665.569.7
64.968.9
38.134.5
36.8
29.4
31.6643580
493
979
750
61.965.563.2
70.6
68.4
98 * 99* 00 01 02 93* 94* 95* 96 * 97*
CONTACT
CLAAS KGaA mbHP.O. Box 1163Münsterstrasse 33D-33426 HarsewinkelGermany
www.claas.com
Additional copies of this report and further information aboutCLAAS are available free of charge on request.
PUBLIC/INVESTOR RELATIONS
Tel.: (05247) 12-1743Fax: (05247) 12-1751E-mail: [email protected]
This annual report is available in German and English. Both versions may be downloaded onthe Internet at www.claas.com.
DEFINITIONS
Return on sales = Income before taxes
Net sales
EBIT = Net income + taxes on income + minority interest -/+ income from changes
in accounting principles + interest expense + profit transferred under a partial profit transfer
agreement (CMG) + remuneration participating certificates
EBITDA = EBIT + depreciation of tangible assets + amortization of intangible assets
Return on equity =Net income
Equity
Return on total capital employed =EBIT
Balance sheet total
Cash flow according to DVFA/SG = Net income + depreciation of tangible assets + amortization of intangible assets
+/- changes of pension provisions and other long-term provisions +/-
other expenses/ income without cash flow impact
Equity ratio =Equity
Balance sheet total
First-degree liquidity =Liquidity
Short-term liabilities
Equity to fixed assets ratio =Equity + funds similar to equity + long-term liabilities
Fixed assets
Working capital = Inventories ./. advance payments received +/- accounts receivable/ trade payables +/-
accounts receivable/payable to investments/associates +/- notes receivable/
notes payable
CONCEPT & DESIGN
Kirchhoff Consult AGHamburg, Germany
COMBINE HARVESTERS
GREEN HARVEST MACHINERY
FORAGE HARVESTERS
TELESCOPIC LOADERS SPECIAL PRODUCTS
BALERS INDUSTRIAL ENGINEERING/PRODUCTION ENGINEERING
PRODUCT OVERVIEW
7586 48
02 01 02 01
1,0581,162
56
70
02 01 02 01 NET SALES // EBIT€ million
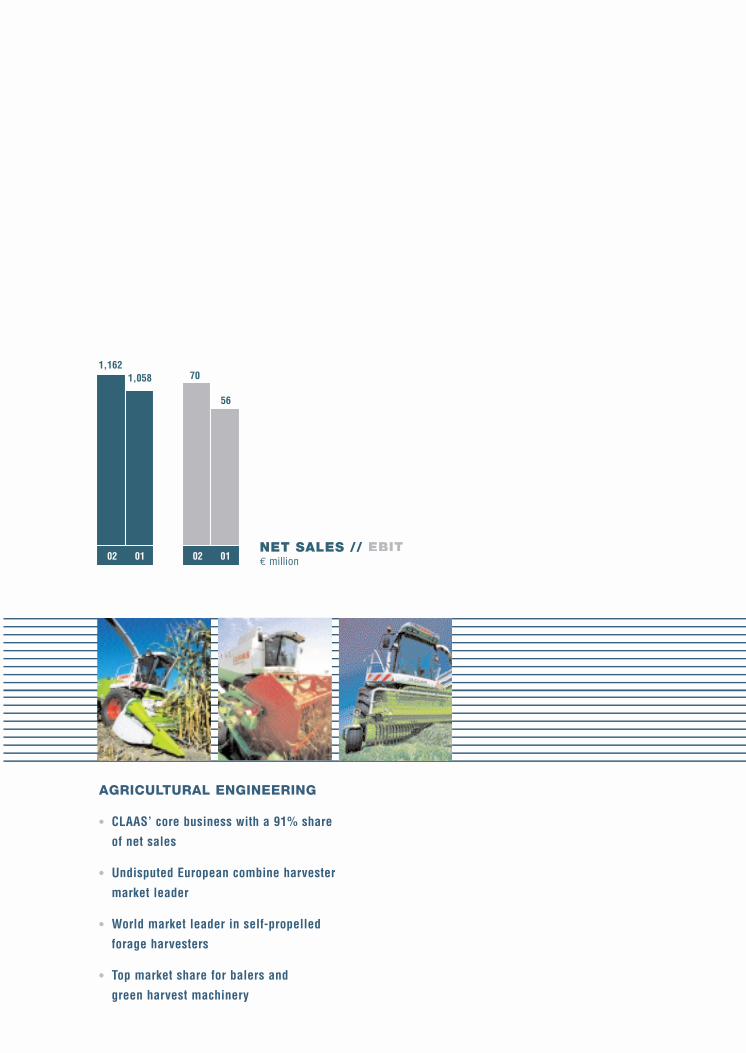
AGRICULTURAL ENGINEERING
• CLAAS’ core business with a 91% share
of net sales
• Undisputed European combine harvester
market leader
• World market leader in self-propelled
forage harvesters
• Top market share for balers and
green harvest machinery
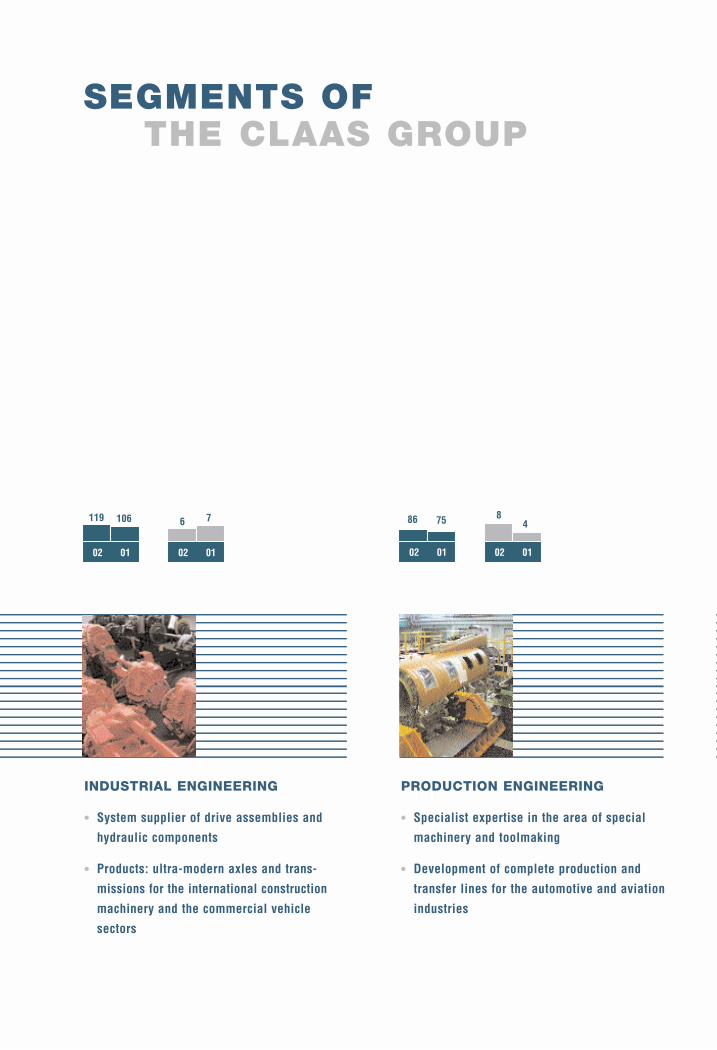
INDUSTRIAL ENGINEERING
• System supplier of drive assemblies and
hydraulic components
• Products: ultra-modern axles and trans-
missions for the international construction
machinery and the commercial vehicle
sectors
SEGMENTS OF THE CLAAS GROUP
PRODUCTION ENGINEERING
• Specialist expertise in the area of special
machinery and toolmaking
• Development of complete production and
transfer lines for the automotive and aviation
industries
106119 76
02 01 02 01
COMBINE HARVESTERS
GREEN HARVEST MACHINERY
FORAGE HARVESTERS
TELESCOPIC LOADERS SPECIAL PRODUCTS
BALERS INDUSTRIAL ENGINEERING/PRODUCTION ENGINEERING
PRODUCT OVERVIEW
7586 48
02 01 02 01
1,0581,162
56
70
02 01 02 01 NET SALES // EBIT€ million
AGRICULTURAL ENGINEERING
• CLAAS’ core business with a 91% share
of net sales
• Undisputed European combine harvester
market leader
• World market leader in self-propelled
forage harvesters
• Top market share for balers and
green harvest machinery
INDUSTRIAL ENGINEERING
• System supplier of drive assemblies and
hydraulic components
• Products: ultra-modern axles and trans-
missions for the international construction
machinery and the commercial vehicle
sectors
SEGMENTS OF THE CLAAS GROUP
PRODUCTION ENGINEERING
• Specialist expertise in the area of special
machinery and toolmaking
• Development of complete production and
transfer lines for the automotive and aviation
industries
106119 76
02 01 02 01
To meet the demand for nutrition and at the same time in order to farm the land in
a sustainable, ecologically and environmentally sound way, the world economy needs
sophisticated agricultural machinery and expert know-how. As the market leader
and technological leader in agricultural machines, CLAAS is regarded as a pioneer of
this forward-looking process. We provide the international agricultural industry with
machines, systems and service support of a quality and technical performance that set
standards. We are not focussed on the single product alone. We regard our machines
and ideas as key elements in the food production process chain.
As a firm committed to economic efficiency, our entrepreneurial role also derives
from the broader social responsibility to ensure people have enough to eat in future.
Our strength lies in our consistency. Consistent change. Sustainable Growth.
2 Report of the Supervisory Board
4 Preface
8 Management
10 CLAAS in the Capital Market
»SUSTAINABLE GROWTH«
16 Market & Positioning
24 Strategy & Value Management
»CORPORATE RESPONSIBILITY«
36 Employees
40 Environment
42 Customers, Business Partners and Investors
44 History
48 Management Report and Consolidated Financial Statements (US GAAP)
(detailed Index on page 47)
102 The CLAAS Group
104 Overview
105 Product overview
The human race is expanding by the hour. Today, there are 6 billion people in
the world; only 20 years from now, the figure will be 8 billion. Feeding the world’s
population is a global and so far unsolved challenge.
In the world’s less developed regions, in particular, major demographic changes
are taking place. Migration from the land and the desire for a better quality of
life are leading to the growth of urbanisation in many developing countries,
with rural areas and farm land being deserted in consequence. In this scenario,
agriculture is the most vital industry in the world.
Professional cultivation of the soil began long before our era. The belief that
an infinite amount of land was available for agriculture has long since been
dispelled. Arable land is limited and has now become a bottleneck factor.
The only way to meet this challenge is by continually increasing efficiency.
»SUSTAINABLE GROWTH«
2 REPORT OF THE SUPERVISORY BOARD
LADIES AND GENTLEMEN,
The Supervisory Board of CLAAS KGaA mbH monitored and analyzed the Group´s business
situation at its regular meetings during fiscal year 2002. The Board´s assessments were
based on reports by the Executive Board on the Group´s strategic orientation, the asset,
financial and income positions and operating decisions. The reports were received at two
sessions and used as a basis for the decisions of the Supervisory Board.
The primary focal points of the Supervisory Board´s deliberations comprised:
Acceptance of the auditors´ reports and auditing of the annual accounts of CLAAS KGaA
mbH and the CLAAS Group and plans for the year 2003, including:
• CLAAS Group product development planning
• Renewal of facilities at the Harsewinkel production site
• Changeover to computer system after SAP R/3
• Implementation of after-sales strategy
• Full takeover of Escorts CLAAS Ltd. (now known as Claas India Ltd.)
• Ending of joint venture with Caterpillar and assumption of complete control of
CATERPILLAR CLAAS AMERICA LLC (now known as CLAAS Omaha LLC)
• Restructuring of US interests, including forming a US intermediate holding company
• Formation of a French intermediate holding company
The Supervisory Board was elected in rotation at the ordinary general meeting in January
2001 for a further statutory term of office and its composition remains unchanged from
last year.
The financial statements of CLAAS KGaA mbH and the consolidated financial statements of
the CLAAS Group as at September 30, 2002 as well as the management reports for CLAAS
KGaA mbH and the Group were audited by Deloitte & Touche GmbH, Düsseldorf, the auditors
elected by the general meeting on January 28, 2002 and appointed by the Supervisory Board,
and received a full audit opinion on November 27 and 28, 2002 respectively.
The auditors´ audit assignment also included the risk management system required by the
Law on Control and Transparency in Business (KonTraG). The audit revealed that the Group´s
risk early warning system meets the statutory requirements.
3
The financial statements of CLAAS KGaA, the consolidated financial statements and manage-
ment reports as well as the proposal for the appropriation of profit were presented to the
Supervisory Board upon completion. These documents as well as the auditors´ reports were
available to the members of the Supervisory Board and were discussed in detail at the
Supervisory Board´s meeting on January 13, 2003 in the presence of the auditor.
Thereupon the Supervisory Board passed the following resolution:
Following an audit of its own, the Supervisory Board agrees with the audit findings. The final
result of the audit by the auditor did not give rise to any objections. The Supervisory Board
therefore recommends to the shareholders that the annual financial statements be approved
as they stand and agrees with the proposal for appropriation of income made by the
Executive Board of the personally liable partner.
The Supervisory Board welcomes the orientation of corporate management to corporate
responsibility and the accompanying corporate governance, which brings economically
efficient operating into accord with environmental and social responsibility.
The Supervisory Board would like to thank the Executive Board and all the employees for
their commitment during the past fiscal year. Despite the general slowdown of the economy,
close cooperation between the Supervisory Board, the Shareholders´ Committee, the Execu-
tive Board and the employees made it possible to achieve a commendable result which is
once again higher than that of the previous year.
Harsewinkel, January 13, 2003
The Supervisory Board
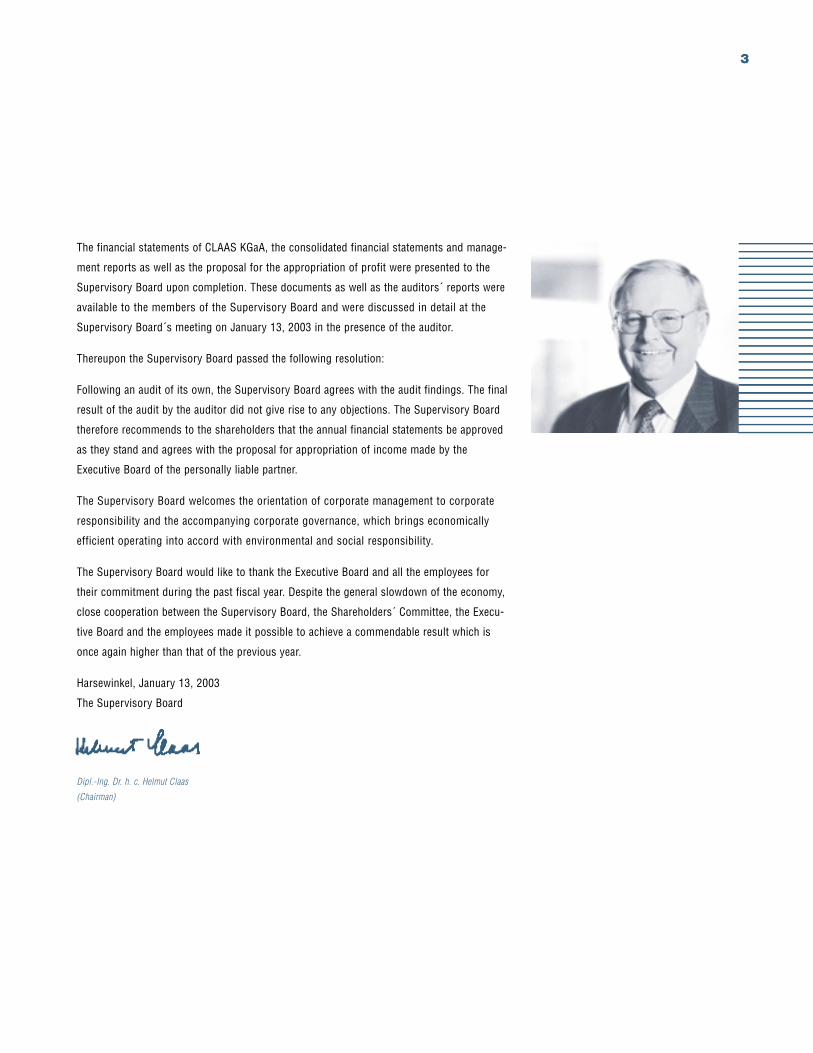
Dipl.-Ing. Dr. h. c. Helmut Claas
(Chairman)
4 PREFACE
LADIES AND GENTLEMAN,
Profitable growth has been our strategy for many years. In the last ten years alone, CLAAS
has grown by around 8% annually on average, very much by our own efforts. We have im-
proved our results consistently and continued to operate profitably, even in less good years.
Profitability has improved notably during the year under review, with an increase greater than
sales growth. Claas operates in heavily cyclical markets. Our strength lies in consistency.
Last year´s report was headed »Consistant change«. The motto for the 2002 annual report
is »Sustainable growth«. These guiding principles describe the past and are at the same
time our messages for the future.
During the year under review we have again remained on a global growth course and have
exploited our market opportunities by developing our core business and opening up new
growth areas. Sales and profit are both up and are in accordance with our planning targets.
We have boosted last year´s record sales by 10% to € 1.265 billion and improved the result
before taxes by almost 55% to € 55.8 million. This is all the more remarkable in view of the
significant outlay during the year under review on research and development, information
technology and our production facilities.
On the one hand, this growth reflects a renewal of propensity to invest in agriculture world-
wide. On the other, we are benefiting from the continuing trend in agriculture for large
machinery. Our main product, the combine harvester, has once again enabled us to achieve
satisfactory growth in important markets. Our already large market share in Germany has
risen to over 47% and in Western Europe to 37%. We are thus the top performer in Europe
and Number Three in the world market. We are the world market leader in self-propelled
forage harvesters, with a market share of around 50%.
5
Prospects for our products are good. Markets in Western Europe, Central and Eastern
Europe, North and South America and Asia continue to present big opportunities. On our
West European home market, our market shares still contain some growth potential. In the
countries of Central and Eastern Europe and the CIS, the potential is big. This region is set
to grow in the medium term on the same scale as Western Europe or North America in
terms of agricultural engineering. In the USA, our powerful combine harvesters are just
starting to prove their potential within this market. Our presence in the Indian subcontinent
is an important pillar for Asia generally. South America offers opportunities in the medium
and long term, which we will develop.
As an independent family business, we defend our competitive position against other global
players and intend to develop it. This is a challenge we have consistently set ourselves and
we will continue to do so. At a time when most companies are tending towards reticence,
we have embarked upon a major investment strategy unequalled in the Group´s history.
The production facilities at Harsewinkel are set to become one of the world’s most modern
combine harvester factories, the flagship of our global production network. We have also
redesigned and further optimized our green harvest machinery plant at Bad Saulgau. In the
USA, we have taken over the 50% share in CATERPILLAR CLAAS AMERICA and are now run-
ning the distribution and production facilities for our LEXION combine harvester on our own.
We have now also assumed full control of our rice harvester factory in India. We are looking
for more production locations of our own in Eastern Europe, in order to incorporate local
value added into our production network. Our operations and procedures are being stream-
lined for even greater efficiency. Changeover of our information system to SAP R/3, which
has demanded a great deal of extra administrative and financial effort, was successfully
implemented at the Harsewinkel and Hamm sites in 2002 and will be completed throughout
the CLAAS Group in 2003.
6 PREFACE
We do not invest in »iron and steel« alone, however, but also in people and knowledge.
Information technology is the key to a sustainable, economically efficient way of operating
in agriculture. This requires a high degree of modern know-how as well as technical and
economic skills. During the year under review we have spent record sums on research and
development, new products and employee further training. Our research and development
budget has been increased by almost 40% in the last two years. Expenditure on staff training
and development is well above average for the industry. The role of the CLAAS Academy,
as a knowledge transfer platform, is to ensure a continuing excellent standard of advice
and service in connection with CLAAS products.
Our strength derives from our consistency. This is a hallmark of our corporate culture. In the
international economic system, we embody the soundness of the »old economy«, which has
proved more enduring than the world of start-ups. In the Claas family, this firm has private
lenders who personally identify with the business and the people that make it work. This
provides a positive background for our process of opening up to the international financial
community. We use value-oriented control systems and operate a method of financial report-
ing that meets the demands of international financial analysts. Towards the end of 2002
we successfully carried our a private placement transaction in the USA. Besides our own
distribution network and production facilities, we have thus established a financial footing
in the USA and broadened our international financing base.
The acquisition of Brötje Automation has considerably strengthened CLAAS Fertigungstechnik
at the close of 2002. Brötje Automation is the market leader in connection and assembly
technology for the aircraft industry. The takeover is a further milestone on a successful
path for our subsidiary, which specialises in complex production lines.
7
CLAAS will continue to grow significantly during the new financial year and lastingly strengthen
its profitability. Continuous value increases all along the process chain are part of our cor-
porate philosophy. Corporate responsibility and the accompanying corporate governance are
key components of our corporate management. This comprises a constant search for ways
of marrying good financial performance with environmental and social responsibility, as a
basis for giving equal respect to human needs and protecting the environment. A separate
chapter of this report is devoted to this topic.
We would like to thank our employees for their hard work and commitment, their skills and
their willingness to join with us and help to shape the necessary changes. We also extend
our thanks to our customers, dealers and importers, suppliers and other business partners,
whose continued confidence is the foundation of our work. Special thanks are due to our
shareholders and their committees for their constructive input during the year. Safeguarding
their firm´s independence is our primary task.
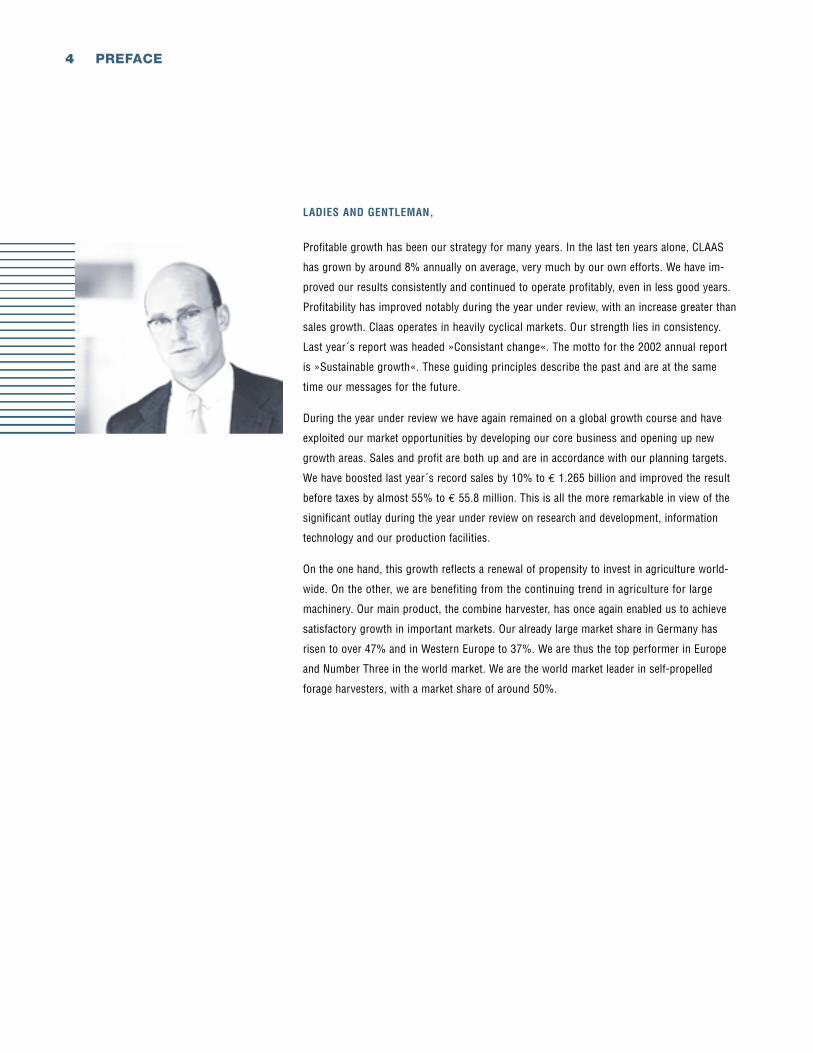
RÜDIGER A. GÜNTHER
8 MANAGEMENT
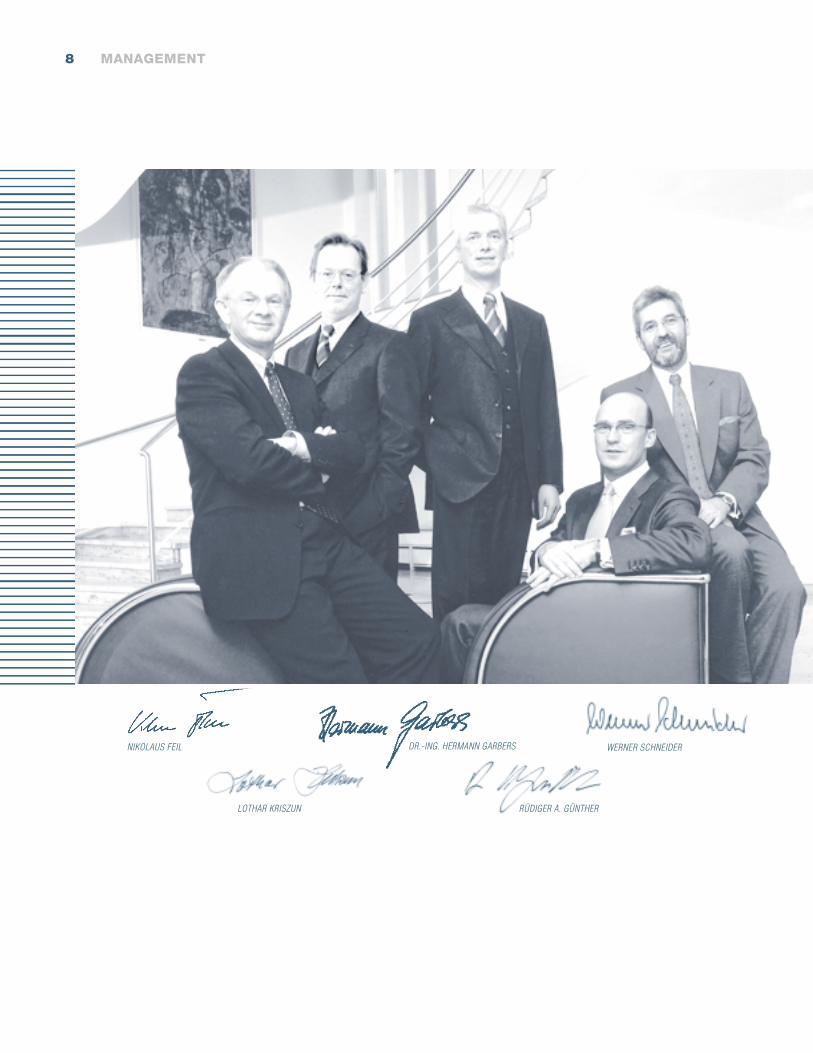
DR.-ING. HERMANN GARBERS NIKOLAUS FEIL
RÜDIGER A. GÜNTHER LOTHAR KRISZUN
WERNER SCHNEIDER
9
NIKOLAUS FEIL // PRODUCTION
Born 1958, Business graduate, international career with an American investment bank, Finance Manager of one of theworld´s leading trading groups. Director of Finance/Controlling at CLAAS since 1993, Managing Director since 1997,spokesman of the management board since 2002.
RÜDIGER A. GÜNTHER // SPOKESMAN OF THE MANAGEMENT BOARDFINANCE AND CONTROLLING/MERGERS & ACQUISITIONS
Born 1952, Business administration graduate. He has held various positions in the CLAAS group since 1981, including Headof the Business Administration division, Commercial Manager of Westfälische Werke, Managing Director of CLAAS-Fertigungs-technik, and most recently spokesman of the management board of CSE. Managing Director for Sales and Services of theCLAAS Group since October 2002.
LOTHAR KRISZUN // SALES/MARKETING
Born 1951, held research and teaching posts at Braunschweig Technical University (Agricultural Machinery Institute), Develop-ment Manager for combine harvesters, self-propelled forage harvesters and tractors, R & D Manager at CLAAS since 1999.
Born 1944, Engineering graduate, Factory Manager at an automotive group’s central plant, developed an automotive plant in South America, in charge of Production at all CLAAS factories since 2000, Managing Director at CLAAS since 2000.
DR.-ING. HERMANN GARBERS // RESEARCH AND DEVELOPMENT/IT
»The leading technology of CLAAS products offers our customers proven performance and cost advantages.
We thereby utilize state-of-the-art information technology to further network machines and systems, thus
opening up new opportunities for process optimization.«
»Efficiency, speed and flexibility in the manufacture of highly complex products are the decisive factors
in beating global competition in the future. The new structure of the CLAAS production processes has pre-
pared the company very well to meet this challenge.«
»CLAAS is at home in fields throughout the world. Attractive products and services are core success factors
in our clients´ companies, thanks to competent distribution. Individual consultation, comprehensive infor-
mation, customized financing and a complete range of services make it easy to choose CLAAS.«
»We will maintain our competitive ability and leading position only if we ensure continuous profitable
growth. The closeness of our international, yet family-run, company to the partners guarantees our
independence and the capability of making fast decisions in the process of global competition.«
Born 1949, Economics graduate. He has held various positions in human resources management in international corpora-tions in the metal, retail and logistics industries. Most recently he was the Director of Corporate Human Resources at aninternational logistics company in The Netherlands, Managing Director at CLAAS since June 2002.
WERNER SCHNEIDER // HUMAN RESOURCES
»We must promote the competence and expertise of our staff members for their work in the international
arena. We need well-educated, cosmopolitan employees. For this reason we recruit young staff throughout
the world. Then, after proper preparation, each individual is given the opportunity for an interesting
professional career.«
10 CLAAS IN THE CAPITAL MARKET
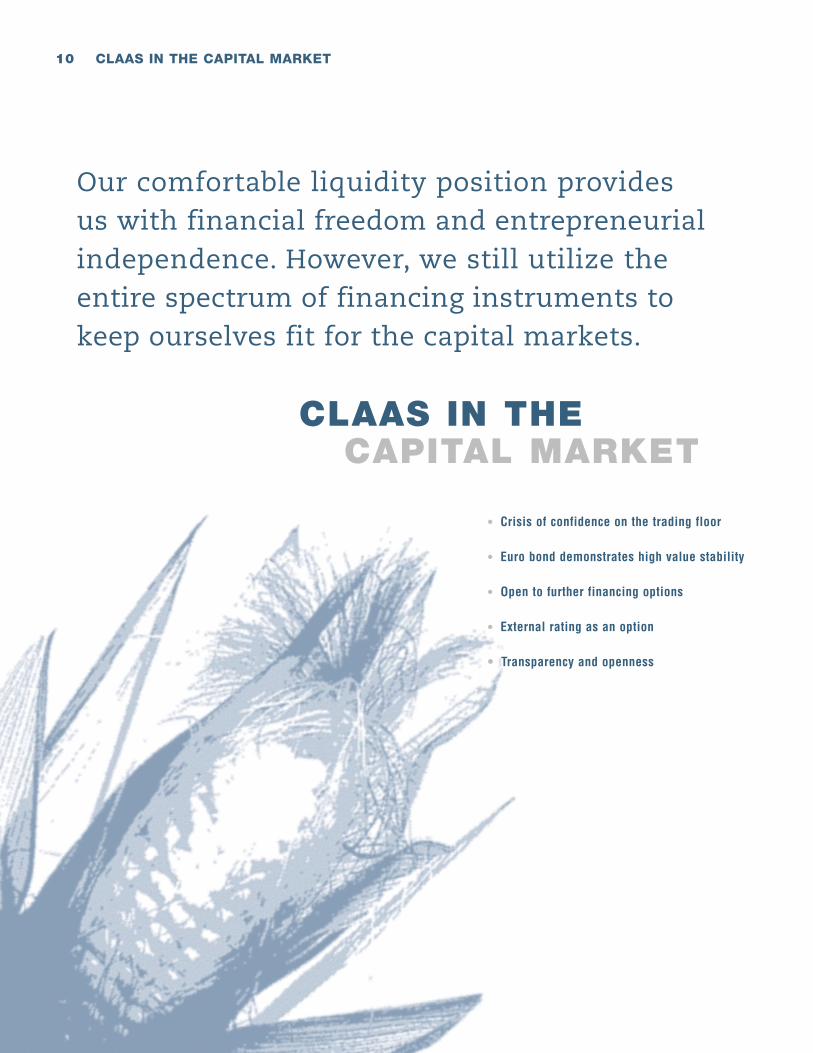
Our comfortable liquidity position provides us with financial freedom and entrepreneurialindependence. However, we still utilize theentire spectrum of financing instruments tokeep ourselves fit for the capital markets.
• Crisis of confidence on the trading floor
• Euro bond demonstrates high value stability
• Open to further financing options
• External rating as an option
• Transparency and openness
CLAAS IN THE CAPITAL MARKET
11
PARADIGM CHANGE IN THE CAPITAL MARKET
Developments in the capital markets in 2002 were not at all positive. The nosedive of the
stock markets after the terrorist attacks in the United States in September 2001 continued
without a break during 2002. Triggered by the sharp downturn of the American economy,
in whose wake the economies of Europe and Asia wobbled to the edge of a recession, accom-
panied by balance sheet manipulations of large American companies and unnerved by
spectacular bankruptcies, investors fled from equities investments. In an environment of
drastic price drops, industrial loans were also affected. The already high risk surcharges in
this market segment rose significantly once again.
The crisis in the capital markets has led the investors to a noticeable re-orientation. The
euphoria of the late nineties has turned into a hangover. A new sobriety has taken hold of
the stock markets. The focus is once again on stable securities. Dividend-oriented securities
which can be detached from price falls are experiencing a renaissance. Today more than ever,
investors demand high standards of transparency and seriosity in reporting as well as con-
centration on successful business models.
CONSTANCY IN CAPITAL MARKET ORIENTATION
Unimpressed by the current trends of the past several years, CLAAS has continued to orient
itself consistently to the capital markets. The latest turbulence in the markets has not led to a
strategic re-orientation, but rather reaffirms the path the company has continuously pursued.
Our goals of a differentiation and internationalization of the financing profile and an expansion
of the liabilities duration have proved to be trailblazing in view of the current market situation.
Many companies which are only now positioning themselves have found out that their entry
into the capital market must be prepared long beforehand. In this market environment,
we benefit decisively from the strength of a family-run company, whose capital providers
support the continuous adaptation to market conditions without the necessity for hectic
repositioning.
12 CLAAS IN THE CAPITAL MARKET
OPEN TO FURTHER OPTIONS
Thanks to capital market transactions such as bond issues and loan syndication as well as
bilateral credit lines from banks and insurance companies, CLAAS has respectable funding
commitments of more than € 500 million. With the successful private placement in the United
States, we have further strengthened CLAAS´ financing base and simultaneously expanded
our investor base. We continue to keep additional financing options open. Our strategy is not
one of lopsided optimization of an equity story. We have always paid particular attention to
sound risk management and stable relationships with creditors. International investors value
a neutral benchmark in the evaluation of their investment decisions. An external credit rating
is even more important now that the requirements of Basel II have been implemented. Our
options include obtaining an external rating in the short term. For this reason we are inten-
sively reviewing the implications of the rating process.
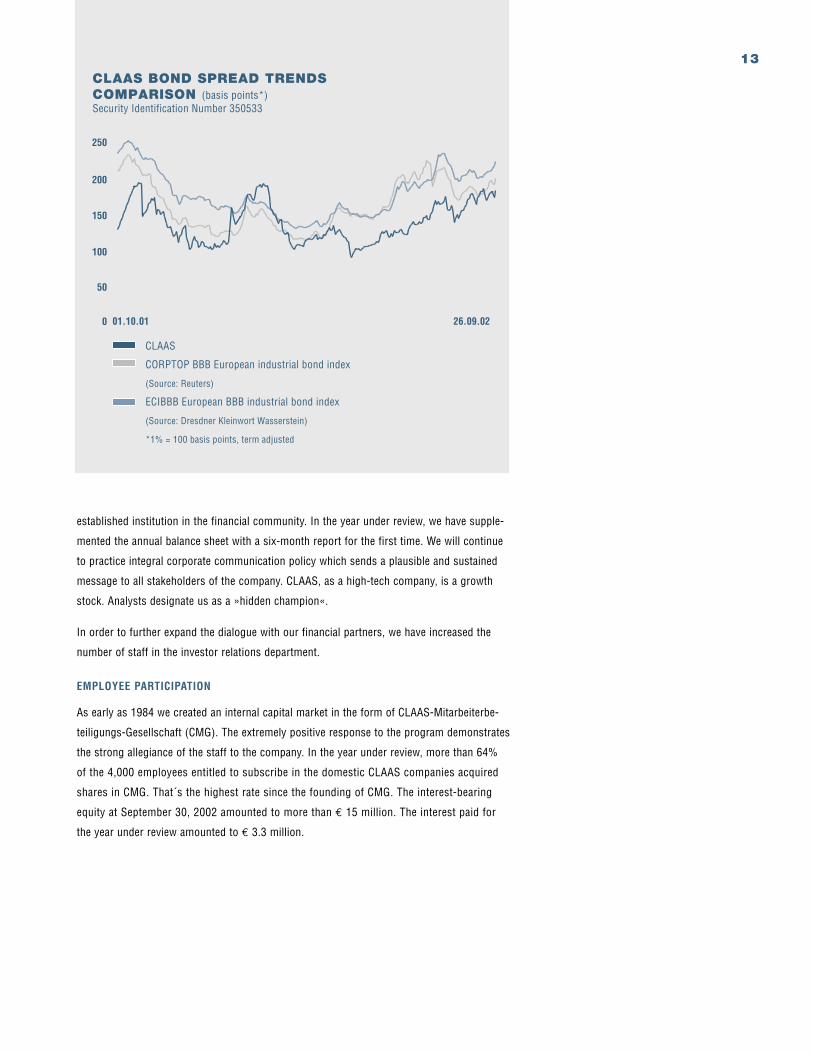
HIGH VALUE STABILITY OF THE CLAAS EURO BONDS
The euro bond we issued for a nominal value of € 100 million in 1999 to take advantage of
the historically low interest rate has held its own in the turbulent environment. The increase
in the credit spread was moderate compared to the rest of the industry and confirms the
value stability of the CLAAS bond. This development is viewed increasingly positively by
retail investors as well. With comparatively low credit spread swings and an issue price
under par, the CLAAS bond is an attractive form of investment for private investors as well.
DIALOGUE WITH FINANCIAL PARTNERS
CLAAS is not listed on the stock exchange with equity, but behaves in its financial com-
munications like a listed company. In the legal form of a corporation, we take the dialogue
with the financial community seriously and see a genuine comparative advantage therein.
We completely fulfill requirements of the international capital markets for transparency and
comparable real-time information. Our external and internal accounting adheres to interna-
tional standards. For the first time in fiscal year 2001, the Group balance sheet was drawn
up and published in accordance with US GAAP with a discharging effect. For 26 years we
have published extensive financial statements which set standards in transparency, openness
and creativity. The annual report is the company´s calling card. Every year we explain it to
the interested public in a balance sheet press conference. Beforehand, we inform the repre-
sentatives of our financial partners from all over the world about our balance sheet and our
strategy at a conference especially for them. In the meantime, the forum has become an
13
established institution in the financial community. In the year under review, we have supple-
mented the annual balance sheet with a six-month report for the first time. We will continue
to practice integral corporate communication policy which sends a plausible and sustained
message to all stakeholders of the company. CLAAS, as a high-tech company, is a growth
stock. Analysts designate us as a »hidden champion«.
In order to further expand the dialogue with our financial partners, we have increased the
number of staff in the investor relations department.
EMPLOYEE PARTICIPATION
As early as 1984 we created an internal capital market in the form of CLAAS-Mitarbeiterbe-
teiligungs-Gesellschaft (CMG). The extremely positive response to the program demonstrates
the strong allegiance of the staff to the company. In the year under review, more than 64%
of the 4,000 employees entitled to subscribe in the domestic CLAAS companies acquired
shares in CMG. That´s the highest rate since the founding of CMG. The interest-bearing
equity at September 30, 2002 amounted to more than € 15 million. The interest paid for
the year under review amounted to € 3.3 million.
CLAAS BOND SPREAD TRENDS COMPARISON (basis points*)Security Identification Number 350533
CLAAS
CORPTOP BBB European industrial bond index
(Source: Reuters)
ECIBBB European BBB industrial bond index
(Source: Dresdner Kleinwort Wasserstein)
*1% = 100 basis points, term adjusted
01.10.010
50
100
150
200
250
26.09.02
.. .. .. .. .. .. .. .. .. .. .. .. .. .. .. .. .. .. .. .. .. .. .. .. .. .. .. .. .. .. .. .. .. .. .. .. .. .. .. .. .. .. .. .. .. .. .. .. .. .. .. .. .. .. .. .. .. .. .. .. .. .. .. .. .. .. .. . .. .. .. .. .. .. .. .. .. .. .. .. .. .. .. .. .. .. .. .. .. .. .. .. .. .. .. .. .. .. .. .. .. .. .. .. .. .. .. .. .. .. .. .. .. .. .. .. .. .. .. .. .. .. .. .. .. .. .. .. .. .. .. .. .. .. .. . .. .. .. .. .. .. .. .. .. .. .. .. .. .. .. .. .. .. .. .. .. .. .. .. .. .. .. .. .. .. .. .. .. .. .. .. .. .. .. .. .. .. .. .. .. .. .. .. .. .. .. .. .. .. .. .. .. .. .. .. .. .. .. .. .. .. .. . .. .. .. .. .. .. .. .. .. .. .. .. .. .. .. .. .. .. .. .. .. .. .. .. .. .. .. .. .. .. .. .. .. .. .. .. .. .. .. .. .. .. .. .. .. .. .. .. .. .. .. .. .. .. .. .. .. .. .. .. .. .. .. .. .. .. .. . .. .. .. .. .. .. .. .. .. .. .. .. .. .. .. .. .. .. .. .. .. .. .. .. .. .. .. .. .. .. .. .. .. .. .. .. .. .. .. .. .. .. .. .. .. .. .. .. .. .. .. .. .. .. .. .. .. .. .. .. .. .. .. .. .. .. .. . .. .. .. .. .. .. .. .. .. .. .. .. .. .. .. .. .. .. .. .. .. .. .. .. .. .. .. .. .. .. .. .. .. .. .. .. .. .. .. .. .. .. .. .. .. .. .. .. .. .. .. .. .. .. .. .. .. .. .. .. .. .. .. .. .. .. .. . .. .. .. .. .. .. .. .. .. .. .. .. .. .. .. .. .. .. .. .. .. .. .. .. .. .. .. .. .. .. .. .. .. .. .. .. .. .. .. .. .. .. .. .. .. .. .. .. .. .. .. .. .. .. .. .. .. .. .. .. .. .. .. .. .. .. .. . .. .. .. .. .. .. .. .. .. .. .. .. .. .. .. .. .. .. .. .. .. .. .. .. .. .. .. .. .. .. .. .. .. .. .. .. .. .. .. .. .. .. .. .. .. .. .. .. .. .. .. .. .. .. .. .. .. .. .. .. .. .. .. .. .. .. .. . .. .. .. .. .. .. .. .. .. .. .. .. .. .. .. .. .. .. .. .. .. .. .. .. .. .. .. .. .. .. .. .. .. .. .. .. .. .. .. .. .. .. .. .. .. .. .. .. .. .. .. .. .. .. .. .. .. .. .. .. .. .. .. .. .. .. .. . .. .. .. .. .. .. .. .. .. .. .. .. .. .. .. .. .. .. .. .. .. .. .. .. .. .. .. .. .. .. .. .. .. .. .. .. .. .. .. .. .. .. .. .. .. .. .. .. .. .. .. .. .. .. .. .. .. .. .. .. .. .. .. .. .. .. .. . .. .. .. .. .. .. .. .. .. .. .. .. .. .. .. .. .. .. .. .. .. .. .. .. .. .. .. .. .. .. .. .. .. .. .. .. .. .. .. .. .. .. .. .. .. .. .. .. .. .. .. .. .. .. .. .. .. .. .. .. .. .. .. .. .. .. .. . .. .. .. .. .. .. .. .. .. .. .. .. .. .. .. .. .. .. .. .. .. .. .. .. .. .. .. .. .. .. .. .. .. .. .. .. .. .. .. .. .. .. .. .. .. .. .. .. .. .. .. .. .. .. .. .. .. .. .. .. .. .. .. .. .. .. .. . .. .. .. .. .. .. .. .. .. .. .. .. .. .. .. .. .. .. .. .. .. .. .. .. .. .. .. .. .. .. .. .. .. .. .. .. .. .. .. .. .. .. .. .. .. .. .. .. .. .. .. .. .. .. .. .. .. .. .. .. .. .. .. .. .. .. .. . .. .. .. .. .. .. .. .. .. .. .. .. .. .. .. .. .. .. .. .. .. .. .. .. .. .. .. .. .. .. .. .. .. .. .. .. .. .. .. .. .. .. .. .. .. .. .. .. .. .. .. .. .. .. .. .. .. .. .. .. .. .. .. .. .. .. .. . .. .. .. .. .. .. .. .. .. .. .. .. .. .. .. .. .. .. .. .. .. .. .. .. .. .. .. .. .. .. .. .. .. .. .. .. .. .. .. .. .. .. .. .. .. .. .. .. .. .. .. .. .. .. .. .. .. .. .. .. .. .. .. .. .. .. .. . .. .. .. .. .. .. .. .. .. .. .. .. .. .. .. .. .. .. .. .. .. .. .. .. .. .. .. .. .. .. .. .. .. .. .. .. .. .. .. .. .. .. .. .. .. .. .. .. .. .. .. .. .. .. .. .. .. .. .. .. .. .. .. .. .. .. .. . .. .. .. .. .. .. .. .. .. .. .. .. .. .. .. .. .. .. .. .. .. .. .. .. .. .. .. .. .. .. .. .. .. .. .. .. .. .. .. .. .. .. .. .. .. .. .. .. .. .. .. .. .. .. .. .. .. .. .. .. .. .. .. .. .. .. .. . .. .. .. .. .. .. .. .. .. .. .. .. .. .. .. .. .. .. .. .. .. .. .. .. .. .. .. .. .. .. .. .. .. .. .. .. .. .. .. .. .. .. .. .. .. .. .. .. .. .. .. .. .. .. .. .. .. .. .. .. .. .. .. .. .. .. .. . .. .. .. .. .. .. .. .. .. .. .. .. .. .. .. .. .. .. .. .. .. .. .. .. .. .. .. .. .. .. .. .. .. .. .. .. .. .. .. .. .. .. .. .. .. .. .. .. .. .. .. .. .. .. .. .. .. .. .. .. .. .. .. .. .. .. .. . .. .. .. .. .. .. .. .. .. .. .. .. .. .. .. .. .. .. .. .. .. .. .. .. .. .. .. .. .. .. .. .. .. .. .. .. .. .. .. .. .. .. .. .. .. .. .. .. .. .. .. .. .. .. .. .. .. .. .. .. .. .. .. .. .. .. .. . .. .. .. .. .. .. .. .. .. .. .. .. .. .. .. .. .. .. .. .. .. .. .. .. .. .. .. .. .. .. .. .. .. .. .. .. .. .. .. .. .. .. .. .. .. .. .. .. .. .. .. .. .. .. .. .. .. .. .. .. .. .. .. .. .. .. .. . .. .. .. .. .. .. .. .. .. .. .. .. .. .. .. .. .. .. .. .. .. .. .. .. .. .. .. .. .. .. .. .. .. .. .. .. .. .. .. .. .. .. .. .. .. .. .. .. .. .. .. .. .. .. .. .. .. .. .. .. .. .. .. .. .. .. .. . .. .. .. .. .. .. .. .. .. .. .. .. .. .. .. .. .. .. .. .. .. .. .. .. .. .. .. .. .. .. .. .. .. .. .. .. .. .. .. .. .. .. .. .. .. .. .. .. .. .. .. .. .. .. .. .. .. .. .. .. .. .. .. .. .. .. .. . .. .. .. .. .. .. .. .. .. .. .. .. .. .. .. .. .. .. .. .. .. .. .. .. .. .. .. .. .. .. .. .. .. .. .. .. .. .. .. .. .. .. .. .. .. .. .. .. .. .. .. .. .. .. .. .. .. .. .. .. .. .. .. .. .. .. .. . .. .. .. .. .. .. .. .. .. .. .. .. .. .. .. .. .. .. .. .. .. .. .. .. .. .. .. .. .. .. .. .. .. .. .. .. .. .. .. .. .. .. .. .. .. .. .. .. .. .. .. .. .. .. .. .. .. .. .. .. .. .. .. .. .. .. .. . .. .. .. .. .. .. .. .. .. .. .. .. .. .. .. .. .. .. .. .. .. .. .. .. .. .. .. .. .. .. .. .. .. .. .. .. .. .. .. .. .. .. .. .. .. .. .. .. .. .. .. .. .. .. .. .. .. .. .. .. .. .. .. .. .. .. .. . .. .. .. .. .. .. .. .. .. .. .. .. .. .. .. .. .. .. .. .. .. .. .. .. .. .. .. .. .. .. .. .. .. .. .. .. .. .. .. .. .. .. .. .. .. .. .. .. .. .. .. .. .. .. .. .. .. .. .. .. .. .. .. .. .. .. .. . .. .. .. .. .. .. .. .. .. .. .. .. .. .. .. .. .. .. .. .. .. .. .. .. .. .. .. .. .. .. .. .. .. .. .. .. .. .. .. .. .. .. .. .. .. .. .. .. .. .. .. .. .. .. .. .. .. .. .. .. .. .. .. .. .. .. .. . .. .. .. .. .. .. .. .. .. .. .. .. .. .. .. .. .. .. .. .. .. .. .. .. .. .. .. .. .. .. .. .. .. .. .. .. .. .. .. .. .. .. .. .. .. .. .. .. .. .. .. .. .. .. .. .. .. .. .. .. .. .. .. .. .. .. .. . .. .. .. .. .. .. .. .. .. .. .. .. .. .. .. .. .. .. .. .. .. .. .. .. .. .. .. .. .. .. .. .. .. .. .. .. .. .. .. .. .. .. .. .. .. .. .. .. .. .. .. .. .. .. .. .. .. .. .. .. .. .. .. .. .. .. .. . .. .. .. .. .. .. .. .. .. .. .. .. .. .. .. .. .. .. .. .. .. .. .. .. .. .. .. .. .. .. .. .. .. .. .. .. .. .. .. .. .. .. .. .. .. .. .. .. .. .. .. .. .. .. .. .. .. .. .. .. .. .. .. .. .. .. .. . .. .. .. .. .. .. .. .. .. .. .. .. .. .. .. .. .. .. .. .. .. .. .. .. .. .. .. .. .. .. .. .. .. .. .. .. .. .. .. .. .. .. .. .. .. .. .. .. .. .. .. .. .. .. .. .. .. .. .. .. .. .. .. .. .. .. .. . .. .. .. .. .. .. .. .. .. .. .. .. .. .. .. .. .. .. .. .. .. .. .. .. .. .. .. .. .. .. .. .. .. .. .. .. .. .. .. .. .. .. .. .. .. .. .. .. .. .. .. .. .. .. .. .. .. .. .. .. .. .. .. .. .. .. .. . .. .. .. .. .. .. .. .. .. .. .. .. .. .. .. .. .. .. .. .. .. .. .. .. .. .. .. .. .. .. .. .. .. .. .. .. .. .. .. .. .. .. .. .. .. .. .. .. .. .. .. .. .. .. .. .. .. .. .. .. .. .. .. .. .. .. .. .
14
.. .. .. .. .. .. .. .. .. .. .. .. .. .. .. .. .. .. .. .. .. .. .. .. .. .. .. .. .. .. .. .. .. . .. .. .. .. .. .. .. .. .. .. .. .. .. .. .. .. .. .. .. .. .. .. .. .. .. .. .. .. .. .. .. .. .. .. .. .. .. .. .. .. .. .. .. .. .. .. .. .. .. .. .. .. .. .. .. .. .. .. .. .. .. .. .. .. .. .. .. . .. .. .. .. .. .. .. .. .. .. .. .. .. .. .. .. .. .. .. .. .. .. .. .. .. .. .. .. .. .. .. .. .. .. .. .. .. .. .. .. .. .. .. .. .. .. .. .. .. .. .. .. .. .. .. .. .. .. .. .. .. .. .. .. .. .. .. . .. .. .. .. .. .. .. .. .. .. .. .. .. .. .. .. .. .. .. .. .. .. .. .. .. .. .. .. .. .. .. .. .. .. .. .. .. .. .. .. .. .. .. .. .. .. .. .. .. .. .. .. .. .. .. .. .. .. .. .. .. .. .. .. .. .. .. . .. .. .. .. .. .. .. .. .. .. .. .. .. .. .. .. .. .. .. .. .. .. .. .. .. .. .. .. .. .. .. .. .. .. .. .. .. .. .. .. .. .. .. .. .. .. .. .. .. .. .. .. .. .. .. .. .. .. .. .. .. .. .. .. .. .. .. . .. .. .. .. .. .. .. .. .. .. .. .. .. .. .. .. .. .. .. .. .. .. .. .. .. .. .. .. .. .. .. .. .. .. .. .. .. .. .. .. .. .. .. .. .. .. .. .. .. .. .. .. .. .. .. .. .. .. .. .. .. .. .. .. .. .. .. . .. .. .. .. .. .. .. .. .. .. .. .. .. .. .. .. .. .. .. .. .. .. .. .. .. .. .. .. .. .. .. .. .. .. .. .. .. .. .. .. .. .. .. .. .. .. .. .. .. .. .. .. .. .. .. .. .. .. .. .. .. .. .. .. .. .. .. . .. .. .. .. .. .. .. .. .. .. .. .. .. .. .. .. .. .. .. .. .. .. .. .. .. .. .. .. .. .. .. .. .. .. .. .. .. .. .. .. .. .. .. .. .. .. .. .. .. .. .. .. .. .. .. .. .. .. .. .. .. .. .. .. .. .. .. . .. .. .. .. .. .. .. .. .. .. .. .. .. .. .. .. .. .. .. .. .. .. .. .. .. .. .. .. .. .. .. .. .. .. .. .. .. .. .. .. .. .. .. .. .. .. .. .. .. .. .. .. .. .. .. .. .. .. .. .. .. .. .. .. .. .. .. . .. .. .. .. .. .. .. .. .. .. .. .. .. .. .. .. .. .. .. .. .. .. .. .. .. .. .. .. .. .. .. .. .. .. .. .. .. .. .. .. .. .. .. .. .. .. .. .. .. .. .. .. .. .. .. .. .. .. .. .. .. .. .. .. .. .. .. . .. .. .. .. .. .. .. .. .. .. .. .. .. .. .. .. .. .. .. .. .. .. .. .. .. .. .. .. .. .. .. .. .. .. .. .. .. .. .. .. .. .. .. .. .. .. .. .. .. .. .. .. .. .. .. .. .. .. .. .. .. .. .. .. .. .. .. . .. .. .. .. .. .. .. .. .. .. .. .. .. .. .. .. .. .. .. .. .. .. .. .. .. .. .. .. .. .. .. .. .. .. .. .. .. .. .. .. .. .. .. .. .. .. .. .. .. .. .. .. .. .. .. .. .. .. .. .. .. .. .. .. .. .. .. . .. .. .. .. .. .. .. .. .. .. .. .. .. .. .. .. .. .. .. .. .. .. .. .. .. .. .. .. .. .. .. .. .. .. .. .. .. .. .. .. .. .. .. .. .. .. .. .. .. .. .. .. .. .. .. .. .. .. .. .. .. .. .. .. .. .. .. . .. .. .. .. .. .. .. .. .. .. .. .. .. .. .. .. .. .. .. .. .. .. .. .. .. .. .. .. .. .. .. .. .. .. .. .. .. .. .. .. .. .. .. .. .. .. .. .. .. .. .. .. .. .. .. .. .. .. .. .. .. .. .. .. .. .. .. . .. .. .. .. .. .. .. .. .. .. .. .. .. .. .. .. .. .. .. .. .. .. .. .. .. .. .. .. .. .. .. .. .. .. .. .. .. .. .. .. .. .. .. .. .. .. .. .. .. .. .. .. .. .. .. .. .. .. .. .. .. .. .. .. .. .. .. . .. .. .. .. .. .. .. .. .. .. .. .. .. .. .. .. .. .. .. .. .. .. .. .. .. .. .. .. .. .. .. .. .. .. .. .. .. .. .. .. .. .. .. .. .. .. .. .. .. .. .. .. .. .. .. .. .. .. .. .. .. .. .. .. .. .. .. . .. .. .. .. .. .. .. .. .. .. .. .. .. .. .. .. .. .. .. .. .. .. .. .. .. .. .. .. .. .. .. .. .. .. .. .. .. .. .. .. .. .. .. .. .. .. .. .. .. .. .. .. .. .. .. .. .. .. .. .. .. .. .. .. .. .. .. . .. .. .. .. .. .. .. .. .. .. .. .. .. .. .. .. .. .. .. .. .. .. .. .. .. .. .. .. .. .. .. .. .. .. .. .. .. .. .. .. .. .. .. .. .. .. .. .. .. .. .. .. .. .. .. .. .. .. .. .. .. .. .. .. .. .. .. . .. .. .. .. .. .. .. .. .. .. .. .. .. .. .. .. .. .. .. .. .. .. .. .. .. .. .. .. .. .. .. .. .. .. .. .. .. .. .. .. .. .. .. .. .. .. .. .. .. .. .. .. .. .. .. .. .. .. .. .. .. .. .. .. .. .. .. . .. .. .. .. .. .. .. .. .. .. .. .. .. .. .. .. .. .. .. .. .. .. .. .. .. .. .. .. .. .. .. .. .. .. .. .. .. .. .. .. .. .. .. .. .. .. .. .. .. .. .. .. .. .. .. .. .. .. .. .. .. .. .. .. .. .. .. . .. .. .. .. .. .. .. .. .. .. .. .. .. .. .. .. .. .. .. .. .. .. .. .. .. .. .. .. .. .. .. .. .. .. .. .. .. .. .. .. .. .. .. .. .. .. .. .. .. .. .. .. .. .. .. .. .. .. .. .. .. .. .. .. .. .. .. . .. .. .. .. .. .. .. .. .. .. .. .. .. .. .. .. .. .. .. .. .. .. .. .. .. .. .. .. .. .. .. .. .. .. .. .. .. .. .. .. .. .. .. .. .. .. .. .. .. .. .. .. .. .. .. .. .. .. .. .. .. .. .. .. .. .. .. . .. .. .. .. .. .. .. .. .. .. .. .. .. .. .. .. .. .. .. .. .. .. .. .. .. .. .. .. .. .. .. .. .. .. .. .. .. .. .. .. .. .. .. .. .. .. .. .. .. .. .. .. .. .. .. .. .. .. .. .. .. .. .. .. .. .. .. . .. .. .. .. .. .. .. .. .. .. .. .. .. .. .. .. .. .. .. .. .. .. .. .. .. .. .. .. .. .. .. .. .. .. .. .. .. .. .. .. .. .. .. .. .. .. .. .. .. .. .. .. .. .. .. .. .. .. .. .. .. .. .. .. .. .. .. . .. .. .. .. .. .. .. .. .. .. .. .. .. .. .. .. .. .. .. .. .. .. .. .. .. .. .. .. .. .. .. .. .. .. .. .. .. .. .. .. .. .. .. .. .. .. .. .. .. .. .. .. .. .. .. .. .. .. .. .. .. .. .. .. .. .. .. . .. .. .. .. .. .. .. .. .. .. .. .. .. .. .. .. .. .. .. .. .. .. .. .. .. .. .. .. .. .. .. .. .. .. .. .. .. .. .. .. .. .. .. .. .. .. .. .. .. .. .. .. .. .. .. .. .. .. .. .. .. .. .. .. .. .. .. . .. .. .. .. .. .. .. .. .. .. .. .. .. .. .. .. .. .. .. .. .. .. .. .. .. .. .. .. .. .. .. .. .. .. .. .. .. .. .. .. .. .. .. .. .. .. .. .. .. .. .. .. .. .. .. .. .. .. .. .. .. .. .. .. .. .. .. . .. .. .. .. .. .. .. .. .. .. .. .. .. .. .. .. .. .. .. .. .. .. .. .. .. .. .. .. .. .. .. .. .. .. .. .. .. .. .. .. .. .. .. .. .. .. .. .. .. .. .. .. .. .. .. .. .. .. .. .. .. .. .. .. .. .. .. . .. .. .. .. .. .. .. .. .. .. .. .. .. .. .. .. .. .. .. .. .. .. .. .. .. .. .. .. .. .. .. .. .. .. .. .. .. .. .. .. .. .. .. .. .. .. .. .. .. .. .. .. .. .. .. .. .. .. .. .. .. .. .. .. .. .. .. . .. .. .. .. .. .. .. .. .. .. .. .. .. .. .. .. .. .. .. .. .. .. .. .. .. .. .. .. .. .. .. .. .. .. .. .. .. .. .. .. .. .. .. .. .. .. .. .. .. .. .. .. .. .. .. .. .. .. .. .. .. .. .. .. .. .. .. . .. .. .. .. .. .. .. .. .. .. .. .. .. .. .. .. .. .. .. .. .. .. .. .. .. .. .. .. .. .. .. .. .. .. .. .. .. .. .. .. .. .. .. .. .. .. .. .. .. .. .. .. .. .. .. .. .. .. .. .. .. .. .. .. .. .. .. . .. .. .. .. .. .. .. .. .. .. .. .. .. .. .. .. .. .. .. .. .. .. .. .. .. .. .. .. .. .. .. .. .. .. .. .. .. .. .. .. .. .. .. .. .. .. .. .. .. .. .. .. .. .. .. .. .. .. .. .. .. .. .. .. .. .. .. . .. .. .. .. .. .. .. .. .. .. .. .. .. .. .. .. .. .. .. .. .. .. .. .. .. .. .. .. .. .. .. .. .. .. .. .. .. .. .. .. .. .. .. .. .. .. .. .. .. .. .. .. .. .. .. .. .. .. .. .. .. .. .. .. .. .. .. . .. .. .. .. .. .. .. .. .. .. .. .. .. .. .. .. .. .. .. .. .. .. .. .. .. .. .. .. .. .. .. .. .. .. .. .. .. .. .. .. .. .. .. .. .. .. .. .. .. .. .. .. .. .. .. .. .. .. .. .. .. .. .. .. .. .. .. . .. .. .. .. .. .. .. .. .. .. .. .. .. .. .. .. .. .. .. .. .. .. .. .. .. .. .. .. .. .. .. .. .. ..
15
SUSTAINABLE GROWTH
MARKET & POSITIONING
STRATEGY & VALUE MANAGEMENT
> Still promising Growth Prospects
on the global agricutural
Engineering Market
16 SUSTAINABLE GROWTH // MARKET & POSITIONING
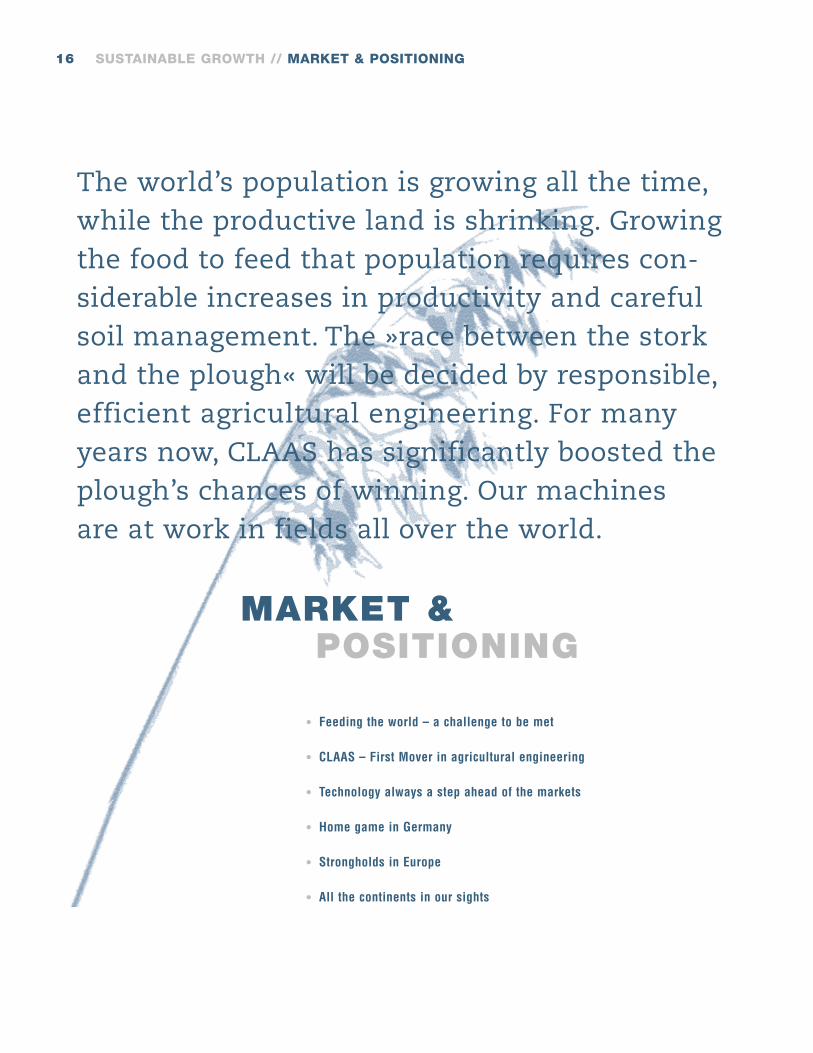
The world’s population is growing all the time,while the productive land is shrinking. Growingthe food to feed that population requires con-siderable increases in productivity and carefulsoil management. The »race between the storkand the plough« will be decided by responsible,efficient agricultural engineering. For manyyears now, CLAAS has significantly boosted theplough’s chances of winning. Our machines are at work in fields all over the world.
• Feeding the world – a challenge to be met
• CLAAS – First Mover in agricultural engineering
• Technology always a step ahead of the markets
• Home game in Germany
• Strongholds in Europe
• All the continents in our sights
MARKET & POSITIONING
17
AGRICULTURAL ENGINEERING IS A VITAL GROWTH INDUSTRY
The human race is growing apace. People need food to live – not just food to fill their
stomachs, but above all, food that provides a healthy, high-quality, balanced diet. The popu-
lation explosion is accompanied by a change in nutritional habits. In both industrial and
developing countries, an improved standard of living is leading to rising demand for cereals
and meat. More meat requires more animal feed. It takes nine kilos of cereals and supple-
mentary feed to produce a weight gain of one kilo in a young bull.
Approximately 1 billion hectares of arable land are available for agriculture worldwide to meet
the demand. That is not enough land to feed the growing population in the long term. If har-
vest yields were to remain at the 2002 level, almost 3 billion hectares of land would have to
be put into production over the next 50 years. Land is not an infinitely renewable resource,
however. On the contrary: millions of hectare of fertile agricultural land are lost every year
because of erosion. Intensive farming makes increasing demands on the land. Wind and
water erode and wash away the soil, until finally the yield drops towards nil.
>Growing food to feed the world´s
population requires considerable
increases in productivity and
careful soil management.
18 SUSTAINABLE GROWTH // MARKET & POSITIONING
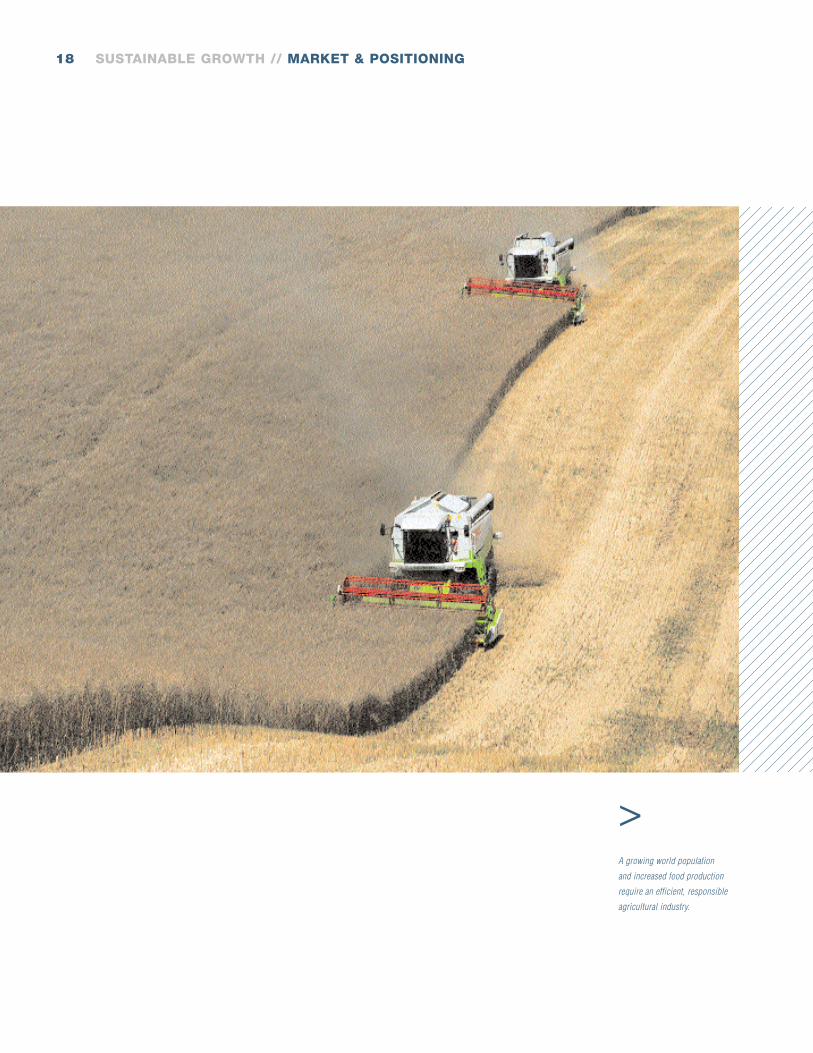
>A growing world population
and increased food production
require an efficient, responsible
agricultural industry.
19
FEEDING THE WORLD – A GLOBAL CHALLENGE
Satisfying the hungry world population and at the same time raising the standard of living is
a global challenge. The UN Food and Agriculture Organization (FAO) talks of a »race between
the stork and the plough«. The plough will only win that race if there are significant increases
in harvest productivity and if the available agricultural land is treated with respect. A growing
world population and increased food production require an efficient, responsible agricultural
industry. Agricultural engineering forms a key link in the food chain. Its role is to supply
international agriculture with technically refined, high-performance, environmentally compatible
agricultural machinery. That role makes agricultural engineering a vital growth industry.
AGRICULTURAL ENGINEERING IS INTERNATIONAL
In nearly every country in the world, farmers depend on machinery for soil tilling and harvest-
ing. This is a risky business. The weather is unpredictable and prices fluctuate. International
organizations, such as GATT, and national governments have a considerable influence over
agricultural markets. Progress in plant growing leads to changes in harvesting practices.
In any case, cultivation requires the use of powerful, demand-driven technology in order to
achieve high yields and economic efficiency.
The internationalization trend first started over twenty years ago and is intensifying all the
time. Modern agricultural engineering is a global business. The political decision by many
countries to open up their markets to free competition has created new framework condi-
tions. Market penetration is no longer confined to exporting alone. In countries that are
uncompetitive, have a shortage of foreign exchange and have to contend with infrastructure
problems, machines can only be sold where production and value creation take place. In
newly industrializing countries, the purely »customer« function comes up against not only
political resistance, but also a lack of financial resources for imports. A perceptible local
share of production and component manufacture has to be incorporated into sales strategies.
The »Think global, act local« strategic approach is the key criterion that distinguishes
globalization from the largely concentrated value creation in traditional export business.
20 SUSTAINABLE GROWTH // MARKET & POSITIONING
TREND FOR LARGE MACHINES
The process of structural adaptation which the world agricultural industry has been undergo-
ing for some years is shaped by three trends. First, competition is accelerating concentration
and the creation of larger units. Secondly, mechanization is forging ahead, with a move away
from the traditional farmer´s single-machine approach to working with machine systems.Lastly,
electronics and modern information technology are making increasingly rapid inroads into
agricultural engineering. »Precision farming« heralds a new era in agricultural engineering.
These trends are driving growth in demand for efficient, high-quality agricultural machinery,
increasingly required by professional groups such as big farmers and contractors. The struc-
tural increase in individual farm area and the use of machines on more than one farm are
boosting demand for large machines. These already account for around two-thirds of the
total West European market today.
CLAAS – A FIRST MOVER IN AGRICULTURAL ENGINEERING
CLAAS plays a leading role among the big global operators on the world agricultural engi-
neering market. Our route to the top has been paved by innovative products that set us apart
from the competition as a First Mover. Our Development departments were responsible for
the first European pick-up balers, the first combine harvester designed for Europe and the
first self-propelled forage harvester. The completely new LEXION combine harvester, a high-
performance machine with a hybrid threshing system, revolutionized the market. We took
a global stance long before globalization became a buzz-word in the world economy. Our
machines are at work in fields all round the world. Presence on all the continents is only one
facet of our globalization strategy. We develop and produce machines for efficient harvesting
of a wide range of crops in widely varying climatic zones. We were quicker than others to
realize that standard products are not a sufficient basis for an international business.
.. .. .. .. .. .. .. .. .. .. .. .. .. .. .. .. .. .. .. .. .. .. .. .. .. .. .. .. .. .. .. .. .. .. .. .. .. .. .. .. .. .. .. .. .. .. .. .. .. .. .. ..
.. .. .. .. .. .. .. .. .. .. .. .. .. .. .. .. .. .. .. .. .. .. .. .. .. .. .. .. .. .. .. .. .. .. .. .. .. .. .. .. .. .. .. .. .. .. .. .. .. .. .. .. .. .. .. .. .. .. .. .. .. .. .. .. .. .. .. .. .. .. .. ..
>CLAAS regards itself as a
systems supplier, to cover
the whole process chain.
21
DIVERSITY IN OUR LINE ...
We hold prime positions on agricultural engineering markets. We sell one combine harvester
in every three in Europe and every other self-propelled forage harvester worldwide. The vast
majority of the forage harvesters sold in the CIS are CLAAS machines. The range includes
balers and green harvest machinery. In the world´s tropical and subtropical zones, sugar
cane and corn are harvested with machines made by CLAAS. The line includes system, trans-
port and commercial vehicles for farm use as well as the very latest agricultural information
technology. We invented continuous yield measurement and mapping during combining
according to the light barrier principle by means of GPS. We developed 3-D cleaning for
the combine harvester as well as a laser-assisted automatic steering system for agricultural
machines. CLAAS is a system supplier of drive technology and hydraulics, not only for
the CLAAS Group but also for external customers. In our growth segment, Engineering for
Production, we develop and produce complex transfer lines and production lines for the
automotive and aircraft industries. We have nine production facilities in Germany and
abroad, seven marketing companies and we work with importers all over the world.
… ORIENTATION TO THE CUSTOMER IS OUR STRENGTH
We take account of the complex conditions of modern agricultural management by resolute
orientation to the customer. We have an exemplary network of service locations and parts
warehouses. The supply of parts all over the world is handled by the restructured Logistics
Center at Hamm-Uentrop. And a Service Task Force looks after CLAAS machinery anywhere
in the world.
Comprehensive service is absolutely essential in agricultural engineering. Stoppages in the
closed circuit of interlinking operations have disastrous consequences for the entire harvest
process. There is no guarantee that parts won´t fail or a machine comes to a complete
standstill. What we can make sure of, though, is that parts and service will be on site as
quickly as possible. That´s one of our strengths.
HOME GAME IN GERMANY
During the year under review we have consolidated our leading position on the domestic
market. Our combine harvester market share has once again risen. We are benefiting from
the continuing trend for large machines, buoyed up in particular by the new Federal states.
Our self-propelled forage harvester market share is well over 50%, with a rise to 42% in
the case of square balers. We enjoyed the lion´s share of the 6% growth in the green
harvest machinery segment. Hardly any other manufacturer can match us for complete
coverage of the »green line«. Our »operation forage harvest« covers all the machines and
all our know-how in the area of green harvest and stemmed crop harvesting.
22 SUSTAINABLE GROWTH // MARKET & POSITIONING
COMBINE HARVESTER STRONGHOLD IN EUROPE
The world combine harvester market has remained at the previous year´s level with a volume
of approximately 24,000 units. This pattern conceals considerable regional differences, how-
ever. While Central Europe and Germany have achieved perceptible growth rates, the markets
in North America and, above all, Argentina have dropped markedly. We have roughly a one-
fifth share of the total world market. Our stronghold is Europe. The West European combine
harvester market reported slight growth, with notable declines in Spain and Italy being more
than offset by bigger volumes in Germany and the UK. We have further expanded our market
share in Western Europe to over 37%.
We have made appreciable progress in Central Europe. We can report higher than average
growth in this expanding region and have significantly improved our market position. The
same is true of the Eastern Europe/Central Asia region.
The North American combine harvester market was in heavy recession, primarily due to the
severe drought. Price competition in the USA has increased tangibly and our establishment
in this market requires determination and patients.
FORAGE HARVESTERS DOING WELL
The world self-propelled forage harvester market has increased by 12%. Our world market
share remains at a very high level of over 50%. We also enjoy a leading position in the USA,
although market growth did not come up to our expectations last year. The situation in
Eastern Europe/Central Asia did not entirely match our predictions, either.
FURTHER OPPORTUNITIES IN BALERS
A slight increase on the square baler market has been accompanied by stability in terms
of round baler market volume. In this context we had no difficulty in maintaining our good
market position.
POTENTIAL FOR GREEN HARVEST MACHINERY
The total green harvest machinery market grew by 6%. While growth on the West European
and North American markets was only slight, sales in our South America/Overseas region
rose by 37%. Sales volumes in Eastern Europe/Central Asia increased more than fivefold,
admittedly from a low base. Significant expansion in Western Europe has increased our
market share from just on 9% to over 10%. There is further potential for growth here.
23
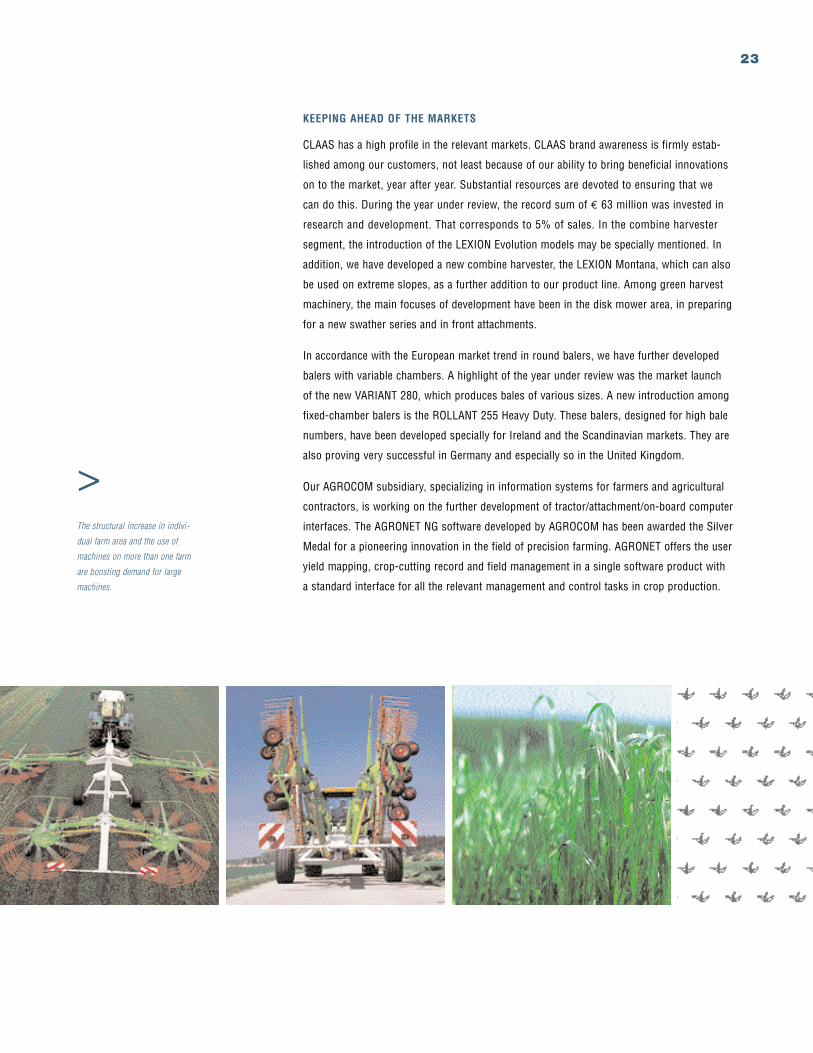
KEEPING AHEAD OF THE MARKETS
CLAAS has a high profile in the relevant markets. CLAAS brand awareness is firmly estab-
lished among our customers, not least because of our ability to bring beneficial innovations
on to the market, year after year. Substantial resources are devoted to ensuring that we
can do this. During the year under review, the record sum of € 63 million was invested in
research and development. That corresponds to 5% of sales. In the combine harvester
segment, the introduction of the LEXION Evolution models may be specially mentioned. In
addition, we have developed a new combine harvester, the LEXION Montana, which can also
be used on extreme slopes, as a further addition to our product line. Among green harvest
machinery, the main focuses of development have been in the disk mower area, in preparing
for a new swather series and in front attachments.
In accordance with the European market trend in round balers, we have further developed
balers with variable chambers. A highlight of the year under review was the market launch
of the new VARIANT 280, which produces bales of various sizes. A new introduction among
fixed-chamber balers is the ROLLANT 255 Heavy Duty. These balers, designed for high bale
numbers, have been developed specially for Ireland and the Scandinavian markets. They are
also proving very successful in Germany and especially so in the United Kingdom.
Our AGROCOM subsidiary, specializing in information systems for farmers and agricultural
contractors, is working on the further development of tractor/attachment/on-board computer
interfaces. The AGRONET NG software developed by AGROCOM has been awarded the Silver
Medal for a pioneering innovation in the field of precision farming. AGRONET offers the user
yield mapping, crop-cutting record and field management in a single software product with
a standard interface for all the relevant management and control tasks in crop production.
>The structural increase in indivi-
dual farm area and the use of
machines on more than one farm
are boosting demand for large
machines.
24 SUSTAINABLE GROWTH // STRATEGY & VALUE MANAGEMENT
STRATEGY &VALUE MANAGEMENT
Sustainable Growth. That guideline shapes our strategy. We are determined to make optimumuse of the growth opportunities available to us.Globalization sets the strategic direction: devel-oping and consolidating our position on tradi-tional markets and opening up new ones. Thepillars of our strategy are innovative products,customer-oriented solutions, high productivity,first-class distribution and excellent service.
25
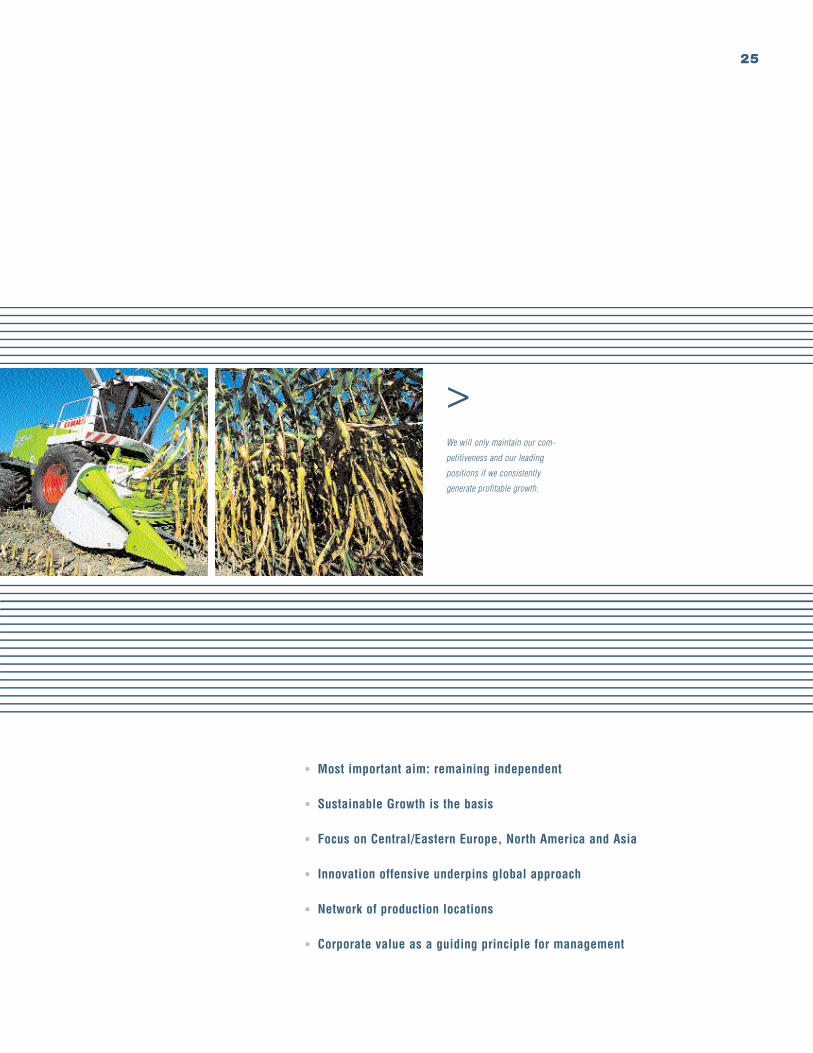
• Most important aim: remaining independent
• Sustainable Growth is the basis
• Focus on Central/Eastern Europe, North America and Asia
• Innovation offensive underpins global approach
• Network of production locations
• Corporate value as a guiding principle for management
>We will only maintain our com-
petitiveness and our leading
positions if we consistently
generate profitable growth.
26 SUSTAINABLE GROWTH // STRATEGY & VALUE MANAGEMENT
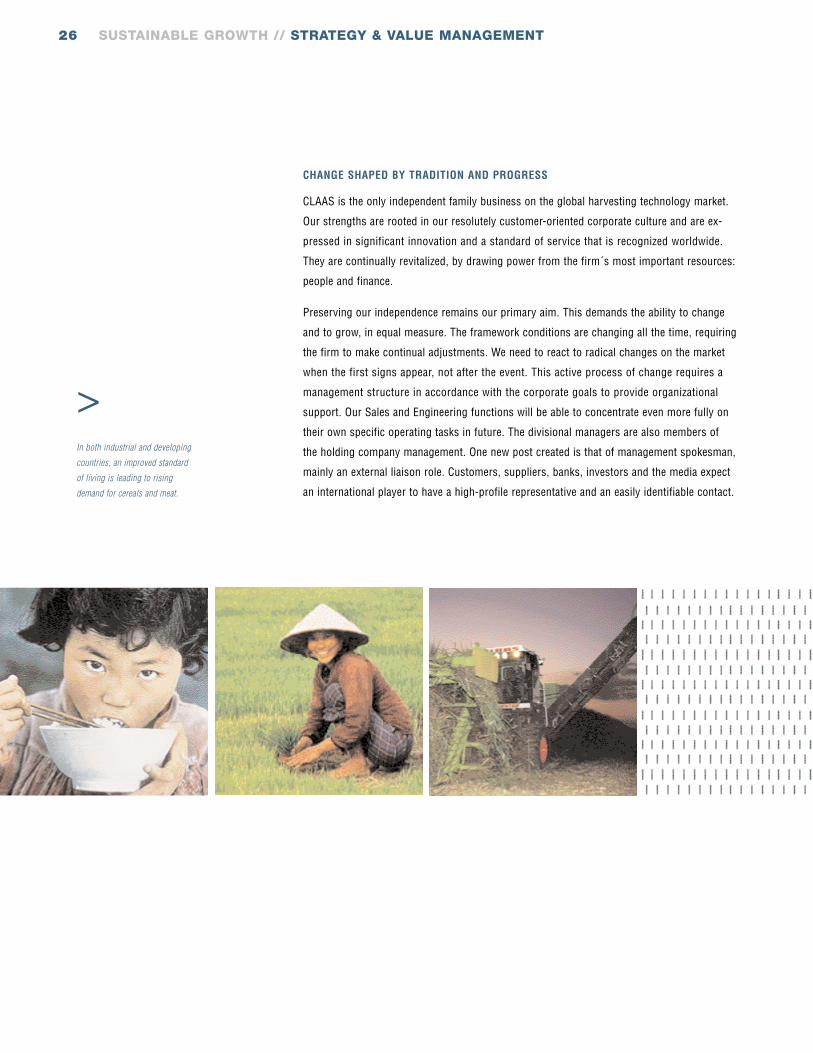
CHANGE SHAPED BY TRADITION AND PROGRESS
CLAAS is the only independent family business on the global harvesting technology market.
Our strengths are rooted in our resolutely customer-oriented corporate culture and are ex-
pressed in significant innovation and a standard of service that is recognized worldwide.
They are continually revitalized, by drawing power from the firm´s most important resources:
people and finance.
Preserving our independence remains our primary aim. This demands the ability to change
and to grow, in equal measure. The framework conditions are changing all the time, requiring
the firm to make continual adjustments. We need to react to radical changes on the market
when the first signs appear, not after the event. This active process of change requires a
management structure in accordance with the corporate goals to provide organizational
support. Our Sales and Engineering functions will be able to concentrate even more fully on
their own specific operating tasks in future. The divisional managers are also members of
the holding company management. One new post created is that of management spokesman,
mainly an external liaison role. Customers, suppliers, banks, investors and the media expect
an international player to have a high-profile representative and an easily identifiable contact.
>In both industrial and developing
countries, an improved standard
of living is leading to rising
demand for cereals and meat.
27
The organization of our divisions by function brings CLAAS even closer to the customer
and even faster on to the market, as well as ensuring efficient, »hands-on« management
of business processes. It allows for adaptation to environmental changes and is open to
future strategic options.
GROWTH FORMS THE CORE OF OUR STRATEGY
Our competitors, on both our established and our newer markets, are without exception
large global operators. We will only maintain our competitiveness and our leading positions
if we constantly generate profitable growth. CLAAS has to grow in all the world´s fields.
CULTIVATING TRADITIONAL MARKETS
The biggest share of sales still comes from the EU. Germany is by far our most important
market. Europe remains a strategic fixed point for us. With a high level of mechanization in
the region, Europe´s agricultural machinery includes a large proportion of new products,
which tends to limit the replacement demand. Our strategy has helped us become the market
leader as well as the technological leader. We intend to generate further growth at the expense
of the competition.
OFFENSIVE IN THE NEWLY INDUSTRIALIZING COUNTRIES
According to FAO estimates, Central and Eastern Europe and South America will see the
strongest growth in cereal production in future. Demand for agricultural machinery in Central
and Eastern Europe is huge. Over 100,000 combine harvesters were built annually in the
former Soviet Union. Estimates assume that Russia currently has only about half of the
machine capacity actually needed for sowing and harvesting. The planned eastward expansion
of the EU is leading to increased competition on the markets of the candidates for entry
and a growing need for rationalization in agricultural engineering. CLAAS has many years´
experience in this region, enjoys an excellent reputation for technology and service and is
familiar with financing arrangements on these markets.
Another area with a bright future is Asia´s agricultural industry, first and foremost India.
With a population over 1 billion and annual population growth between 2 and 3%, India is
one of the fastest-growing and probably the most significant agricultural market in the world.
The country is reaching a leading position as a rice grower. We have identified big opportunities
for our products, especially green harvest machinery and in particular the combine harvester
developed for rice harvesting, not only in India but also in South Korea and China.
South America also offers considerable market opportunities in the medium and long term,
which we intend to exploit. At the moment, the crisis in Argentina is having a knock-on effect
on Latin American markets, holding our expansion plans in check.
28 SUSTAINABLE GROWTH // STRATEGY & VALUE MANAGEMENT
FOCUS ON NORTH AMERICA
The big North American markets, which are to a great extent stable and lucrative, remain a
challenge for us. Our aim in those markets is to build on the successes we have enjoyed
there, principally in the green harvest market, with our main product, the combine harvester.
EXPANSION NOT CONFINED AGRICULTURAL ENGINEERING
Agricultural engineering is CLAAS´ core business. We will continue to concentrate on product
groups such as combine harvesters, self-propelled forage harvesters, balers and green harvest
machinery in future. Our products are very powerful, at the leading edge technically and are
aimed at professional users. Our customers are those who will emerge as survivors from the
competition. Harvest machinery has been and is a motor of growth. That does not mean that
our present product line is set in stone. Rounding out our range remains a strategic option.
Past growth has come almost entirely from our own efforts. We are watching the relevant
markets, though, and will seize opportunities presented by further market consolidation. We
are backed by sufficient capital and cash resources to finance the takeover of companies
that meet our standards of quality and profitability and fit in with our corporate culture.
Another strategic growth option is to use existing mechanical engineering know-how to tap
and develop adjoining business segments. The pioneer here is CLAAS Fertigungstechnik
(CFT) which, prior to being spun off as an independent Group company, produced special-
purpose equipment and tools for agricultural machinery production. Today, it enjoys a good
reputation as a high-tech supplier of complex production lines for the automotive industry
and robot-controlled assembly lines for aircraft construction. This profitable company´s sales
are growing all the time, reaching just on € 86 million in the year under review. CFT´s active
development further illustrates our endeavours to manage the risks in our cyclical industry
by diversifying in the broader area of mechanical engineering.
The same applies to CLAAS Industrietechnik GmbH, a system supplier of drive technology
and hydraulics within the Group. The very latest gearboxes and axles are manufactured for
the Group´s own mobile machines and also, increasingly, for the international construction
machinery and commercial vehicle sector.
29
BUILDING BLOCKS OF OUR STRATEGY
NETWORK OF PRODUCTION LOCATIONS
Being a global player means more than simply setting up regional sales and service organi-
zations and importing machines built at our own plants. International market leadership
demands that we aim at maximum benefit for our customers in terms of function and
economic efficiency. Being competitive on global markets also depends on good cost
management and capacity for accommodating local value added for economic reasons.
In order to optimize benefit, costs, logistics, service and distribution, we need to allow local
value added to play a part on the different markets. We are in the process of setting up inter-
nally and externally integrated systems with a selected number of suppliers. We plan our
production on the markets in such a way that we are able rapidly and precisely to deliver not
only machines but also components and assemblies as required. These machine parts are
assembled into finished products at small local production facilities at various locations
worldwide, without comprising the customary CLAAS quality.
The investment offensive we have launched serves to implement our global growth and
product strategy. At our Harsewinkel headquarters we are building a factory for the future,
with production lines for combine harvesters and forage harvesters as well as for com-
ponents and assemblies. The total investment of € 55 million is a record for CLAAS. At
Törökszentmiklos in Hungary, we have spent € 10 million on expanding our component
and front attachment plant. We have opened a new logistics center in Hamm and restruc-
tured the green harvest machinery plant in Bad Saulgau, South Germany, and the baler
plant in Metz, France. The new factory structures will allow rapid adaptation to future market
developments as well as considerable flexibility to cope with seasonal fluctuations. The reduc-
tion of internal complexity and more flexible production are a response to various customer
requirements for world markets.
The takeover of complete control of our operation in Nebraska, USA, previously run as a
joint venture, decisively strengthens our North American base. We have taken the initiative
and decided from now on to tread the difficult path on our own. We know that the big
US combine harvester market is ideal for our powerful LEXION series. The response from
American farmers has been positive. Their economic situation has been improved by the
new US agricultural legislation, which provides greater support for farmers. We want our
combine harvesters to follow previous successes in the USA.
30 SUSTAINABLE GROWTH // STRATEGY & VALUE MANAGEMENT
Another milestone is the full takeover of combine harvester production in India. We have
acquired the other 60% of Escorts CLAAS Ltd. from our joint venture partner Escorts, a
large Indian conglomerate. The rubber-tracked Crop Tiger combine harvesters have been
developed specially for local growing and harvesting conditions in wet soil in rice-growing
areas. Principal markets for these machines outside India are South Korea and China.
350 units per year have been built in India in the last few years. Development of local value
added has enabled us to operate profitably from a very early stage.
FOCUSSED FACILITY – FACTORY MARKETING
Our focussed facility and factory marketing network is designed to take local requirements
very much into account. By focussed facility we mean legally independent corporate units
which develop, produce and market products under their own control, using their own know-
how and on their own strategic responsibility. The focussed facility approach has created a
network of distributed expertise and value added in development and production that marries
central process and design know-how with local input requirements. Production and develop-
ment management also performs sales and marketing tasks. The combination of focussed
facility and factory marketing creates innovative, cost-conscious, market-oriented, profitable,
competitive corporate units. Not only distribution, but the technology too, is close to the
market.
THE SYSTEM APPROACH
Our strategic approach corresponds to an integrated way of looking at farming. We think
in terms of systems. Our agricultural machines are components of an environmentally and
economically oriented production system. We don´t just deliver machines, we take care of
the whole process chain. For example: the economic use of forage harvesters requires a
transport chain to be available. After corn harvesting, the cut crop has to be removed quickly.
Once it´s in the wagon, it has to be placed in the silo. Successful deployment of the forage
harvester depends on all the links in the process chain. To overcome the logistical problems
with silo maize, we have developed a field shuttle system, where the cut crop is conveyed
directly from the forage harvester to an accompanying 35 m3 bunker. Two bunker-loads are
then collected and hauled away by a skip truck. The system increases operating power when
maize harvesting, protects the ground and means less traffic on the roads.
One of our strengths is our knowledge of the markets and the ability to anticipate which
new technologies our customers will need tomorrow. Our patented new line designed for big
farmers and agricultural contractors is a strategic differentiation and unique position feature.
31
INNOVATIVE FINANCING MODEL
Another important strategic element is our Treasury. The Finance division is organized like a
house bank for all the Group companies. It acts as a central procurer of the necessary funds,
finances the production process and is responsible for sales financing. The division has
responsibility throughout the Group for currency and interest rate risk management. Our
reputation in the capital markets is remarkable due to our professional management of
borrowed capital positions.
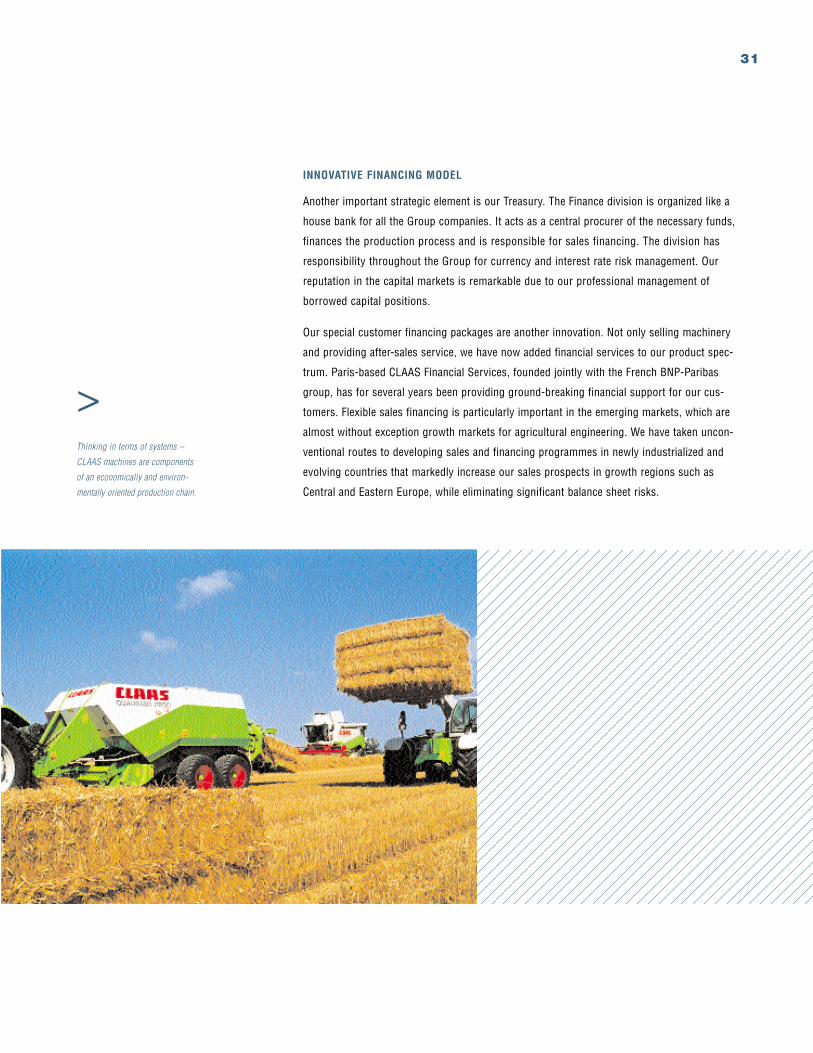
Our special customer financing packages are another innovation. Not only selling machinery
and providing after-sales service, we have now added financial services to our product spec-
trum. Paris-based CLAAS Financial Services, founded jointly with the French BNP-Paribas
group, has for several years been providing ground-breaking financial support for our cus-
tomers. Flexible sales financing is particularly important in the emerging markets, which are
almost without exception growth markets for agricultural engineering. We have taken uncon-
ventional routes to developing sales and financing programmes in newly industrialized and
evolving countries that markedly increase our sales prospects in growth regions such as
Central and Eastern Europe, while eliminating significant balance sheet risks.
>Thinking in terms of systems –
CLAAS machines are components
of an economically and environ-
mentally oriented production chain.
32 SUSTAINABLE GROWTH // STRATEGY & VALUE MANAGEMENT
VALUE-ORIENTED MANAGEMENT AT CLAAS
The aim behind value-oriented management is sustained growth in CLAAS´ corporate value.
At CLAAS, »sustainability« is more than just a word. Shareholder Value – in accordance
with the wider Stakeholder Value approach, which takes into account the investors as
well as the interests of employees, customers and suppliers – does not, for CLAAS, mean
primarily striving for short-term good news. What we want is profitable long-term growth.
Accordingly, we are prepared for example to invest heavily in our production network or
to devote outlay in the medium term to developing our combine harvester market position
in the USA.
This forward-looking approach to our business requires a high degree of consistency in our
entrepreneurial actions. At CLAAS, that consistency is made possible by the firm´s specific
ownership structure. Through all the cycles that characterize the agricultural machinery
sector and the sometimes wild fluctuations on the capital markets, the CLAAS family, as
the Group´s sole proprietor, is our guarantor of consistency – with respect to value manage-
ment. CLAAS does not expect the success of a project to be visible in the very next quarter´s
figures. Projects of a strategic nature can be successfully carried out with a high degree of
consistency and certainty in the planning. Consequently, CLAAS is able to practice value-
oriented management in the true sense.
The main performance indicator which we use in our value management approach is Cash
flow-Return on Investment (CF-ROI). This operating yield ratio tells us how much cash after
tax has been generated in relation to the capital invested.
Cash flow-Return on Investment (CF-ROI) =Gross cash flow
Gross investment basis
The CF-ROI is calculated by dividing the gross cash flow by the gross investment base. In
order to determine the gross cash flow, the result after taxes is adjusted by non-operating
and non-cash amounts. That figure is related to the gross investment base, which is, the
operating capital invested in order to produce the gross cash flow. If capital can be used
without paying interest (e.g. in the form of accruals), this is excluded when calculating
the gross investment base.
• Focus on sustained value increase
• Sound footing for CLAAS: stable capital structure
• Reliable planning of strategic projects
• Family business: value management in the truest sense
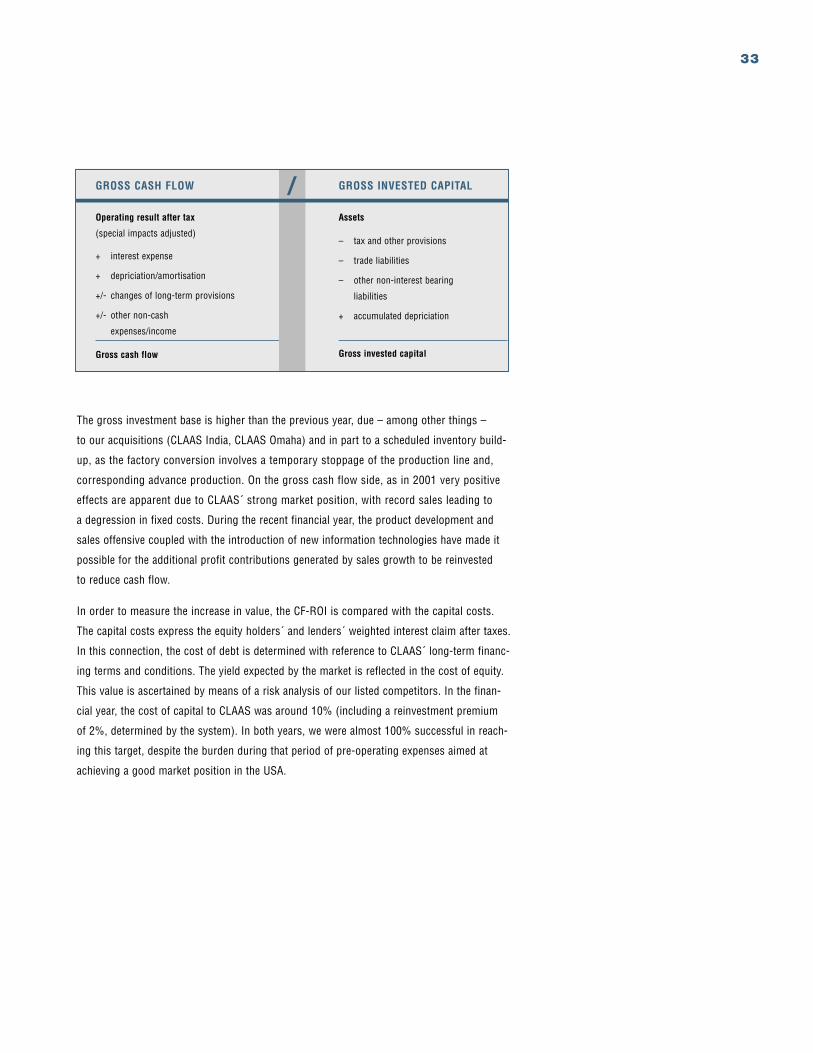
33
The gross investment base is higher than the previous year, due – among other things –
to our acquisitions (CLAAS India, CLAAS Omaha) and in part to a scheduled inventory build-
up, as the factory conversion involves a temporary stoppage of the production line and,
corresponding advance production. On the gross cash flow side, as in 2001 very positive
effects are apparent due to CLAAS´ strong market position, with record sales leading to
a degression in fixed costs. During the recent financial year, the product development and
sales offensive coupled with the introduction of new information technologies have made it
possible for the additional profit contributions generated by sales growth to be reinvested
to reduce cash flow.
In order to measure the increase in value, the CF-ROI is compared with the capital costs.
The capital costs express the equity holders´ and lenders´ weighted interest claim after taxes.
In this connection, the cost of debt is determined with reference to CLAAS´ long-term financ-
ing terms and conditions. The yield expected by the market is reflected in the cost of equity.
This value is ascertained by means of a risk analysis of our listed competitors. In the finan-
cial year, the cost of capital to CLAAS was around 10% (including a reinvestment premium
of 2%, determined by the system). In both years, we were almost 100% successful in reach-
ing this target, despite the burden during that period of pre-operating expenses aimed at
achieving a good market position in the USA.
GROSS CASH FLOW
Operating result after tax
(special impacts adjusted)
+ interest expense
+ depriciation/amortisation
+/- changes of long-term provisions
+/- other non-cash
expenses/income
Gross cash flow
GROSS INVESTED CAPITAL
Assets
– tax and other provisions
– trade liabilities
– other non-interest bearing
liabilities
+ accumulated depriciation
Gross invested capital
/
.. .. .. .. .. .. .. .. .. .. .. .. .. .. .. .. .. .. .. .. .. .. .. .. .. .. .. .. .. .. .. .. .. .. .. .. .. .. .. .. .. .. .. .. .. .. .. .. .. .. .. .. .. .. .. .. .. .. .. .. .. .. .. .. .. .. .. . .. .. .. .. .. .. .. .. .. .. .. .. .. .. .. .. .. .. .. .. .. .. .. .. .. .. .. .. .. .. .. .. .. .. .. .. .. .. .. .. .. .. .. .. .. .. .. .. .. .. .. .. .. .. .. .. .. .. .. .. .. .. .. .. .. .. .. . .. .. .. .. .. .. .. .. .. .. .. .. .. .. .. .. .. .. .. .. .. .. .. .. .. .. .. .. .. .. .. .. .. .. .. .. .. .. .. .. .. .. .. .. .. .. .. .. .. .. .. .. .. .. .. .. .. .. .. .. .. .. .. .. .. .. .. . .. .. .. .. .. .. .. .. .. .. .. .. .. .. .. .. .. .. .. .. .. .. .. .. .. .. .. .. .. .. .. .. .. .. .. .. .. .. .. .. .. .. .. .. .. .. .. .. .. .. .. .. .. .. .. .. .. .. .. .. .. .. .. .. .. .. .. . .. .. .. .. .. .. .. .. .. .. .. .. .. .. .. .. .. .. .. .. .. .. .. .. .. .. .. .. .. .. .. .. .. .. .. .. .. .. .. .. .. .. .. .. .. .. .. .. .. .. .. .. .. .. .. .. .. .. .. .. .. .. .. .. .. .. .. . .. .. .. .. .. .. .. .. .. .. .. .. .. .. .. .. .. .. .. .. .. .. .. .. .. .. .. .. .. .. .. .. .. .. .. .. .. .. .. .. .. .. .. .. .. .. .. .. .. .. .. .. .. .. .. .. .. .. .. .. .. .. .. .. .. .. .. . .. .. .. .. .. .. .. .. .. .. .. .. .. .. .. .. .. .. .. .. .. .. .. .. .. .. .. .. .. .. .. .. .. .. .. .. .. .. .. .. .. .. .. .. .. .. .. .. .. .. .. .. .. .. .. .. .. .. .. .. .. .. .. .. .. .. .. . .. .. .. .. .. .. .. .. .. .. .. .. .. .. .. .. .. .. .. .. .. .. .. .. .. .. .. .. .. .. .. .. .. .. .. .. .. .. .. .. .. .. .. .. .. .. .. .. .. .. .. .. .. .. .. .. .. .. .. .. .. .. .. .. .. .. .. . .. .. .. .. .. .. .. .. .. .. .. .. .. .. .. .. .. .. .. .. .. .. .. .. .. .. .. .. .. .. .. .. .. .. .. .. .. .. .. .. .. .. .. .. .. .. .. .. .. .. .. .. .. .. .. .. .. .. .. .. .. .. .. .. .. .. .. . .. .. .. .. .. .. .. .. .. .. .. .. .. .. .. .. .. .. .. .. .. .. .. .. .. .. .. .. .. .. .. .. .. .. .. .. .. .. .. .. .. .. .. .. .. .. .. .. .. .. .. .. .. .. .. .. .. .. .. .. .. .. .. .. .. .. .. . .. .. .. .. .. .. .. .. .. .. .. .. .. .. .. .. .. .. .. .. .. .. .. .. .. .. .. .. .. .. .. .. .. .. .. .. .. .. .. .. .. .. .. .. .. .. .. .. .. .. .. .. .. .. .. .. .. .. .. .. .. .. .. .. .. .. .. . .. .. .. .. .. .. .. .. .. .. .. .. .. .. .. .. .. .. .. .. .. .. .. .. .. .. .. .. .. .. .. .. .. .. .. .. .. .. .. .. .. .. .. .. .. .. .. .. .. .. .. .. .. .. .. .. .. .. .. .. .. .. .. .. .. .. .. . .. .. .. .. .. .. .. .. .. .. .. .. .. .. .. .. .. .. .. .. .. .. .. .. .. .. .. .. .. .. .. .. .. .. .. .. .. .. .. .. .. .. .. .. .. .. .. .. .. .. .. .. .. .. .. .. .. .. .. .. .. .. .. .. .. .. .. . .. .. .. .. .. .. .. .. .. .. .. .. .. .. .. .. .. .. .. .. .. .. .. .. .. .. .. .. .. .. .. .. .. .. .. .. .. .. .. .. .. .. .. .. .. .. .. .. .. .. .. .. .. .. .. .. .. .. .. .. .. .. .. .. .. .. .. . .. .. .. .. .. .. .. .. .. .. .. .. .. .. .. .. .. .. .. .. .. .. .. .. .. .. .. .. .. .. .. .. .. .. .. .. .. .. .. .. .. .. .. .. .. .. .. .. .. .. .. .. .. .. .. .. .. .. .. .. .. .. .. .. .. .. .. . .. .. .. .. .. .. .. .. .. .. .. .. .. .. .. .. .. .. .. .. .. .. .. .. .. .. .. .. .. .. .. .. .. .. .. .. .. .. .. .. .. .. .. .. .. .. .. .. .. .. .. .. .. .. .. .. .. .. .. .. .. .. .. .. .. .. .. . .. .. .. .. .. .. .. .. .. .. .. .. .. .. .. .. .. .. .. .. .. .. .. .. .. .. .. .. .. .. .. .. .. .. .. .. .. .. .. .. .. .. .. .. .. .. .. .. .. .. .. .. .. .. .. .. .. .. .. .. .. .. .. .. .. .. .. . .. .. .. .. .. .. .. .. .. .. .. .. .. .. .. .. .. .. .. .. .. .. .. .. .. .. .. .. .. .. .. .. .. .. .. .. .. .. .. .. .. .. .. .. .. .. .. .. .. .. .. .. .. .. .. .. .. .. .. .. .. .. .. .. .. .. .. . .. .. .. .. .. .. .. .. .. .. .. .. .. .. .. .. .. .. .. .. .. .. .. .. .. .. .. .. .. .. .. .. .. .. .. .. .. .. .. .. .. .. .. .. .. .. .. .. .. .. .. .. .. .. .. .. .. .. .. .. .. .. .. .. .. .. .. . .. .. .. .. .. .. .. .. .. .. .. .. .. .. .. .. .. .. .. .. .. .. .. .. .. .. .. .. .. .. .. .. .. .. .. .. .. .. .. .. .. .. .. .. .. .. .. .. .. .. .. .. .. .. .. .. .. .. .. .. .. .. .. .. .. .. .. . .. .. .. .. .. .. .. .. .. .. .. .. .. .. .. .. .. .. .. .. .. .. .. .. .. .. .. .. .. .. .. .. .. .. .. .. .. .. .. .. .. .. .. .. .. .. .. .. .. .. .. .. .. .. .. .. .. .. .. .. .. .. .. .. .. .. .. . .. .. .. .. .. .. .. .. .. .. .. .. .. .. .. .. .. .. .. .. .. .. .. .. .. .. .. .. .. .. .. .. .. .. .. .. .. .. .. .. .. .. .. .. .. .. .. .. .. .. .. .. .. .. .. .. .. .. .. .. .. .. .. .. .. .. .. . .. .. .. .. .. .. .. .. .. .. .. .. .. .. .. .. .. .. .. .. .. .. .. .. .. .. .. .. .. .. .. .. .. .. .. .. .. .. .. .. .. .. .. .. .. .. .. .. .. .. .. .. .. .. .. .. .. .. .. .. .. .. .. .. .. .. .. . .. .. .. .. .. .. .. .. .. .. .. .. .. .. .. .. .. .. .. .. .. .. .. .. .. .. .. .. .. .. .. .. .. .. .. .. .. .. .. .. .. .. .. .. .. .. .. .. .. .. .. .. .. .. .. .. .. .. .. .. .. .. .. .. .. .. .. . .. .. .. .. .. .. .. .. .. .. .. .. .. .. .. .. .. .. .. .. .. .. .. .. .. .. .. .. .. .. .. .. .. .. .. .. .. .. .. .. .. .. .. .. .. .. .. .. .. .. .. .. .. .. .. .. .. .. .. .. .. .. .. .. .. .. .. . .. .. .. .. .. .. .. .. .. .. .. .. .. .. .. .. .. .. .. .. .. .. .. .. .. .. .. .. .. .. .. .. .. .. .. .. .. .. .. .. .. .. .. .. .. .. .. .. .. .. .. .. .. .. .. .. .. .. .. .. .. .. .. .. .. .. .. . .. .. .. .. .. .. .. .. .. .. .. .. .. .. .. .. .. .. .. .. .. .. .. .. .. .. .. .. .. .. .. .. .. .. .. .. .. .. .. .. .. .. .. .. .. .. .. .. .. .. .. .. .. .. .. .. .. .. .. .. .. .. .. .. .. .. .. . .. .. .. .. .. .. .. .. .. .. .. .. .. .. .. .. .. .. .. .. .. .. .. .. .. .. .. .. .. .. .. .. .. .. .. .. .. .. .. .. .. .. .. .. .. .. .. .. .. .. .. .. .. .. .. .. .. .. .. .. .. .. .. .. .. .. .. . .. .. .. .. .. .. .. .. .. .. .. .. .. .. .. .. .. .. .. .. .. .. .. .. .. .. .. .. .. .. .. .. .. .. .. .. .. .. .. .. .. .. .. .. .. .. .. .. .. .. .. .. .. .. .. .. .. .. .. .. .. .. .. .. .. .. .. . .. .. .. .. .. .. .. .. .. .. .. .. .. .. .. .. .. .. .. .. .. .. .. .. .. .. .. .. .. .. .. .. .. .. .. .. .. .. .. .. .. .. .. .. .. .. .. .. .. .. .. .. .. .. .. .. .. .. .. .. .. .. .. .. .. .. .. . .. .. .. .. .. .. .. .. .. .. .. .. .. .. .. .. .. .. .. .. .. .. .. .. .. .. .. .. .. .. .. .. .. .. .. .. .. .. .. .. .. .. .. .. .. .. .. .. .. .. .. .. .. .. .. .. .. .. .. .. .. .. .. .. .. .. .. . .. .. .. .. .. .. .. .. .. .. .. .. .. .. .. .. .. .. .. .. .. .. .. .. .. .. .. .. .. .. .. .. .. .. .. .. .. .. .. .. .. .. .. .. .. .. .. .. .. .. .. .. .. .. .. .. .. .. .. .. .. .. .. .. .. .. .. . .. .. .. .. .. .. .. .. .. .. .. .. .. .. .. .. .. .. .. .. .. .. .. .. .. .. .. .. .. .. .. .. .. .. .. .. .. .. .. .. .. .. .. .. .. .. .. .. .. .. .. .. .. .. .. .. .. .. .. .. .. .. .. .. .. .. .. . .. .. .. .. .. .. .. .. .. .. .. .. .. .. .. .. .. .. .. .. .. .. .. .. .. .. .. .. .. .. .. .. .. .. .. .. .. .. .. .. .. .. .. .. .. .. .. .. .. .. .. .. .. .. .. .. .. .. .. .. .. .. .. .. .. .. .. .
34
.. .. .. .. .. .. .. .. .. .. .. .. .. .. .. .. .. .. .. .. .. .. .. .. .. .. .. .. .. .. .. .. .. ... .. .. .. .. .. .. .. .. .. .. .. .. .. .. .. .. .. .. .. .. .. .. .. .. .. .. .. .. .. .. .. .. .. .. .. .. .. .. .. .. .. .. .. .. .. .. .. .. .. .. .. .. .. .. .. .. .. .. .. .. .. .. .. .. .. .. ... .. .. .. .. .. .. .. .. .. .. .. .. .. .. .. .. .. .. .. .. .. .. .. .. .. .. .. .. .. .. .. .. .. .. .. .. .. .. .. .. .. .. .. .. .. .. .. .. .. .. .. .. .. .. .. .. .. .. .. .. .. .. .. .. .. .. ... .. .. .. .. .. .. .. .. .. .. .. .. .. .. .. .. .. .. .. .. .. .. .. .. .. .. .. .. .. .. .. .. .. .. .. .. .. .. .. .. .. .. .. .. .. .. .. .. .. .. .. .. .. .. .. .. .. .. .. .. .. .. .. .. .. .. ... .. .. .. .. .. .. .. .. .. .. .. .. .. .. .. .. .. .. .. .. .. .. .. .. .. .. .. .. .. .. .. .. .. .. .. .. .. .. .. .. .. .. .. .. .. .. .. .. .. .. .. .. .. .. .. .. .. .. .. .. .. .. .. .. .. .. ... .. .. .. .. .. .. .. .. .. .. .. .. .. .. .. .. .. .. .. .. .. .. .. .. .. .. .. .. .. .. .. .. .. .. .. .. .. .. .. .. .. .. .. .. .. .. .. .. .. .. .. .. .. .. .. .. .. .. .. .. .. .. .. .. .. .. ... .. .. .. .. .. .. .. .. .. .. .. .. .. .. .. .. .. .. .. .. .. .. .. .. .. .. .. .. .. .. .. .. .. .. .. .. .. .. .. .. .. .. .. .. .. .. .. .. .. .. .. .. .. .. .. .. .. .. .. .. .. .. .. .. .. .. ... .. .. .. .. .. .. .. .. .. .. .. .. .. .. .. .. .. .. .. .. .. .. .. .. .. .. .. .. .. .. .. .. .. .. .. .. .. .. .. .. .. .. .. .. .. .. .. .. .. .. .. .. .. .. .. .. .. .. .. .. .. .. .. .. .. .. ... .. .. .. .. .. .. .. .. .. .. .. .. .. .. .. .. .. .. .. .. .. .. .. .. .. .. .. .. .. .. .. .. .. .. .. .. .. .. .. .. .. .. .. .. .. .. .. .. .. .. .. .. .. .. .. .. .. .. .. .. .. .. .. .. .. .. ... .. .. .. .. .. .. .. .. .. .. .. .. .. .. .. .. .. .. .. .. .. .. .. .. .. .. .. .. .. .. .. .. .. .. .. .. .. .. .. .. .. .. .. .. .. .. .. .. .. .. .. .. .. .. .. .. .. .. .. .. .. .. .. .. .. .. ... .. .. .. .. .. .. .. .. .. .. .. .. .. .. .. .. .. .. .. .. .. .. .. .. .. .. .. .. .. .. .. .. .. .. .. .. .. .. .. .. .. .. .. .. .. .. .. .. .. .. .. .. .. .. .. .. .. .. .. .. .. .. .. .. .. .. ... .. .. .. .. .. .. .. .. .. .. .. .. .. .. .. .. .. .. .. .. .. .. .. .. .. .. .. .. .. .. .. .. .. .. .. .. .. .. .. .. .. .. .. .. .. .. .. .. .. .. .. .. .. .. .. .. .. .. .. .. .. .. .. .. .. .. ... .. .. .. .. .. .. .. .. .. .. .. .. .. .. .. .. .. .. .. .. .. .. .. .. .. .. .. .. .. .. .. .. .. .. .. .. .. .. .. .. .. .. .. .. .. .. .. .. .. .. .. .. .. .. .. .. .. .. .. .. .. .. .. .. .. .. ... .. .. .. .. .. .. .. .. .. .. .. .. .. .. .. .. .. .. .. .. .. .. .. .. .. .. .. .. .. .. .. .. .. .. .. .. .. .. .. .. .. .. .. .. .. .. .. .. .. .. .. .. .. .. .. .. .. .. .. .. .. .. .. .. .. .. ... .. .. .. .. .. .. .. .. .. .. .. .. .. .. .. .. .. .. .. .. .. .. .. .. .. .. .. .. .. .. .. .. .. .. .. .. .. .. .. .. .. .. .. .. .. .. .. .. .. .. .. .. .. .. .. .. .. .. .. .. .. .. .. .. .. .. ... .. .. .. .. .. .. .. .. .. .. .. .. .. .. .. .. .. .. .. .. .. .. .. .. .. .. .. .. .. .. .. .. .. .. .. .. .. .. .. .. .. .. .. .. .. .. .. .. .. .. .. .. .. .. .. .. .. .. .. .. .. .. .. .. .. .. ... .. .. .. .. .. .. .. .. .. .. .. .. .. .. .. .. .. .. .. .. .. .. .. .. .. .. .. .. .. .. .. .. .. .. .. .. .. .. .. .. .. .. .. .. .. .. .. .. .. .. .. .. .. .. .. .. .. .. .. .. .. .. .. .. .. .. ... .. .. .. .. .. .. .. .. .. .. .. .. .. .. .. .. .. .. .. .. .. .. .. .. .. .. .. .. .. .. .. .. .. .. .. .. .. .. .. .. .. .. .. .. .. .. .. .. .. .. .. .. .. .. .. .. .. .. .. .. .. .. .. .. .. .. ... .. .. .. .. .. .. .. .. .. .. .. .. .. .. .. .. .. .. .. .. .. .. .. .. .. .. .. .. .. .. .. .. .. .. .. .. .. .. .. .. .. .. .. .. .. .. .. .. .. .. .. .. .. .. .. .. .. .. .. .. .. .. .. .. .. .. ... .. .. .. .. .. .. .. .. .. .. .. .. .. .. .. .. .. .. .. .. .. .. .. .. .. .. .. .. .. .. .. .. .. .. .. .. .. .. .. .. .. .. .. .. .. .. .. .. .. .. .. .. .. .. .. .. .. .. .. .. .. .. .. .. .. .. ... .. .. .. .. .. .. .. .. .. .. .. .. .. .. .. .. .. .. .. .. .. .. .. .. .. .. .. .. .. .. .. .. .. .. .. .. .. .. .. .. .. .. .. .. .. .. .. .. .. .. .. .. .. .. .. .. .. .. .. .. .. .. .. .. .. .. ... .. .. .. .. .. .. .. .. .. .. .. .. .. .. .. .. .. .. .. .. .. .. .. .. .. .. .. .. .. .. .. .. .. .. .. .. .. .. .. .. .. .. .. .. .. .. .. .. .. .. .. .. .. .. .. .. .. .. .. .. .. .. .. .. .. .. ... .. .. .. .. .. .. .. .. .. .. .. .. .. .. .. .. .. .. .. .. .. .. .. .. .. .. .. .. .. .. .. .. .. .. .. .. .. .. .. .. .. .. .. .. .. .. .. .. .. .. .. .. .. .. .. .. .. .. .. .. .. .. .. .. .. .. ... .. .. .. .. .. .. .. .. .. .. .. .. .. .. .. .. .. .. .. .. .. .. .. .. .. .. .. .. .. .. .. .. .. .. .. .. .. .. .. .. .. .. .. .. .. .. .. .. .. .. .. .. .. .. .. .. .. .. .. .. .. .. .. .. .. .. ... .. .. .. .. .. .. .. .. .. .. .. .. .. .. .. .. .. .. .. .. .. .. .. .. .. .. .. .. .. .. .. .. .. .. .. .. .. .. .. .. .. .. .. .. .. .. .. .. .. .. .. .. .. .. .. .. .. .. .. .. .. .. .. .. .. .. ... .. .. .. .. .. .. .. .. .. .. .. .. .. .. .. .. .. .. .. .. .. .. .. .. .. .. .. .. .. .. .. .. .. .. .. .. .. .. .. .. .. .. .. .. .. .. .. .. .. .. .. .. .. .. .. .. .. .. .. .. .. .. .. .. .. .. ... .. .. .. .. .. .. .. .. .. .. .. .. .. .. .. .. .. .. .. .. .. .. .. .. .. .. .. .. .. .. .. .. .. .. .. .. .. .. .. .. .. .. .. .. .. .. .. .. .. .. .. .. .. .. .. .. .. .. .. .. .. .. .. .. .. .. ... .. .. .. .. .. .. .. .. .. .. .. .. .. .. .. .. .. .. .. .. .. .. .. .. .. .. .. .. .. .. .. .. .. .. .. .. .. .. .. .. .. .. .. .. .. .. .. .. .. .. .. .. .. .. .. .. .. .. .. .. .. .. .. .. .. .. ... .. .. .. .. .. .. .. .. .. .. .. .. .. .. .. .. .. .. .. .. .. .. .. .. .. .. .. .. .. .. .. .. .. .. .. .. .. .. .. .. .. .. .. .. .. .. .. .. .. .. .. .. .. .. .. .. .. .. .. .. .. .. .. .. .. .. ... .. .. .. .. .. .. .. .. .. .. .. .. .. .. .. .. .. .. .. .. .. .. .. .. .. .. .. .. .. .. .. .. .. .. .. .. .. .. .. .. .. .. .. .. .. .. .. .. .. .. .. .. .. .. .. .. .. .. .. .. .. .. .. .. .. .. ... .. .. .. .. .. .. .. .. .. .. .. .. .. .. .. .. .. .. .. .. .. .. .. .. .. .. .. .. .. .. .. .. .. .. .. .. .. .. .. .. .. .. .. .. .. .. .. .. .. .. .. .. .. .. .. .. .. .. .. .. .. .. .. .. .. .. ... .. .. .. .. .. .. .. .. .. .. .. .. .. .. .. .. .. .. .. .. .. .. .. .. .. .. .. .. .. .. .. .. .. .. .. .. .. .. .. .. .. .. .. .. .. .. .. .. .. .. .. .. .. .. .. .. .. .. .. .. .. .. .. .. .. .. ... .. .. .. .. .. .. .. .. .. .. .. .. .. .. .. .. .. .. .. .. .. .. .. .. .. .. .. .. .. .. .. .. .. .. .. .. .. .. .. .. .. .. .. .. .. .. .. .. .. .. .. .. .. .. .. .. .. .. .. .. .. .. .. .. .. .. ... .. .. .. .. .. .. .. .. .. .. .. .. .. .. .. .. .. .. .. .. .. .. .. .. .. .. .. .. .. .. .. .. .. .. .. .. .. .. .. .. .. .. .. .. .. .. .. .. .. .. .. .. .. .. .. .. .. .. .. .. .. .. .. .. .. .. ... .. .. .. .. .. .. .. .. .. .. .. .. .. .. .. .. .. .. .. .. .. .. .. .. .. .. .. .. .. .. .. .. ..
35
> We will further consolidate and develop
our leading Market Positions
36 CORPORATE RESPONSIBILITY
CORPORATERESPONSIBILITY
• Knowledge and transferring knowledge is the basis of our strength
• Personnel development is a management issue
• We combine economics and ecology in agricultural engineering
• Supporting the customer
• Transparency for investors
• Founded on the principles of integrity and loyalty
In agriculture and in food production, our products are making a contribution to society.We accept the associated responsibility andderive our strategy from it. Our way of thinkingand acting is directed at the whole processchain, in the sense of corporate responsibility.
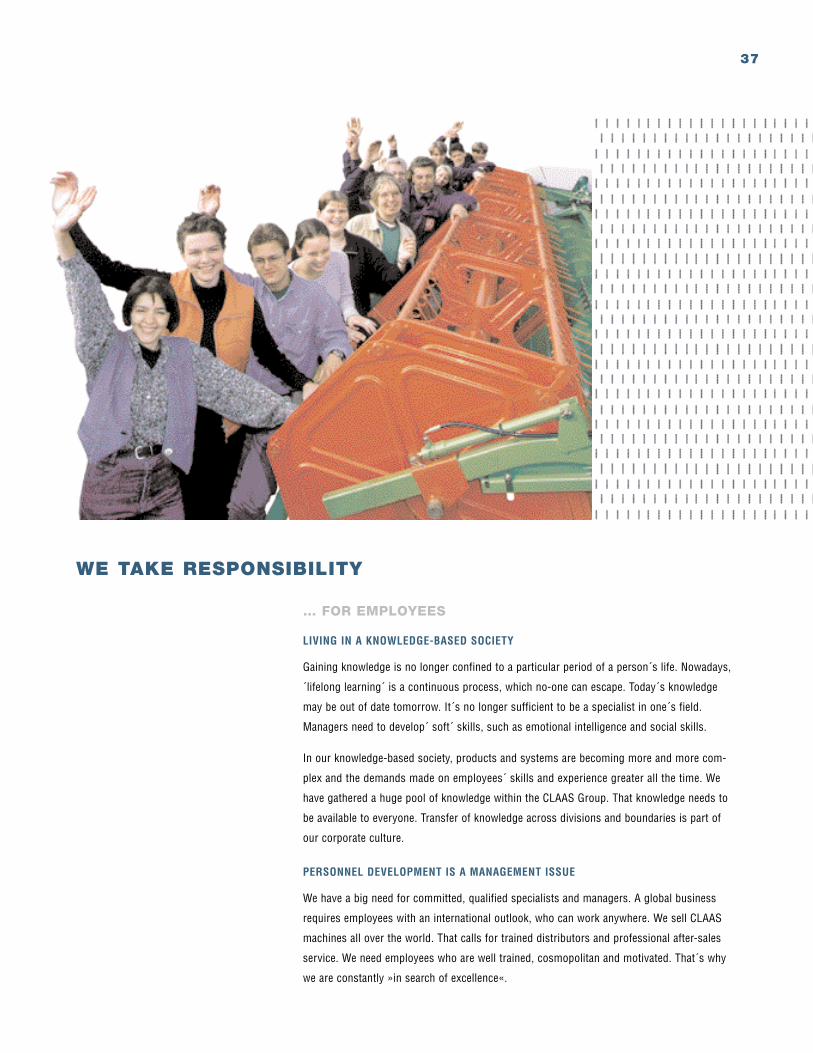
37
… FOR EMPLOYEES
LIVING IN A KNOWLEDGE-BASED SOCIETY
Gaining knowledge is no longer confined to a particular period of a person´s life. Nowadays,
´lifelong learning´ is a continuous process, which no-one can escape. Today´s knowledge
may be out of date tomorrow. It´s no longer sufficient to be a specialist in one´s field.
Managers need to develop´ soft´ skills, such as emotional intelligence and social skills.
In our knowledge-based society, products and systems are becoming more and more com-
plex and the demands made on employees´ skills and experience greater all the time. We
have gathered a huge pool of knowledge within the CLAAS Group. That knowledge needs to
be available to everyone. Transfer of knowledge across divisions and boundaries is part of
our corporate culture.
PERSONNEL DEVELOPMENT IS A MANAGEMENT ISSUE
We have a big need for committed, qualified specialists and managers. A global business
requires employees with an international outlook, who can work anywhere. We sell CLAAS
machines all over the world. That calls for trained distributors and professional after-sales
service. We need employees who are well trained, cosmopolitan and motivated. That´s why
we are constantly »in search of excellence«.
WE TAKE RESPONSIBILITY
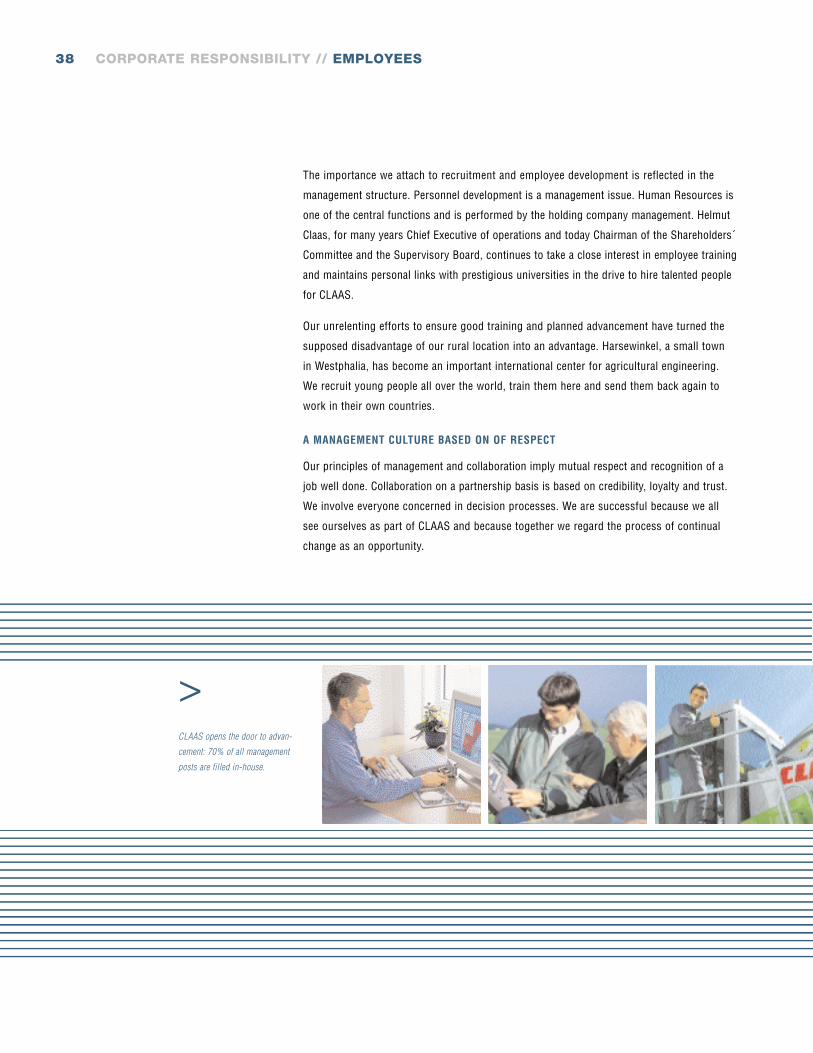
38 CORPORATE RESPONSIBILITY // EMPLOYEES
The importance we attach to recruitment and employee development is reflected in the
management structure. Personnel development is a management issue. Human Resources is
one of the central functions and is performed by the holding company management. Helmut
Claas, for many years Chief Executive of operations and today Chairman of the Shareholders´
Committee and the Supervisory Board, continues to take a close interest in employee training
and maintains personal links with prestigious universities in the drive to hire talented people
for CLAAS.
Our unrelenting efforts to ensure good training and planned advancement have turned the
supposed disadvantage of our rural location into an advantage. Harsewinkel, a small town
in Westphalia, has become an important international center for agricultural engineering.
We recruit young people all over the world, train them here and send them back again to
work in their own countries.
A MANAGEMENT CULTURE BASED ON OF RESPECT
Our principles of management and collaboration imply mutual respect and recognition of a
job well done. Collaboration on a partnership basis is based on credibility, loyalty and trust.
We involve everyone concerned in decision processes. We are successful because we all
see ourselves as part of CLAAS and because together we regard the process of continual
change as an opportunity.
>CLAAS opens the door to advan-
cement: 70% of all management
posts are filled in-house.
39
Our financial commitment to personnel development is above average. Expenditure under
this heading during the year under review amounted to over € 6 million, or 2.3% of total
personnel costs. Our training ratio of 7.5% is two to three per cent higher than the industry
average. During the year under review, 84 young people were taken on. At the end of the
year, we had 439 trainees in the Group.
THE CAREER LADDER IS OPEN TO EVERYONE
The CLAAS training and development schemes are based on an effective international
trainee programme and twin-track study at professional training institutions and colleges
of technology. As part of the strongly international trainee programme, university graduates
from a range of disciplines spend 12 to 18 months with the firm, moving from Production
to Administration to Sales and Marketing. To encourage self-reliance, the young people are
expected as far as possible to organize their training themselves, including the choice of
location for the mandatory time spent abroad and the main study topics. A Foreman Training
Programme for factory supervisors has also been introduced. This is aimed at employees
who have already started or who have completed master craftsman´s training. The programme,
of 12 to 18 months´ duration, is designed to prepare them for factory management positions.
CLAAS opens the door to advancement: 70% of all management posts are filled in-house.
Twin-track study at universities and colleges combined with practical experience at CLAAS,
a scheme which we pioneered, has proven to be an effective way of training highly qualified
staff with a commitment to the Group.
Our complete personnel development programme additionally comprises commercial and
technical advanced training in over 20 careers as well as a range of seminars to develop tech-
nical, method and social skills and use of foreign languages.
CLAAS ACADEMY: PLATFORM FOR KNOWLEDGE
We have institutionalized the gaining and exchange of knowledge by founding the CLAAS
ACADEMY. This is a worldwide training institution, open not only to CLAAS staff but also to
external service and sales specialists and agricultural engineering distributors. Each year, up
to 3,000 qualified employees follow training courses and do practical work in the field at our
training centers at Harsewinkel, Bad Saulgau, Metz, Belgograd in Russia and Kiev in Ukraine.
We equip staff from the engineering side with general product and service knowledge and
support our marketing specialists with sales arguments for our machines and systems.
40 CORPORATE RESPONSIBILITY // ENVIRONMENT AND SOCIETY
… FOR THE ENVIRONMENT AND SOCIETY
HELP WITH SOIL CONSERVATION
Agriculture is not possible without fertile, healthy soil. However, land is a scarce resource
and needs to be carefully managed. Every day, all round the world, farmers face the tricky
task of producing the food essential for life, on the one hand, and ensuring that the basis
of their work remains intact, on the other. Agriculture and environmental protection are
interdependent.
CLAAS helps to protect the soil. We are aware of our responsibility. We develop machines
to meet both economic and environmental demands in the closed system that is soil culti-
vation. We apply our expertise to developing such things as tyres and track systems to
distribute the heavy load over a large contact area. Compressed air regulating systems
enable the driver to adjust the tyre/ground interaction to the prevailing conditions. Many
of our large agricultural machines have a rubber-tracked ground drive, making them both
gentle on the soil and, at the same time, more economical. Specially developed machines
for tropical and subtropical zones enable sugar cane and maize to be harvested in a more
environmentally sound way. Integration of electronics makes agricultural engineering even
more efficient and environmentally compatible. Precision farming is the key. This means
focussing on specific parcels of land. Information about growing conditions is electronically
recorded and used in a closed precision farming circuit, with the aid of computer-assisted
equipment, to optimize sowing, fertilizing and plant protection. Fertilizer is only applied
where yields are poor, plant protection only where pests actually occur. Aided by modern
satellite systems such as the Global Positioning System (GPS), we play a leading role in
agricultural engineering.
ENVIROMENTAL PROTECTION STARTS AT HOME
At the Harsewinkel plant, the new paint line is approaching completion. This is a milestone
in the implementation of environmentally compatible production processes. The Federal
Ministry of the Environment is supporting the ´Construction of an innovative paint line´
pilot project with a total of € 2.8 million, under the »Investment programme for the reduction
of environmental pollution«. The paint line is the core of our new factory. A new surface
treatment method has been introduced to protect the environment.
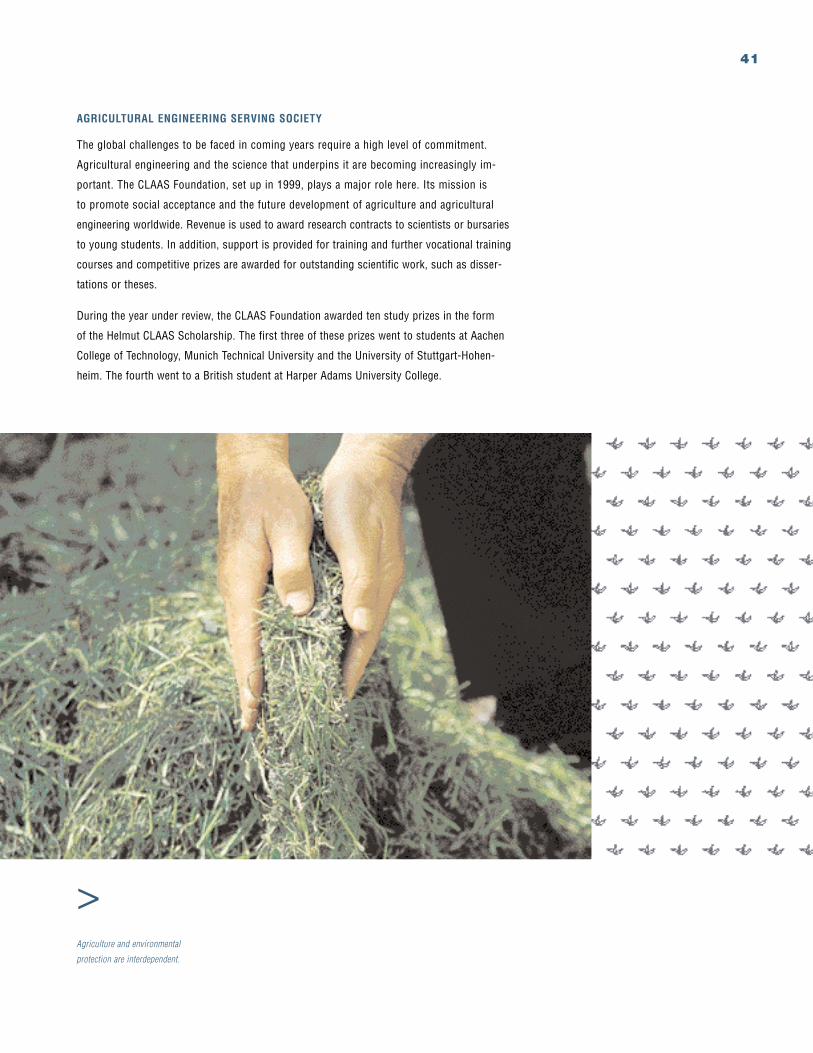
41
AGRICULTURAL ENGINEERING SERVING SOCIETY
The global challenges to be faced in coming years require a high level of commitment.
Agricultural engineering and the science that underpins it are becoming increasingly im-
portant. The CLAAS Foundation, set up in 1999, plays a major role here. Its mission is
to promote social acceptance and the future development of agriculture and agricultural
engineering worldwide. Revenue is used to award research contracts to scientists or bursaries
to young students. In addition, support is provided for training and further vocational training
courses and competitive prizes are awarded for outstanding scientific work, such as disser-
tations or theses.
During the year under review, the CLAAS Foundation awarded ten study prizes in the form
of the Helmut CLAAS Scholarship. The first three of these prizes went to students at Aachen
College of Technology, Munich Technical University and the University of Stuttgart-Hohen-
heim. The fourth went to a British student at Harper Adams University College.
>Agriculture and environmental
protection are interdependent.
42 CORPORATE RESPONSIBILITY // CUSTOMERS / BUSINESS PARTNERS / INVESTORS
… FOR CUSTOMERS AND BUSINESS PARTNERS
CLOSENESS TO THE CUSTOMER IS THE ANSWER
Farming – it sounds so simple: sowing, planting, harvesting. Farmers know better. Cultivating
the soil is a chain of processes that mesh like cogs in a gear-wheel. Farmers have to work
with varying field sizes, different types of soil, vegetation and harvesting conditions. Harvest
seasons are getting shorter and harvesting time is affected by weather and time of day. Machines
have to perform reliably at top output, whatever the weather or the state of the grain.
We know how hard business is for our customers. We are aware of their worries and their
needs. We understand their requirements and what they expect in terms of technology,
quality and service. Responsibility for the customer is our mission. This is demonstrated in
our products and our services. We have set up a comprehensive service and support network
and we assist with financing. It is a matter of course for us to offer help to customers who
get into difficulties through no fault of their own. When agriculture suffered flood damage in
the summer of 2002, we responded with an emergency aid programme, through our financ-
ing company. Customers who are wholly or partly unable to meet their obligations under
current credit and leasing agreements are offered support in the form of special deferral
and debt restructuring plans.
Trade fairs and exhibitions are an opportunity for us to meet our customers. In the autumn
of this year, we organized the World CLAAS Forum in France. The Forum ranks as one of the
big international events in agricultural engineering.
WIN-WIN PARTNERSHIPS
Global presence involves substantial financial and human resources. It requires willingness
to co-operate. We are forging partnerships on local markets. Collaboration and the interplay
of different skills and abilities in the areas of the product line, manufacture and distribution
build »win-win« partnerships for everyone concerned, without any loss of independence.
By developing local value added, we are working alongside domestic companies and helping
them progress along the often difficult path to own value added, particularly in the newly
industrializing countries. The transition from a machine exporter to a global group involves
more responsibility for foreign markets and players.
43
… AND FOR INVESTORS
ACCESS TO THE CAPITAL MARKETS
CLAAS is incorporated as a German »Kommanditgesellschaft auf Aktien mit beschränkter
Haftung« meaning, a commercial partnership limited by shares. Corporate governance is the
responsibility of the Supervisory Board and the Shareholders´ Committee; Helmut Claas is
Chairman of both these bodies. Operations are handled by the senior management team.
CLAAS KGaA mbH is a corporation that has full access to the capital markets, without
having to meet the formal requirements applying to a stock corporation. This legal form
takes special account of the requirements of a family firm.
TRANSPARENCY AND TRUST
Corporate governance covers all aspects of our business management and control oriented
to value added. It comprises the organization of the CLAAS Group, the strategic principles
and guidelines and the system of internal control and monitoring mechanisms. Transparent,
efficient corporate governance is the basis for investor confidence in CLAAS.
Management and control are based on the interaction of the Executive Board, the Super-
visory Board and the Shareholders´ Committee. The Executive Board runs the business on
its own responsibility and its decisions are guided by our governing slogan for this year´s
report, Sustainable Growth. The Executive Board reports to the Shareholders´ Committee
and the Supervisory Board regularly, promptly and comprehensively on all matters relevant
to the Group. The Supervisory Board oversees and advises the senior management team in
connection with the running of the business. The Board has twelve members, including six
employee representatives. The Shareholders´ Committee advises and assists the Executive.
This consists of the family shareholders and external representatives of the German economy.
We have clearly defined our business principles and the guiding principles of our conduct
and these are firmly established at all levels of the organization and at all our sites. They
are binding on all our employees. The guiding principles are based on integrity and loyalty
and are fundamental to the main pillars of our corporate philosophy: innovative products,
customized solutions, high productivity, first-class distribution and service and, finally,
responsibility towards society and the environment.
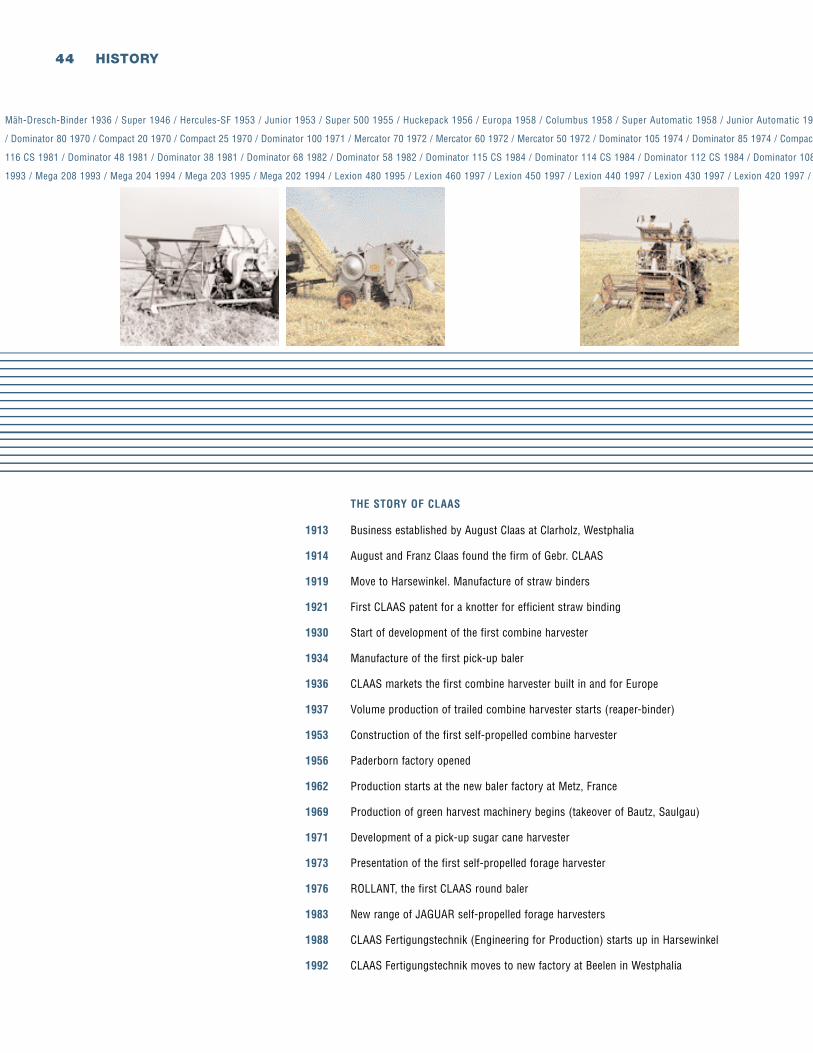
44 HISTORY
THE STORY OF CLAAS
1913 Business established by August Claas at Clarholz, Westphalia
1914 August and Franz Claas found the firm of Gebr. CLAAS
1919 Move to Harsewinkel. Manufacture of straw binders
1921 First CLAAS patent for a knotter for efficient straw binding
1930 Start of development of the first combine harvester
1934 Manufacture of the first pick-up baler
1936 CLAAS markets the first combine harvester built in and for Europe
1937 Volume production of trailed combine harvester starts (reaper-binder)
1953 Construction of the first self-propelled combine harvester
1956 Paderborn factory opened
1962 Production starts at the new baler factory at Metz, France
1969 Production of green harvest machinery begins (takeover of Bautz, Saulgau)
1971 Development of a pick-up sugar cane harvester
1973 Presentation of the first self-propelled forage harvester
1976 ROLLANT, the first CLAAS round baler
1983 New range of JAGUAR self-propelled forage harvesters
1988 CLAAS Fertigungstechnik (Engineering for Production) starts up in Harsewinkel
1992 CLAAS Fertigungstechnik moves to new factory at Beelen in Westphalia
Mäh-Dresch-Binder 1936 / Super 1946 / Hercules-SF 1953 / Junior 1953 / Super 500 1955 / Huckepack 1956 / Europa 1958 / Columbus 1958 / Super Automatic 1958 / Junior Automatic 195
/ Dominator 80 1970 / Compact 20 1970 / Compact 25 1970 / Dominator 100 1971 / Mercator 70 1972 / Mercator 60 1972 / Mercator 50 1972 / Dominator 105 1974 / Dominator 85 1974 / Compact
116 CS 1981 / Dominator 48 1981 / Dominator 38 1981 / Dominator 68 1982 / Dominator 58 1982 / Dominator 115 CS 1984 / Dominator 114 CS 1984 / Dominator 112 CS 1984 / Dominator 108
1993 / Mega 208 1993 / Mega 204 1994 / Mega 203 1995 / Mega 202 1994 / Lexion 480 1995 / Lexion 460 1997 / Lexion 450 1997 / Lexion 440 1997 / Lexion 430 1997 / Lexion 420 1997 /
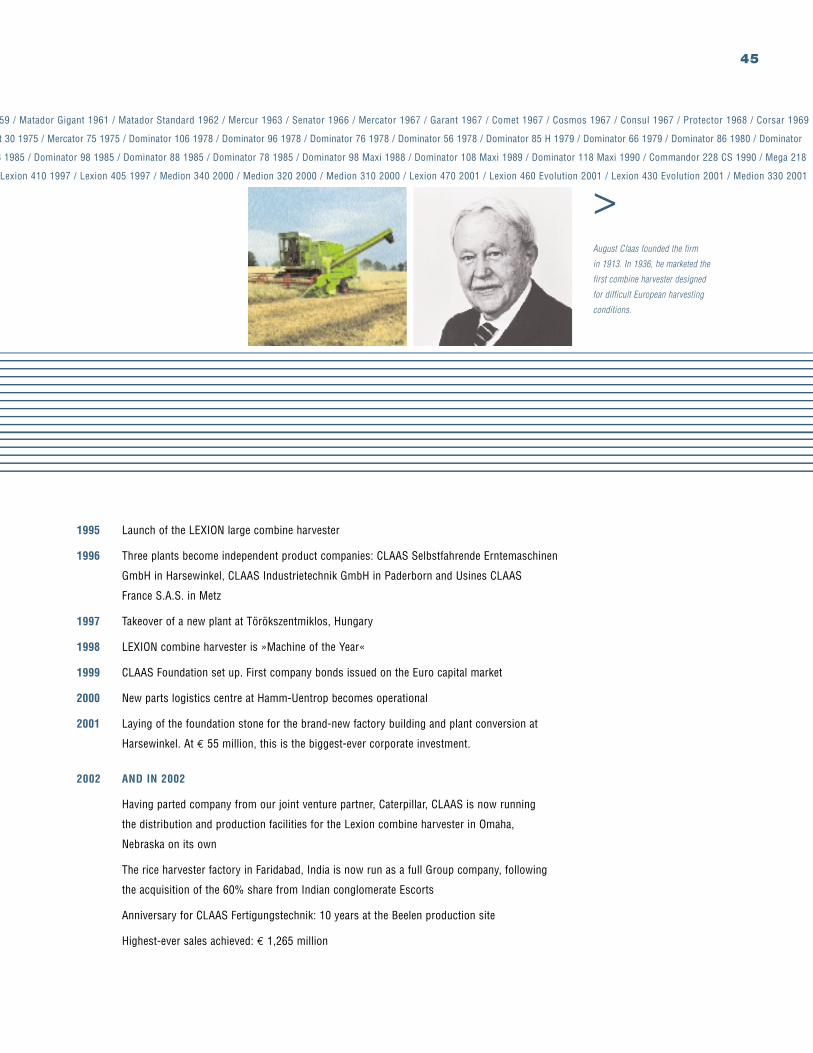
45
1995 Launch of the LEXION large combine harvester
1996 Three plants become independent product companies: CLAAS Selbstfahrende Erntemaschinen
GmbH in Harsewinkel, CLAAS Industrietechnik GmbH in Paderborn and Usines CLAAS
France S.A.S. in Metz
1997 Takeover of a new plant at Törökszentmiklos, Hungary
1998 LEXION combine harvester is »Machine of the Year«
1999 CLAAS Foundation set up. First company bonds issued on the Euro capital market
2000 New parts logistics centre at Hamm-Uentrop becomes operational
2001 Laying of the foundation stone for the brand-new factory building and plant conversion at
Harsewinkel. At € 55 million, this is the biggest-ever corporate investment.
2002 AND IN 2002
Having parted company from our joint venture partner, Caterpillar, CLAAS is now running
the distribution and production facilities for the Lexion combine harvester in Omaha,
Nebraska on its own
The rice harvester factory in Faridabad, India is now run as a full Group company, following
the acquisition of the 60% share from Indian conglomerate Escorts
Anniversary for CLAAS Fertigungstechnik: 10 years at the Beelen production site
Highest-ever sales achieved: € 1,265 million
59 / Matador Gigant 1961 / Matador Standard 1962 / Mercur 1963 / Senator 1966 / Mercator 1967 / Garant 1967 / Comet 1967 / Cosmos 1967 / Consul 1967 / Protector 1968 / Corsar 1969
t 30 1975 / Mercator 75 1975 / Dominator 106 1978 / Dominator 96 1978 / Dominator 76 1978 / Dominator 56 1978 / Dominator 85 H 1979 / Dominator 66 1979 / Dominator 86 1980 / Dominator
8 1985 / Dominator 98 1985 / Dominator 88 1985 / Dominator 78 1985 / Dominator 98 Maxi 1988 / Dominator 108 Maxi 1989 / Dominator 118 Maxi 1990 / Commandor 228 CS 1990 / Mega 218
Lexion 410 1997 / Lexion 405 1997 / Medion 340 2000 / Medion 320 2000 / Medion 310 2000 / Lexion 470 2001 / Lexion 460 Evolution 2001 / Lexion 430 Evolution 2001 / Medion 330 2001
>August Claas founded the firm
in 1913. In 1936, he marketed the
first combine harvester designed
for difficult European harvesting
conditions.
MANAGEMENT REPORT
48 Industry Development
50 Net Sales
52 Result
54 Investment
55 Cash flow
57 Liquidity and Financing
58 Assets
60 Research and Development
61 Outlook
62 Risk Management
64 Management Statement
CONSOLIDATED FINANCIAL STATEMENTS IN ACCORDANCE WITH US GAAP
65 Independent Auditor´s Report
66 Consolidated Profit and Loss Account
67 Consolidated Balance Sheet
68 Cash flow Statement
69 Movements in Consolidated Equity
70 Movements in Consolidated Fixed Assets
72 Related Companies and significant Shares in related Companies
74 Notes
MANAGEMENT REPORTCONSOLIDATED FINANCIAL STATEMENTS
48 MANAGEMENT REPORT
INDUSTRY DEVELOPMENT
AGRICULTURAL INDUSTRY´S CAPITAL EXPENDITURE ON MODERN TECHNOLOGY PICKS UP IN 2002
After an overall declining market development in the year 2001, the capital expenditure on agricultural
engineering in Europe clearly increased again in the year under review. Relatively good producer prices
raised the income of farmers in the EU countries by more than 3% on average and these prices formed
the basis for more machine purchases. Sales notably moved up in Great Britain and Scandinavia.
On the German market, the plus amounted to more than 20% in the first six months, but the order intake
in the industry declined again from early summer; overall, the market volume increased by about 10%.
France, as the most important individual market in Europe – apart from Germany – currently benefits from
relatively high producer prices for agricultural products. The good harvest in 2002 contributed to a new
income growth of the farmers.
On the Spanish and the Italian market, the sales were in line with the prior year level.
Great Britain recorded an unexpected positive growth in the year under review, even if on a low basis.
The farmers affected by the foot and mouth disease received high compensation payments, which they
often invested in machines. Due to the general bad mood in the agricultural industry as a result of the
significant contraction process in the last years, no significantly higher capital expenditure is, however,
to be expected in the future.
An important and growing sales market for the agricultural engineering industry are the countries of Cen-
tral and Eastern Europe with an enormous deficit in modern, powerful agricultural machines. The Central
European countries developed a remarkable dynamism. On account of the imminent entry into the EU and
the clearly increasing competitiveness on the international markets, the acceding countries will in future
play an even more prominent role for Western manufacturers of agricultural engineering.
MANAGEMENT REPORTOF CLAAS GROUP
49
The forthcoming EU entry increases the competitive pressures on the agricultural industry and accele-
rates the urgently required decisions on capital expenditure for modern agricultural machines. The high
backlog demand will ensure continuing growth for years to come. Among the acceding countries,
notably Poland, the Czech Republic and Hungary have turned into strong sales markets.
An improved sales development affects Eastern Europe differently. In Russia, the existing political
constellation offers more stability and security for investments. Related with this is, however, that –
supported by government sales financing programs – machines from Russian production could improve
their position on their own markets. Other sales markets in the CIS region developed more positively
for Western agricultural engineering products.
The North American agricultural engineering market declined slightly on the whole in the year 2002.
The sales of combine harvesters, which had been rising again in 2001 after two poor previous years,
fell once more in 2002. Positive effects on capital expenditure are to be expected from the new Farm Bill,
which will define the framework conditions until the year 2007 and will step up the subsidies for the
US farmers to about US$ 182 billion.
The most important agricultural markets in South America are Brazil and Argentina. The agricultural
sector in Brazil continued to grow in the year 2002. The good sales of agricultural machines were deter-
mined to a high degree by the government financing programs with privileged interest rates.
In Argentina, the national currency peso has lost more than 70% of its value since its decoupling from
the dollar, experiencing inflation of more than 20% since then. Theoretically, the agricultural industry as
an export sector benefits from the cessation of the dollar coupling, but it lacks the funds to purchase
the required production facilities. In line with the current revenue situation, the agricultural engineering
demand of the operations is very weak.
The markets for agricultural engineering in Asia have a heterogeneous structure. More developed coun-
tries such as Japan, Taiwan and Korea contrast with the huge, but still underdeveloped markets of India
and China. While the Chinese market is much more characterized by human labor, India shows more
intensive approaches towards mechanizing the agricultural industry.
50 MANAGEMENT REPORT
RECORD SALES: INCREASE BY 10%
CLAAS continued to develop positively in the year 2002*. The sales clearly increased by 10% to € 1,265.5
million, thus exceeding the prior year record.
In Germany, CLAAS disproportionately benefited from the recovery of the domestic agricultural engi-
neering market. Domestic sales increased by 24.4% to € 443.8 million. This increase resulted in a
further expansion of the market leadership. The combine harvester market in the East German federal
states, where highly powerful machines, as offered by CLAAS, are in demand on account of the large
area cultivation, showed particularly strong growth. The bad weather conditions in summer 2002,
which interfered with the harvest and led to a shortage of threshing capacities, triggered new
acquisitions.
Sales in the other EU countries increased in total by 2.4% to € 460.7 million. On the most important
individual markets France and Great Britain, CLAAS achieved growth rates of 3% and 6%, respectively.
In France, the overall market, which had been declining for three years, stabilized. In Great Britain,
the trend reversal, which started in the prior year continued. CLAAS generated above-average sales
growth in the Scandinavian countries and in Austria. In Italy and Spain, however,
sales declined by 6%, respectively.
For three years, CLAAS has now generated a constant sales growth in the Central European countries.
The high backlog demand for capital expenditure on modern agricultural machines also promises a
growing sales potential for the coming years, in which CLAAS will clearly participate on account of
its early and extensive involvement on these markets. In the year under review, the sales with the
Central European countries increased by 65% in total, reaching € 124.2 million. The development
was particularly expansive in the future EU acceding countries. In some of these countries, CLAAS
more than doubled the prior year sales.
*The annual figures refer to the respective business years.
33.434.530.3
35.1
31.11,0721,038
1,108
1,2651,148
Sales share domestic in %
Sales share foreign in %
(*Figures based on German GAAP)
SALES in € million
66.665.569.7
64.968.9
98* 99* 00 01 02
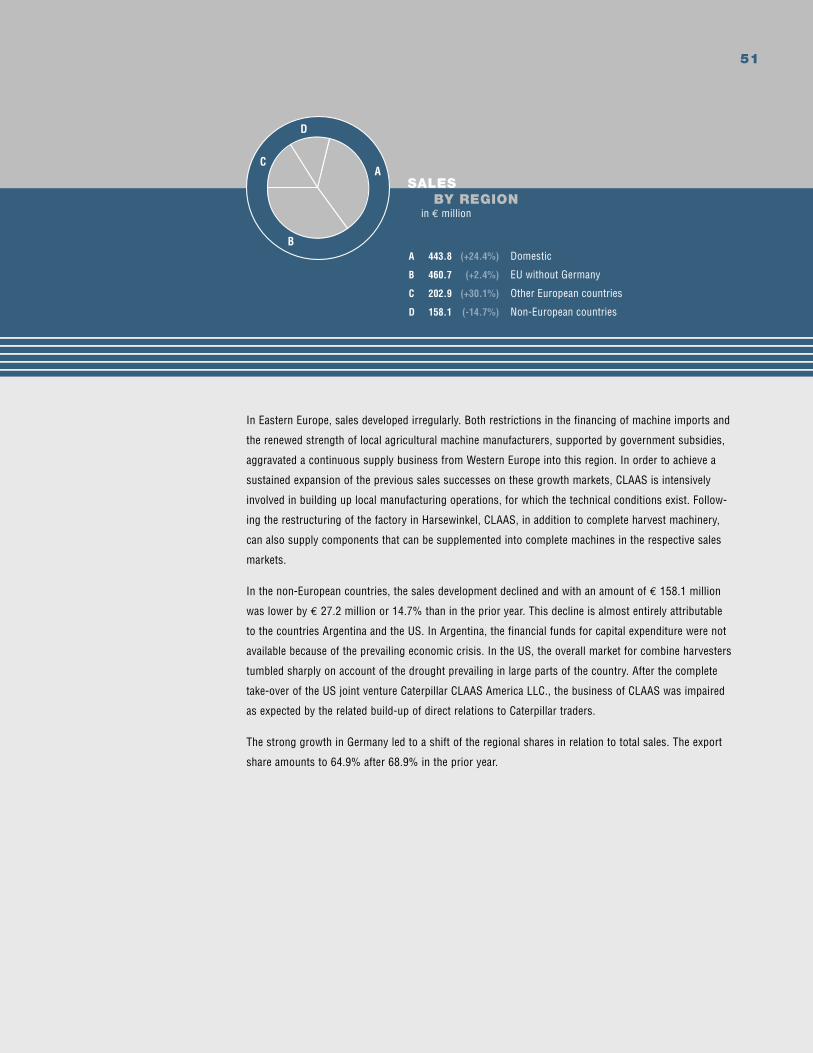
51
In Eastern Europe, sales developed irregularly. Both restrictions in the financing of machine imports and
the renewed strength of local agricultural machine manufacturers, supported by government subsidies,
aggravated a continuous supply business from Western Europe into this region. In order to achieve a
sustained expansion of the previous sales successes on these growth markets, CLAAS is intensively
involved in building up local manufacturing operations, for which the technical conditions exist. Follow-
ing the restructuring of the factory in Harsewinkel, CLAAS, in addition to complete harvest machinery,
can also supply components that can be supplemented into complete machines in the respective sales
markets.
In the non-European countries, the sales development declined and with an amount of € 158.1 million
was lower by € 27.2 million or 14.7% than in the prior year. This decline is almost entirely attributable
to the countries Argentina and the US. In Argentina, the financial funds for capital expenditure were not
available because of the prevailing economic crisis. In the US, the overall market for combine harvesters
tumbled sharply on account of the drought prevailing in large parts of the country. After the complete
take-over of the US joint venture Caterpillar CLAAS America LLC., the business of CLAAS was impaired
as expected by the related build-up of direct relations to Caterpillar traders.
The strong growth in Germany led to a shift of the regional shares in relation to total sales. The export
share amounts to 64.9% after 68.9% in the prior year.
A 443.8 (+24.4%) Domestic
B 460.7 (+2.4%) EU without Germany
C 202.9 (+30.1%) Other European countries
D 158.1 (-14.7%) Non-European countries
SALES BY REGION in € million
C
D
B
A
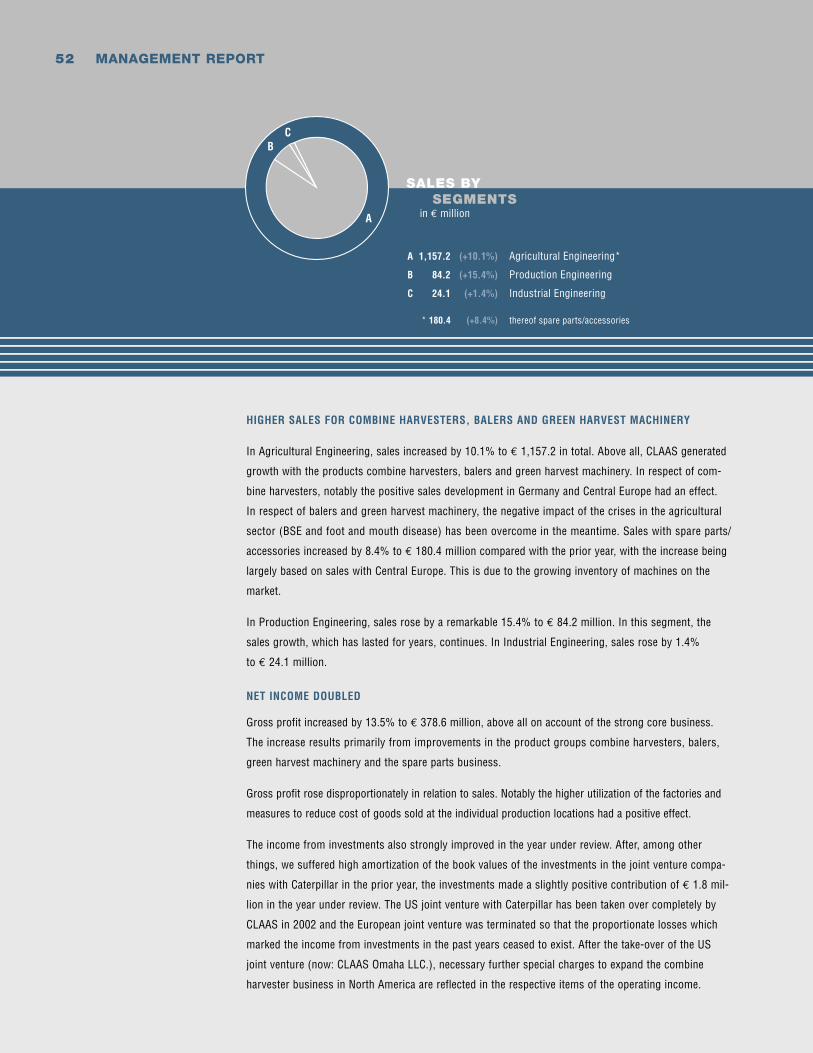
52 MANAGEMENT REPORT
HIGHER SALES FOR COMBINE HARVESTERS, BALERS AND GREEN HARVEST MACHINERY
In Agricultural Engineering, sales increased by 10.1% to € 1,157.2 in total. Above all, CLAAS generated
growth with the products combine harvesters, balers and green harvest machinery. In respect of com-
bine harvesters, notably the positive sales development in Germany and Central Europe had an effect.
In respect of balers and green harvest machinery, the negative impact of the crises in the agricultural
sector (BSE and foot and mouth disease) has been overcome in the meantime. Sales with spare parts/
accessories increased by 8.4% to € 180.4 million compared with the prior year, with the increase being
largely based on sales with Central Europe. This is due to the growing inventory of machines on the
market.
In Production Engineering, sales rose by a remarkable 15.4% to € 84.2 million. In this segment, the
sales growth, which has lasted for years, continues. In Industrial Engineering, sales rose by 1.4%
to € 24.1 million.
NET INCOME DOUBLED
Gross profit increased by 13.5% to € 378.6 million, above all on account of the strong core business.
The increase results primarily from improvements in the product groups combine harvesters, balers,
green harvest machinery and the spare parts business.
Gross profit rose disproportionately in relation to sales. Notably the higher utilization of the factories and
measures to reduce cost of goods sold at the individual production locations had a positive effect.
The income from investments also strongly improved in the year under review. After, among other
things, we suffered high amortization of the book values of the investments in the joint venture compa-
nies with Caterpillar in the prior year, the investments made a slightly positive contribution of € 1.8 mil-
lion in the year under review. The US joint venture with Caterpillar has been taken over completely by
CLAAS in 2002 and the European joint venture was terminated so that the proportionate losses which
marked the income from investments in the past years ceased to exist. After the take-over of the US
joint venture (now: CLAAS Omaha LLC.), necessary further special charges to expand the combine
harvester business in North America are reflected in the respective items of the operating income.
A 1,157.2 (+10.1%) Agricultural Engineering*
B 84.2 (+15.4%) Production Engineering
C 24.1 (+1.4%) Industrial Engineering
* 180.4 (+8.4%) thereof spare parts/accessories
SALES BY SEGMENTS in € million
CB
A
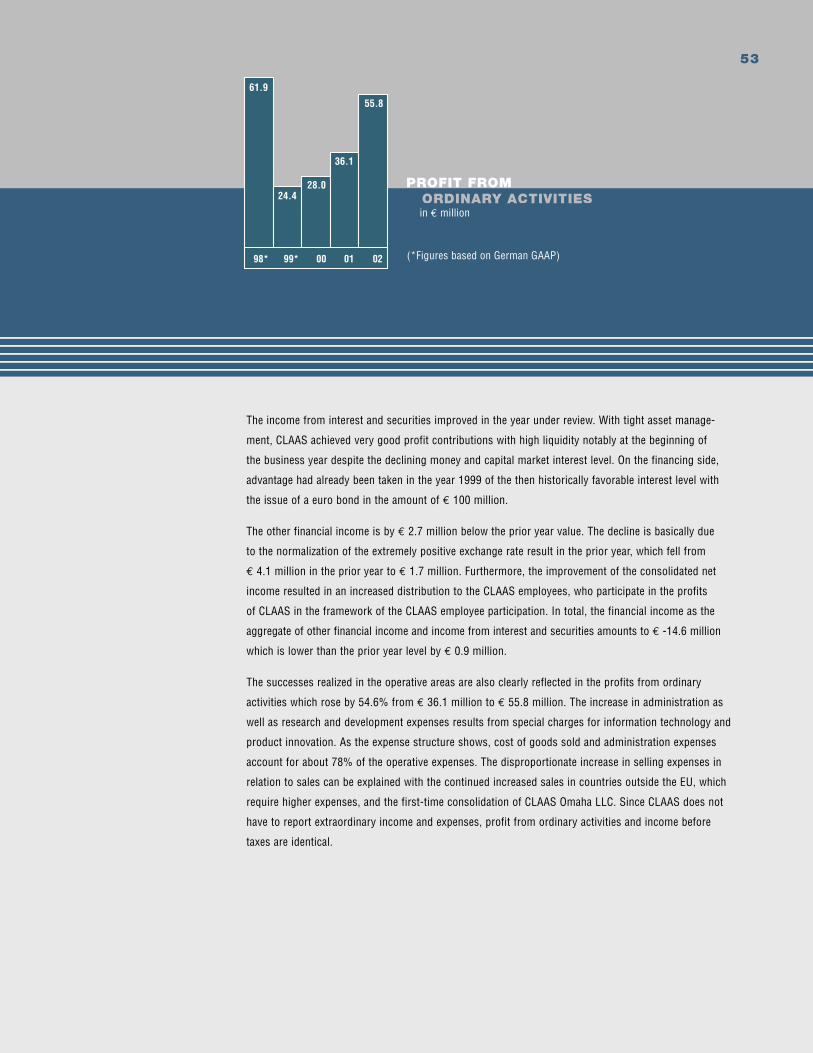
53
The income from interest and securities improved in the year under review. With tight asset manage-
ment, CLAAS achieved very good profit contributions with high liquidity notably at the beginning of
the business year despite the declining money and capital market interest level. On the financing side,
advantage had already been taken in the year 1999 of the then historically favorable interest level with
the issue of a euro bond in the amount of € 100 million.
The other financial income is by € 2.7 million below the prior year value. The decline is basically due
to the normalization of the extremely positive exchange rate result in the prior year, which fell from
€ 4.1 million in the prior year to € 1.7 million. Furthermore, the improvement of the consolidated net
income resulted in an increased distribution to the CLAAS employees, who participate in the profits
of CLAAS in the framework of the CLAAS employee participation. In total, the financial income as the
aggregate of other financial income and income from interest and securities amounts to € -14.6 million
which is lower than the prior year level by € 0.9 million.
The successes realized in the operative areas are also clearly reflected in the profits from ordinary
activities which rose by 54.6% from € 36.1 million to € 55.8 million. The increase in administration as
well as research and development expenses results from special charges for information technology and
product innovation. As the expense structure shows, cost of goods sold and administration expenses
account for about 78% of the operative expenses. The disproportionate increase in selling expenses in
relation to sales can be explained with the continued increased sales in countries outside the EU, which
require higher expenses, and the first-time consolidation of CLAAS Omaha LLC. Since CLAAS does not
have to report extraordinary income and expenses, profit from ordinary activities and income before
taxes are identical.
(*Figures based on German GAAP)
PROFIT FROM ORDINARY ACTIVITIES in € million
28.024.4
61.9
55.8
36.1
98* 99* 00 01 02
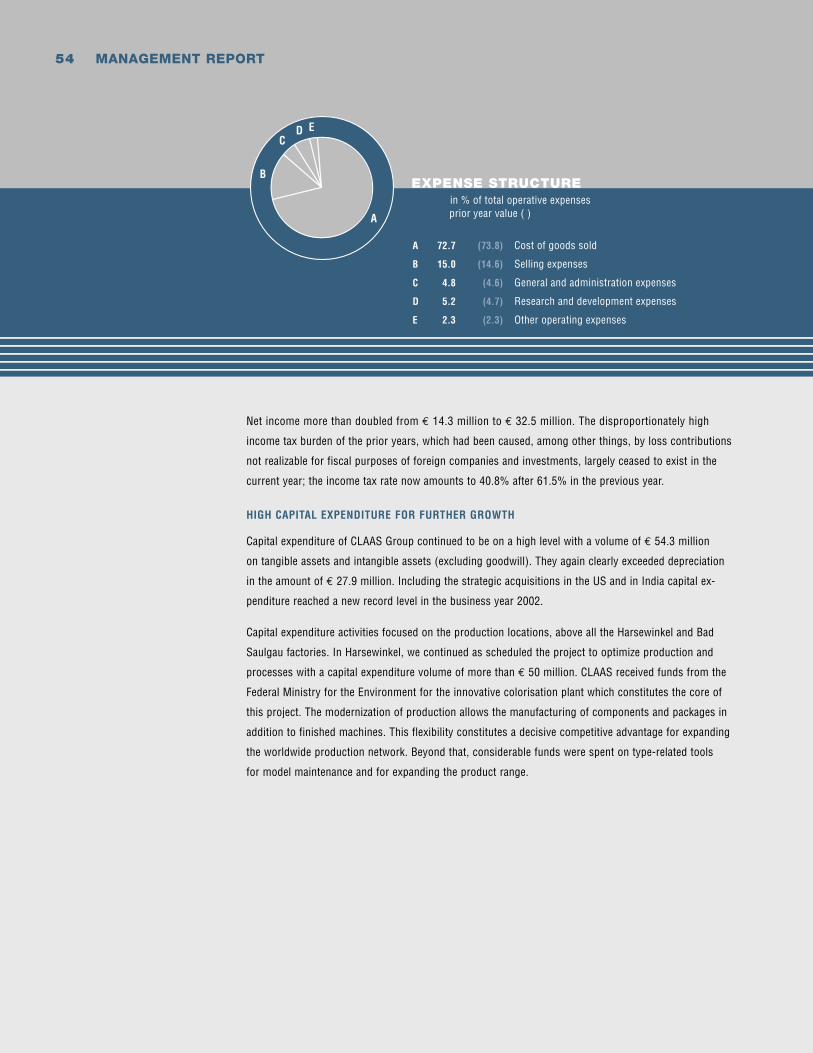
54 MANAGEMENT REPORT
Net income more than doubled from € 14.3 million to € 32.5 million. The disproportionately high
income tax burden of the prior years, which had been caused, among other things, by loss contributions
not realizable for fiscal purposes of foreign companies and investments, largely ceased to exist in the
current year; the income tax rate now amounts to 40.8% after 61.5% in the previous year.
HIGH CAPITAL EXPENDITURE FOR FURTHER GROWTH
Capital expenditure of CLAAS Group continued to be on a high level with a volume of € 54.3 million
on tangible assets and intangible assets (excluding goodwill). They again clearly exceeded depreciation
in the amount of € 27.9 million. Including the strategic acquisitions in the US and in India capital ex-
penditure reached a new record level in the business year 2002.
Capital expenditure activities focused on the production locations, above all the Harsewinkel and Bad
Saulgau factories. In Harsewinkel, we continued as scheduled the project to optimize production and
processes with a capital expenditure volume of more than € 50 million. CLAAS received funds from the
Federal Ministry for the Environment for the innovative colorisation plant which constitutes the core of
this project. The modernization of production allows the manufacturing of components and packages in
addition to finished machines. This flexibility constitutes a decisive competitive advantage for expanding
the worldwide production network. Beyond that, considerable funds were spent on type-related tools
for model maintenance and for expanding the product range.
A 72.7 (73.8) Cost of goods sold
B 15.0 (14.6) Selling expenses
C 4.8 (4.6) General and administration expenses
D 5.2 (4.7) Research and development expenses
E 2.3 (2.3) Other operating expenses
EXPENSE STRUCTURE in % of total operative expenses prior year value ( )
CD E
B
A
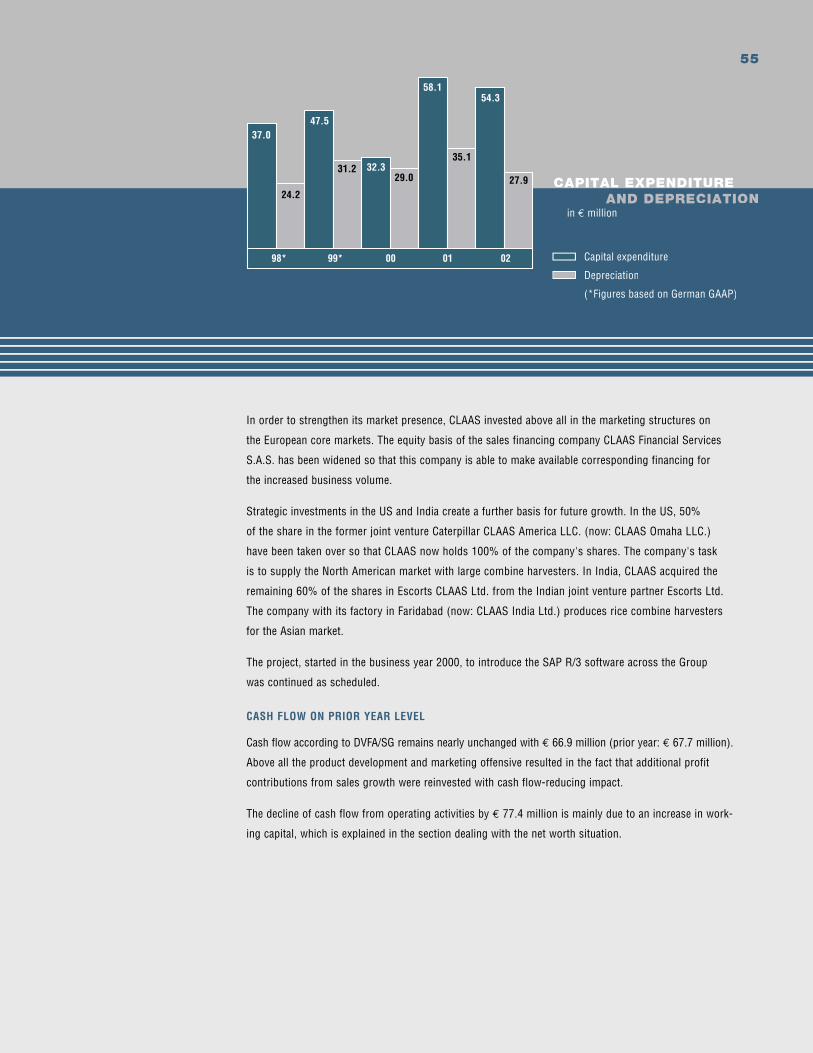
55
In order to strengthen its market presence, CLAAS invested above all in the marketing structures on
the European core markets. The equity basis of the sales financing company CLAAS Financial Services
S.A.S. has been widened so that this company is able to make available corresponding financing for
the increased business volume.
Strategic investments in the US and India create a further basis for future growth. In the US, 50%
of the share in the former joint venture Caterpillar CLAAS America LLC. (now: CLAAS Omaha LLC.)
have been taken over so that CLAAS now holds 100% of the company's shares. The company's task
is to supply the North American market with large combine harvesters. In India, CLAAS acquired the
remaining 60% of the shares in Escorts CLAAS Ltd. from the Indian joint venture partner Escorts Ltd.
The company with its factory in Faridabad (now: CLAAS India Ltd.) produces rice combine harvesters
for the Asian market.
The project, started in the business year 2000, to introduce the SAP R/3 software across the Group
was continued as scheduled.
CASH FLOW ON PRIOR YEAR LEVEL
Cash flow according to DVFA/SG remains nearly unchanged with € 66.9 million (prior year: € 67.7 million).
Above all the product development and marketing offensive resulted in the fact that additional profit
contributions from sales growth were reinvested with cash flow-reducing impact.
The decline of cash flow from operating activities by € 77.4 million is mainly due to an increase in work-
ing capital, which is explained in the section dealing with the net worth situation.
CAPITAL EXPENDITURE AND DEPRECIATION in € million
29.0
35.1
27.9
54.3
37.047.5
24.2
Capital expenditure
Depreciation
(*Figures based on German GAAP)
98 * 99* 00 01 02
32.3
58.1
31.2
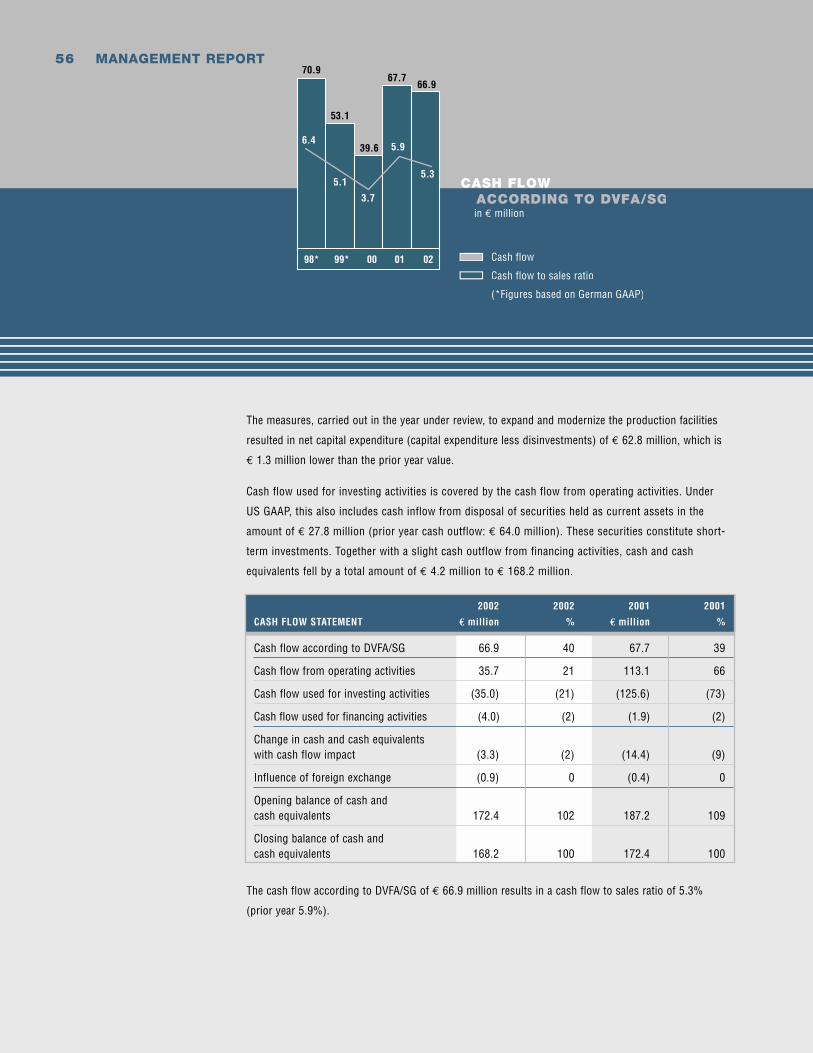
56 MANAGEMENT REPORT
The measures, carried out in the year under review, to expand and modernize the production facilities
resulted in net capital expenditure (capital expenditure less disinvestments) of € 62.8 million, which is
€ 1.3 million lower than the prior year value.
Cash flow used for investing activities is covered by the cash flow from operating activities. Under
US GAAP, this also includes cash inflow from disposal of securities held as current assets in the
amount of € 27.8 million (prior year cash outflow: € 64.0 million). These securities constitute short-
term investments. Together with a slight cash outflow from financing activities, cash and cash
equivalents fell by a total amount of € 4.2 million to € 168.2 million.
The cash flow according to DVFA/SG of € 66.9 million results in a cash flow to sales ratio of 5.3%
(prior year 5.9%).
2002 2002 2001 2001
CASH FLOW STATEMENT € million % € million %
Cash flow according to DVFA/SG 66.9 40 67.7 39
Cash flow from operating activities 35.7 21 113.1 66
Cash flow used for investing activities (35.0) (21) (125.6) (73)
Cash flow used for financing activities (4.0) (2) (1.9) (2)
Change in cash and cash equivalents with cash flow impact (3.3) (2) (14.4) (9)
Influence of foreign exchange (0.9) 0 (0.4) 0
Opening balance of cash and cash equivalents 172.4 102 187.2 109
Closing balance of cash and cash equivalents 168.2 100 172.4 100
CASH FLOW ACCORDING TO DVFA/SG in € million
3.7
5.1
6.4
5.3
5.939.6
53.1
70.966.9
67.7
98* 99* 00 01 02 Cash flow
Cash flow to sales ratio
(*Figures based on German GAAP)
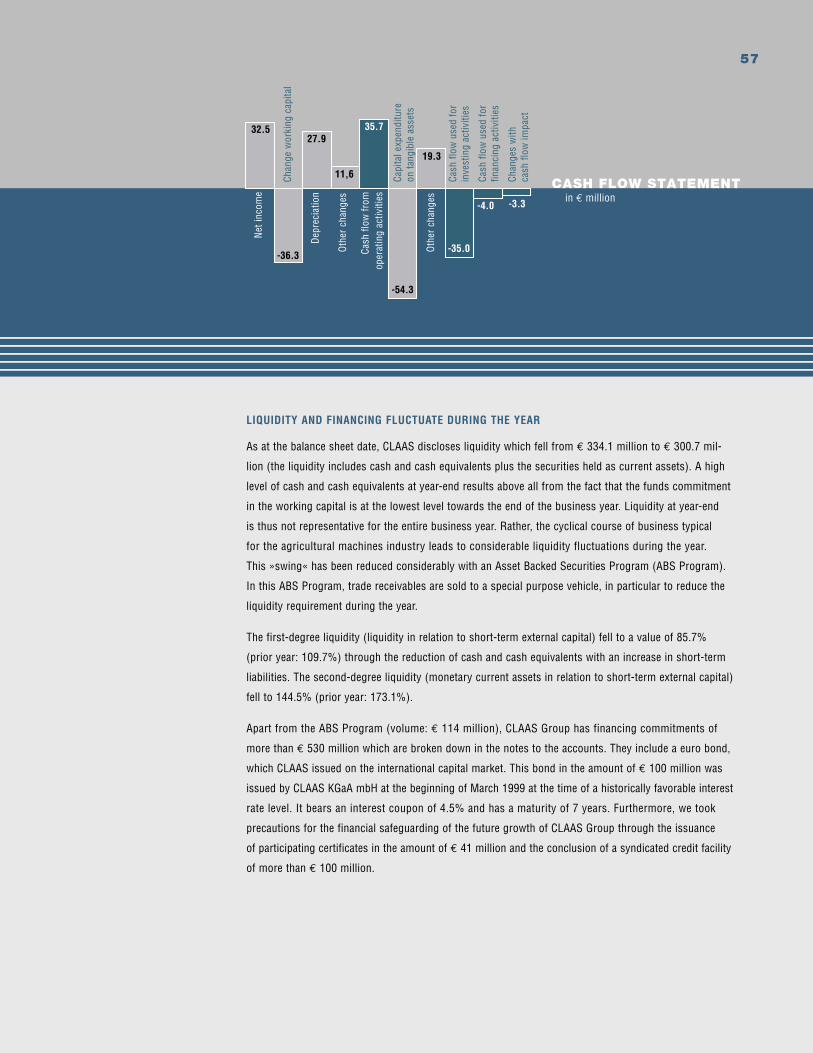
57
LIQUIDITY AND FINANCING FLUCTUATE DURING THE YEAR
As at the balance sheet date, CLAAS discloses liquidity which fell from € 334.1 million to € 300.7 mil-
lion (the liquidity includes cash and cash equivalents plus the securities held as current assets). A high
level of cash and cash equivalents at year-end results above all from the fact that the funds commitment
in the working capital is at the lowest level towards the end of the business year. Liquidity at year-end
is thus not representative for the entire business year. Rather, the cyclical course of business typical
for the agricultural machines industry leads to considerable liquidity fluctuations during the year.
This »swing« has been reduced considerably with an Asset Backed Securities Program (ABS Program).
In this ABS Program, trade receivables are sold to a special purpose vehicle, in particular to reduce the
liquidity requirement during the year.
The first-degree liquidity (liquidity in relation to short-term external capital) fell to a value of 85.7%
(prior year: 109.7%) through the reduction of cash and cash equivalents with an increase in short-term
liabilities. The second-degree liquidity (monetary current assets in relation to short-term external capital)
fell to 144.5% (prior year: 173.1%).
Apart from the ABS Program (volume: € 114 million), CLAAS Group has financing commitments of
more than € 530 million which are broken down in the notes to the accounts. They include a euro bond,
which CLAAS issued on the international capital market. This bond in the amount of € 100 million was
issued by CLAAS KGaA mbH at the beginning of March 1999 at the time of a historically favorable interest
rate level. It bears an interest coupon of 4.5% and has a maturity of 7 years. Furthermore, we took
precautions for the financial safeguarding of the future growth of CLAAS Group through the issuance
of participating certificates in the amount of € 41 million and the conclusion of a syndicated credit facility
of more than € 100 million.
CASH FLOW STATEMENT in € million
-35.0
19.3
-54.3
-3.3-4.0
27.9
-36.3
32.5 35.7
11,6
Oth
er c
hang
es
Chan
ges
with
cash
flow
impa
ct
Cash
flow
use
d fo
r
inve
stin
g ac
tiviti
es
Capi
tal e
xpen
ditu
re
on ta
ngib
le a
sset
s
Cash
flow
use
d fo
r
finan
cing
act
iviti
es
Net
inco
me
Chan
ge w
orki
ng c
apita
l
Dep
reci
atio
n
Oth
er c
hang
es
Cash
flow
from
oper
atin
g ac
tiviti
es
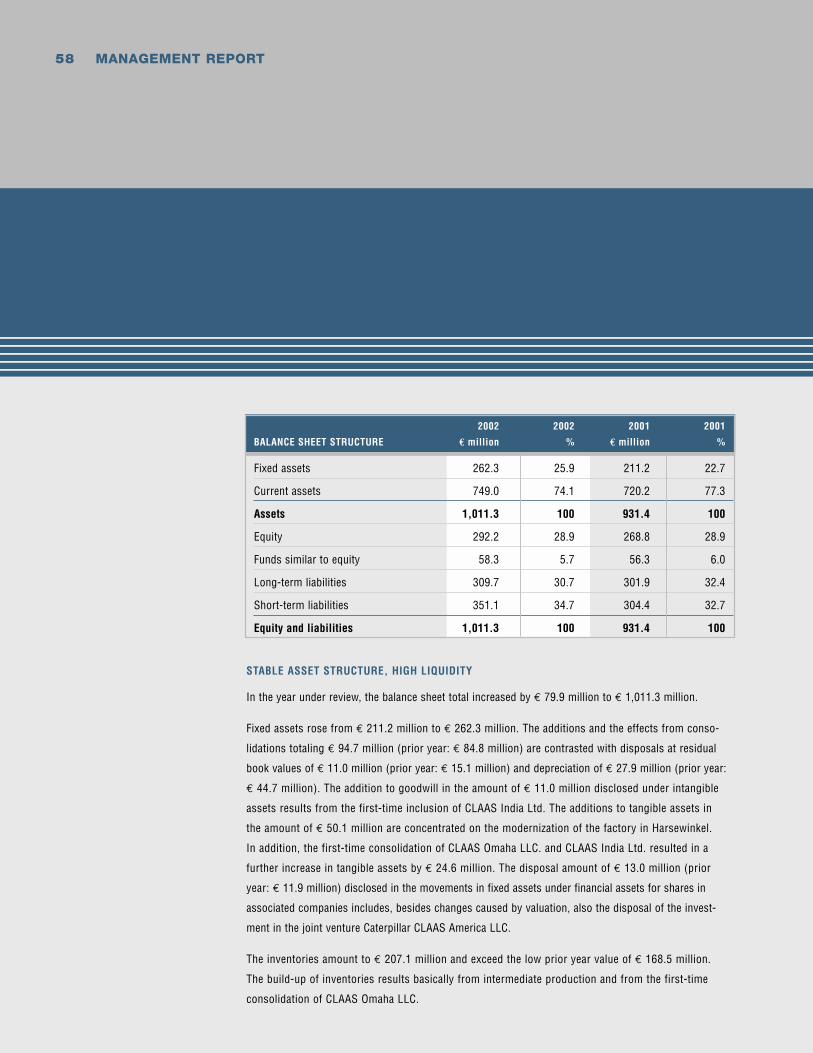
58 MANAGEMENT REPORT
STABLE ASSET STRUCTURE, HIGH LIQUIDITY
In the year under review, the balance sheet total increased by € 79.9 million to € 1,011.3 million.
Fixed assets rose from € 211.2 million to € 262.3 million. The additions and the effects from conso-
lidations totaling € 94.7 million (prior year: € 84.8 million) are contrasted with disposals at residual
book values of € 11.0 million (prior year: € 15.1 million) and depreciation of € 27.9 million (prior year:
€ 44.7 million). The addition to goodwill in the amount of € 11.0 million disclosed under intangible
assets results from the first-time inclusion of CLAAS India Ltd. The additions to tangible assets in
the amount of € 50.1 million are concentrated on the modernization of the factory in Harsewinkel.
In addition, the first-time consolidation of CLAAS Omaha LLC. and CLAAS India Ltd. resulted in a
further increase in tangible assets by € 24.6 million. The disposal amount of € 13.0 million (prior
year: € 11.9 million) disclosed in the movements in fixed assets under financial assets for shares in
associated companies includes, besides changes caused by valuation, also the disposal of the invest-
ment in the joint venture Caterpillar CLAAS America LLC.
The inventories amount to € 207.1 million and exceed the low prior year value of € 168.5 million.
The build-up of inventories results basically from intermediate production and from the first-time
consolidation of CLAAS Omaha LLC.
2002 2002 2001 2001
BALANCE SHEET STRUCTURE € million % € million %
Fixed assets 262.3 25.9 211.2 22.7
Current assets 749.0 74.1 720.2 77.3
Assets 1,011.3 100 931.4 100
Equity 292.2 28.9 268.8 28.9
Funds similar to equity 58.3 5.7 56.3 6.0
Long-term liabilities 309.7 30.7 301.9 32.4
Short-term liabilities 351.1 34.7 304.4 32.7
Equity and liabilities 1,011.3 100 931.4 100
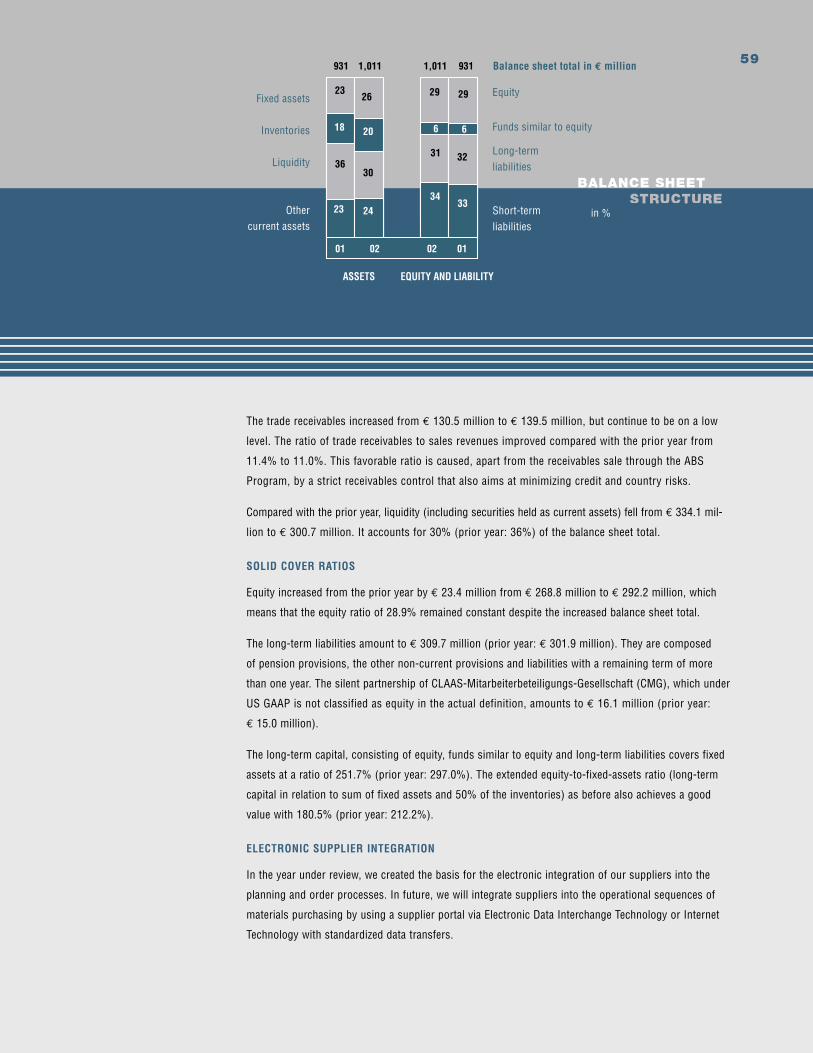
59
BALANCE SHEET STRUCTURE in %
ASSETS EQUITY AND LIABILITY
931 1,011 1,011 931
20
30
24
18
36
23
32
29
33
23 26
6
31
29
34
6
01 02 02 01
Balance sheet total in € million
Equity
Funds similar to equity
Long-term liabilities
Fixed assets
Inventories
Liquidity
Other current assets
Short-term liabilities
The trade receivables increased from € 130.5 million to € 139.5 million, but continue to be on a low
level. The ratio of trade receivables to sales revenues improved compared with the prior year from
11.4% to 11.0%. This favorable ratio is caused, apart from the receivables sale through the ABS
Program, by a strict receivables control that also aims at minimizing credit and country risks.
Compared with the prior year, liquidity (including securities held as current assets) fell from € 334.1 mil-
lion to € 300.7 million. It accounts for 30% (prior year: 36%) of the balance sheet total.
SOLID COVER RATIOS
Equity increased from the prior year by € 23.4 million from € 268.8 million to € 292.2 million, which
means that the equity ratio of 28.9% remained constant despite the increased balance sheet total.
The long-term liabilities amount to € 309.7 million (prior year: € 301.9 million). They are composed
of pension provisions, the other non-current provisions and liabilities with a remaining term of more
than one year. The silent partnership of CLAAS-Mitarbeiterbeteiligungs-Gesellschaft (CMG), which under
US GAAP is not classified as equity in the actual definition, amounts to € 16.1 million (prior year:
€ 15.0 million).
The long-term capital, consisting of equity, funds similar to equity and long-term liabilities covers fixed
assets at a ratio of 251.7% (prior year: 297.0%). The extended equity-to-fixed-assets ratio (long-term
capital in relation to sum of fixed assets and 50% of the inventories) as before also achieves a good
value with 180.5% (prior year: 212.2%).
ELECTRONIC SUPPLIER INTEGRATION
In the year under review, we created the basis for the electronic integration of our suppliers into the
planning and order processes. In future, we will integrate suppliers into the operational sequences of
materials purchasing by using a supplier portal via Electronic Data Interchange Technology or Internet
Technology with standardized data transfers.
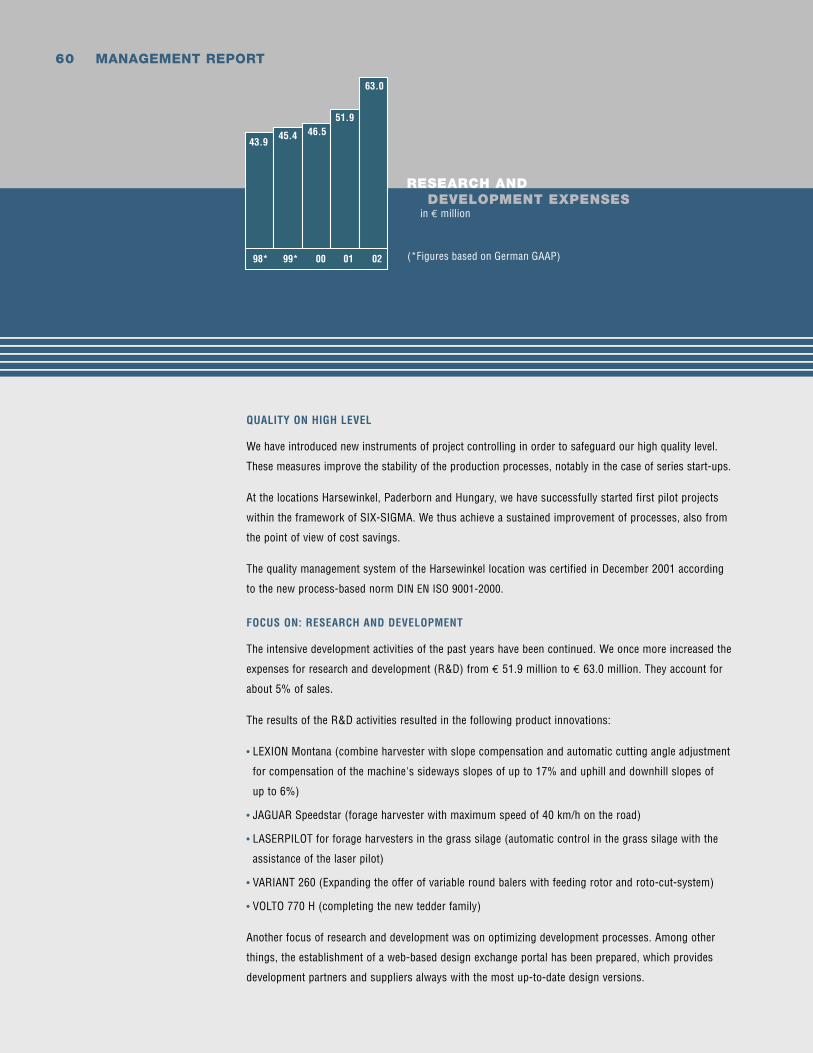
60 MANAGEMENT REPORT
QUALITY ON HIGH LEVEL
We have introduced new instruments of project controlling in order to safeguard our high quality level.
These measures improve the stability of the production processes, notably in the case of series start-ups.
At the locations Harsewinkel, Paderborn and Hungary, we have successfully started first pilot projects
within the framework of SIX-SIGMA. We thus achieve a sustained improvement of processes, also from
the point of view of cost savings.
The quality management system of the Harsewinkel location was certified in December 2001 according
to the new process-based norm DIN EN ISO 9001-2000.
FOCUS ON: RESEARCH AND DEVELOPMENT
The intensive development activities of the past years have been continued. We once more increased the
expenses for research and development (R&D) from € 51.9 million to € 63.0 million. They account for
about 5% of sales.
The results of the R&D activities resulted in the following product innovations:
• LEXION Montana (combine harvester with slope compensation and automatic cutting angle adjustment
for compensation of the machine's sideways slopes of up to 17% and uphill and downhill slopes of
up to 6%)
• JAGUAR Speedstar (forage harvester with maximum speed of 40 km/h on the road)
• LASERPILOT for forage harvesters in the grass silage (automatic control in the grass silage with the
assistance of the laser pilot)
• VARIANT 260 (Expanding the offer of variable round balers with feeding rotor and roto-cut-system)
• VOLTO 770 H (completing the new tedder family)
Another focus of research and development was on optimizing development processes. Among other
things, the establishment of a web-based design exchange portal has been prepared, which provides
development partners and suppliers always with the most up-to-date design versions.
(*Figures based on German GAAP)
RESEARCH AND DEVELOPMENT EXPENSES in € million
46.545.443.9
63.0
51.9
98* 99* 00 01 02
61
OUTLOOK
In Europe, capital expenditure on agricultural engineering increased clearly again in the course of the
year 2002. We observe a moderate growth of the industry in all important EU countries. The farmers'
income, which increased by more than 3% on average in the EU countries, on the whole forms a solid
basis for machine acquisitions. Uncertainties are above all found in the unstable worldwide economic
activity, declining producer prices as well as the discussions on the EU agricultural policy which would
in particular disadvantage the businesses operating on large areas, if present suggestions were imple-
mented.
For the German agricultural machine sector, expectations for 2003 are reserved against the background
of strong sales in the year 2002 and a correspondingly high opening level. On account of this year's lost
harvests, the flood damage and the bad general economic situation in Germany, the farmers estimate
their present economic situation and their future perspectives as being more unfavorable than at the
beginning of the year 2002. Above all in the Eastern federal states, bad grain harvests and changed
subsidy rules can lead to restraint in capital expenditure.
In France, the market weakness of the last year appears to have been overcome. The agricultural engi-
neering market recovered slightly. High harvest volumes with good grain quality in connection with
presently favorable market prices should be a good basis for capital expenditure on machinery in the
season 2003.
The outlook in Central Europe with the EU acceding countries Poland, Hungary and the Czech Republic
remains favorable. The accession negotiations with the European Union contribute to increasing the
competitive pressures for the agricultural industry and to providing incentives for further capital expen-
diture. The high backlog demand should ensure that this development will continue in the coming years.
In the Russian agricultural industry, we continue to expect an uneven tendency. Despite generally positive
developments, there remain uncertainties and fluctuations in the economic development. Production in-
creased both in terms of vegetable and animal output. The Russian government continues to give particular
support to the agricultural sector. The increasing competitiveness of Eastern Europe, notably on the world
grain markets, should continue to impact positively on demand for agricultural machines.
62 MANAGEMENT REPORT
The most important statutory change for the US agricultural industry is the new Farm Bill, the imple-
mentation of which will release about US$ 182 billion to US farmers over the next 10 years. A stabilizing
effect on the capital expenditure of the farmers is to be expected with the new Farm Bill. The Bill should
have a noticeable effect on capital expenditure on machinery as early as in the season 2003, an effect
which could even be supported by improved producer prices in North America.
For the business year 2003, we attempt to achieve a further sales increase, notably in the US and
Eastern Europe. In Western Europe, we expect varying sales developments. On account of the bad
harvest in the year under review, we assume in respect of Germany that there will only be demand for
reduced volumes of combine harvesters. In other Western European countries we anticipate a stable
overall market.
We will consistently continue our growth strategy at the level of CLAAS Fertigungstechnik and we plan
a further increase in sales.
In the business year 2003, we will continue to invest in the future of CLAAS with new product develop-
ments and process improvements. Nevertheless, we set ourselves the ambitious goal of also achieving
the results of the year under review in 2003.
RISK MANAGEMENT
CLAAS, as an internationally orientated group of companies, considers a systematic risk management
to be an indispensable instrument as well as an integral part of corporate governance. The permanent
monitoring and control of risks threatening the continued existence, always the constant task of man-
agement, has been put on a wide information basis through a risk information system as well as risk
controlling. Supported and answered for by the operative and administrative areas of responsibility,
the risk management system operates within the framework of the existing organizational structures.
CLAAS has systematically identified, analyzed and evaluated the risks that exist in all the Group com-
panies. This course of action is updated regularly in order to be able to guarantee the fastest possible
adjustments to a changed corporate environment.
Against the background of constantly changing global economic framework conditions, the risk policy
of CLAAS Group consists in managing the multitude of and the changes in risks in order to be able to
also make best and efficient use of opportunities arising from the business activity in future.
No risks which can threaten the continued existence of the Company in the period under review and
beyond can be identified. The most significant risk areas for CLAAS Group as well as the counteracting
measures taken are presented below.
63
• MACROECONOMIC RISKS
The lasting deterioration of the world economy and negative cyclical movements on sales markets can
lead to evident growth losses for CLAAS. Notably markets such as North and South America entail con-
siderable risks. Identifiable risks are counteracted by intensive monitoring and evaluation of the political,
legal and financial framework conditions in our sales markets, based on information relevant for the
environment provided by the marketing divisions and subsidiaries of CLAAS Group. For further support,
indicators and ratios were installed which take account of and weigh the forecast trend of earnings in
certain sales countries. The reporting, which assists in preparing detailed internal reports and evaluations
on a monthly basis apart from the external data, constitutes a material element for constantly monitoring
economic risks. Deviations from budgets, the compliance with planning and the occurrence of new
monetary and non-monetary risks are permanently investigated and reviewed.
• RISKS SPECIFIC TO INDUSTRY AND COMPANY
Apart from the general economic developments, the growing intensity of competition entails a risk that
is difficult to calculate. With rising transparency of prices, the competition across countries can lead
to losses of sales and market shares. CLAAS encounters risks, which may arise from the competitive
situation, through constant innovations, an intensive quality management and a multitude of financing
options offered to final customers. The crop yield, which can vary strongly on account of the weather,
as well as unfavorable decisions in agricultural policy and other country risks constitute further risks.
A structured monitoring of market-relevant indicators and the comprehensive gathering of information
at central places within the Company ensure the control of these risks. With the increasing involvement
of third parties in the complex business processes, we direct our opportunities of exerting influence to,
among other things, productivity, quality assurance, supply deadlines and costs. CLAAS counters supp-
lier risks through a close cooperation with suppliers, which, wherever possible, are linked to the Com-
pany with long-term supply agreements in the framework of contract management. In addition, high
quality requirements are set and intensive incoming-lot controls are carried out. Credit risks, which arise
from delayed payments of customers or other difficulties in the collection of receivables, are minimized
with the assistance of an intensive receivables management and a close cooperation with banks.
• OPERATIVE RISKS
Since CLAAS's subsidiaries are located around the globe, it is possible to spread risks. However, an
international orientation can also entail risks which may lead to quality defects or possibly also disrupt
the flow of production. Large distances and a widely spread product portfolio can result in logistic short-
ages. A central freight management, which develops and implements logistics concepts for all CLAAS
locations, effectively contributes to the smooth running of the value-added chain. In order to avoid an
impairment of the quality of CLAAS products, production procedures and administrative processes are
constantly reviewed, improved and advanced. In addition, manuals and procedural instructions as well
as the monitoring of their compliance ensure a successful quality management.
64 MANAGEMENT REPORT
• FINANCIAL MARKET RISKS
CLAAS counters financial and foreign exchange risks by hedging currency and interest positions with
derivative financial instruments as well as by a regular close monitoring of a number of early warning
indicators. To avoid foreign exchange risks and interest rate fluctuation risks, CLAAS operates a syste-
matic currency and interest rate management, which is controlled centrally by CLAAS KGaA mbH and is
organized in line with the principles of due segregation of functions. The relevant risk assessments and
detailed guidelines and specifications are taken into account in connection with the use of derivatives.
Derivatives are in principle used for hedging underlying transactions, i.e. no transactions for trading
or speculative purposes are entered into.
MANAGEMENT STATEMENT CONCERNING THE PREPARATION OF THE
CONSOLIDATED FINANCIAL STATEMENTS
The consolidated financial statements and the group management report on hand were prepared by
the management of CLAAS KGaA mbH; management is responsible for the completeness and accuracy
of the information contained therein. The consolidated financial statements as at September 30, 2002
were prepared according to United States Generally Accepted Accounting Principles (US GAAP). They
correspond with the directive 83/349/EEC. The prior year figures have been determined according to
the same principles. According to § 292a of the German Commercial Code, consolidated financial
statements under US GAAP thus have exempting effect. Therefore, consolidated financial statements
prepared according to the German GAAP were no longer required.
Internal control systems, standardized guidelines across the Group and continuous employee training
and further training ensure that the consolidated financial statements and group management report are
orderly drawn up and comply with statutory requirements. The internal auditors keep a running check on
compliance with the guidelines laid down for the entire Group in the risk management manual as well as
on the reliability and effectiveness of the control systems. After carefully examining the current risk situ-
ation we have come to the conclusion that no specific risks exist which could jeopardize the continued
existence of CLAAS Group.
Deloitte & Touche GmbH, Wirtschaftsprüfungsgesellschaft, audited the consolidated financial statements
and group management report and issued the auditor´s report reproduced below.
Harsewinkel, November 28, 2002
Rüdiger A. Günther Nikolaus Feil
Dr.-Ing. Hermann Garbers Lothar Kriszun Werner Schneider
65
INDEPENDENT AUDITOR´S REPORT
We have audited the consolidated financial statements prepared by CLAAS Kommanditgesellschaft auf
Aktien mbH, Harsewinkel, consisting of balance sheet, profit and loss account, statement of changes in
shareholders' equity, cash flow statement and notes to the accounts for the business year from October 01,
2001 to September 30, 2002. The preparation and contents of the consolidated financial statements are
the responsibility of the Company's management. Our responsibility is to express an opinion based on
our audit whether the consolidated financial statements comply with United States Generally Accepted
Accounting Principles (US GAAP).
We conducted our audit of the consolidated annual financial statements in accordance with the German
auditing provisions and the generally accepted German standards for the audit of financial statements
promulgated by the Institut der Wirtschaftsprüfer. Those standards require that we plan and perform the
audit such that the opinion that the consolidated financial statements are free from material misstate-
ments can be given with reasonable assurance. Knowledge of the business activities and the economic
and legal environment of the Group and evaluations of possible misstatements are taken into account in
the determination of audit procedures. The evidence supporting the values and disclosures in the con-
solidated financial statements is examined primarily on a test basis within the framework of the audit.
The audit includes assessing the accounting principles used and significant estimates made by the legal
representatives, as well as evaluating the overall presentation of the consolidated financial statements.
We believe that our audit provides a reasonable basis for our opinion.
In our opinion, the consolidated financial statements give a true and fair view of the net assets, financial
position and results of operations of the Group as well as of the cash flows of the business year in accor-
dance with United States Generally Accepted Accounting Principles.
Our audit, which also covered the group management report prepared by management for the business
year from October 01, 2001 to September 30, 2002, has not led to any reservations. In our view, the
group management report on the whole provides a suitable understanding of the Group´s position and
suitably presents the risks of future development. Furthermore, we confirm that the consolidated financial
statements and the group management report for the business year from October 01, 2001 to Septem-
ber 30, 2002 meet the requirements for exempting the Company from preparing consolidated financial
statements and a group management report according to German law. We audited the compliance of the
preparation of consolidated financial statements with the 7th EU Directive, required for exemption from
the requirement to prepare consolidated financial statements under commercial law, on the basis of the
interpretation of the directive by DRS 1 »Befreiender Konzernabschluss nach § 292a HGB« (Exempting
consolidated financial statements according to § 292a Commercial Code (HGB)) issued by the Deutsche
Rechnungslegungs Standards Committee.
Düsseldorf, November 28, 2002
Deloitte & Touche GmbH
Wirtschaftsprüfungsgesellschaft
Schlereth Kalvelage
German Public Auditor German Public Auditor
CONSOLIDATEDFINANCIAL STATEMENTS
ACC. TO US GAAP
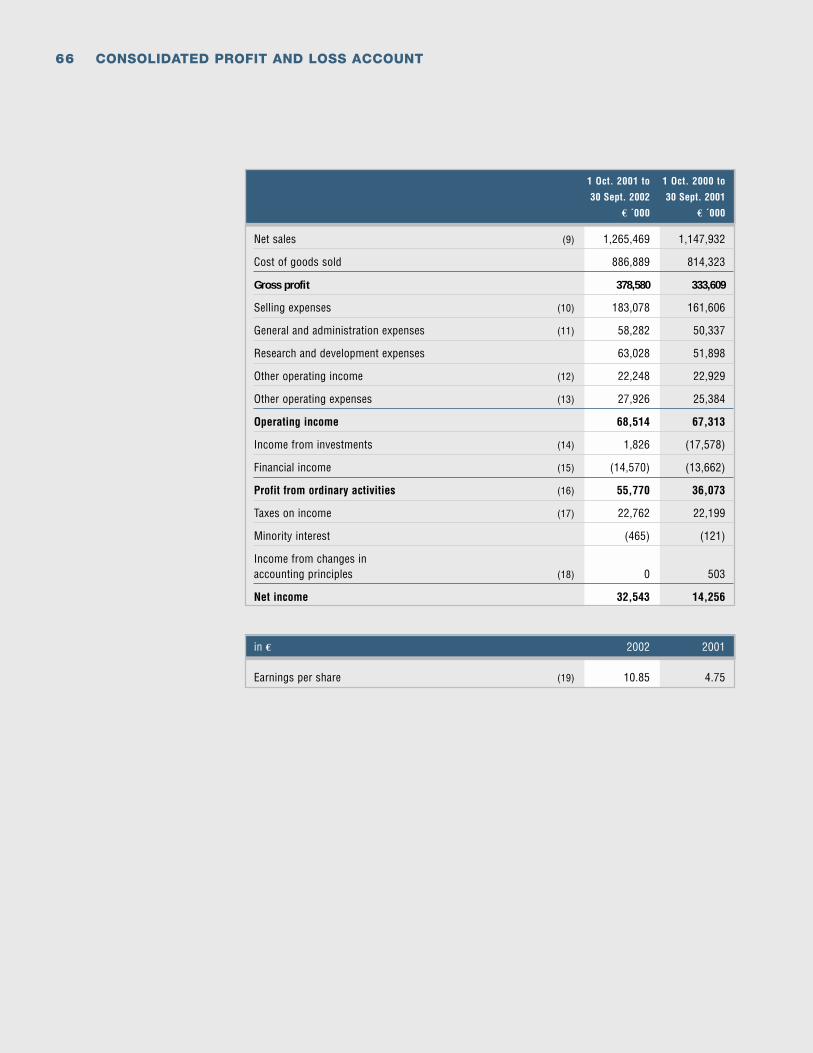
66 CONSOLIDATED PROFIT AND LOSS ACCOUNT
1 Oct. 2001 to 1 Oct. 2000 to
30 Sept. 2002 30 Sept. 2001
€ ´000 € ´000
Net sales (9) 1,265,469 1,147,932
Cost of goods sold 886,889 814,323
Gross profit 378,580 333,609
Selling expenses (10) 183,078 161,606
General and administration expenses (11) 58,282 50,337
Research and development expenses 63,028 51,898
Other operating income (12) 22,248 22,929
Other operating expenses (13) 27,926 25,384
Operating income 68,514 67,313
Income from investments (14) 1,826 (17,578)
Financial income (15) (14,570) (13,662)
Profit from ordinary activities (16) 55,770 36,073
Taxes on income (17) 22,762 22,199
Minority interest (465) (121)
Income from changes in accounting principles (18) 0 503
Net income 32,543 14,256
in € 2002 2001
Earnings per share (19) 10.85 4.75
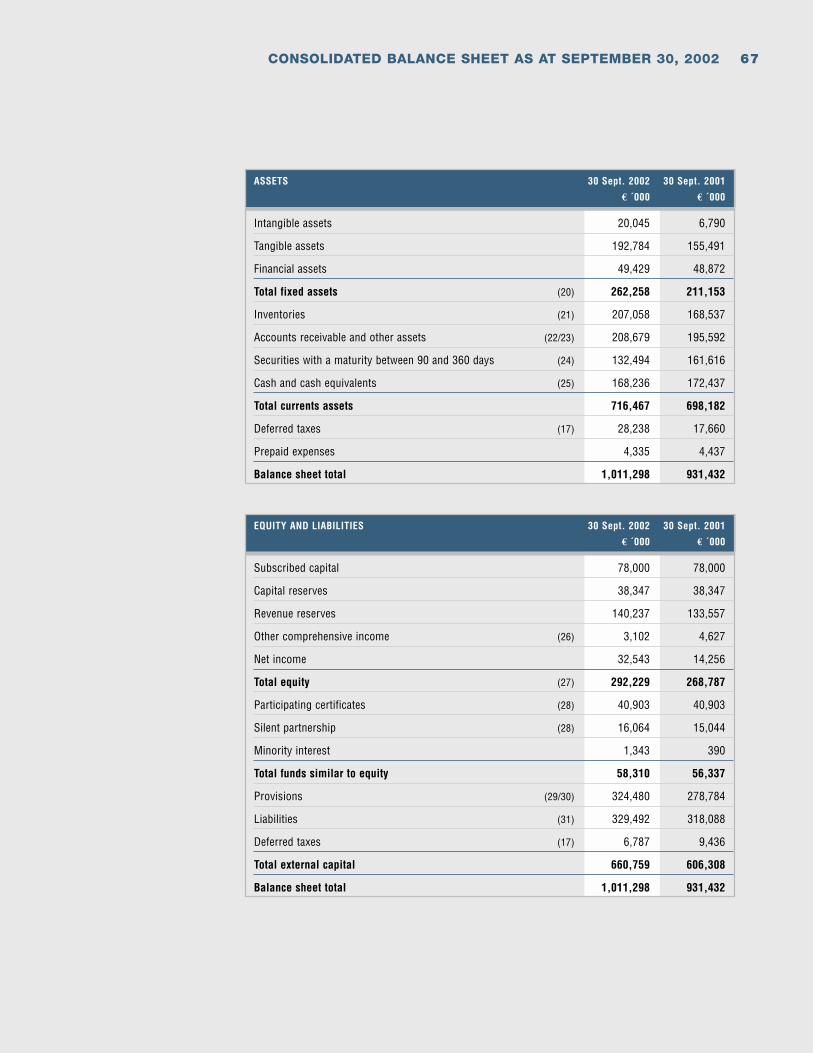
67CONSOLIDATED BALANCE SHEET AS AT SEPTEMBER 30, 2002
EQUITY AND LIABILITIES 30 Sept. 2002 30 Sept. 2001
€ ´000 € ´000
Subscribed capital 78,000 78,000
Capital reserves 38,347 38,347
Revenue reserves 140,237 133,557
Other comprehensive income (26) 3,102 4,627
Net income 32,543 14,256
Total equity (27) 292,229 268,787
Participating certificates (28) 40,903 40,903
Silent partnership (28) 16,064 15,044
Minority interest 1,343 390
Total funds similar to equity 58,310 56,337
Provisions (29/30) 324,480 278,784
Liabilities (31) 329,492 318,088
Deferred taxes (17) 6,787 9,436
Total external capital 660,759 606,308
Balance sheet total 1,011,298 931,432
ASSETS 30 Sept. 2002 30 Sept. 2001
€ ´000 € ´000
Intangible assets 20,045 6,790
Tangible assets 192,784 155,491
Financial assets 49,429 48,872
Total fixed assets (20) 262,258 211,153
Inventories (21) 207,058 168,537
Accounts receivable and other assets (22/23) 208,679 195,592
Securities with a maturity between 90 and 360 days (24) 132,494 161,616
Cash and cash equivalents (25) 168,236 172,437
Total currents assets 716,467 698,182
Deferred taxes (17) 28,238 17,660
Prepaid expenses 4,335 4,437
Balance sheet total 1,011,298 931,432
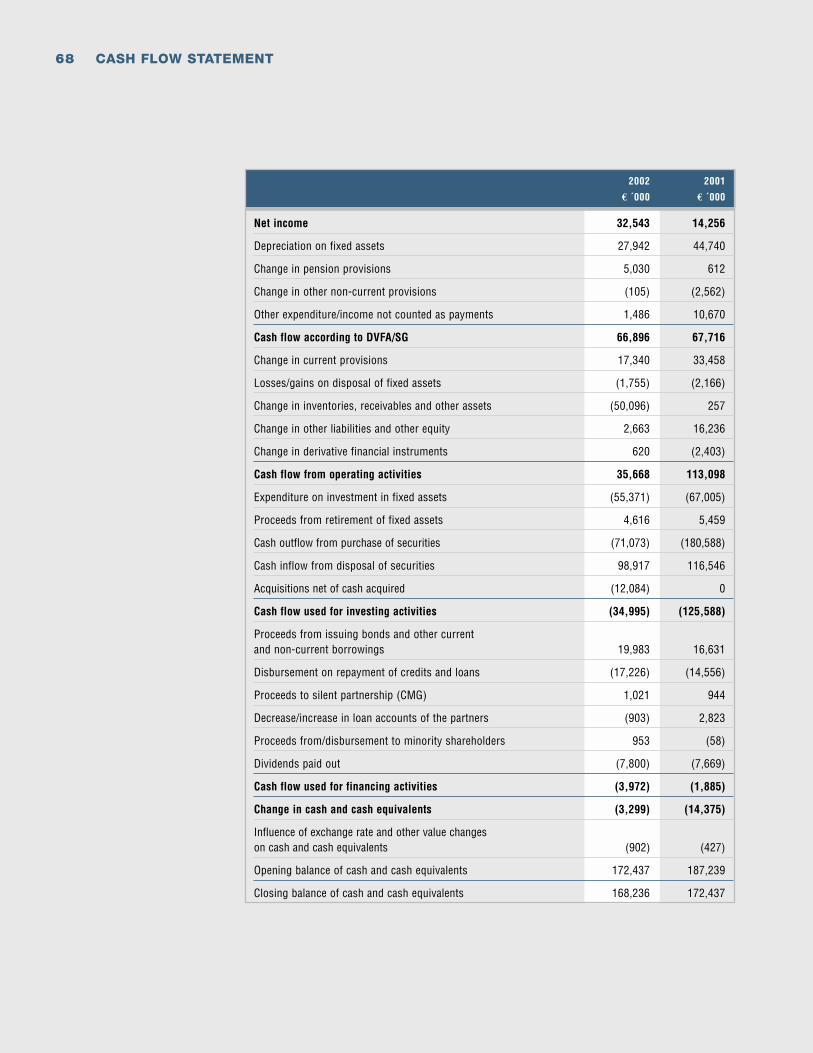
68 CASH FLOW STATEMENT
2002 2001
€ ´000 € ´000
Net income 32,543 14,256
Depreciation on fixed assets 27,942 44,740
Change in pension provisions 5,030 612
Change in other non-current provisions (105) (2,562)
Other expenditure/income not counted as payments 1,486 10,670
Cash flow according to DVFA/SG 66,896 67,716
Change in current provisions 17,340 33,458
Losses/gains on disposal of fixed assets (1,755) (2,166)
Change in inventories, receivables and other assets (50,096) 257
Change in other liabilities and other equity 2,663 16,236
Change in derivative financial instruments 620 (2,403)
Cash flow from operating activities 35,668 113,098
Expenditure on investment in fixed assets (55,371) (67,005)
Proceeds from retirement of fixed assets 4,616 5,459
Cash outflow from purchase of securities (71,073) (180,588)
Cash inflow from disposal of securities 98,917 116,546
Acquisitions net of cash acquired (12,084) 0
Cash flow used for investing activities (34,995) (125,588)
Proceeds from issuing bonds and other current and non-current borrowings 19,983 16,631
Disbursement on repayment of credits and loans (17,226) (14,556)
Proceeds to silent partnership (CMG) 1,021 944
Decrease/increase in loan accounts of the partners (903) 2,823
Proceeds from/disbursement to minority shareholders 953 (58)
Dividends paid out (7,800) (7,669)
Cash flow used for financing activities (3,972) (1,885)
Change in cash and cash equivalents (3,299) (14,375)
Influence of exchange rate and other value changes on cash and cash equivalents (902) (427)
Opening balance of cash and cash equivalents 172,437 187,239
Closing balance of cash and cash equivalents 168,236 172,437
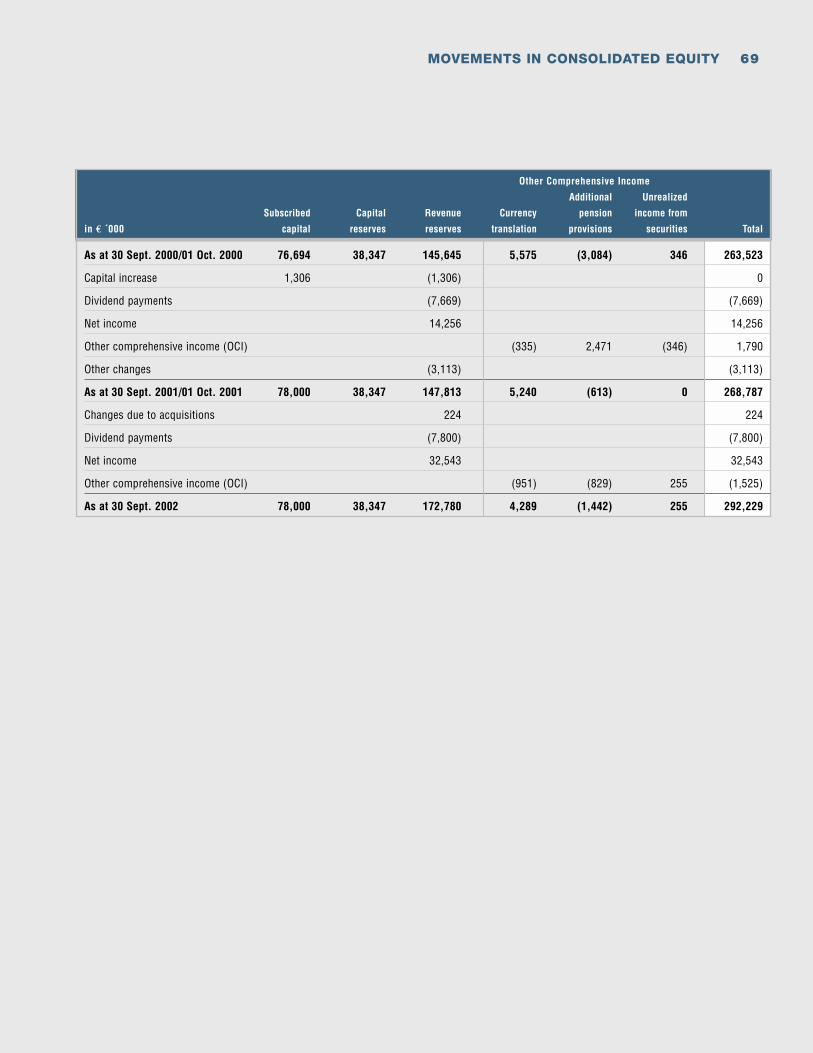
69
Other Comprehensive Income
Additional Unrealized
Subscribed Capital Revenue Currency pension income from
in € ´000 capital reserves reserves translation provisions securities Total
As at 30 Sept. 2000/01 Oct. 2000 76,694 38,347 145,645 5,575 (3,084) 346 263,523
Capital increase 1,306 (1,306) 0
Dividend payments (7,669) (7,669)
Net income 14,256 14,256
Other comprehensive income (OCI) (335) 2,471 (346) 1,790
Other changes (3,113) (3,113)
As at 30 Sept. 2001/01 Oct. 2001 78,000 38,347 147,813 5,240 (613) 0 268,787
Changes due to acquisitions 224 224
Dividend payments (7,800) (7,800)
Net income 32,543 32,543
Other comprehensive income (OCI) (951) (829) 255 (1,525)
As at 30 Sept. 2002 78,000 38,347 172,780 4,289 (1,442) 255 292,229
MOVEMENTS IN CONSOLIDATED EQUITY
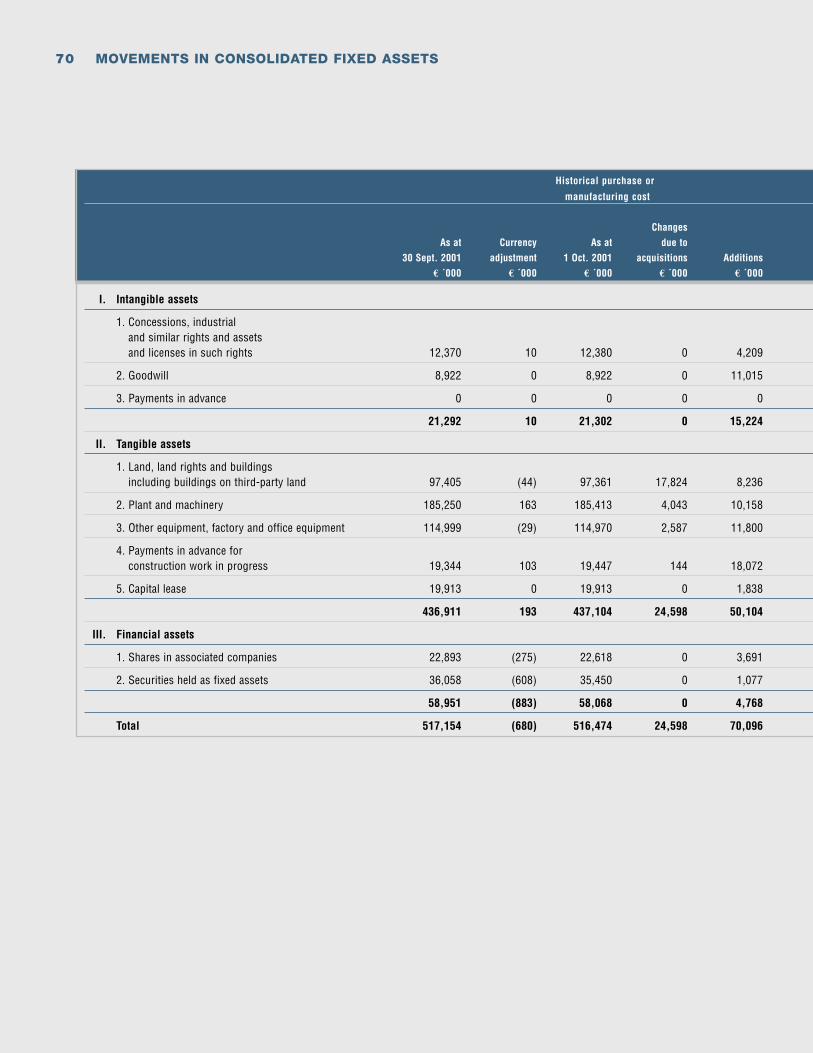
70 MOVEMENTS IN CONSOLIDATED FIXED ASSETS
Historical purchase or
manufacturing cost
ChangesAs at Currency As at due to
30 Sept. 2001 adjustment 1 Oct. 2001 acquisitions Additions€ ´000 € ´000 € ´000 € ´000 € ´000
I. Intangible assets
1. Concessions, industrial and similar rights and assets and licenses in such rights 12,370 10 12,380 0 4,209
2. Goodwill 8,922 0 8,922 0 11,015
3. Payments in advance 0 0 0 0 0
21,292 10 21,302 0 15,224
II. Tangible assets
1. Land, land rights and buildings including buildings on third-party land 97,405 (44) 97,361 17,824 8,236
2. Plant and machinery 185,250 163 185,413 4,043 10,158
3. Other equipment, factory and office equipment 114,999 (29) 114,970 2,587 11,800
4. Payments in advance for construction work in progress 19,344 103 19,447 144 18,072
5. Capital lease 19,913 0 19,913 0 1,838
436,911 193 437,104 24,598 50,104
III. Financial assets
1. Shares in associated companies 22,893 (275) 22,618 0 3,691
2. Securities held as fixed assets 36,058 (608) 35,450 0 1,077
58,951 (883) 58,068 0 4,768
Total 517,154 (680) 516,474 24,598 70,096
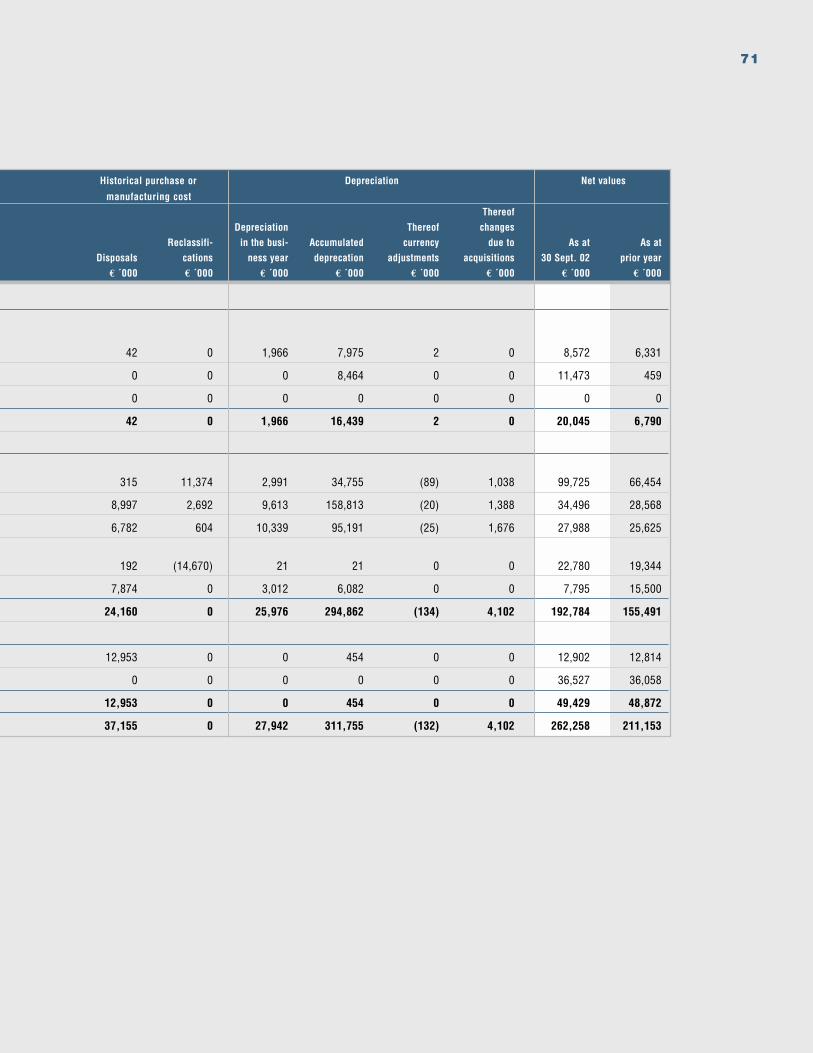
71
Historical purchase or Depreciation Net values
manufacturing costThereof
Depreciation Thereof changesReclassifi- in the busi- Accumulated currency due to As at As at
Disposals cations ness year deprecation adjustments acquisitions 30 Sept. 02 prior year€ ´000 € ´000 € ´000 € ´000 € ´000 € ´000 € ´000 € ´000
42 0 1,966 7,975 2 0 8,572 6,331
0 0 0 8,464 0 0 11,473 459
0 0 0 0 0 0 0 0
42 0 1,966 16,439 2 0 20,045 6,790
315 11,374 2,991 34,755 (89) 1,038 99,725 66,454
8,997 2,692 9,613 158,813 (20) 1,388 34,496 28,568
6,782 604 10,339 95,191 (25) 1,676 27,988 25,625
192 (14,670) 21 21 0 0 22,780 19,344
7,874 0 3,012 6,082 0 0 7,795 15,500
24,160 0 25,976 294,862 (134) 4,102 192,784 155,491
12,953 0 0 454 0 0 12,902 12,814
0 0 0 0 0 0 36,527 36,058
12,953 0 0 454 0 0 49,429 48,872
37,155 0 27,942 311,755 (132) 4,102 262,258 211,153
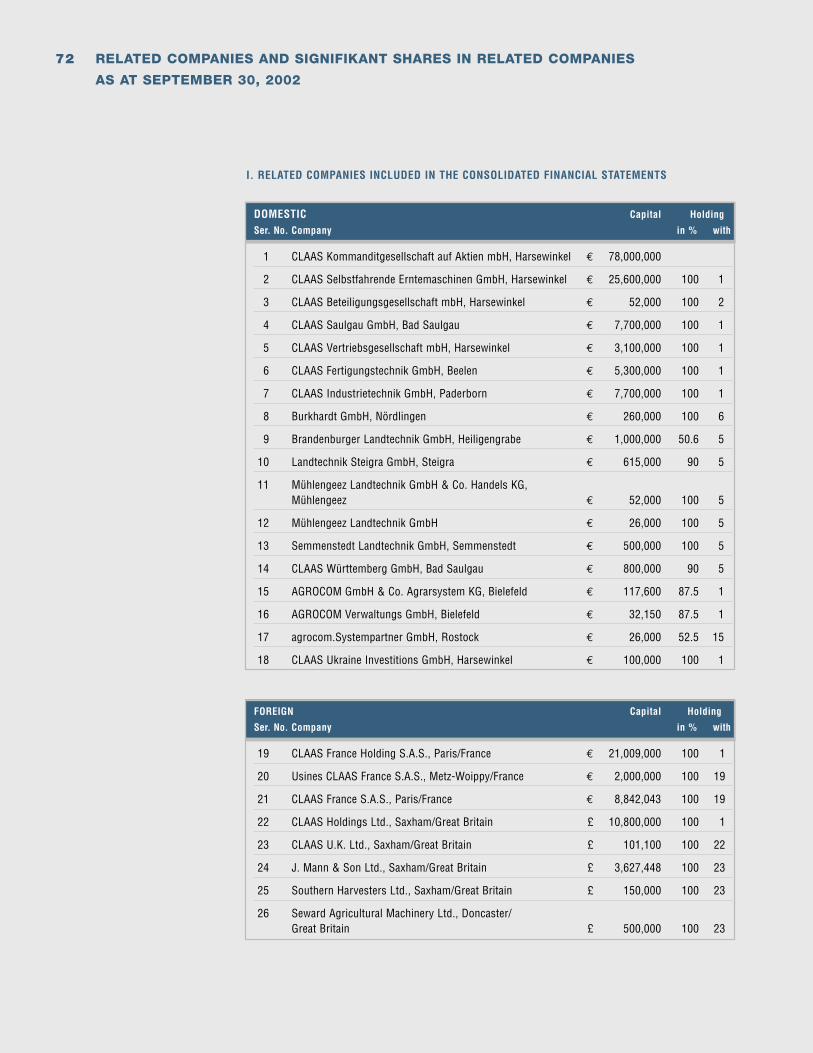
72 RELATED COMPANIES AND SIGNIFIKANT SHARES IN RELATED COMPANIES
AS AT SEPTEMBER 30, 2002
I. RELATED COMPANIES INCLUDED IN THE CONSOLIDATED FINANCIAL STATEMENTS
DOMESTIC Capital Holding
Ser. No. Company in % with
1 CLAAS Kommanditgesellschaft auf Aktien mbH, Harsewinkel € 78,000,000
2 CLAAS Selbstfahrende Erntemaschinen GmbH, Harsewinkel € 25,600,000 100 1
3 CLAAS Beteiligungsgesellschaft mbH, Harsewinkel € 52,000 100 2
4 CLAAS Saulgau GmbH, Bad Saulgau € 7,700,000 100 1
5 CLAAS Vertriebsgesellschaft mbH, Harsewinkel € 3,100,000 100 1
6 CLAAS Fertigungstechnik GmbH, Beelen € 5,300,000 100 1
7 CLAAS Industrietechnik GmbH, Paderborn € 7,700,000 100 1
8 Burkhardt GmbH, Nördlingen € 260,000 100 6
9 Brandenburger Landtechnik GmbH, Heiligengrabe € 1,000,000 50.6 5
10 Landtechnik Steigra GmbH, Steigra € 615,000 90 5
11 Mühlengeez Landtechnik GmbH & Co. Handels KG, Mühlengeez € 52,000 100 5
12 Mühlengeez Landtechnik GmbH € 26,000 100 5
13 Semmenstedt Landtechnik GmbH, Semmenstedt € 500,000 100 5
14 CLAAS Württemberg GmbH, Bad Saulgau € 800,000 90 5
15 AGROCOM GmbH & Co. Agrarsystem KG, Bielefeld € 117,600 87.5 1
16 AGROCOM Verwaltungs GmbH, Bielefeld € 32,150 87.5 1
17 agrocom.Systempartner GmbH, Rostock € 26,000 52.5 15
18 CLAAS Ukraine Investitions GmbH, Harsewinkel € 100,000 100 1
FOREIGN Capital Holding
Ser. No. Company in % with
19 CLAAS France Holding S.A.S., Paris/France € 21,009,000 100 1
20 Usines CLAAS France S.A.S., Metz-Woippy/France € 2,000,000 100 19
21 CLAAS France S.A.S., Paris/France € 8,842,043 100 19
22 CLAAS Holdings Ltd., Saxham/Great Britain £ 10,800,000 100 1
23 CLAAS U.K. Ltd., Saxham/Great Britain £ 101,100 100 22
24 J. Mann & Son Ltd., Saxham/Great Britain £ 3,627,448 100 23
25 Southern Harvesters Ltd., Saxham/Great Britain £ 150,000 100 23
26 Seward Agricultural Machinery Ltd., Doncaster/Great Britain £ 500,000 100 23
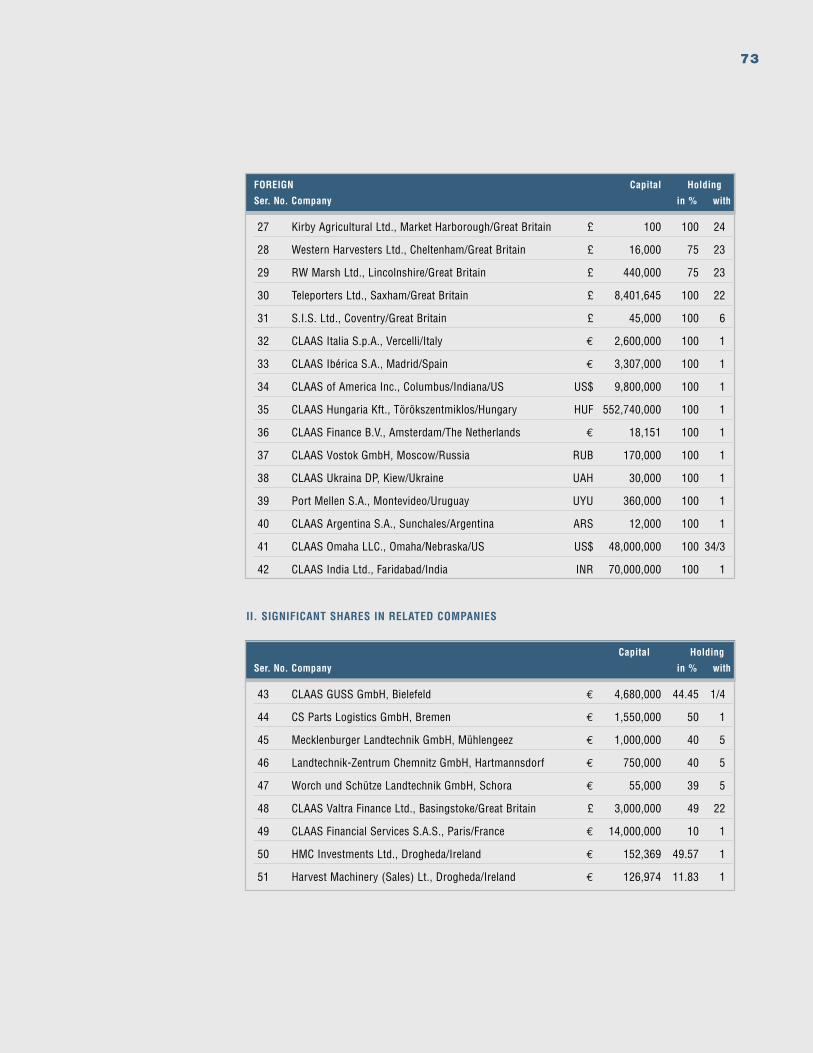
73
II. SIGNIFICANT SHARES IN RELATED COMPANIES
FOREIGN Capital Holding
Ser. No. Company in % with
27 Kirby Agricultural Ltd., Market Harborough/Great Britain £ 100 100 24
28 Western Harvesters Ltd., Cheltenham/Great Britain £ 16,000 75 23
29 RW Marsh Ltd., Lincolnshire/Great Britain £ 440,000 75 23
30 Teleporters Ltd., Saxham/Great Britain £ 8,401,645 100 22
31 S.I.S. Ltd., Coventry/Great Britain £ 45,000 100 6
32 CLAAS Italia S.p.A., Vercelli/Italy € 2,600,000 100 1
33 CLAAS Ibérica S.A., Madrid/Spain € 3,307,000 100 1
34 CLAAS of America Inc., Columbus/Indiana/US US$ 9,800,000 100 1
35 CLAAS Hungaria Kft., Törökszentmiklos/Hungary HUF 552,740,000 100 1
36 CLAAS Finance B.V., Amsterdam/The Netherlands € 18,151 100 1
37 CLAAS Vostok GmbH, Moscow/Russia RUB 170,000 100 1
38 CLAAS Ukraina DP, Kiew/Ukraine UAH 30,000 100 1
39 Port Mellen S.A., Montevideo/Uruguay UYU 360,000 100 1
40 CLAAS Argentina S.A., Sunchales/Argentina ARS 12,000 100 1
41 CLAAS Omaha LLC., Omaha/Nebraska/US US$ 48,000,000 100 34/3
42 CLAAS India Ltd., Faridabad/India INR 70,000,000 100 1
Capital Holding
Ser. No. Company in % with
43 CLAAS GUSS GmbH, Bielefeld € 4,680,000 44.45 1/4
44 CS Parts Logistics GmbH, Bremen € 1,550,000 50 1
45 Mecklenburger Landtechnik GmbH, Mühlengeez € 1,000,000 40 5
46 Landtechnik-Zentrum Chemnitz GmbH, Hartmannsdorf € 750,000 40 5
47 Worch und Schütze Landtechnik GmbH, Schora € 55,000 39 5
48 CLAAS Valtra Finance Ltd., Basingstoke/Great Britain £ 3,000,000 49 22
49 CLAAS Financial Services S.A.S., Paris/France € 14,000,000 10 1
50 HMC Investments Ltd., Drogheda/Ireland € 152,369 49.57 1
51 Harvest Machinery (Sales) Lt., Drogheda/Ireland € 126,974 11.83 1
74 CONSOLIDATED FINANCIAL STATEMENTS IN ACCORDANCE WITH UNITED STATES
GENERALLY ACCEPTED ACCOUNTING PRINCIPLES (US GAAP)
The consolidated financial statements of CLAAS KGaA mbH for the business year 2002 (October 01,
2001 to September 30, 2002) were prepared in compliance with United States Generally Accepted
Accounting Principles (US GAAP). They were supplemented by a group management report and
further explanations required under § 292a of the Commercial Code (HGB). They thus meet the
requirements of exemption from the duty to prepare consolidated financial statements in accordance
with German GAAP (HGB).
The cost of goods sold format has been applied to the consolidated profit and loss account. The
classification of consolidated balance sheet and consolidated profit and loss account is based, as far
as admissible under US GAAP, on disclosure principles of German GAAP in the interest of a clear
and continuous disclosure. The prior year is reported accordingly.
In order to improve the clarity of presentation, individual items of the consolidated balance sheet
and the consolidated profit and loss account have been grouped. These items are broken down in
the notes to the accounts and explained correspondingly.
Individual prior year figures were adjusted to the current presentation.
In accordance with § 264 (3) of the Commercial Code, we do no publish the annual financial state-
ments of our subsidiaries CLAAS Fertigungstechnik GmbH, Beelen, CLAAS Industrietechnik GmbH,
Paderborn, CLAAS Selbstfahrende Erntemaschinen GmbH, Harsewinkel, CLAAS Vertriebsgesellschaft
mbH, Harsewinkel, CLAAS Saulgau GmbH, Bad Saulgau, and Burkhardt GmbH, Nördlingen, in the
Official Gazette and do not prepare notes to the accounts and management reports.
CLAAS KGaA mbH and all subsidiaries are included in the consolidated financial statements. Together
with CLAAS KGaA mbH, there are 42 companies in total (prior year: 38), 18 domestic and 24 foreign.
The companies consolidated according to the principles of consolidation are directly or indirectly
controlled by the CLAAS KGaA mbH.
Effective February 01, 2002, CLAAS fully took over Caterpillar CLAAS America LLC. head-quartered in
Omaha/Nebraska/US and until that time accounted for at equity as joint venture with Caterpillar. In the
business year 2002, the company is included in the consolidated financial statements as a related com-
pany as at February 01, 2002; it now carries on business under the firm of CLAAS Omaha LLC. The pur-
chase price amounted to € 2,316 thousand. At the time of take-over, the company's assets amounted
to € 52,198 thousand; these were matched by equity in the amount of € 7,662 thousand and external
capital of € 44,536 thousand. The negative goodwill in the amount of € 6,424 thousand resulting from
acquisition was written down taking into account deferred taxes and offset against tangible assets.
The amount written down is released with profit and loss impact over the tangible assets' average
useful life of 10 years.
01 | GENERAL INFORMATION
02 | SCOPE OF CONSOLIDATION
75
Furthermore at the end of the year, CLAAS completely took over Escorts CLAAS Ltd. head-quartered
in Faridabad/India; the company then changed its name to CLAAS India Ltd. and was consolidated for
the first time as at September 30, 2002. CLAAS India Ltd. had been accounted for at equity until its
complete take-over. In the business year 2002, the company is included in the consolidated financial
statements as a related company as at September 30, 2002. The purchase price for the take-over of the
remaining 60% of the shares amounted to € 13,200 thousand. At the time of take-over, the company's
assets amounted to € 6,204 thousand; these were matched by equity in the amount of € 3,642 thousand
and external capital in the amount of € 2,562 thousand. The goodwill in the amount of € 11,014 thou-
sand resulting from acquisition was capitalized. In accordance with SFAS 142, goodwill is not amortized
on a scheduled basis, but subject to an annual impairment test.
CLAAS GUSS GmbH, Bielefeld, CLAAS Valtra Finance Ltd., Basingstoke/Great Britain, CLAAS Financial
Services S.A.S., Paris/France, as well as HMC Investments Ltd., Drogheda/Ireland, Harvest Machinery
(Sales) Ltd., Drogheda/Ireland and CS Parts Logistics GmbH, Bremen, are included in the consolidated
financial statements as associated companies according to the equity method.
The companies included according to the equity method jointly disclose income before taxes in the
amount of € 4,388 thousand. Their assets amount to € 371,758 thousand and their external capital to
€ 340,765 thousand.
The list of shareholdings is attached to this report.
INTANGIBLE ASSETS AND TANGIBLE ASSETS
Intangible assets acquired are capitalized at cost and are amortized over their estimated useful life, if
such a useful life can be determined. If the useful life of the assets concerned can not be determined,
no scheduled amortization is made. Instead, an impairment test is to be performed annually or even
earlier, if corresponding indications for permanent impairment exist. Goodwill is also not amortized on
a scheduled basis, but subject to an annual impairment test.
Tangible assets are valued at acquisition or production cost and, where depreciable, taking into account
scheduled depreciation. Movable assets are depreciated on a straightline basis over their estimated
useful lives. The useful lives amount to 20 to 50 years for buildings. The other items of tangible assets
are recognized at useful lives between three and twelve years. Material interest on borrowed capital
which arises for a qualified asset during its construction time is capitalized and depreciated after com-
pletion of the asset over its useful life.
Where indications of impairments exist for intangible assets or tangible assets, impairment tests are
performed. If an impairment exists, a non scheduled depreciation is made on the asset and/or the
superior cash generating unit. In the case of non-current assets which continue to be used and are not
intended for sale, the carrying amount of the non-current asset and the sum of the expected undiscounted
cash flow resulting from the use of the asset are compared in the impairment test. If the sum of the
expected undiscounted cash flow is lower than the carrying amount, a write-down to the fair value is
performed.
03 | ACCOUNTING AND
VALUATION METHODS
76 CONSOLIDATED FINANCIAL STATEMENTS
INVESTMENTS
To the extent that it is possible to exercise significant influence, investments in associated companies
and in joint ventures are accounted for at the relevant proportion of equity capital (application of the
equity method). The other investments are classified as securities that are neither part of the trading
portfolio nor held-to-maturity (»available-for-sale«), if the shares held by CLAAS are listed on a stock
exchange and/or market prices are publicly available. If no publicly available market price is on hand
for other investments, they are accounted for at cost (possibly reduced by write-downs).
SECURITIES
According to SFAS 115, securities are classified into three categories: held-to-maturity, available-for-
sale and trading. The securities held by CLAAS are either securities held-to-maturity or sold within the
last three months before final maturity (»held-to-maturity«) and securities that are neither part of the
trading portfolio nor held-to-maturity (»available-for-sale«). Securities classified as »held-to-maturity«
are carried at amortized cost. Securities classified as »available-for-sale« are valued at market price
(if available). In a separate equity item, other comprehensive income, unrealized income and expenses
from »available-for-sale« securities are disclosed without profit and loss impact, taking into account
deferred taxes.
DERIVATIVE FINANCIAL INSTRUMENTS
CLAAS Group uses derivative financial instruments such as swaps, exchange futures, options on interest
rate swaps, forward interest rate dealings, caps and floors for hedging purposes. As at October 01, 2000,
CLAAS for the first time adopted SFAS No. 133, »Accounting for Derivative Instruments and Hedging
Activities«. Accordingly, all derivative financial instruments are to be reported in the balance sheet either
as an asset or as a liability at their respective fair value. If a clear hedging connection exists, hedge
accounting (setting up valuation units) is possible. In hedge accounting, the market price changes of the
derivatives depend on the type of the hedge. In the case of a cash flow hedge, market price changes of
the effective part of the derivative are initially booked in equity (other comprehensive income) and only
released with profit and loss impact, if the underlying transaction has profit and loss impact. The inef-
fective part of a hedge is immediately recorded with profit and loss impact. Market price changes of the
derivative in the case of a fair value hedge are recognized with profit and loss impact together with the
market price changes of the underlying transaction.
77
MARKET PRICES OF DERIVATIVE
Under US GAAP, financial instruments include derivative instruments (e.g. swaps, options) and original
financial instruments (at the level of CLAAS e.g. participating certificates, silent partnership, bonds, cash
and cash equivalents). Under US GAAP, the market price of a financial instrument indicates the value at
which a financial instrument can be traded among unrelated parties dealing at arm's length if there are
parties willing to buy and sell and the transaction concerned is not a compulsory or winding-up sale.
The buying and selling prices realized by CLAAS in transactions can, hence, deviate from the market
prices disclosed. Where the market prices of financial instruments are not stated explicitly, they do not
or only insignificantly deviate from the carrying amounts.
INVENTORIES
Inventories are carried at the lower of cost or market value. Raw materials and consumables as well as
merchandise are capitalized at average cost, work in process and finished goods at production-related
full cost, i.e. apart from direct material and prime cost, the directly allocable parts of necessary indirect
material and production overhead and production-related administration expenses are also capitalized.
Inventory risks that result from reduced likelihood of full utilization, as well as disposal risks based on
the estimate of achievable sale prices are taken into account through depreciation.
RECEIVABLES
Receivables and other assets are shown in the balance sheet at face value. Adequate allowances are
being made for anticipated risks of non-payment. A discount is applied to non-interest-bearing receiv-
ables that are not expected to be received within normal payment deadlines.
The percentage of completion method (poc method) is applied when reporting long-term production
orders. The amount to be capitalized is disclosed under receivables; at the same time, net sales are
realized. The stage of completion is determined according to expenses incurred. At each balance sheet
date, the existing contracts are reviewed in respect of possible risks. In the case of anticipated losses,
corresponding allowances are made or provisions set up.
CASH AND CASH EQUIVALENTS
Under US GAAP, cash and cash equivalents also include securities with a remaining term at the date
of acquisition of up to 90 days. The cash and cash equivalents disclosed in the cash flow statement
correspond to the cash and cash equivalents in the balance sheet.
78 CONSOLIDATED FINANCIAL STATEMENTS
PROVISIONS/LIABILITIES
Pension commitments are measured through actuarial methods according to the projected unit credit
method. This projected unit credit method does not only take into account the pensions and accrued
vested rights known at the balance sheet date but also the pay and pension increases anticipated in
future. Actuarial gains and losses which are outside a range of 10% of the scope of commitments are
distributed over the average residual period of service.
Other provisions are set up in respect of all commitments identifiable as at the balance sheet date that
are based on past business transactions or past events and the amount and/or due date of which are
uncertain. They are valued at the amount repayable and are not netted with positive profit contributions.
If the amount repayable is uncertain, the repayment amount with the highest probability of occurrence is
taken as a basis. Provisions are only set up, if there is a corresponding legal or de facto obligation
to a third party.
Liabilities are generally carried at the amount at which they will be repaid; liabilities in a foreign currency
are translated at the rate in effect at the balance sheet date.
CURRENT AND DEFERRED TAXES ON INCOME
Deferred taxes are determined according to SFAS 109 »Accounting of Income Taxes«. They reflect future
tax reduction or future tax burdens that arise from temporary differences between consolidated balance
sheet and tax balance sheet. Deferred tax assets also comprise tax reduction claims arising from the
expected availability of existing loss carryforwards in subsequent years, the realization of which is
probable. Deferred taxes are computed using the tax rate that will be authoritative according to the
present legal situation at the probable compensation time of the temporary differences. Abroad, tax rates
specific to the country are used. An allowance is made on deferred tax assets, if there is a sufficiently
high likelihood that not all deferred tax assets can be realized in future through fiscal profits, or if the
realization is limited in time.
Effective October 01, 2001, the German corporate income tax rate for distributed profits declined for
CLAAS from 30% to 25% and the corporate income tax rate for retained profits from 40% to 25%.
SALES RECOGNITION
Sales are recognized after passage of risk to the customer and performed delivery or service.
In the case of long-term production orders, sales are recorded according to the percentage of completion
method in line with reaching contractually agreed milestones or performance progress.
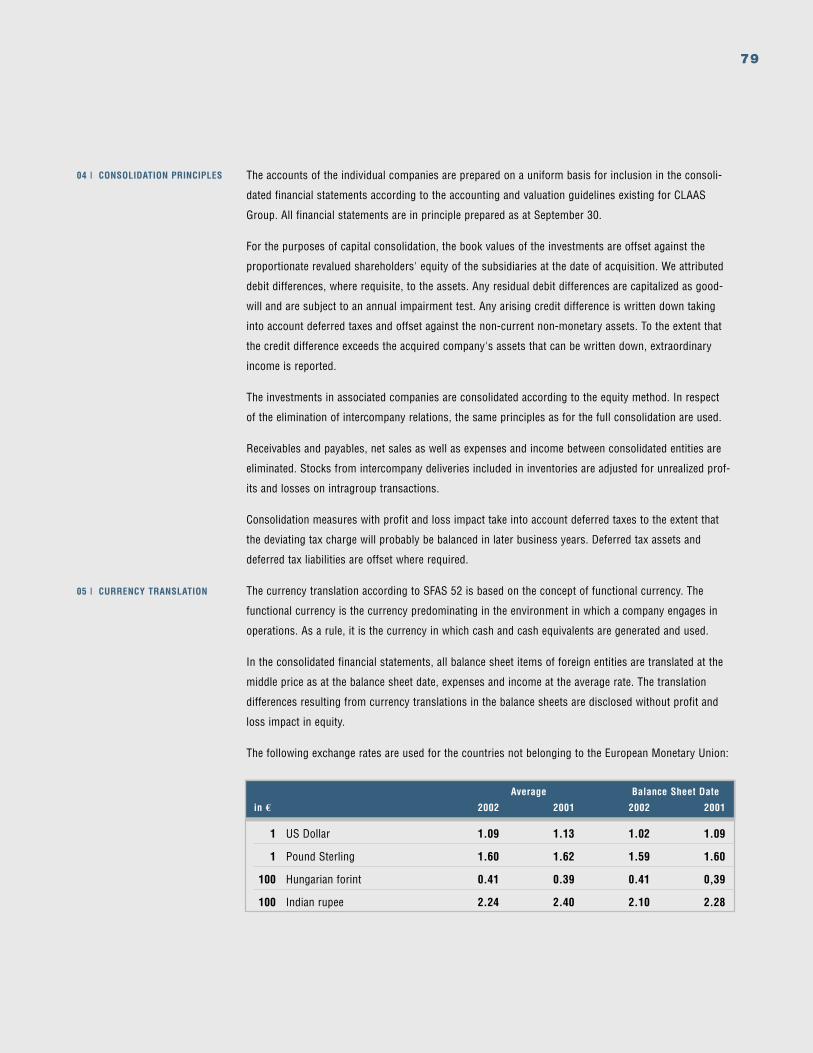
79
The accounts of the individual companies are prepared on a uniform basis for inclusion in the consoli-
dated financial statements according to the accounting and valuation guidelines existing for CLAAS
Group. All financial statements are in principle prepared as at September 30.
For the purposes of capital consolidation, the book values of the investments are offset against the
proportionate revalued shareholders' equity of the subsidiaries at the date of acquisition. We attributed
debit differences, where requisite, to the assets. Any residual debit differences are capitalized as good-
will and are subject to an annual impairment test. Any arising credit difference is written down taking
into account deferred taxes and offset against the non-current non-monetary assets. To the extent that
the credit difference exceeds the acquired company's assets that can be written down, extraordinary
income is reported.
The investments in associated companies are consolidated according to the equity method. In respect
of the elimination of intercompany relations, the same principles as for the full consolidation are used.
Receivables and payables, net sales as well as expenses and income between consolidated entities are
eliminated. Stocks from intercompany deliveries included in inventories are adjusted for unrealized prof-
its and losses on intragroup transactions.
Consolidation measures with profit and loss impact take into account deferred taxes to the extent that
the deviating tax charge will probably be balanced in later business years. Deferred tax assets and
deferred tax liabilities are offset where required.
The currency translation according to SFAS 52 is based on the concept of functional currency. The
functional currency is the currency predominating in the environment in which a company engages in
operations. As a rule, it is the currency in which cash and cash equivalents are generated and used.
In the consolidated financial statements, all balance sheet items of foreign entities are translated at the
middle price as at the balance sheet date, expenses and income at the average rate. The translation
differences resulting from currency translations in the balance sheets are disclosed without profit and
loss impact in equity.
The following exchange rates are used for the countries not belonging to the European Monetary Union:
04 | CONSOLIDATION PRINCIPLES
05 | CURRENCY TRANSLATION
Average Balance Sheet Date
in € 2002 2001 2002 2001
1 US Dollar 1.09 1.13 1.02 1.09
1 Pound Sterling 1.60 1.62 1.59 1.60
100 Hungarian forint 0.41 0.39 0.41 0,39
100 Indian rupee 2.24 2.40 2.10 2.28
80 CONSOLIDATED FINANCIAL STATEMENTS
Companies of CLAAS Group are involved in various legal and official proceedings within the framework
of general operations or such proceedings could be initiated or asserted in future (e.g. concerning
patents, product liability and competition). Even if the result of individual proceedings cannot be pre-
dicted with certainty with a view to the unforeseeable events surrounding legal disputes, according to
present estimates the Group's profit situation will not in any way be adversely effected beyond the
risks taken into account as liabilities or provisions.
Estimates and assumptions that influence the recorded assets and liabilities, the inclusion of contingent
liabilities as at the balance sheet date and the disclosure of income and expenses during the reporting
period must be made in the consolidated financial statements to a certain degree. The amounts actually
arising can deviate from the estimates.
In June 2001, the FASB issued the Standard SFAS No. 142 »Goodwill and Other Intangible Assets«.
This standard contains new regulations on, among other things, scope of reporting and accounting
of goodwill resulting from capital consolidation. Accordingly, goodwill from capital consolidation
is no longer to be written off on a scheduled basis, but its recoverability is tested periodically by
impairment tests. SFAS No. 142 was adopted for the first time in the year under review.
Also revised were the regulations on the impairment test in APB Opinion 30 and SFAS No. 121. SFAS
No. 144 approved in this respect in August 2001 contains, among other things, new regulations for
impairments of discontinued operations; in the case of impairment tests for goodwill, the special
standard SFAS No. 142 now applies. SFAS No. 144 was adopted for the first time in the year under
review.
In June 2002, the FASB issued the Standard SFAS No. 146 »Accounting for Costs Associated with
Exit or Disposal Activities«. This standard replaces EITF Issue No. 94-3 »Liability Recognition for
Certain Employee Termination Benefits and Other Costs to Exit an Activity (including Certain Costs
Incurred in a Restructuring)«. SFAS No. 146 regulates, among other things, the accounting of cost
of disposal and closure of a business. The standard becomes effective for disposal and closure
activities that are started after December 31, 2002.
The standards adopted for the first time did not have any material effects on the presentation of
the economic situation of CLAAS. As matters stand at present, the new standards are not expected
to have any material effects either.
Net sales also include sales from long-term production contracts which have been accounted for
according to the percentage of completion method (poc method). The amount to be capitalized from
long-term production orders which cannot yet be invoiced is disclosed under poc receivables and
net sales.
06 | LEGAL DISPUTES AND
DAMAGE CLAIMS
07 | USE OF ESTIMATES
08 | NEW ACCOUNTING
STANDARDS
09 | NET SALES
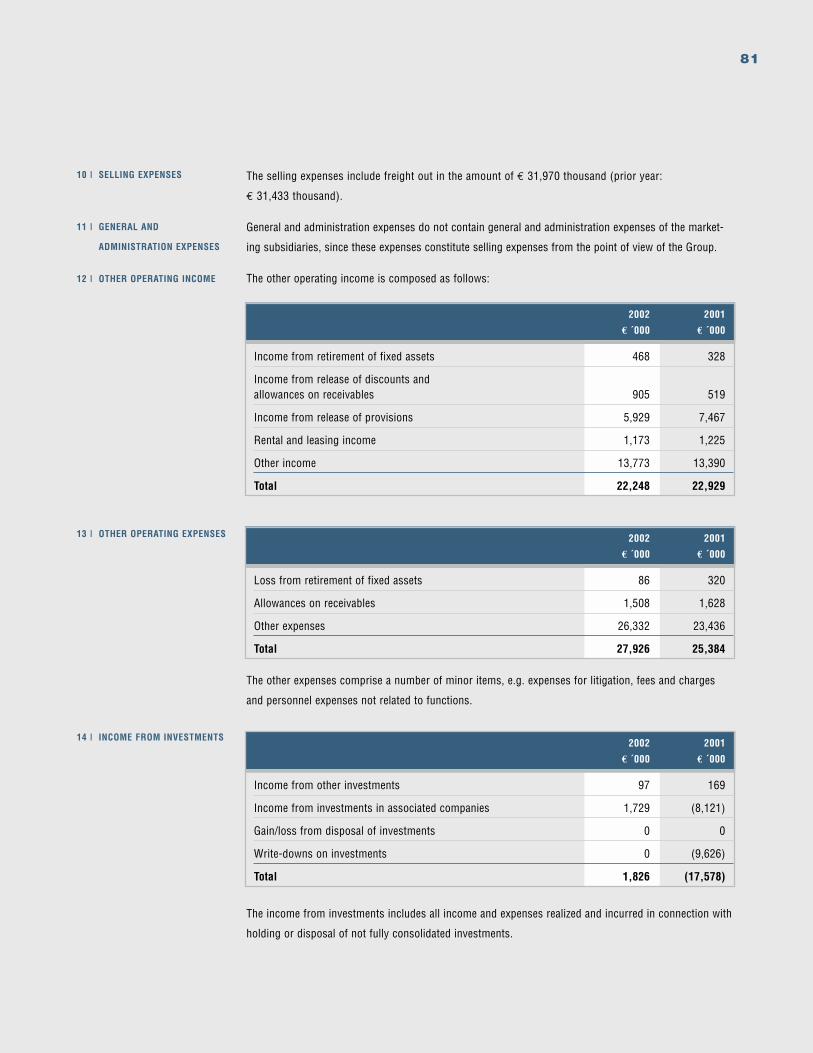
81
The selling expenses include freight out in the amount of € 31,970 thousand (prior year:
€ 31,433 thousand).
General and administration expenses do not contain general and administration expenses of the market-
ing subsidiaries, since these expenses constitute selling expenses from the point of view of the Group.
The other operating income is composed as follows:
10 | SELLING EXPENSES
11 | GENERAL AND
ADMINISTRATION EXPENSES
12 | OTHER OPERATING INCOME
13 | OTHER OPERATING EXPENSES
14 | INCOME FROM INVESTMENTS
2002 2001
€ ´000 € ´000
Income from retirement of fixed assets 468 328
Income from release of discounts and allowances on receivables 905 519
Income from release of provisions 5,929 7,467
Rental and leasing income 1,173 1,225
Other income 13,773 13,390
Total 22,248 22,929
2002 2001
€ ´000 € ´000
Loss from retirement of fixed assets 86 320
Allowances on receivables 1,508 1,628
Other expenses 26,332 23,436
Total 27,926 25,384
2002 2001
€ ´000 € ´000
Income from other investments 97 169
Income from investments in associated companies 1,729 (8,121)
Gain/loss from disposal of investments 0 0
Write-downs on investments 0 (9,626)
Total 1,826 (17,578)
The income from investments includes all income and expenses realized and incurred in connection with
holding or disposal of not fully consolidated investments.
The other expenses comprise a number of minor items, e.g. expenses for litigation, fees and charges
and personnel expenses not related to functions.
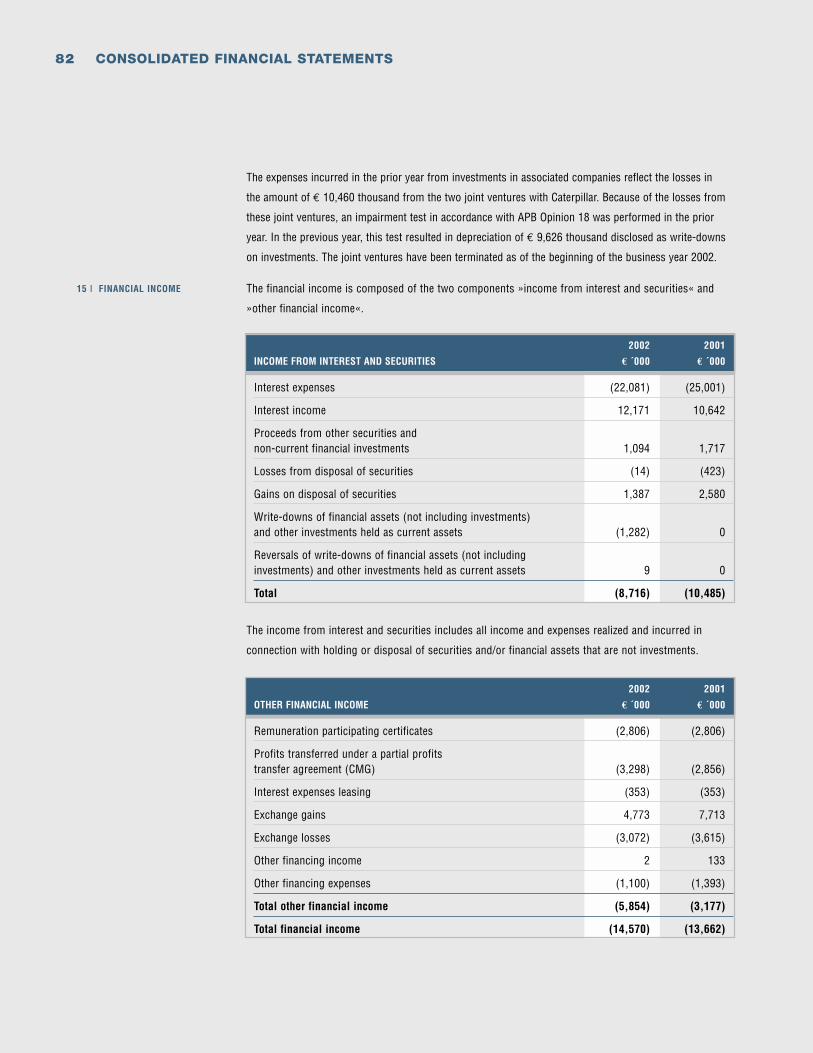
82 CONSOLIDATED FINANCIAL STATEMENTS
The expenses incurred in the prior year from investments in associated companies reflect the losses in
the amount of € 10,460 thousand from the two joint ventures with Caterpillar. Because of the losses from
these joint ventures, an impairment test in accordance with APB Opinion 18 was performed in the prior
year. In the previous year, this test resulted in depreciation of € 9,626 thousand disclosed as write-downs
on investments. The joint ventures have been terminated as of the beginning of the business year 2002.
The financial income is composed of the two components »income from interest and securities« and
»other financial income«.
The income from interest and securities includes all income and expenses realized and incurred in
connection with holding or disposal of securities and/or financial assets that are not investments.
15 | FINANCIAL INCOME
2002 2001
INCOME FROM INTEREST AND SECURITIES € ´000 € ´000
Interest expenses (22,081) (25,001)
Interest income 12,171 10,642
Proceeds from other securities and non-current financial investments 1,094 1,717
Losses from disposal of securities (14) (423)
Gains on disposal of securities 1,387 2,580
Write-downs of financial assets (not including investments) and other investments held as current assets (1,282) 0
Reversals of write-downs of financial assets (not including investments) and other investments held as current assets 9 0
Total (8,716) (10,485)
2002 2001
OTHER FINANCIAL INCOME € ´000 € ´000
Remuneration participating certificates (2,806) (2,806)
Profits transferred under a partial profits transfer agreement (CMG) (3,298) (2,856)
Interest expenses leasing (353) (353)
Exchange gains 4,773 7,713
Exchange losses (3,072) (3,615)
Other financing income 2 133
Other financing expenses (1,100) (1,393)
Total other financial income (5,854) (3,177)
Total financial income (14,570) (13,662)
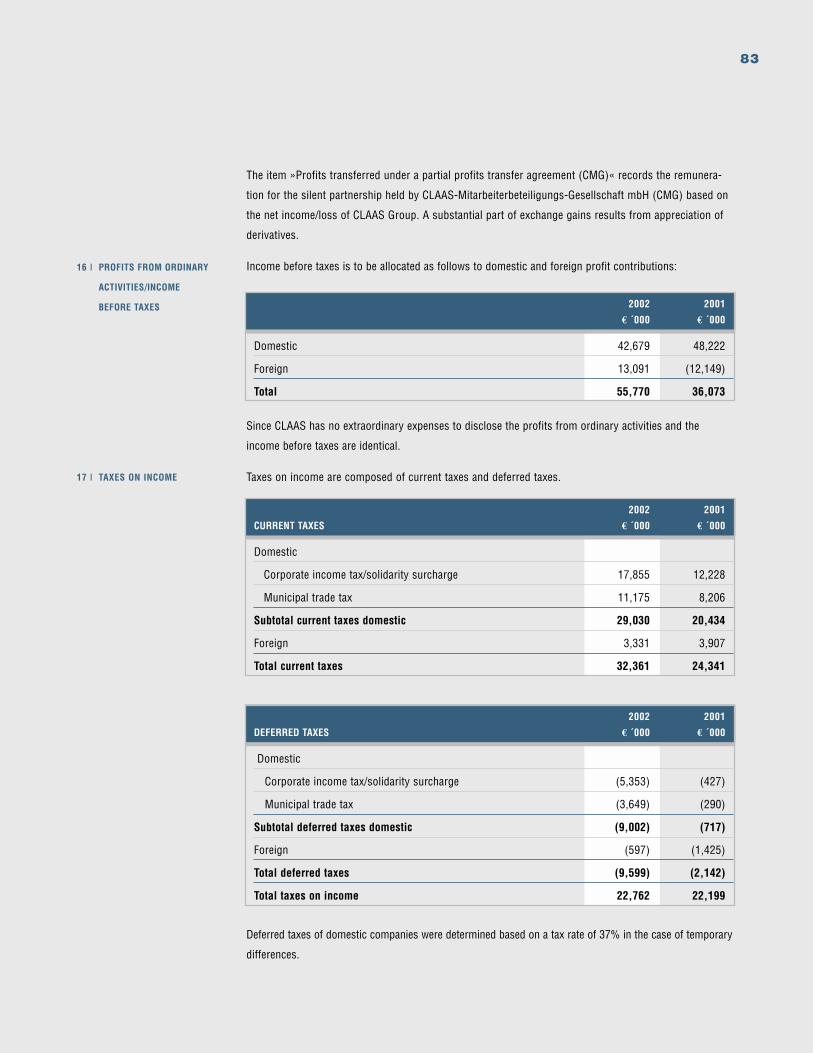
83
The item »Profits transferred under a partial profits transfer agreement (CMG)« records the remunera-
tion for the silent partnership held by CLAAS-Mitarbeiterbeteiligungs-Gesellschaft mbH (CMG) based on
the net income/loss of CLAAS Group. A substantial part of exchange gains results from appreciation of
derivatives.
Income before taxes is to be allocated as follows to domestic and foreign profit contributions: 16 | PROFITS FROM ORDINARY
ACTIVITIES/INCOME
BEFORE TAXES 2002 2001
€ ´000 € ´000
Domestic 42,679 48,222
Foreign 13,091 (12,149)
Total 55,770 36,073
17 | TAXES ON INCOME
2002 2001
CURRENT TAXES € ´000 € ´000
Domestic
Corporate income tax/solidarity surcharge 17,855 12,228
Municipal trade tax 11,175 8,206
Subtotal current taxes domestic 29,030 20,434
Foreign 3,331 3,907
Total current taxes 32,361 24,341
2002 2001
DEFERRED TAXES € ´000 € ´000
Domestic
Corporate income tax/solidarity surcharge (5,353) (427)
Municipal trade tax (3,649) (290)
Subtotal deferred taxes domestic (9,002) (717)
Foreign (597) (1,425)
Total deferred taxes (9,599) (2,142)
Total taxes on income 22,762 22,199
Deferred taxes of domestic companies were determined based on a tax rate of 37% in the case of temporary
differences.
Since CLAAS has no extraordinary expenses to disclose the profits from ordinary activities and the
income before taxes are identical.
Taxes on income are composed of current taxes and deferred taxes.
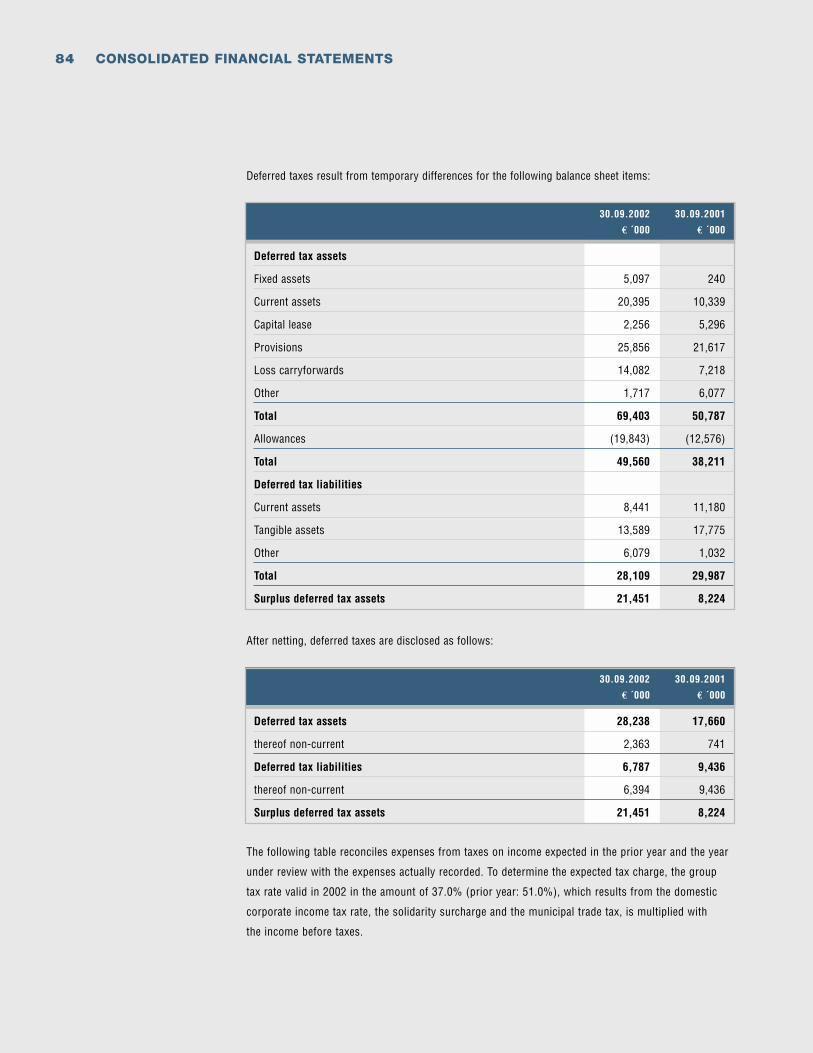
84 CONSOLIDATED FINANCIAL STATEMENTS
Deferred taxes result from temporary differences for the following balance sheet items:
After netting, deferred taxes are disclosed as follows:
The following table reconciles expenses from taxes on income expected in the prior year and the year
under review with the expenses actually recorded. To determine the expected tax charge, the group
tax rate valid in 2002 in the amount of 37.0% (prior year: 51.0%), which results from the domestic
corporate income tax rate, the solidarity surcharge and the municipal trade tax, is multiplied with
the income before taxes.
30.09.2002 30.09.2001
€ ´000 € ´000
Deferred tax assets
Fixed assets 5,097 240
Current assets 20,395 10,339
Capital lease 2,256 5,296
Provisions 25,856 21,617
Loss carryforwards 14,082 7,218
Other 1,717 6,077
Total 69,403 50,787
Allowances (19,843) (12,576)
Total 49,560 38,211
Deferred tax liabilities
Current assets 8,441 11,180
Tangible assets 13,589 17,775
Other 6,079 1,032
Total 28,109 29,987
Surplus deferred tax assets 21,451 8,224
30.09.2002 30.09.2001
€ ´000 € ´000
Deferred tax assets 28,238 17,660
thereof non-current 2,363 741
Deferred tax liabilities 6,787 9,436
thereof non-current 6,394 9,436
Surplus deferred tax assets 21,451 8,224
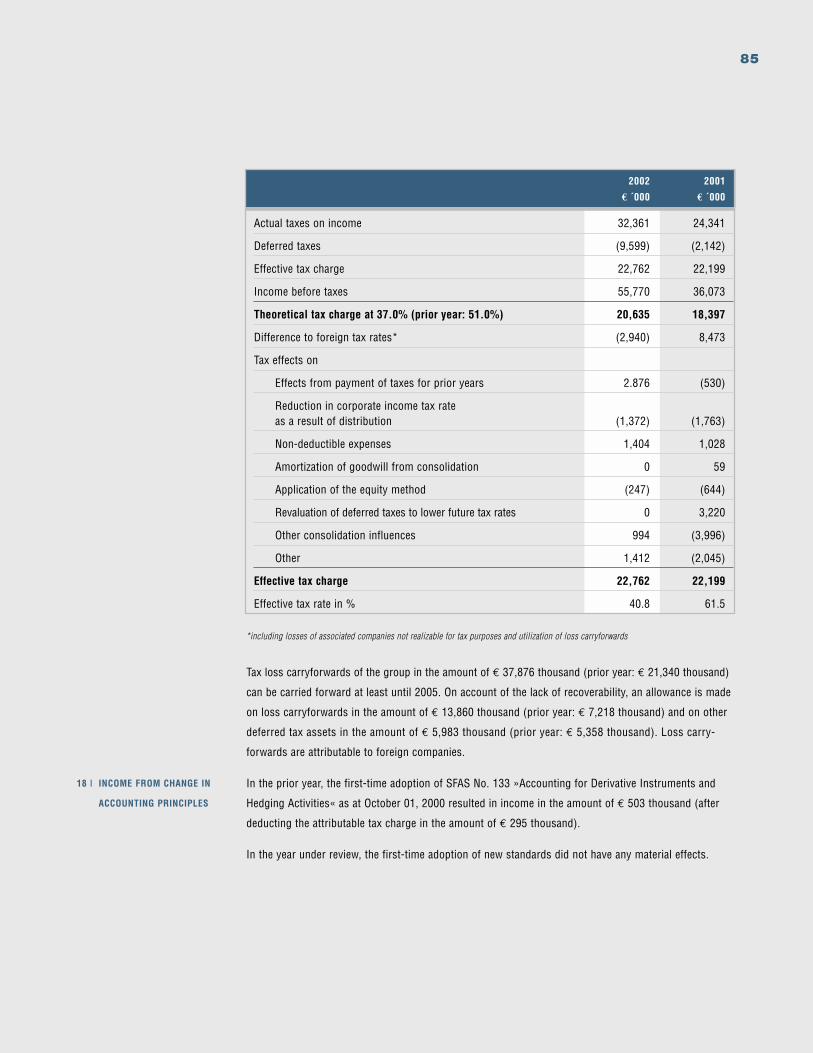
85
*including losses of associated companies not realizable for tax purposes and utilization of loss carryforwards
2002 2001
€ ´000 € ´000
Actual taxes on income 32,361 24,341
Deferred taxes (9,599) (2,142)
Effective tax charge 22,762 22,199
Income before taxes 55,770 36,073
Theoretical tax charge at 37.0% (prior year: 51.0%) 20,635 18,397
Difference to foreign tax rates* (2,940) 8,473
Tax effects on
Effects from payment of taxes for prior years 2.876 (530)
Reduction in corporate income tax rate as a result of distribution (1,372) (1,763)
Non-deductible expenses 1,404 1,028
Amortization of goodwill from consolidation 0 59
Application of the equity method (247) (644)
Revaluation of deferred taxes to lower future tax rates 0 3,220
Other consolidation influences 994 (3,996)
Other 1,412 (2,045)
Effective tax charge 22,762 22,199
Effective tax rate in % 40.8 61.5
Tax loss carryforwards of the group in the amount of € 37,876 thousand (prior year: € 21,340 thousand)
can be carried forward at least until 2005. On account of the lack of recoverability, an allowance is made
on loss carryforwards in the amount of € 13,860 thousand (prior year: € 7,218 thousand) and on other
deferred tax assets in the amount of € 5,983 thousand (prior year: € 5,358 thousand). Loss carry-
forwards are attributable to foreign companies.
In the prior year, the first-time adoption of SFAS No. 133 »Accounting for Derivative Instruments and
Hedging Activities« as at October 01, 2000 resulted in income in the amount of € 503 thousand (after
deducting the attributable tax charge in the amount of € 295 thousand).
In the year under review, the first-time adoption of new standards did not have any material effects.
18 | INCOME FROM CHANGE IN
ACCOUNTING PRINCIPLES
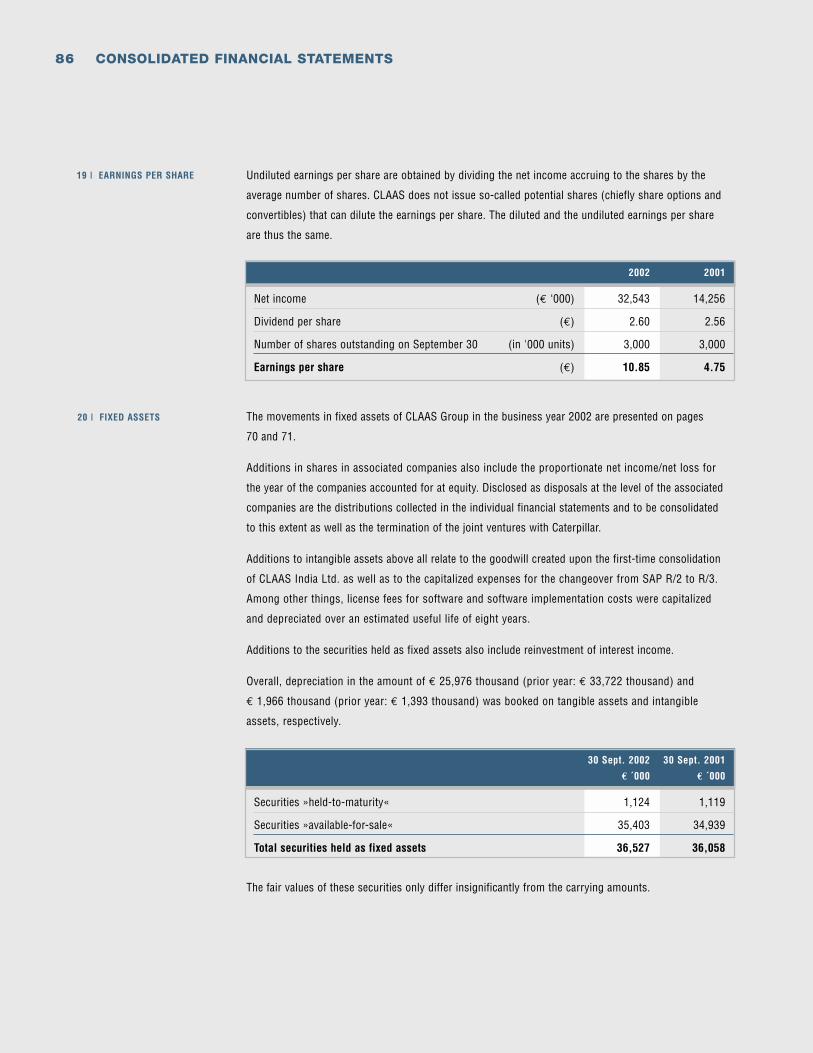
86 CONSOLIDATED FINANCIAL STATEMENTS
The fair values of these securities only differ insignificantly from the carrying amounts.
The movements in fixed assets of CLAAS Group in the business year 2002 are presented on pages
70 and 71.
Additions in shares in associated companies also include the proportionate net income/net loss for
the year of the companies accounted for at equity. Disclosed as disposals at the level of the associated
companies are the distributions collected in the individual financial statements and to be consolidated
to this extent as well as the termination of the joint ventures with Caterpillar.
Additions to intangible assets above all relate to the goodwill created upon the first-time consolidation
of CLAAS India Ltd. as well as to the capitalized expenses for the changeover from SAP R/2 to R/3.
Among other things, license fees for software and software implementation costs were capitalized
and depreciated over an estimated useful life of eight years.
Additions to the securities held as fixed assets also include reinvestment of interest income.
Overall, depreciation in the amount of € 25,976 thousand (prior year: € 33,722 thousand) and
€ 1,966 thousand (prior year: € 1,393 thousand) was booked on tangible assets and intangible
assets, respectively.
20 | FIXED ASSETS
2002 2001
Net income (€ ‘000) 32,543 14,256
Dividend per share (€) 2.60 2.56
Number of shares outstanding on September 30 (in '000 units) 3,000 3,000
Earnings per share (€) 10.85 4.75
30 Sept. 2002 30 Sept. 2001
€ ´000 € ´000
Securities »held-to-maturity« 1,124 1,119
Securities »available-for-sale« 35,403 34,939
Total securities held as fixed assets 36,527 36,058
Undiluted earnings per share are obtained by dividing the net income accruing to the shares by the
average number of shares. CLAAS does not issue so-called potential shares (chiefly share options and
convertibles) that can dilute the earnings per share. The diluted and the undiluted earnings per share
are thus the same.
19 | EARNINGS PER SHARE
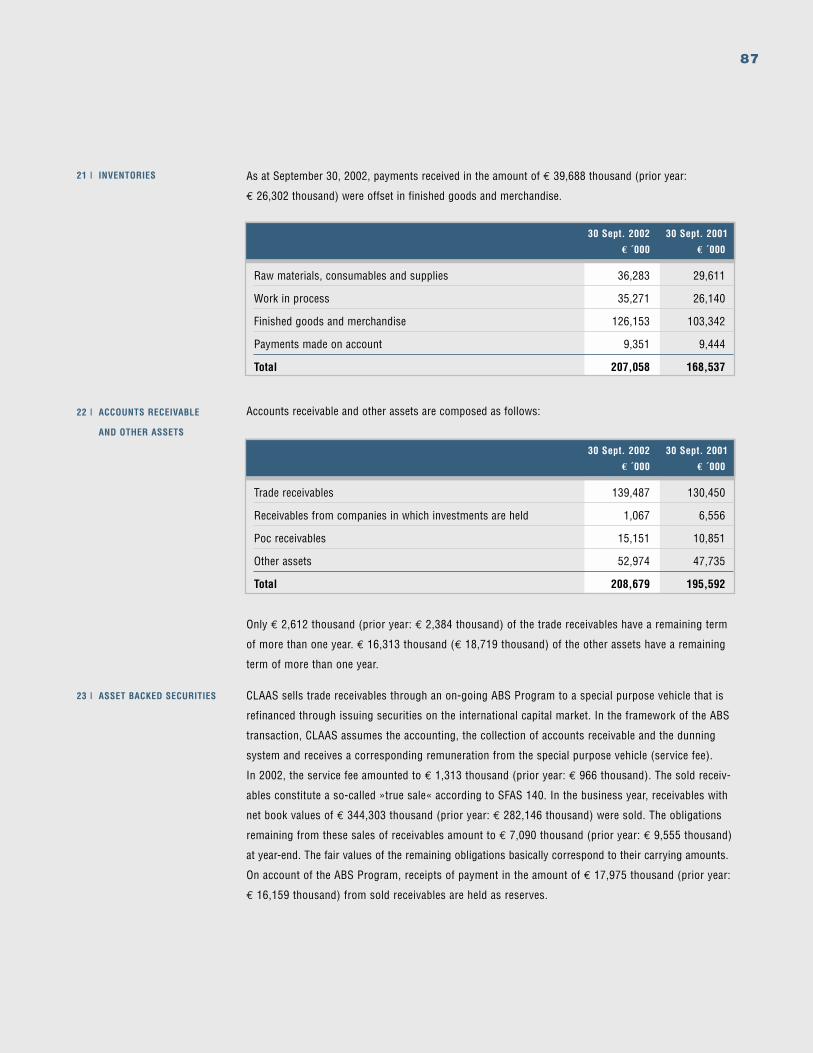
87
As at September 30, 2002, payments received in the amount of € 39,688 thousand (prior year:
€ 26,302 thousand) were offset in finished goods and merchandise.
Accounts receivable and other assets are composed as follows:
21 | INVENTORIES
22 | ACCOUNTS RECEIVABLE
AND OTHER ASSETS
30 Sept. 2002 30 Sept. 2001
€ ´000 € ´000
Trade receivables 139,487 130,450
Receivables from companies in which investments are held 1,067 6,556
Poc receivables 15,151 10,851
Other assets 52,974 47,735
Total 208,679 195,592
30 Sept. 2002 30 Sept. 2001
€ ´000 € ´000
Raw materials, consumables and supplies 36,283 29,611
Work in process 35,271 26,140
Finished goods and merchandise 126,153 103,342
Payments made on account 9,351 9,444
Total 207,058 168,537
Only € 2,612 thousand (prior year: € 2,384 thousand) of the trade receivables have a remaining term
of more than one year. € 16,313 thousand (€ 18,719 thousand) of the other assets have a remaining
term of more than one year.
CLAAS sells trade receivables through an on-going ABS Program to a special purpose vehicle that is
refinanced through issuing securities on the international capital market. In the framework of the ABS
transaction, CLAAS assumes the accounting, the collection of accounts receivable and the dunning
system and receives a corresponding remuneration from the special purpose vehicle (service fee).
In 2002, the service fee amounted to € 1,313 thousand (prior year: € 966 thousand). The sold receiv-
ables constitute a so-called »true sale« according to SFAS 140. In the business year, receivables with
net book values of € 344,303 thousand (prior year: € 282,146 thousand) were sold. The obligations
remaining from these sales of receivables amount to € 7,090 thousand (prior year: € 9,555 thousand)
at year-end. The fair values of the remaining obligations basically correspond to their carrying amounts.
On account of the ABS Program, receipts of payment in the amount of € 17,975 thousand (prior year:
€ 16,159 thousand) from sold receivables are held as reserves.
23 | ASSET BACKED SECURITIES
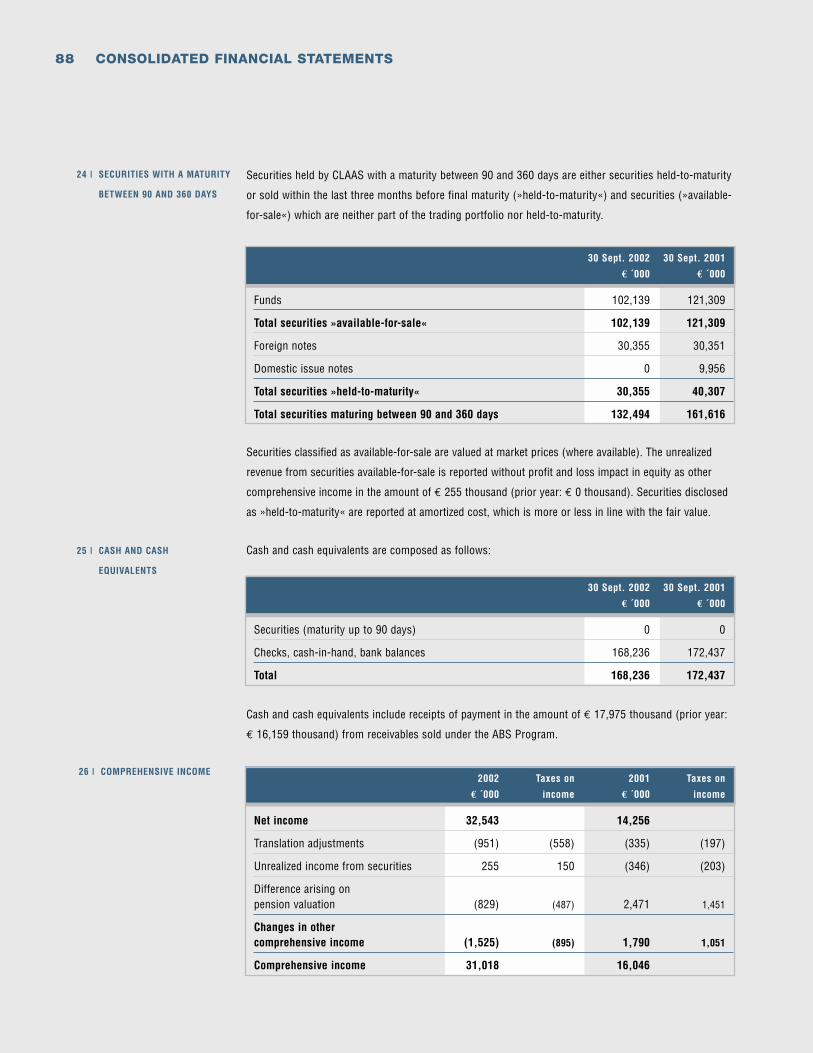
88 CONSOLIDATED FINANCIAL STATEMENTS
Securities classified as available-for-sale are valued at market prices (where available). The unrealized
revenue from securities available-for-sale is reported without profit and loss impact in equity as other
comprehensive income in the amount of € 255 thousand (prior year: € 0 thousand). Securities disclosed
as »held-to-maturity« are reported at amortized cost, which is more or less in line with the fair value.
Cash and cash equivalents are composed as follows:
Cash and cash equivalents include receipts of payment in the amount of € 17,975 thousand (prior year:
€ 16,159 thousand) from receivables sold under the ABS Program.
Securities held by CLAAS with a maturity between 90 and 360 days are either securities held-to-maturity
or sold within the last three months before final maturity (»held-to-maturity«) and securities (»available-
for-sale«) which are neither part of the trading portfolio nor held-to-maturity.
25 | CASH AND CASH
EQUIVALENTS
26 | COMPREHENSIVE INCOME
30 Sept. 2002 30 Sept. 2001
€ ´000 € ´000
Funds 102,139 121,309
Total securities »available-for-sale« 102,139 121,309
Foreign notes 30,355 30,351
Domestic issue notes 0 9,956
Total securities »held-to-maturity« 30,355 40,307
Total securities maturing between 90 and 360 days 132,494 161,616
30 Sept. 2002 30 Sept. 2001
€ ´000 € ´000
Securities (maturity up to 90 days) 0 0
Checks, cash-in-hand, bank balances 168,236 172,437
Total 168,236 172,437
2002 Taxes on 2001 Taxes on
€ ´000 income € ´000 income
Net income 32,543 14,256
Translation adjustments (951) (558) (335) (197)
Unrealized income from securities 255 150 (346) (203)
Difference arising on pension valuation (829) (487) 2,471 1,451
Changes in other comprehensive income (1,525) (895) 1,790 1,051
Comprehensive income 31,018 16,046
24 | SECURITIES WITH A MATURITY
BETWEEN 90 AND 360 DAYS
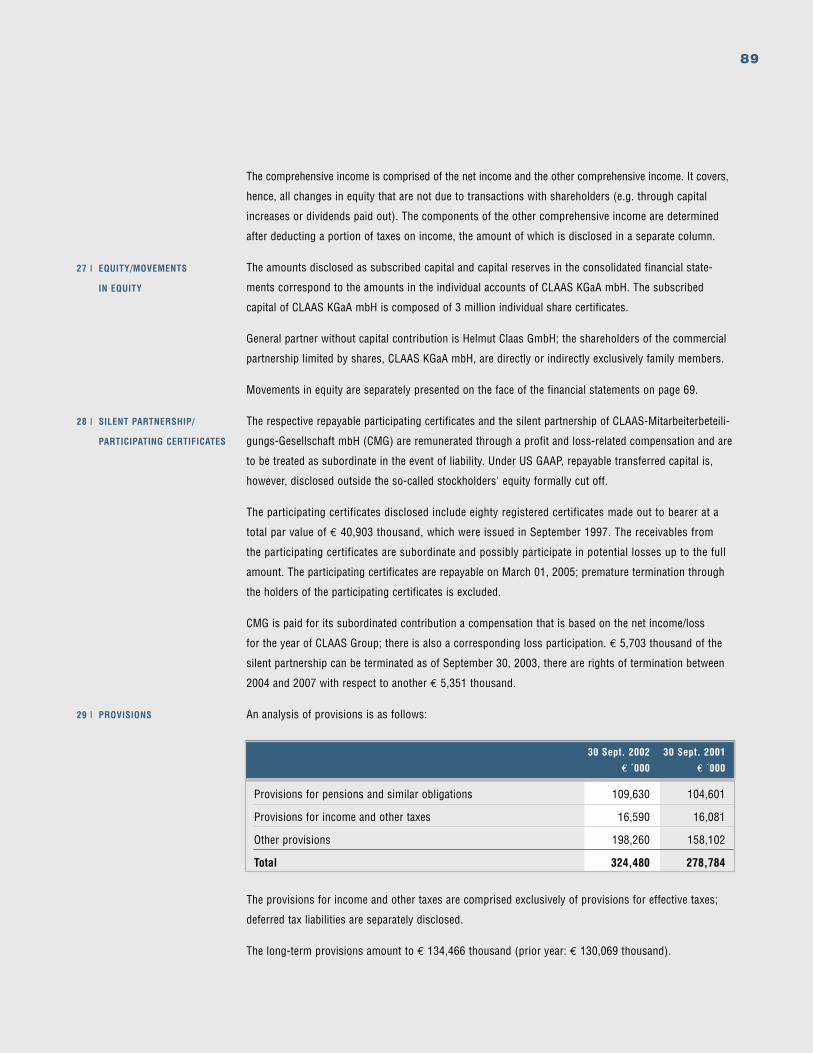
89
The comprehensive income is comprised of the net income and the other comprehensive income. It covers,
hence, all changes in equity that are not due to transactions with shareholders (e.g. through capital
increases or dividends paid out). The components of the other comprehensive income are determined
after deducting a portion of taxes on income, the amount of which is disclosed in a separate column.
The amounts disclosed as subscribed capital and capital reserves in the consolidated financial state-
ments correspond to the amounts in the individual accounts of CLAAS KGaA mbH. The subscribed
capital of CLAAS KGaA mbH is composed of 3 million individual share certificates.
General partner without capital contribution is Helmut Claas GmbH; the shareholders of the commercial
partnership limited by shares, CLAAS KGaA mbH, are directly or indirectly exclusively family members.
Movements in equity are separately presented on the face of the financial statements on page 69.
The respective repayable participating certificates and the silent partnership of CLAAS-Mitarbeiterbeteili-
gungs-Gesellschaft mbH (CMG) are remunerated through a profit and loss-related compensation and are
to be treated as subordinate in the event of liability. Under US GAAP, repayable transferred capital is,
however, disclosed outside the so-called stockholders' equity formally cut off.
The participating certificates disclosed include eighty registered certificates made out to bearer at a
total par value of € 40,903 thousand, which were issued in September 1997. The receivables from
the participating certificates are subordinate and possibly participate in potential losses up to the full
amount. The participating certificates are repayable on March 01, 2005; premature termination through
the holders of the participating certificates is excluded.
CMG is paid for its subordinated contribution a compensation that is based on the net income/loss
for the year of CLAAS Group; there is also a corresponding loss participation. € 5,703 thousand of the
silent partnership can be terminated as of September 30, 2003, there are rights of termination between
2004 and 2007 with respect to another € 5,351 thousand.
An analysis of provisions is as follows:
27 | EQUITY/MOVEMENTS
IN EQUITY
28 | SILENT PARTNERSHIP/
PARTICIPATING CERTIFICATES
The provisions for income and other taxes are comprised exclusively of provisions for effective taxes;
deferred tax liabilities are separately disclosed.
The long-term provisions amount to € 134,466 thousand (prior year: € 130,069 thousand).
29 | PROVISIONS
30 Sept. 2002 30 Sept. 2001
€ ´000 € ´000
Provisions for pensions and similar obligations 109,630 104,601
Provisions for income and other taxes 16,590 16,081
Other provisions 198,260 158,102
Total 324,480 278,784
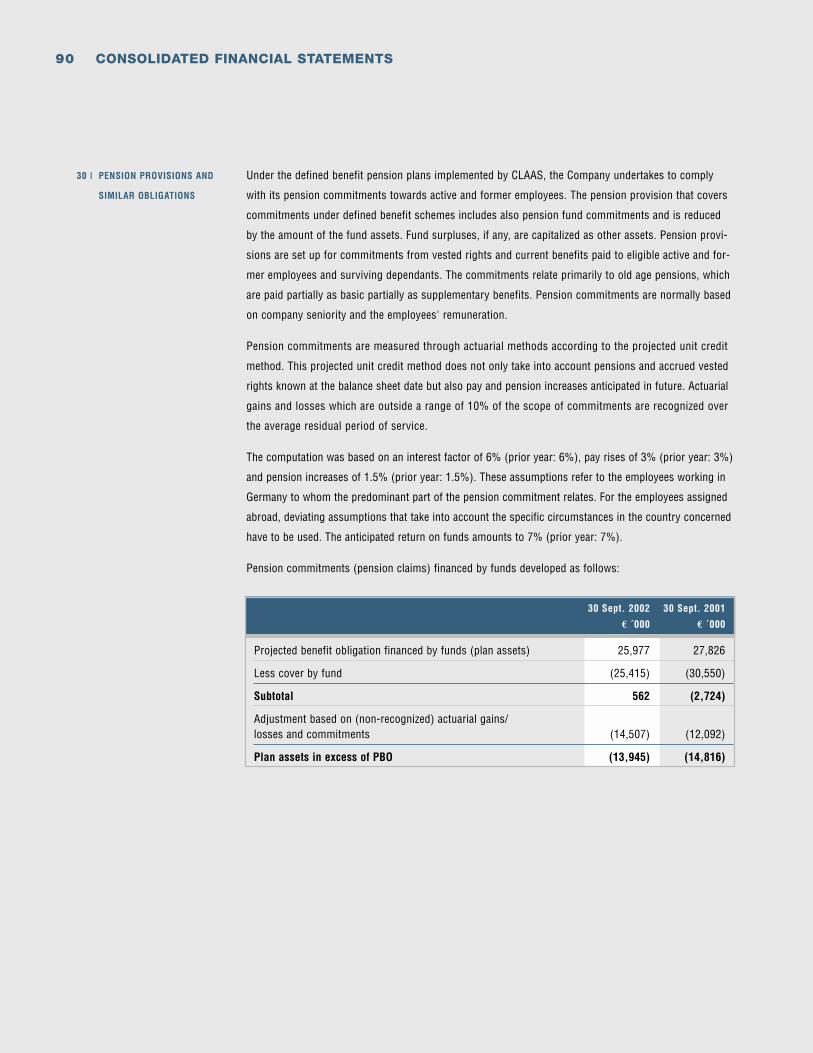
90 CONSOLIDATED FINANCIAL STATEMENTS
Under the defined benefit pension plans implemented by CLAAS, the Company undertakes to comply
with its pension commitments towards active and former employees. The pension provision that covers
commitments under defined benefit schemes includes also pension fund commitments and is reduced
by the amount of the fund assets. Fund surpluses, if any, are capitalized as other assets. Pension provi-
sions are set up for commitments from vested rights and current benefits paid to eligible active and for-
mer employees and surviving dependants. The commitments relate primarily to old age pensions, which
are paid partially as basic partially as supplementary benefits. Pension commitments are normally based
on company seniority and the employees' remuneration.
Pension commitments are measured through actuarial methods according to the projected unit credit
method. This projected unit credit method does not only take into account pensions and accrued vested
rights known at the balance sheet date but also pay and pension increases anticipated in future. Actuarial
gains and losses which are outside a range of 10% of the scope of commitments are recognized over
the average residual period of service.
The computation was based on an interest factor of 6% (prior year: 6%), pay rises of 3% (prior year: 3%)
and pension increases of 1.5% (prior year: 1.5%). These assumptions refer to the employees working in
Germany to whom the predominant part of the pension commitment relates. For the employees assigned
abroad, deviating assumptions that take into account the specific circumstances in the country concerned
have to be used. The anticipated return on funds amounts to 7% (prior year: 7%).
Pension commitments (pension claims) financed by funds developed as follows:
30 | PENSION PROVISIONS AND
SIMILAR OBLIGATIONS
30 Sept. 2002 30 Sept. 2001
€ ´000 € ´000
Projected benefit obligation financed by funds (plan assets) 25,977 27,826
Less cover by fund (25,415) (30,550)
Subtotal 562 (2,724)
Adjustment based on (non-recognized) actuarial gains/losses and commitments (14,507) (12,092)
Plan assets in excess of PBO (13,945) (14,816)
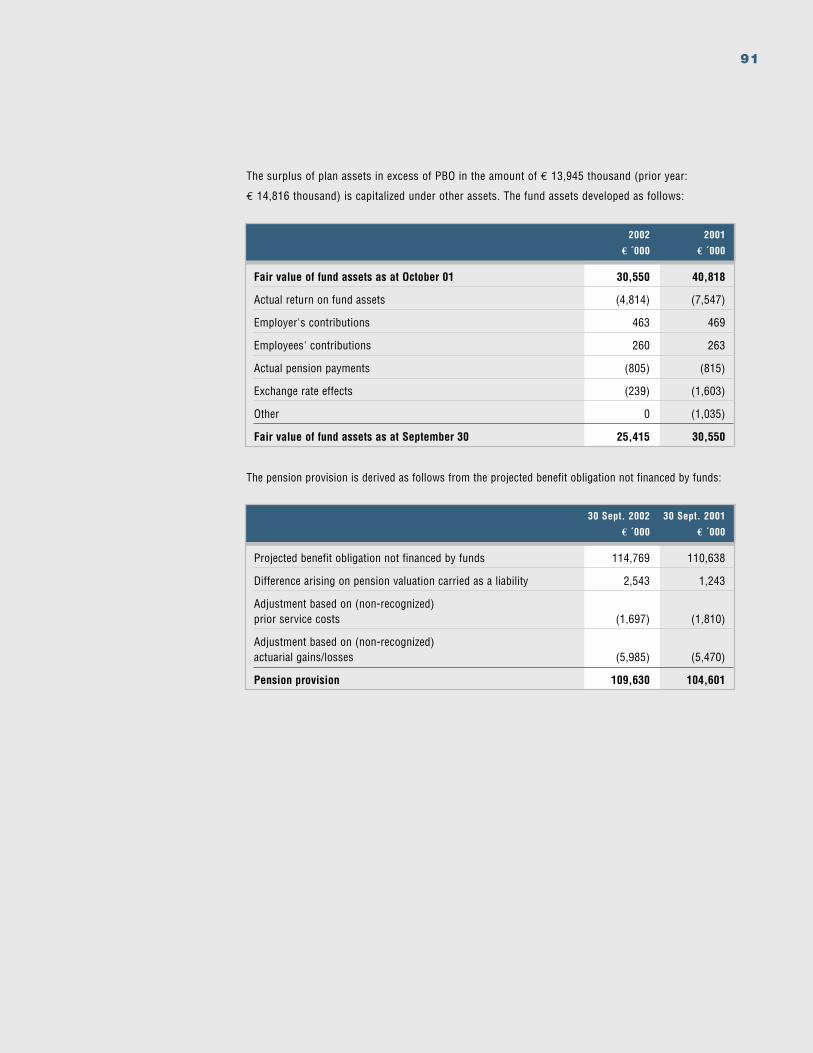
91
The surplus of plan assets in excess of PBO in the amount of € 13,945 thousand (prior year:
€ 14,816 thousand) is capitalized under other assets. The fund assets developed as follows:
2002 2001
€ ´000 € ´000
Fair value of fund assets as at October 01 30,550 40,818
Actual return on fund assets (4,814) (7,547)
Employer's contributions 463 469
Employees' contributions 260 263
Actual pension payments (805) (815)
Exchange rate effects (239) (1,603)
Other 0 (1,035)
Fair value of fund assets as at September 30 25,415 30,550
The pension provision is derived as follows from the projected benefit obligation not financed by funds:
30 Sept. 2002 30 Sept. 2001
€ ´000 € ´000
Projected benefit obligation not financed by funds 114,769 110,638
Difference arising on pension valuation carried as a liability 2,543 1,243
Adjustment based on (non-recognized) prior service costs (1,697) (1,810)
Adjustment based on (non-recognized) actuarial gains/losses (5,985) (5,470)
Pension provision 109,630 104,601
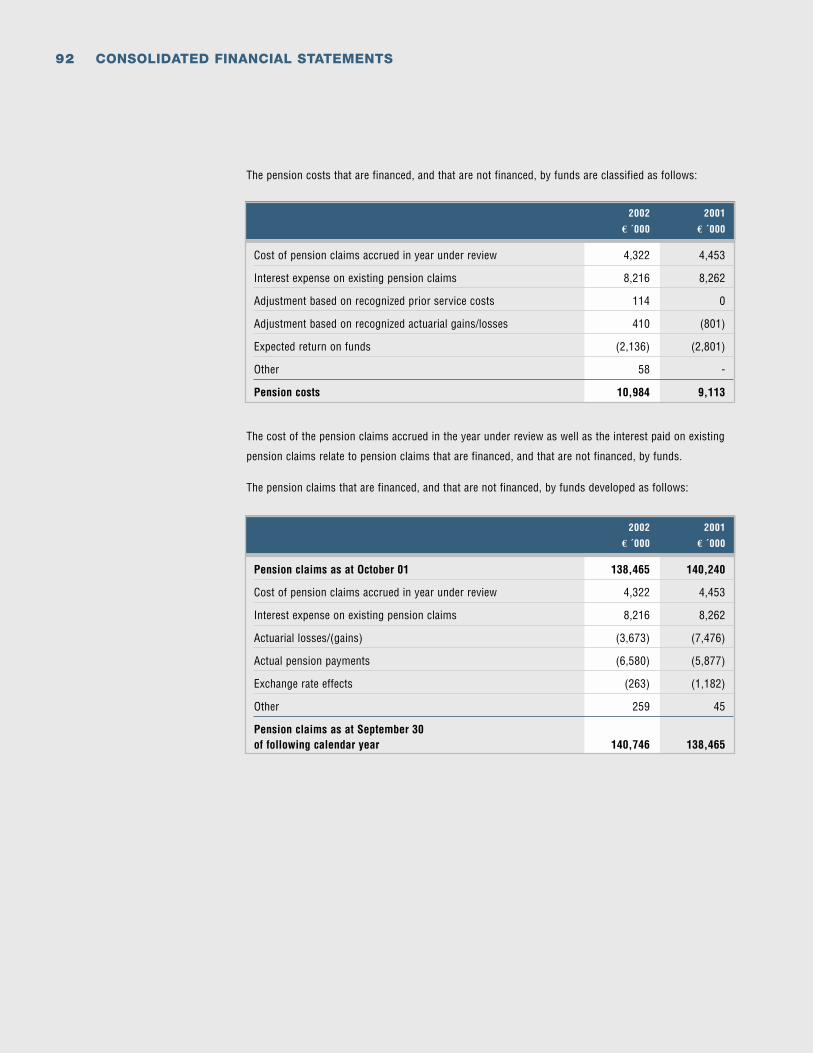
92 CONSOLIDATED FINANCIAL STATEMENTS
The pension costs that are financed, and that are not financed, by funds are classified as follows:
The cost of the pension claims accrued in the year under review as well as the interest paid on existing
pension claims relate to pension claims that are financed, and that are not financed, by funds.
The pension claims that are financed, and that are not financed, by funds developed as follows:
2002 2001
€ ´000 € ´000
Cost of pension claims accrued in year under review 4,322 4,453
Interest expense on existing pension claims 8,216 8,262
Adjustment based on recognized prior service costs 114 0
Adjustment based on recognized actuarial gains/losses 410 (801)
Expected return on funds (2,136) (2,801)
Other 58 -
Pension costs 10,984 9,113
2002 2001
€ ´000 € ´000
Pension claims as at October 01 138,465 140,240
Cost of pension claims accrued in year under review 4,322 4,453
Interest expense on existing pension claims 8,216 8,262
Actuarial losses/(gains) (3,673) (7,476)
Actual pension payments (6,580) (5,877)
Exchange rate effects (263) (1,182)
Other 259 45
Pension claims as at September 30 of following calendar year 140,746 138,465
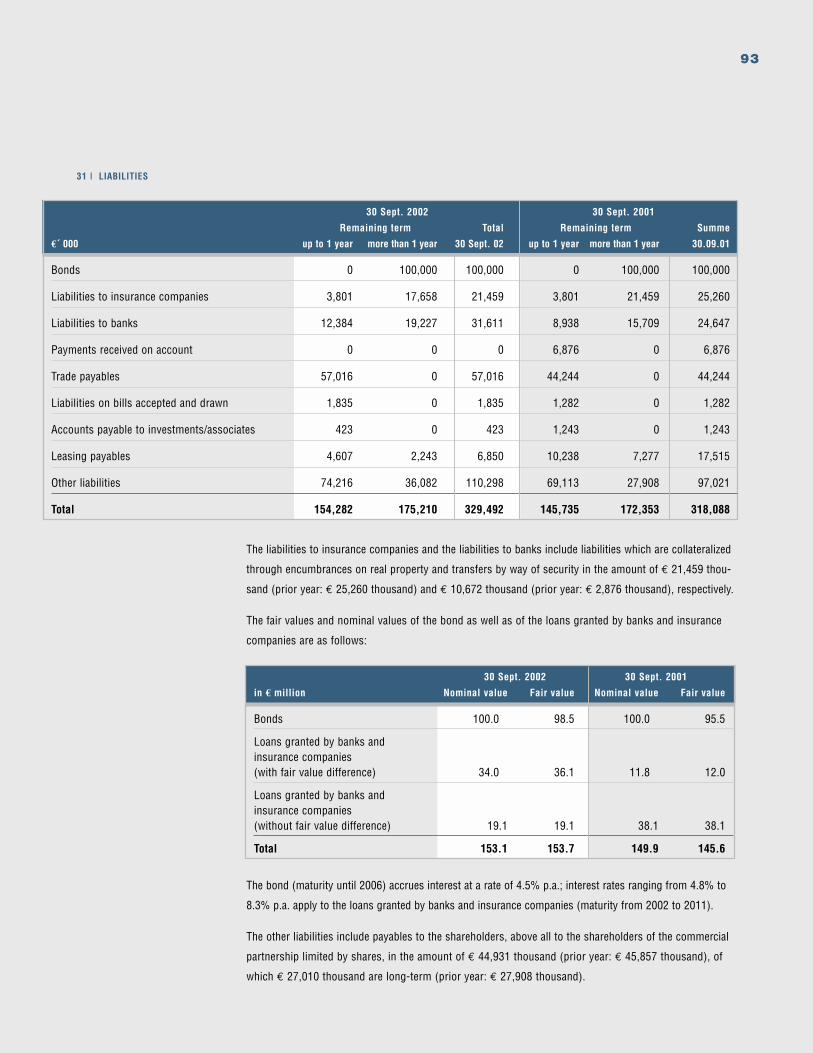
93
30 Sept. 2002 30 Sept. 2001
Remaining term Total Remaining term Summe
€´ 000 up to 1 year more than 1 year 30 Sept. 02 up to 1 year more than 1 year 30.09.01
Bonds 0 100,000 100,000 0 100,000 100,000
Liabilities to insurance companies 3,801 17,658 21,459 3,801 21,459 25,260
Liabilities to banks 12,384 19,227 31,611 8,938 15,709 24,647
Payments received on account 0 0 0 6,876 0 6,876
Trade payables 57,016 0 57,016 44,244 0 44,244
Liabilities on bills accepted and drawn 1,835 0 1,835 1,282 0 1,282
Accounts payable to investments/associates 423 0 423 1,243 0 1,243
Leasing payables 4,607 2,243 6,850 10,238 7,277 17,515
Other liabilities 74,216 36,082 110,298 69,113 27,908 97,021
Total 154,282 175,210 329,492 145,735 172,353 318,088
31 | LIABILITIES
The liabilities to insurance companies and the liabilities to banks include liabilities which are collateralized
through encumbrances on real property and transfers by way of security in the amount of € 21,459 thou-
sand (prior year: € 25,260 thousand) and € 10,672 thousand (prior year: € 2,876 thousand), respectively.
The fair values and nominal values of the bond as well as of the loans granted by banks and insurance
companies are as follows:
30 Sept. 2002 30 Sept. 2001
in € million Nominal value Fair value Nominal value Fair value
Bonds 100.0 98.5 100.0 95.5
Loans granted by banks and insurance companies (with fair value difference) 34.0 36.1 11.8 12.0
Loans granted by banks and insurance companies (without fair value difference) 19.1 19.1 38.1 38.1
Total 153.1 153.7 149.9 145.6
The bond (maturity until 2006) accrues interest at a rate of 4.5% p.a.; interest rates ranging from 4.8% to
8.3% p.a. apply to the loans granted by banks and insurance companies (maturity from 2002 to 2011).
The other liabilities include payables to the shareholders, above all to the shareholders of the commercial
partnership limited by shares, in the amount of € 44,931 thousand (prior year: € 45,857 thousand), of
which € 27,010 thousand are long-term (prior year: € 27,908 thousand).
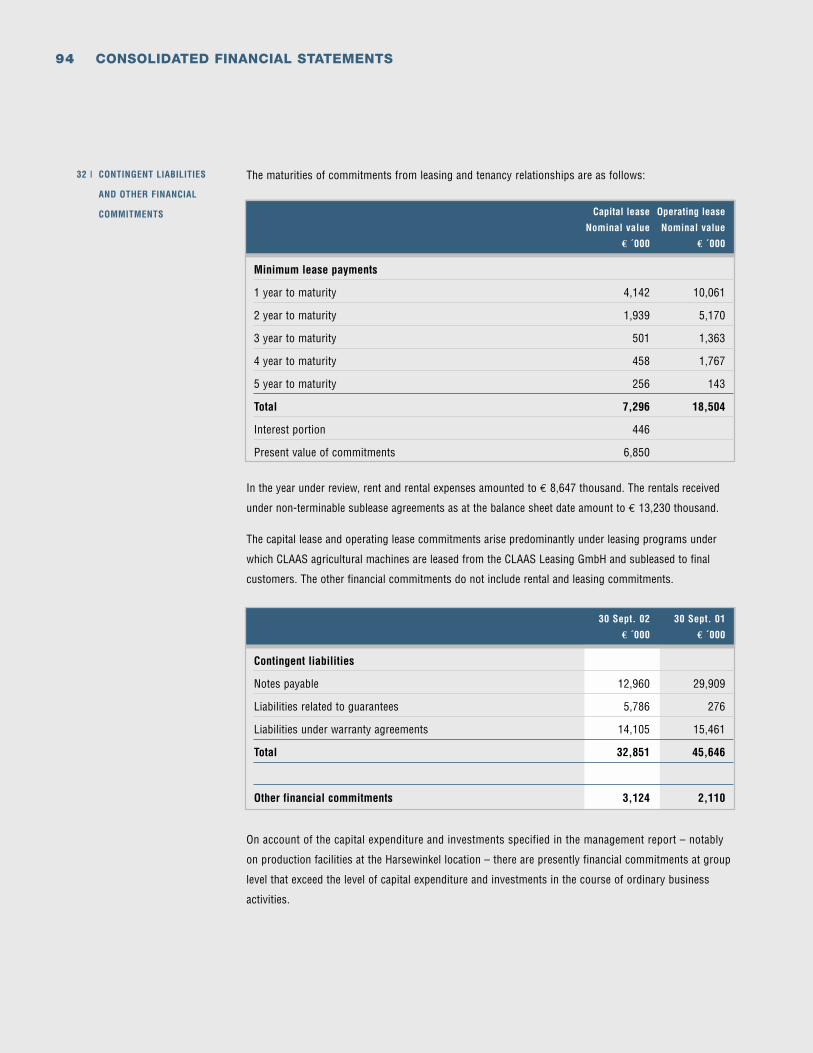
94 CONSOLIDATED FINANCIAL STATEMENTS
In the year under review, rent and rental expenses amounted to € 8,647 thousand. The rentals received
under non-terminable sublease agreements as at the balance sheet date amount to € 13,230 thousand.
The capital lease and operating lease commitments arise predominantly under leasing programs under
which CLAAS agricultural machines are leased from the CLAAS Leasing GmbH and subleased to final
customers. The other financial commitments do not include rental and leasing commitments.
On account of the capital expenditure and investments specified in the management report – notably
on production facilities at the Harsewinkel location – there are presently financial commitments at group
level that exceed the level of capital expenditure and investments in the course of ordinary business
activities.
The maturities of commitments from leasing and tenancy relationships are as follows:32 | CONTINGENT LIABILITIES
AND OTHER FINANCIAL
COMMITMENTS Capital lease Operating lease
Nominal value Nominal value
€ ´000 € ´000
Minimum lease payments
1 year to maturity 4,142 10,061
2 year to maturity 1,939 5,170
3 year to maturity 501 1,363
4 year to maturity 458 1,767
5 year to maturity 256 143
Total 7,296 18,504
Interest portion 446
Present value of commitments 6,850
30 Sept. 02 30 Sept. 01
€ ´000 € ´000
Contingent liabilities
Notes payable 12,960 29,909
Liabilities related to guarantees 5,786 276
Liabilities under warranty agreements 14,105 15,461
Total 32,851 45,646
Other financial commitments 3,124 2,110
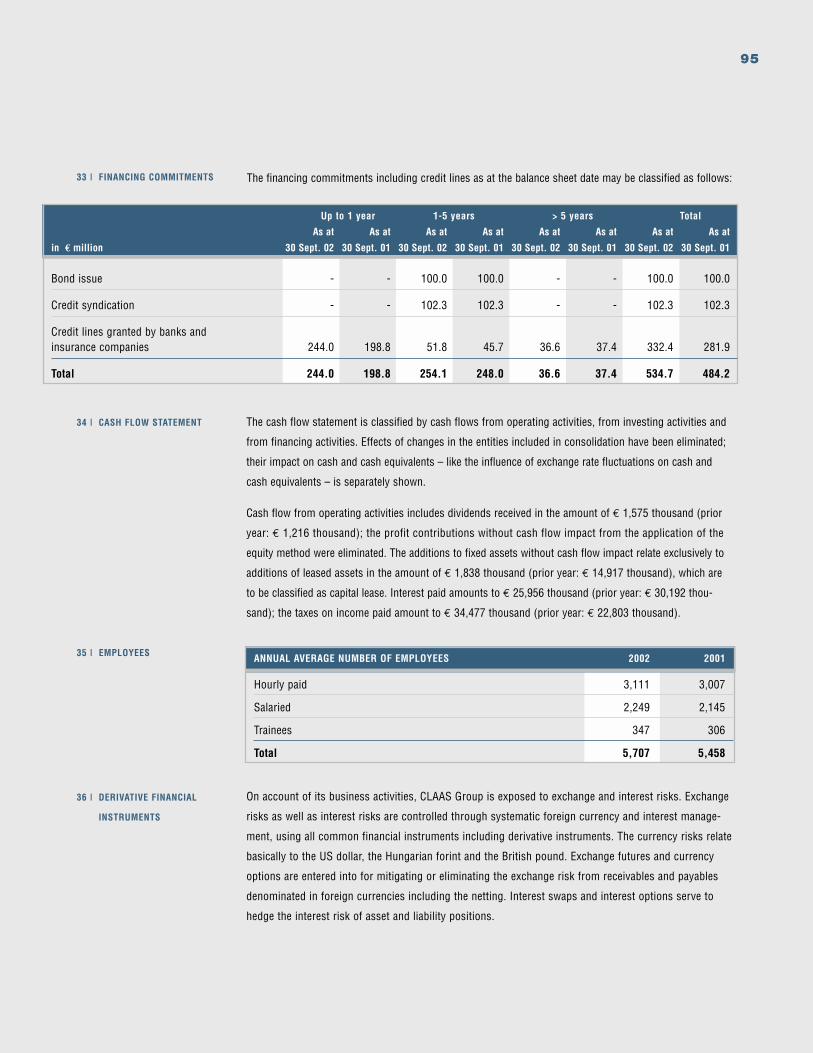
95
The financing commitments including credit lines as at the balance sheet date may be classified as follows:33 | FINANCING COMMITMENTS
Up to 1 year 1-5 years > 5 years Total
As at As at As at As at As at As at As at As at
in € million 30 Sept. 02 30 Sept. 01 30 Sept. 02 30 Sept. 01 30 Sept. 02 30 Sept. 01 30 Sept. 02 30 Sept. 01
Bond issue - - 100.0 100.0 - - 100.0 100.0
Credit syndication - - 102.3 102.3 - - 102.3 102.3
Credit lines granted by banks and insurance companies 244.0 198.8 51.8 45.7 36.6 37.4 332.4 281.9
Total 244.0 198.8 254.1 248.0 36.6 37.4 534.7 484.2
The cash flow statement is classified by cash flows from operating activities, from investing activities and
from financing activities. Effects of changes in the entities included in consolidation have been eliminated;
their impact on cash and cash equivalents – like the influence of exchange rate fluctuations on cash and
cash equivalents – is separately shown.
Cash flow from operating activities includes dividends received in the amount of € 1,575 thousand (prior
year: € 1,216 thousand); the profit contributions without cash flow impact from the application of the
equity method were eliminated. The additions to fixed assets without cash flow impact relate exclusively to
additions of leased assets in the amount of € 1,838 thousand (prior year: € 14,917 thousand), which are
to be classified as capital lease. Interest paid amounts to € 25,956 thousand (prior year: € 30,192 thou-
sand); the taxes on income paid amount to € 34,477 thousand (prior year: € 22,803 thousand).
34 | CASH FLOW STATEMENT
35 | EMPLOYEES ANNUAL AVERAGE NUMBER OF EMPLOYEES 2002 2001
Hourly paid 3,111 3,007
Salaried 2,249 2,145
Trainees 347 306
Total 5,707 5,458
On account of its business activities, CLAAS Group is exposed to exchange and interest risks. Exchange
risks as well as interest risks are controlled through systematic foreign currency and interest manage-
ment, using all common financial instruments including derivative instruments. The currency risks relate
basically to the US dollar, the Hungarian forint and the British pound. Exchange futures and currency
options are entered into for mitigating or eliminating the exchange risk from receivables and payables
denominated in foreign currencies including the netting. Interest swaps and interest options serve to
hedge the interest risk of asset and liability positions.
36 | DERIVATIVE FINANCIAL
INSTRUMENTS
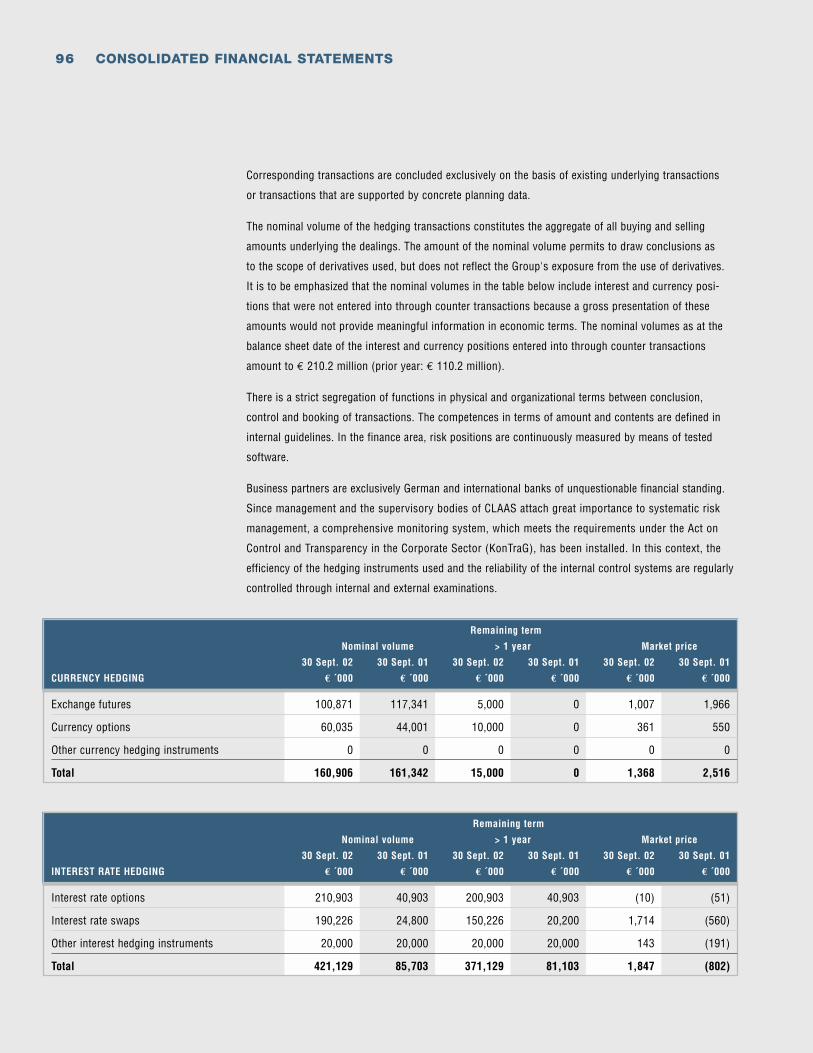
96 CONSOLIDATED FINANCIAL STATEMENTS
Remaining term
Nominal volume > 1 year Market price
30 Sept. 02 30 Sept. 01 30 Sept. 02 30 Sept. 01 30 Sept. 02 30 Sept. 01
CURRENCY HEDGING € ´000 € ´000 € ´000 € ´000 € ´000 € ´000
Exchange futures 100,871 117,341 5,000 0 1,007 1,966
Currency options 60,035 44,001 10,000 0 361 550
Other currency hedging instruments 0 0 0 0 0 0
Total 160,906 161,342 15,000 0 1,368 2,516
Remaining term
Nominal volume > 1 year Market price
30 Sept. 02 30 Sept. 01 30 Sept. 02 30 Sept. 01 30 Sept. 02 30 Sept. 01
INTEREST RATE HEDGING € ´000 € ´000 € ´000 € ´000 € ´000 € ´000
Interest rate options 210,903 40,903 200,903 40,903 (10) (51)
Interest rate swaps 190,226 24,800 150,226 20,200 1,714 (560)
Other interest hedging instruments 20,000 20,000 20,000 20,000 143 (191)
Total 421,129 85,703 371,129 81,103 1,847 (802)
Corresponding transactions are concluded exclusively on the basis of existing underlying transactions
or transactions that are supported by concrete planning data.
The nominal volume of the hedging transactions constitutes the aggregate of all buying and selling
amounts underlying the dealings. The amount of the nominal volume permits to draw conclusions as
to the scope of derivatives used, but does not reflect the Group's exposure from the use of derivatives.
It is to be emphasized that the nominal volumes in the table below include interest and currency posi-
tions that were not entered into through counter transactions because a gross presentation of these
amounts would not provide meaningful information in economic terms. The nominal volumes as at the
balance sheet date of the interest and currency positions entered into through counter transactions
amount to € 210.2 million (prior year: € 110.2 million).
There is a strict segregation of functions in physical and organizational terms between conclusion,
control and booking of transactions. The competences in terms of amount and contents are defined in
internal guidelines. In the finance area, risk positions are continuously measured by means of tested
software.
Business partners are exclusively German and international banks of unquestionable financial standing.
Since management and the supervisory bodies of CLAAS attach great importance to systematic risk
management, a comprehensive monitoring system, which meets the requirements under the Act on
Control and Transparency in the Corporate Sector (KonTraG), has been installed. In this context, the
efficiency of the hedging instruments used and the reliability of the internal control systems are regularly
controlled through internal and external examinations.
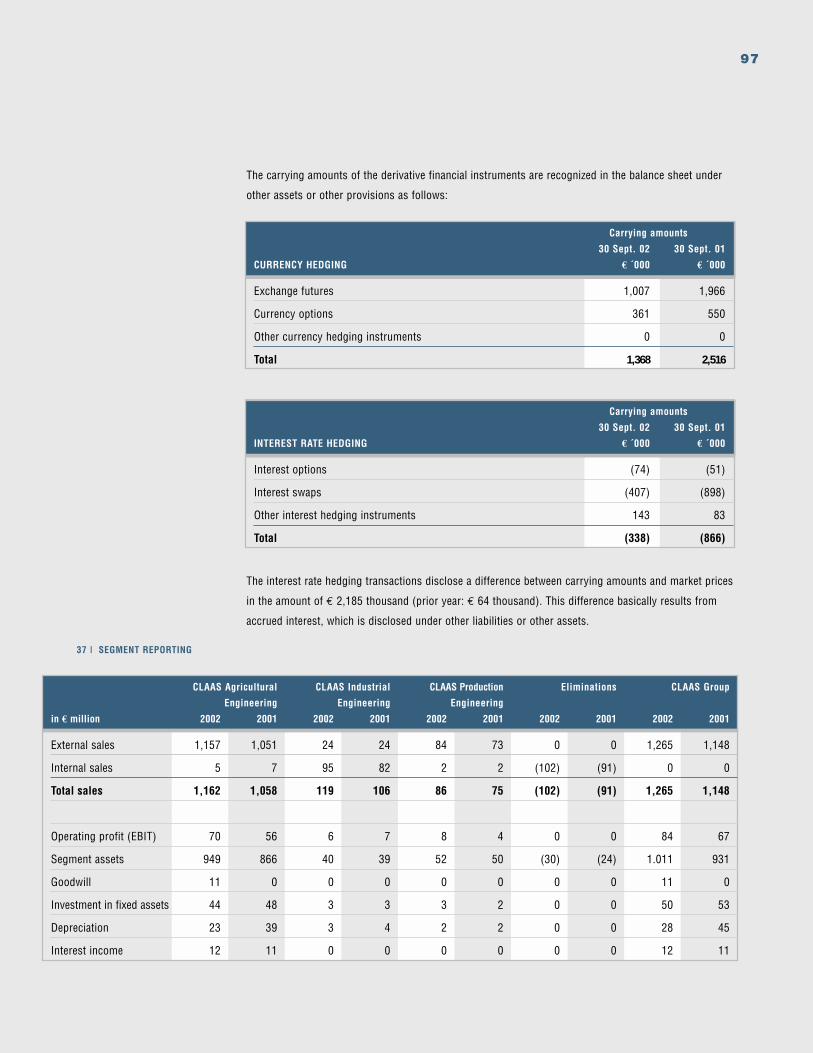
97
Carrying amounts
30 Sept. 02 30 Sept. 01
CURRENCY HEDGING € ´000 € ´000
Exchange futures 1,007 1,966
Currency options 361 550
Other currency hedging instruments 0 0
Total 1,368 2,516
The carrying amounts of the derivative financial instruments are recognized in the balance sheet under
other assets or other provisions as follows:
Carrying amounts
30 Sept. 02 30 Sept. 01
INTEREST RATE HEDGING € ´000 € ´000
Interest options (74) (51)
Interest swaps (407) (898)
Other interest hedging instruments 143 83
Total (338) (866)
CLAAS Agricultural CLAAS Industrial CLAAS Production Eliminations CLAAS Group
Engineering Engineering Engineering
in € million 2002 2001 2002 2001 2002 2001 2002 2001 2002 2001
External sales 1,157 1,051 24 24 84 73 0 0 1,265 1,148
Internal sales 5 7 95 82 2 2 (102) (91) 0 0
Total sales 1,162 1,058 119 106 86 75 (102) (91) 1,265 1,148
Operating profit (EBIT) 70 56 6 7 8 4 0 0 84 67
Segment assets 949 866 40 39 52 50 (30) (24) 1.011 931
Goodwill 11 0 0 0 0 0 0 0 11 0
Investment in fixed assets 44 48 3 3 3 2 0 0 50 53
Depreciation 23 39 3 4 2 2 0 0 28 45
Interest income 12 11 0 0 0 0 0 0 12 11
37 | SEGMENT REPORTING
The interest rate hedging transactions disclose a difference between carrying amounts and market prices
in the amount of € 2,185 thousand (prior year: € 64 thousand). This difference basically results from
accrued interest, which is disclosed under other liabilities or other assets.
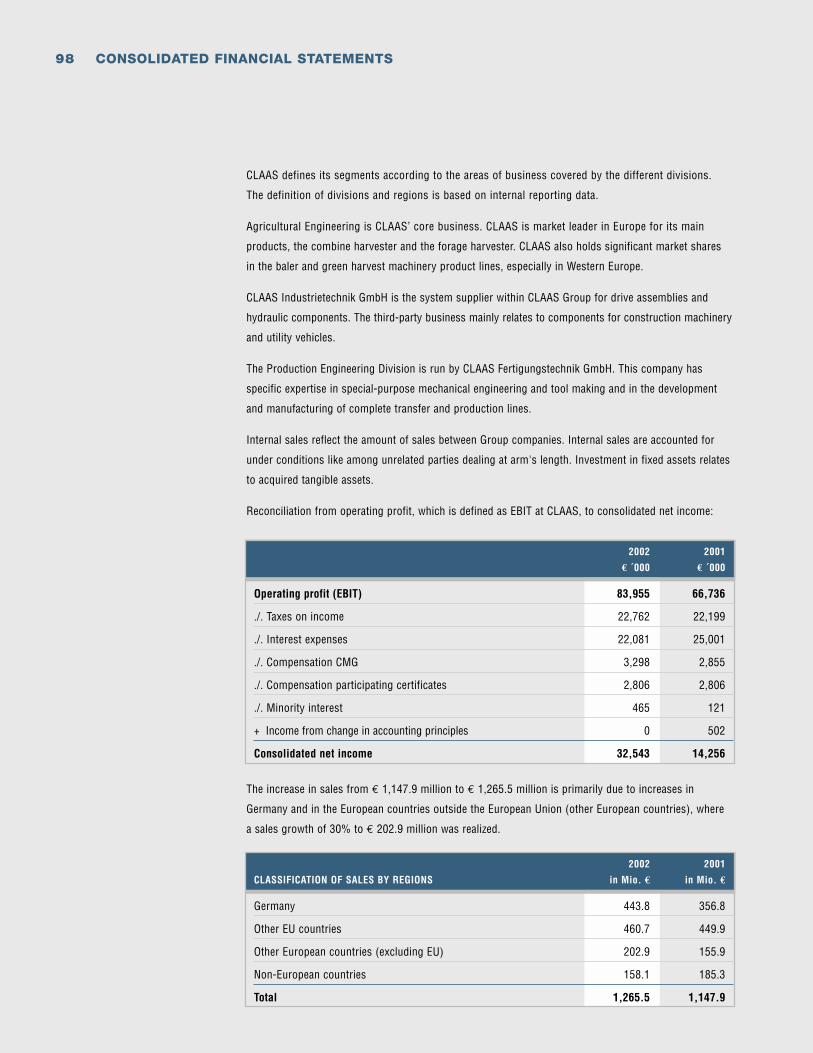
98 CONSOLIDATED FINANCIAL STATEMENTS
CLAAS defines its segments according to the areas of business covered by the different divisions.
The definition of divisions and regions is based on internal reporting data.
Agricultural Engineering is CLAAS’ core business. CLAAS is market leader in Europe for its main
products, the combine harvester and the forage harvester. CLAAS also holds significant market shares
in the baler and green harvest machinery product lines, especially in Western Europe.
CLAAS Industrietechnik GmbH is the system supplier within CLAAS Group for drive assemblies and
hydraulic components. The third-party business mainly relates to components for construction machinery
and utility vehicles.
The Production Engineering Division is run by CLAAS Fertigungstechnik GmbH. This company has
specific expertise in special-purpose mechanical engineering and tool making and in the development
and manufacturing of complete transfer and production lines.
Internal sales reflect the amount of sales between Group companies. Internal sales are accounted for
under conditions like among unrelated parties dealing at arm's length. Investment in fixed assets relates
to acquired tangible assets.
Reconciliation from operating profit, which is defined as EBIT at CLAAS, to consolidated net income:
The increase in sales from € 1,147.9 million to € 1,265.5 million is primarily due to increases in
Germany and in the European countries outside the European Union (other European countries), where
a sales growth of 30% to € 202.9 million was realized.
2002 2001
€ ´000 € ´000
Operating profit (EBIT) 83,955 66,736
./. Taxes on income 22,762 22,199
./. Interest expenses 22,081 25,001
./. Compensation CMG 3,298 2,855
./. Compensation participating certificates 2,806 2,806
./. Minority interest 465 121
+ Income from change in accounting principles 0 502
Consolidated net income 32,543 14,256
2002 2001
CLASSIFICATION OF SALES BY REGIONS in Mio. € in Mio. €
Germany 443.8 356.8
Other EU countries 460.7 449.9
Other European countries (excluding EU) 202.9 155.9
Non-European countries 158.1 185.3
Total 1,265.5 1,147.9
99
Disclosure concerning important customers: Since CLAAS realizes its sales primarily with green harvest
machinery, the clientele of CLAAS also operates predominantly in the agricultural sector. On account of
the large number of customers, there are no customers whose sales volume would account for a signifi-
cant percentage of the Group's sales volume. Furthermore, except for the German market, the customer
structure shows no significant concentration on certain geographic regions.
Effective December 01, 2002, CLAAS took over 51% of the shares in Brötje Automation GmbH from the
British Baxi Group Ltd. Brötje Automation is the technology leader for internal connection systems and
assembly engineering in the aircraft industry. Its customers include Airbus, Boeing, Bombardier-Shorts
and other well-known manufacturers. The world market leader for assembly airframes for fuselages and
wing parts is located in Northern Germany near Oldenburg and generated sales of about € 40 million
with approximately 220 employees in the last business year. In the business year 2003, the company
will be included in the consolidated financial statements as a related company as at December 01, 2002.
The purchase price amounted to € 12.5 million. At the time of take-over, the company's assets amounted
to € 37.4 million; these were matched by equity in the amount of € 1 million and external capital in the
amount of € 36.4 million. The acquisition creates goodwill in the amount of about € 12 million.
MATERIAL DIFFERENCES BETWEEN GERMAN GAAP (HGB) AND US GAAP
Material accounting and valuation differences between German GAAP (HGB) and US GAAP are described
below.
FIXED ASSETS
Under German GAAP, fixed assets are predominantly depreciated on a reducing-balance basis, with tax
depreciation normally being applied also to the commercial balance sheet. The useful lives are generally
based on fiscal depreciation tables. No asset item is permitted to be recognized under German GAAP
for intangible fixed assets that were not acquired for a compensation.
According to US GAAP, the depreciation method used should reflect the pattern in which the asset´s
economic benefits are consumed by the enterprise. Normally, fixed assets are, hence, depreciated on a
straight-line basis; no tax depreciation is made at all. Deviating from German GAAP, depreciation for
depreciable assets is based on a useful life which can differ from the useful life provided in the fiscal
depreciation tables. Furthermore, leased fixed assets are capitalized if the requirements for a capital
lease are met. Intangible assets acquired are also amortized over their estimated useful life, if such a
useful life can be determined. If the useful life of the acquired intangible asset can not be determined,
an impairment test is performed annually (or even earlier, if corresponding indications for permanent
impairment exist) instead of scheduled amortization. Goodwill is not to be amortized on a scheduled basis,
but to be subject to an annual impairment test. Certain self-generated intangible fixed assets are required
to be capitalized under US GAAP.
INVENTORIES
Whereas under German accounting principles, inventories are permitted to be valued at prime cost or at
full cost (in compliance with tax regulations), inventories are measured at so-called production-related
full cost under US GAAP (this means all allocable overheads are capitalized).
38 | EVENTS AFTER THE
BALANCE SHEET DATE
100 CONSOLIDATED FINANCIAL STATEMENTS
The percentage of completion method (poc) is applied under US GAAP when reporting long-term pro-
duction orders. Long-term production orders in process are disclosed as poc receivables depending on
the stage of completion.
DEFERRED TAXES
According to German accounting principles, deferred tax assets and liabilities are only recognized for
temporary differences between the result under German GAAP and the tax result; quasi-permanent
differences must not be deferred. Netting deferred tax assets and deferred tax liabilities is admissible.
Under US GAAP, deferred taxes are to be recognized for temporary differences between the values
recognized in the consolidated balance sheet and the tax balance sheet. Furthermore, deferred tax
assets are to be recognized for anticipated tax reductions from loss carryforwards. Deferred tax
assets and deferred tax liabilities are openly netted in the case of identical maturity, identical tax type
and identical jurisdiction to tax.
RECEIVABLES/OTHER ASSETS
Under German GAAP, a general allowance is made on receivables in accordance with the prudence
concept. According to US GAAP, general allowances are only permitted to be made if substantiable
empirical values are available or if a loss of receivables is probable. Under US GAAP, the other assets
also include derivatives, which are capitalized at fair value. Under German GAAP, no derivatives are to be
capitalized with the exception of paid bonuses. Furthermore, an excess of pension assets over pension
commitments is disclosed under other assets at the level of CLAAS in compliance with US GAAP.
INVESTMENTS AND SECURITIES
Under German accounting principles, securities are recognized at acquisition cost or at a lower market
value as at the balance sheet date.
Under US GAAP, there are the following three types of securities: Securities that are held-to-maturity
(»held-to-maturity securities«) should generally be valued at acquisition cost. Securities that are
available-for-sale (»available-for-sale securities«) and securities that are intended to be sold shortly
(»trading securities«) are valued at their current market value as at the balance sheet date.
PENSIONS PROVISIONS
Under German GAAP, pension provisions are normally measured according to the entry age normal
method under tax law. Probable fluctuations are taken into account on a lump-sum basis. Pay and pen-
sion rises must not be taken into account. The discounting factor can be based on tax regulations.
Under US GAAP, pension provisions are measured according to the projected unit credit method. Official
fluctuation probabilities as well as pay and pension rises are taken into account. The discounting factor
corresponds to the interest rate in the capital market.
101
If, on account of the change in the bases of computation, the present value of vested pension rights
exceeds the pension provision that has been set up with profit and loss impact, the pension provision
is increased without profit and loss impact by an additional provision amount (»additional minimum
liability«) according to SFAS 87. This amount must be lower than the additional expenses from plan
adjustments that remain to be allocated. Otherwise, it is offset against equity. The difference arising on
the pension valuation has no profit and loss impact under US GAAP. Under German GAAP, the funding
and release of this minimum pension commitment is, however, immediately charged against profit and
loss in the profit and loss account.
OTHER PROVISIONS
Under German GAAP, there are certain options with respect to provisions and accruals and provisions
for charges that are based on an internal commitment are permitted to be carried as a liability.
According to US GAAP, there are more restrictive requirements for setting up provisions and accruals.
There are no options to show or not to show corresponding items as a liability on the balance sheet and
recognition is made contingent upon a high probability that a liability will actually arise. Provisions for
charges are inadmissible.
CASH AND CASH EQUIVALENTS
Deviating from German GAAP, cash and cash equivalents under US GAAP include also securities with
a remaining term at the date of acquisition of up to 90 days.
SILENT PARTNERSHIP/PARTICIPATING CERTIFICATES
The allocation to equity or external capital according to German GAAP depends decisively on profit
and loss-related compensation, the loss participation and the treatment as subordinate in the case
of bankruptcy. According to these criteria, the silent partnership and the participating certificates of
CLAAS are to be classified as equity in accordance with German GAAP. Under US GAAP, however,
the repayability of the capital transfer decides on the disclosure within or outside equity.
MINORITY INTEREST
Under German GAAP, minority interest is included in equity. Under US GAAP, minority interest is
disclosed as a separate item outside equity on the balance sheet.
COMPREHENSIVE INCOME/OTHER COMPREHENSIVE INCOME
Deviating from German accounting rules, US GAAP provides for a separate equity component, the other
comprehensive income, which together with the net income forms a kind of total operating performance,
the so-called comprehensive income. The following elements of the other comprehensive income are
to be separately disclosed: Foreign currency translation differences, supplementary pension provisions
(see pension provision), unrealized gains and losses in connection with the market valuation of securities
as well as the effective portion of the market price variance of derivative instruments that meet cash
flow hedge requirements.
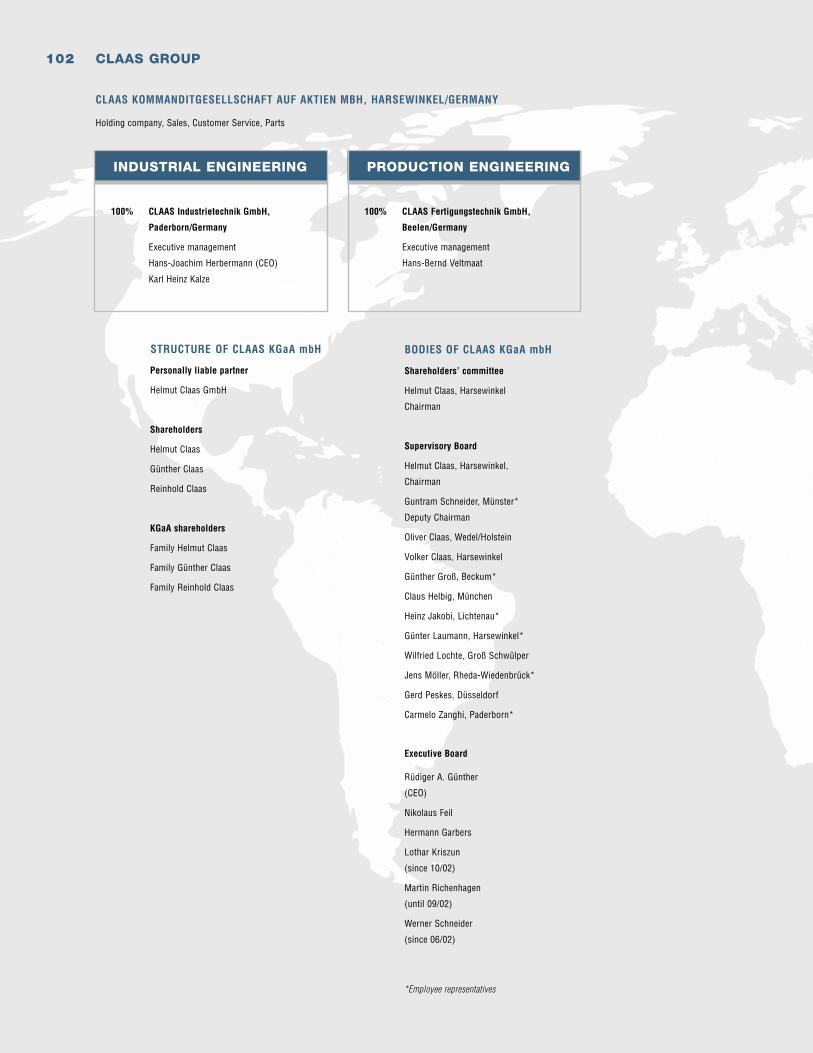
102 CLAAS GROUP
STRUCTURE OF CLAAS KGaA mbH
Shareholders’ committee
Helmut Claas, Harsewinkel
Chairman
Supervisory Board
Helmut Claas, Harsewinkel,
Chairman
Guntram Schneider, Münster*
Deputy Chairman
Oliver Claas, Wedel/Holstein
Volker Claas, Harsewinkel
Günther Groß, Beckum*
Claus Helbig, München
Heinz Jakobi, Lichtenau*
Günter Laumann, Harsewinkel*
Wilfried Lochte, Groß Schwülper
Jens Möller, Rheda-Wiedenbrück*
Gerd Peskes, Düsseldorf
Carmelo Zanghi, Paderborn*
Executive Board
Rüdiger A. Günther
(CEO)
Nikolaus Feil
Hermann Garbers
Lothar Kriszun
(since 10/02)
Martin Richenhagen
(until 09/02)
Werner Schneider
(since 06/02)
*Employee representatives
Personally liable partner
Helmut Claas GmbH
Shareholders
Helmut Claas
Günther Claas
Reinhold Claas
KGaA shareholders
Family Helmut Claas
Family Günther Claas
Family Reinhold Claas
BODIES OF CLAAS KGaA mbH
CLAAS KOMMANDITGESELLSCHAFT AUF AKTIEN MBH, HARSEWINKEL/GERMANY
Holding company, Sales, Customer Service, Parts
100% CLAAS Fertigungstechnik GmbH,
Beelen/Germany
Executive management
Hans-Bernd Veltmaat
PRODUCTION ENGINEERING
100% CLAAS Industrietechnik GmbH,
Paderborn/Germany
Executive management
Hans-Joachim Herbermann (CEO)
Karl Heinz Kalze
INDUSTRIAL ENGINEERING
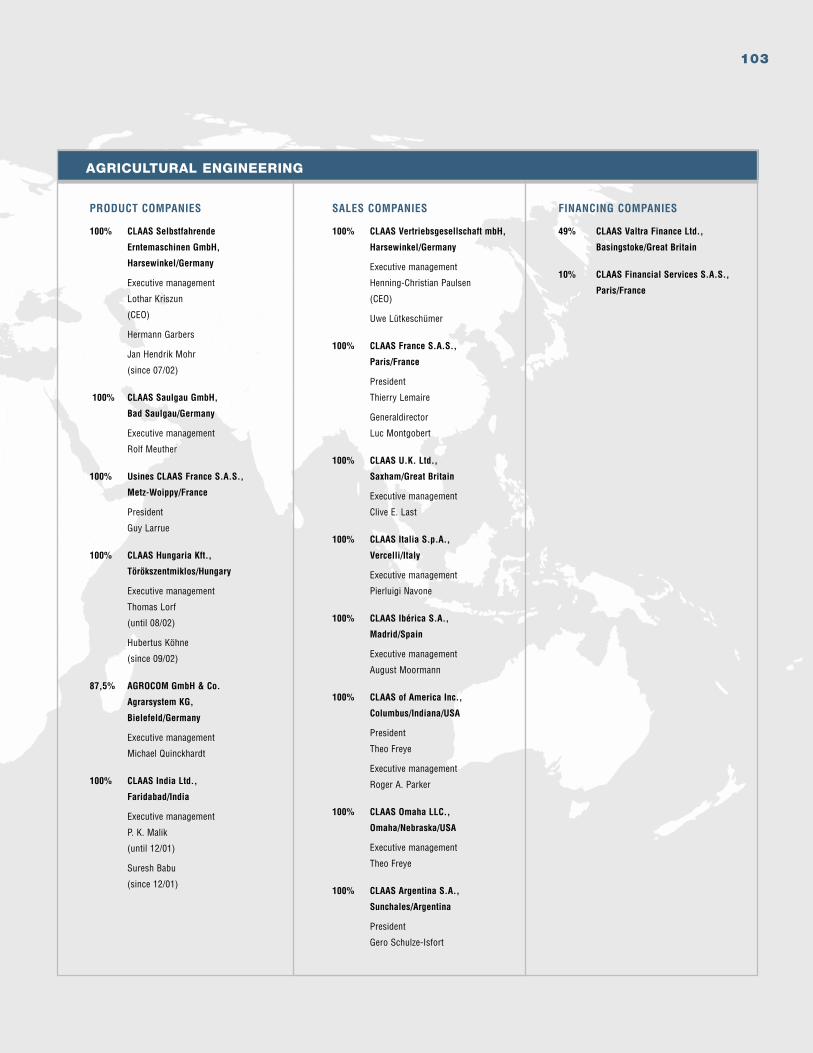
103
AGRICULTURAL ENGINEERING
FINANCING COMPANIES
49% CLAAS Valtra Finance Ltd.,
Basingstoke/Great Britain
10% CLAAS Financial Services S.A.S.,
Paris/France
SALES COMPANIES
100% CLAAS Vertriebsgesellschaft mbH,
Harsewinkel/Germany
Executive management
Henning-Christian Paulsen
(CEO)
Uwe Lütkeschümer
100% CLAAS France S.A.S.,
Paris/France
President
Thierry Lemaire
Generaldirector
Luc Montgobert
100% CLAAS U.K. Ltd.,
Saxham/Great Britain
Executive management
Clive E. Last
100% CLAAS Italia S.p.A.,
Vercelli/Italy
Executive management
Pierluigi Navone
100% CLAAS Ibérica S.A.,
Madrid/Spain
Executive management
August Moormann
100% CLAAS of America Inc.,
Columbus/Indiana/USA
President
Theo Freye
Executive management
Roger A. Parker
100% CLAAS Omaha LLC.,
Omaha/Nebraska/USA
Executive management
Theo Freye
100% CLAAS Argentina S.A.,
Sunchales/Argentina
President
Gero Schulze-Isfort
PRODUCT COMPANIES
100% CLAAS Selbstfahrende
Erntemaschinen GmbH,
Harsewinkel/Germany
Executive management
Lothar Kriszun
(CEO)
Hermann Garbers
Jan Hendrik Mohr
(since 07/02)
100% CLAAS Saulgau GmbH,
Bad Saulgau/Germany
Executive management
Rolf Meuther
100% Usines CLAAS France S.A.S.,
Metz-Woippy/France
President
Guy Larrue
100% CLAAS Hungaria Kft.,
Törökszentmiklos/Hungary
Executive management
Thomas Lorf
(until 08/02)
Hubertus Köhne
(since 09/02)
87,5% AGROCOM GmbH & Co.
Agrarsystem KG,
Bielefeld/Germany
Executive management
Michael Quinckhardt
100% CLAAS India Ltd.,
Faridabad/India
Executive management
P. K. Malik
(until 12/01)
Suresh Babu
(since 12/01)
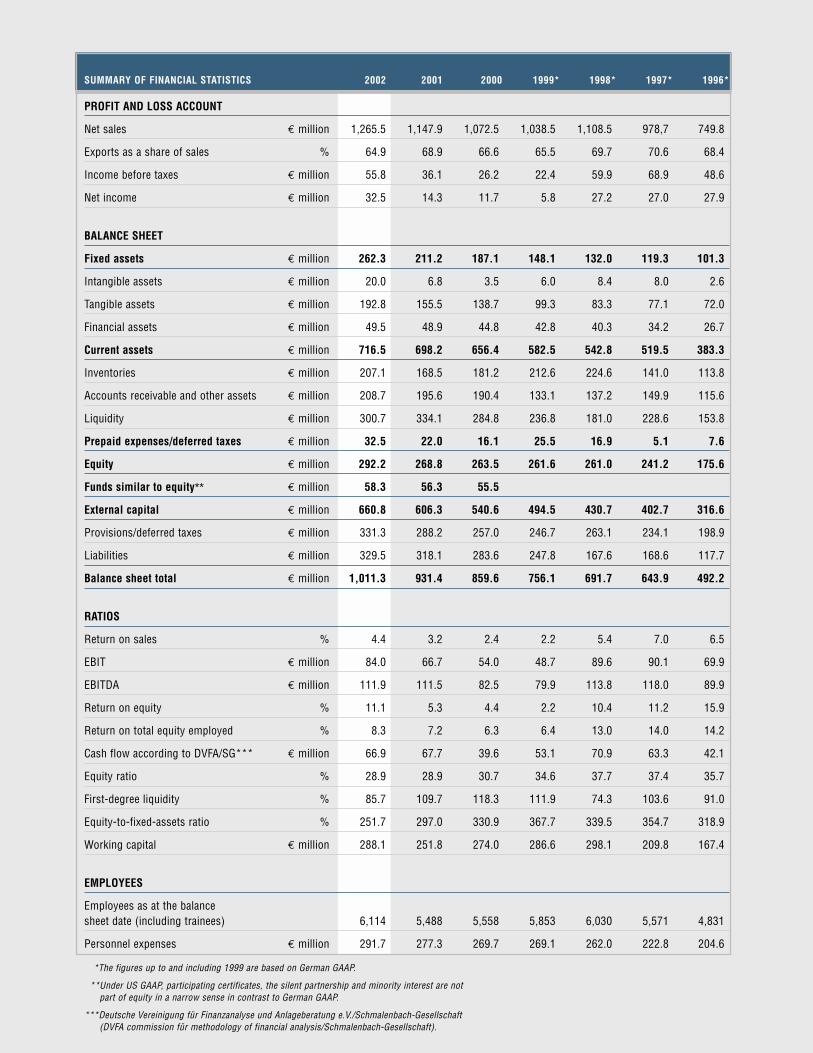
SUMMARY OF FINANCIAL STATISTICS 2002 2001 2000 1999* 1998* 1997* 1996*
PROFIT AND LOSS ACCOUNT
Net sales € million 1,265.5 1,147.9 1,072.5 1,038.5 1,108.5 978,7 749.8
Exports as a share of sales % 64.9 68.9 66.6 65.5 69.7 70.6 68.4
Income before taxes € million 55.8 36.1 26.2 22.4 59.9 68.9 48.6
Net income € million 32.5 14.3 11.7 5.8 27.2 27.0 27.9
BALANCE SHEET
Fixed assets € million 262.3 211.2 187.1 148.1 132.0 119.3 101.3
Intangible assets € million 20.0 6.8 3.5 6.0 8.4 8.0 2.6
Tangible assets € million 192.8 155.5 138.7 99.3 83.3 77.1 72.0
Financial assets € million 49.5 48.9 44.8 42.8 40.3 34.2 26.7
Current assets € million 716.5 698.2 656.4 582.5 542.8 519.5 383.3
Inventories € million 207.1 168.5 181.2 212.6 224.6 141.0 113.8
Accounts receivable and other assets € million 208.7 195.6 190.4 133.1 137.2 149.9 115.6
Liquidity € million 300.7 334.1 284.8 236.8 181.0 228.6 153.8
Prepaid expenses/deferred taxes € million 32.5 22.0 16.1 25.5 16.9 5.1 7.6
Equity € million 292.2 268.8 263.5 261.6 261.0 241.2 175.6
Funds similar to equity** € million 58.3 56.3 55.5
External capital € million 660.8 606.3 540.6 494.5 430.7 402.7 316.6
Provisions/deferred taxes € million 331.3 288.2 257.0 246.7 263.1 234.1 198.9
Liabilities € million 329.5 318.1 283.6 247.8 167.6 168.6 117.7
Balance sheet total € million 1,011.3 931.4 859.6 756.1 691.7 643.9 492.2
RATIOS
Return on sales % 4.4 3.2 2.4 2.2 5.4 7.0 6.5
EBIT € million 84.0 66.7 54.0 48.7 89.6 90.1 69.9
EBITDA € million 111.9 111.5 82.5 79.9 113.8 118.0 89.9
Return on equity % 11.1 5.3 4.4 2.2 10.4 11.2 15.9
Return on total equity employed % 8.3 7.2 6.3 6.4 13.0 14.0 14.2
Cash flow according to DVFA/SG*** € million 66.9 67.7 39.6 53.1 70.9 63.3 42.1
Equity ratio % 28.9 28.9 30.7 34.6 37.7 37.4 35.7
First-degree liquidity % 85.7 109.7 118.3 111.9 74.3 103.6 91.0
Equity-to-fixed-assets ratio % 251.7 297.0 330.9 367.7 339.5 354.7 318.9
Working capital € million 288.1 251.8 274.0 286.6 298.1 209.8 167.4
EMPLOYEES
Employees as at the balance sheet date (including trainees) 6,114 5,488 5,558 5,853 6,030 5,571 4,831
Personnel expenses € million 291.7 277.3 269.7 269.1 262.0 222.8 204.6
*The figures up to and including 1999 are based on German GAAP.
**Under US GAAP, participating certificates, the silent partnership and minority interest are not part of equity in a narrow sense in contrast to German GAAP.
***Deutsche Vereinigung für Finanzanalyse und Anlageberatung e.V./Schmalenbach-Gesellschaft(DVFA commission für methodology of financial analysis/Schmalenbach-Gesellschaft).
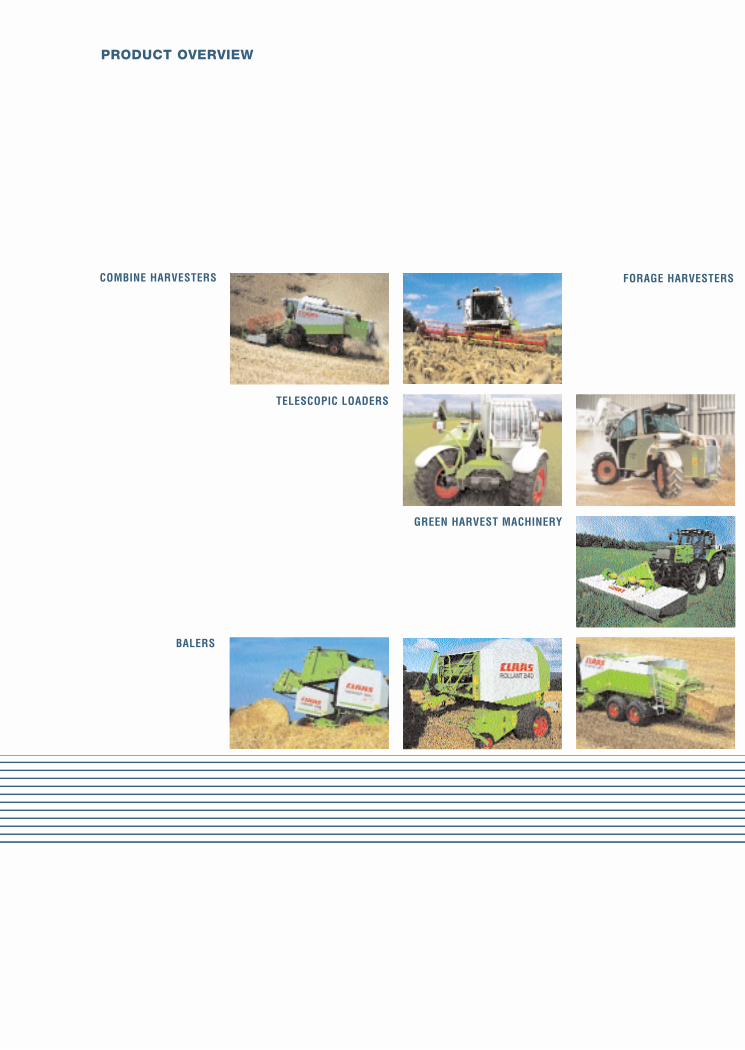
COMBINE HARVESTERS
GREEN HARVEST MACHINERY
FORAGE HARVESTERS
TELESCOPIC LOADERS SPECIAL PRODUCTS
BALERS INDUSTRIAL ENGINEERING/PRODUCTION ENGINEERING
PRODUCT OVERVIEW
7586 48
02 01 02 01
1,0581,162
56
70
02 01 02 01 NET SALES // EBIT€ million
AGRICULTURAL ENGINEERING
• CLAAS’ core business with a 91% share
of net sales
• Undisputed European combine harvester
market leader
• World market leader in self-propelled
forage harvesters
• Top market share for balers and
green harvest machinery
INDUSTRIAL ENGINEERING
• System supplier of drive assemblies and
hydraulic components
• Products: ultra-modern axles and trans-
missions for the international construction
machinery and the commercial vehicle
sectors
SEGMENTS OF THE CLAAS GROUP
PRODUCTION ENGINEERING
• Specialist expertise in the area of special
machinery and toolmaking
• Development of complete production and
transfer lines for the automotive and aviation
industries
106119 76
02 01 02 01
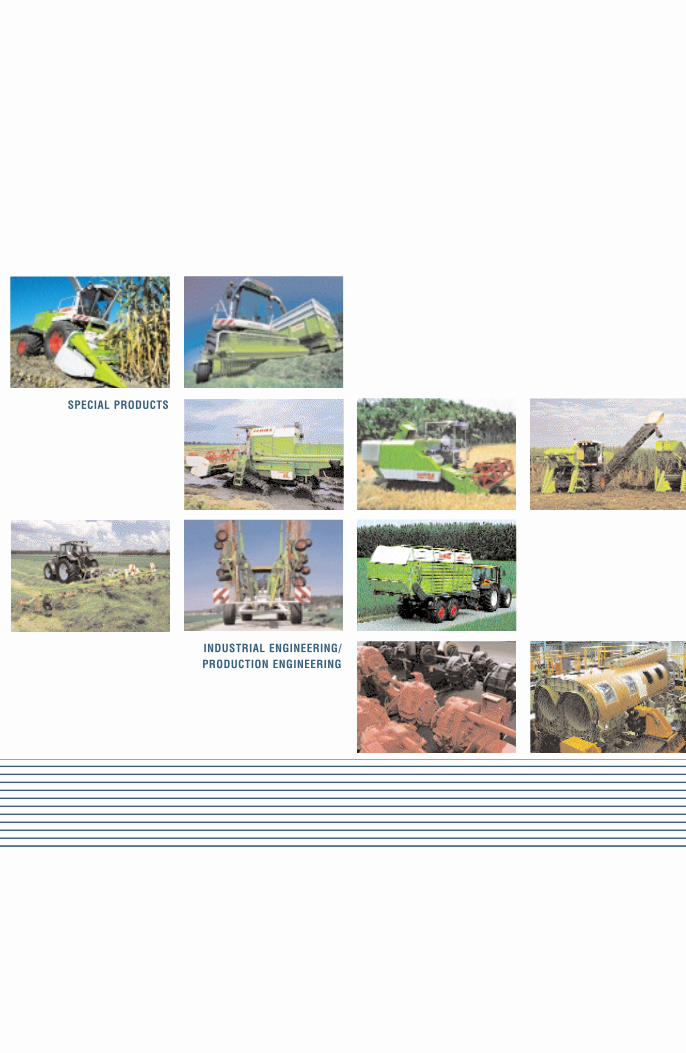
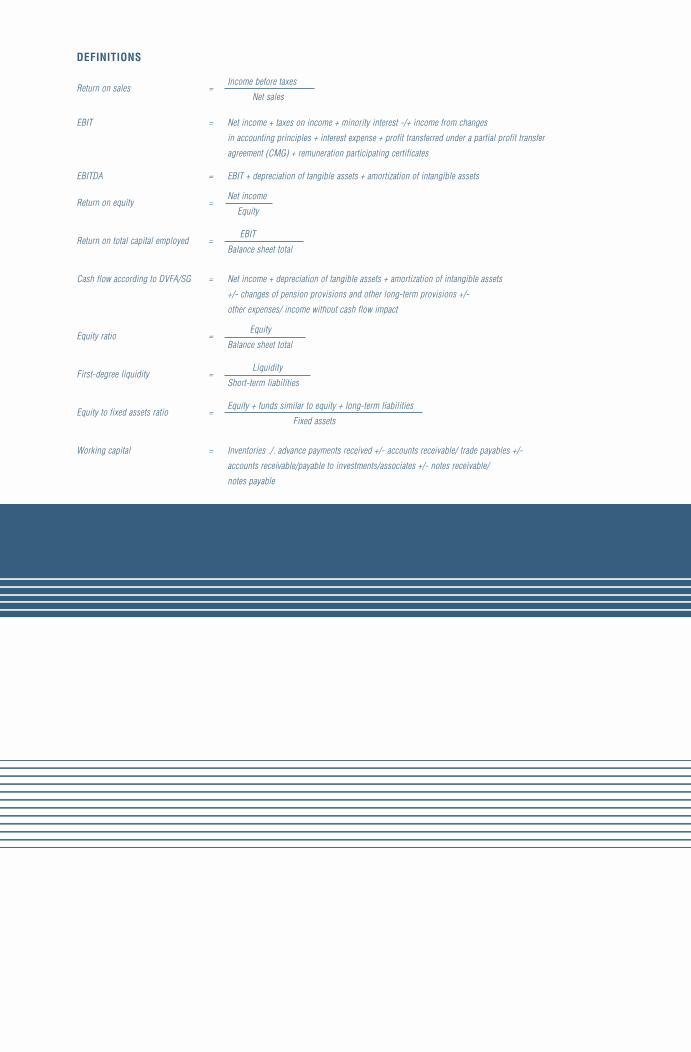
ANNUAL REPORT 2002
ANN
UAL
REP
OR
T 20
02
SUSTAINABLEGROWTH
KEY DATA FOR THE GROUP ACCORDING TO US GAAP
Change
2002 2001 %
PROFIT AND LOSS ACCOUNT
Net Sales € million 1,265.5 1,147.9 10.2
EBIT € million 84.0 66.7 25.9
EBITDA € million 111.9 111.5 0.4
Net income € million 32.5 14.3 127.3
Income before taxes € million 55.8 36.1 54.6
Cash flow € million 66.9 67.7 (1.2)
R&D expenses € million 63.0 51.9 21.4
BALANCE SHEET
Equity € million 292.2 268.8 8.7
Capital expenditure € million 54.3 58.1 (6.5)
Balance sheet total € million 1,011.3 931.4 8.6
EMPLOYEES
Employees as at the balance sheet date* 6,114 5,488 11.4
Personnal expenses € million 291.7 277.3 5.2
* including trainees
33.434.530.3
35.1
31.11,0721,038
1,108
1,265
1,148
Net sales, Germany (%)
Net sales, abroad (%)
(*Figures based on German GAAP)
NET SALES € million
66.665.569.7
64.968.9
38.134.5
36.8
29.4
31.6643580
493
979
750
61.965.563.2
70.6
68.4
98 * 99* 00 01 02 93* 94* 95* 96 * 97*
CONTACT
CLAAS KGaA mbHP.O. Box 1163Münsterstrasse 33D-33426 HarsewinkelGermany
www.claas.com
Additional copies of this report and further information aboutCLAAS are available free of charge on request.
PUBLIC/INVESTOR RELATIONS
Tel.: (05247) 12-1743Fax: (05247) 12-1751E-mail: [email protected]
This annual report is available in German and English. Both versions may be downloaded onthe Internet at www.claas.com.
DEFINITIONS
Return on sales = Income before taxes
Net sales
EBIT = Net income + taxes on income + minority interest -/+ income from changes
in accounting principles + interest expense + profit transferred under a partial profit transfer
agreement (CMG) + remuneration participating certificates
EBITDA = EBIT + depreciation of tangible assets + amortization of intangible assets
Return on equity =Net income
Equity
Return on total capital employed =EBIT
Balance sheet total
Cash flow according to DVFA/SG = Net income + depreciation of tangible assets + amortization of intangible assets
+/- changes of pension provisions and other long-term provisions +/-
other expenses/ income without cash flow impact
Equity ratio =Equity
Balance sheet total
First-degree liquidity =Liquidity
Short-term liabilities
Equity to fixed assets ratio =Equity + funds similar to equity + long-term liabilities
Fixed assets
Working capital = Inventories ./. advance payments received +/- accounts receivable/ trade payables +/-
accounts receivable/payable to investments/associates +/- notes receivable/
notes payable
CONCEPT & DESIGN
Kirchhoff Consult AGHamburg, Germany