Embed Size (px)
DESCRIPTION
Many people postpone action to adapt their businesses and management activities to the changing climate because of uncertainties about future climatic conditions. It is true that the range of projected futures becomes rather large by the end of the century. This is due to uncertainties about future greenhouse gas emissions and the differences in results from various global climate models.
Citation preview

Institute for CatastrophicLoss ReductionBuilding resilient communities
Institut de Préventiondes Sinistres CatastrophiquesConstruction de resilient communities
Climate change informationfor adaptationClimate trends and projected values for Canadafrom 2010 to 2050
By James P. Bruce
March 1, 2011

TABLE OF CONTENTS
ISBN 978-0-9784841-7-0
I INTRODUCTION…………………………………………… 1 II REPORT FORMAT………………………………………… 3 III HOW TO INTERPRET AND USE THE TABLES………… 4 IV CLIMATE TABLES BY REGION…………………………… 4
Coastal British Columbia……………………………. 5 Southern Interior British Columbia ………………….. 8 Northern Interior British Columbia…………………… 11 Yukon and Mackenzie District (NWT)……………….. 13 Southern Alberta………………………………………. 15 Central Alberta…………………………………………. 18 Northern Alberta……………………………………….. 21 Southern Saskatchewan and Manitoba…………….. 23 Northern Saskatchewan and Manitoba……………… 25 Western Nunavut………………………………………. 28 Northern Ontario……………………………………….. 31 Southern Ontario………………………………………. 33
Eastern Ontario, Ottawa Valley and Montreal………. 36 Central and Northern Quebec and Labrador*………. 38 East Nunavut (Baffin and Ellesmere Islands)……… 41 New Brunswick and Prince Edward Island………….. 44 Nova Scotia…………………………………………….. 47 Newfoundland*…………………………………………. 49 *climatic, not political, regions
V REFERENCE LIST…………………………………………….. 52

1
CLIMATE CHANGE INFORMATION FOR ADAPTATION for the
INSTITUTE FOR CATASTROPHIC LOSS REDUCTION J. P. Bruce 18 Feb. 2011*
I INTRODUCTION Many people postpone action to adapt their businesses and management activities to the changing climate because of uncertainties about future climatic conditions. It is true that the range of projected futures becomes rather large by the end of the century. This is due to uncertainties about future greenhouse gas emissions and the differences in results from various global climate models. However, for many purposes, planning horizons are less than a century and modelled results are not very divergent out to 2050. In addition, anthropogenic factors, i.e. greenhouse gas increases, have been overwhelmingly dominant in driving changes in global and large scale regional, climate since about 1970. They will continue to dominate in the coming 4 decades. Thus, trends that have been measured and observed in climate-related factors over the past 4 decades are likely to continue or possibly intensify somewhat in the next 40 years. When extension of such trends is similar to projections to 2050 by climate models, event greater confidence can be placed in the estimates of future climate. An example of comparison between extrapolated temperatures in the Athabasca River basin and projections with three Atmosphere Ocean Global Climate Models with the A2 (high) emission scenario, is shown in Fig. 1. (next page) The highest emission scenario is the closest to observed trends. Recent information on GHG concentrations, emissions and impacts lead to the view that climate change is advancing more rapidly than estimated earlier. Global atmospheric CO2 concentration increases averaged 1.6 ppm/year from 1970 to 2007, but 1.9 ppm/year from 2000 to 2007 (Levinson, 2008). From 1990 to 2000, the atmosphere’s CO2 increased at a rate of 3.1 gigatonnes carbon per year but from 2000 to 2008 the rate was 4.1gt C/year (IGBP, 2009). At the same time the International Energy Agency in late 2007 reported that global energy use and greenhouse gas emissions have been rising very rapidly. It projects a 55% increase in world energy needs between 2005 and 2030 and a 57% increase in greenhouse gas emissions. This could be tempered by aggressive global efforts to reduce emissions, not evident to date. Of course, the recent economic downturn had a short term effect on this rate of change. It is estimated that in 2009 a reduction of about 1% in global emissions occurred, but 2010 emissions are again on a path to record highs. *Note; This is a revised and up-dated version of the draft dated 18 March 2010 by
Bruce and Egener.

2
A 57% increase to 2030 is a more rapid increase than the greatest increase in SRES
emission scenarios of IPCC, which have been used in previous climate projections.
The evidence in the climate system of the acceleration of greenhouse gas emissions
and concentrations can be seen in several manifestations. The decline in ice cover in
the Arctic has been more rapid than in any of the IPCC scenario modeled results. Ice
melt in Greenland, and effects in Antarctica have recently exceeded the rates of change
projected by IPCC.
The extrapolation of observed trends is most useful for temperature and factors closely related to it. For precipitation, influencing factors, such as changes in ice cover of lakes and oceans, need to be taken into account in extending trends. This has been done somewhat subjectively in the tables which follow. This approach to the changing climate has been used successfully with a number of Canadian communities in diverse regions of the country. This report summarizes for 18 regions, the observed climate trends to date and some climate related factors. Projections are then given to 2050 of these key climate and climate-related factors. These related factors emphasize events or trends which result in hardship or damages or benefits, and are often felt most strongly in communities. An emphasis has been placed on extreme events when data and projections were available, since they often cause the largest damages and human disruptions. Where very limited Canadian data are available, trends in adjacent U.S.A., where much more such data have been available and analyzed, are cited. It is hoped that this fairly straight forward presentation of information will assist in demystifying climate change to permit initiation of pro-active adaptation measures.

3
II REPORT FORMAT
In each subsequent section for 17 regions of Canada the following format has been followed to the extent practical with available information and publications.
Region Observed Trends
Projections to 2050
e.g. Coastal British Columbia:
Temperature changes (seasonal) Temperature thresholds Precipitation changes (seasonal) Ratio of snow to total precipitation Intense rain – frequency and intensity Winds Freezing Precipitation Riverflow Break-up Wildfires Sea level rise Storm surges and wave heights Permafrost thaw
Also for each region there are some notes to augment the information in the tables and where important a short description of natural modes of the climate system affecting year to year variations from the climate change trend. The latter addresses, frequently cited phenomena such as, El Niño-Southern Oscillation, North Atlantic Oscillation and Arctic Oscillation and their likely effects on the region.
Figure 1 Temperature Trends and Projections
Athabasca River Basin
0
0.5
1
1.5
2
2.5
3
3.5
4
4.5
5
5.5
1940 1960 1980 2000 2020 2040 2060 2080 2100 Year
Temperature (°C)
Observed ECHAM4 CGCM2 HadCM3
Model projections by Gan and Kerkhoven 2004

4
III HOW TO INTERPRET AND USE THESE TABLES
1. These Tables are intended for initial assessment of adaptation priorities. For criteria for more
detailed design of adaptation measures, the appropriate comprehensive references should be
consulted. A list of references is provided with this set of tables.
2. Where a range of values is indicated, this is to indicate the range recorded or projected within
this region.
3. All figures are positive or rising trends unless otherwise noted.
4. A subscript indicates the return period, i.e. the recurrence interval of events greater than a
specific value, e.g. P20, T20 .
5. >99% refers to an event of a magnitude that occurs in less than 1% of those events over the
period of record.
6. Percentage (%) changes in precipitation are changes, over the period indicated, of % of long
term averages (back to 1900 or earlier).
7. For intense winter storms (under Wind) the Canadian Climate Model (CGCM2) projects, for
South of 60:N, increases in numbers of intense events, but decreases in frequency of all storms.
For regions North of 60:N both frequency of all storms and of intense storms are projected to
increase. Intense storms have central pressure <970hpa.
8. Lightning data associated with severe thunderstorms is only available since 1999 so trend
analyses are not useful. However, in USA lightning related insurance losses rose sharply with
temperatures greater than 20oC. Most wildfires in northern Canada and the boreal forest
are set by lightning.
9. Projections of values from 2010 to 2050 are based upon a combination of:
i) Outputs of Atmosphere-Ocean climate models with the system forced by expected
increases in greenhouse gases in the atmosphere, (A2 scenario high emissions), and
ii) extrapolation, with physical reasoning, of observed trends since the 1960s.
10. In some cases there is a range of projections available from the various climate models and
estimates of future greenhouse gas emissions. In most cases, only the most likely values are
given, often from an ensemble of models compiled by IPCC, but generally assuming a high
emission scenario, consistent with recent observations.
11. While data are presented on annual, maximum and minimum streamflow trends and
projections, it must be recognized that a major effect of climate change is a change in
seasonality of flow regimes. For most small and mid-size rivers, this is usually manifest in
greater winter flows, earlier freshet in spring and lower flows May to October.
IV CLIMATE TABLES BY REGION See following sections

5
REGION: COASTAL BRITISH COLUMBIA Page 1
OBSERVED (TRENDS)
BY 2050
(from 2010) TEMPERATURE See Note 1 See Note 5
Temperature oC (1950-2008) Max. oC Min. oC
Annual 1 oC 1.5 oC
Winter 0.5 0.5 to -1
Spring 1.5 1.5 to 2
Summer 0.5 1.5
Autumn 0.5 0.5
oC
1.5 oC
1
2
1.5
1
Temperature Extremes (1950-2007) Warm Days >250C max.: 2/decade Frost Free Days: >30 South, 0 North
10 days 20 days
PRECIPITATION See Note 1
Precipitation (1950-2007) %
Annual 15% to 25%: Rain 20 to 30%
Snow -30% to -50%
Winter -10
Spring 30 to 40
Summer 5 to 15
Autumn -5 to 10
%
5 to 10%
10
15
-20S to 0 N
5
Ratio of Snow to Total Precipitation (1950-2007)
Annual -10
Winter -9
Spring -15
Autumn 6
-15
-12
-20
0
Intense Precipitation (1958-2007) Amounts of severe events +16% (>99%) (adjacent U.S.A.) Frequency heavy rain amounts +12% (>99%) (adjacent U.S.A.)
P 20 15%
P 20 →P10

6
COASTAL BRITISH COLUMBIA Page 2
OBSERVED (TRENDS) BY 2050 (from 2010)
WIND See Note 2
Intense Winter Storms (Central Pressure <970hpa) Over Northern Hemisphere (1950-2000) 1200 per year to 1300 (8%)
8-15% more frequent
Significant Wave Heights (1950-2000) 5 cm
+7cm
RIVERFLOW See Note 3
Dates of Spring break-up (1948-2002) 15 days earlier
30 days earlier
Snow Pack - 1 April (1950-1997) -20%
-15%
Streamflow (1967-1996) %
Annual -20%
Minimum Daily -30
Maximum Daily -20 to 20
%
-20%
-30
10
SEA LEVEL See Note 4
Mean (1993-2007) 3.2cm/decade Relative Rise over Century
Victoria 8cm
Vancouver 4cm
Prince Rupert 12cm
15 to 25cm
Note: Land Subsidence Fraser Delta ~2cm/decade
El Nino Year up to 3cm more 3cm (El Nino)
Note 1: Ranges in observed and projected values indicate differences over the region. Note 2: Wind-disaster records of Public Safety Canada indicate for storms >100km/h national frequency rose 16% from 1970 to 1990 with most in coastal regions, except for tornadoes. Note 3: Major floods and landslides (from PSC data base), where intense rains, or rain on snow, apparently increased 80% nationally between the 1970s and 1990s. However, 1970s event recording may have been less thorough than in 1990s. Data base extends only to 2005. Note 4: Sea level and storm surges: With rising relative sea level, even though isostatic rebound of the land has minimized the effect except in Fraser River Delta, and increased frequency of intense winter storms (up to 15% by 2050) increased storm surge activity and water levels expected. These events are often associated with heavy rain events on land with reduced capability of discharge to sea and increased flooding (e.g. Saanich Peninsula, Nov. 2009.)

7
COASTAL BRITISH COLUMBIA Page 3 Note 5: Annual variability above and below climate change driven trends is related to large-scale modes of the natural climate system. This region is especially affected by ENSO (El Nino-La Nina) and the Pacific Decal Oscillation (PDO). When PDO is in a warm phase and El Nino conditions develop, warmer, drier conditions with lower stream flow occur in Western Canada as departures from the global trend. Temperature trends in 1950-99 of 2.5°C were estimated in Western mountainous regions to have been 0.5°C less without a generally positive PDO. (Bonfils et al. 2008)

8
REGION: BRITISH COLUMBIA SOUTHERN INTERIOR Page 1
OBSERVED (TRENDS)
BY 2050
(from 2010) TEMPERATURE See Note 1 See Note 5
Temperature oC (1950-2007) Max. oC Min. oC
Annual 1 to 2.5 oC 2.5 oC
Winter 0.5 to 2.5 1.5 to 2.5
Spring 1.5 to 2.5 2.5
Summer 1 to 1.5 1.5 to 2.5
Autumn 0.5 to 1.5 0.5 to 1.5
oC
2.5
1.5
2.5
2
1.5
Frost free days: 20 to 30 Growing Season: >5 oC 10 to 20 days Severe heat wave: 1 in 20 years
20 to 30 days 10 to 20 days 1 in 4 years
PRECIPITATION See Note 1
Precipitation (1950-2007) % Amount mm/yr
Annual -10 to 25%
Winter -10 to -25
Spring 30 to 40
Summer -10 to 30
Autumn 15 to 35
%
5%
10 to 15
10 to 15
-15 to -20
10 to 15
Rates of Snow to Total Precipitation (Trend 1950-2007) %
Annual -10 to -20
Winter -10
Spring -10 to -20
Autumn -5
%
-15
-10
-15
0
Intense Precipitation (1958-2007) Amounts of severe events +16% (>99 percentile) (adjacent U.S.A.) Frequency heavy rain amounts +12% (>99 percentile) (adjacent U.S.A.)
P 20 +10%)
P 20 →P10

9
BRITISH COLUMBIA SOUTHERN INTERIOR Page 2
OBSERVED (TRENDS) BY 2050 (from 2010)
WIND See Note 2
Intense Winter Storms (Central Pressure <970hpa) Over Northern Hemisphere per year Number 1200 to 1300 8%
8 to 15% more
frequent
RIVERFLOW See Note 3
Dates of Spring break-up (1948-2002) 10 to 15 days earlier
25 days earlier
Snow Pack - 1 April (1950-1997) -40%
-20%
Streamflow (1967-1996) %
Annual -10 to -40%
Minimum Daily 20 to -30
Maximum Daily -40
Low Flows: (1963-2003) Summer 7 day flows Significant downward trend
%
-20 to -40%
-25 to -30
-20
Continued decrease
GLACIERS Glaciers (1995-2005) -0.65m Water equivalent loss
Loss ½ of volume
FOREST WILDFIRES AND INSECTS See Note 4
Observed Nationally Additional 100,000 km2 burned per
1:C temperature increase (1970-
2000)
Projections Continued increase in frequency and area burned
MOUNTAIN PINE BEETLE
9.2 million ha, in B.C. Southern and Central
Note 1: Ranges in observed and projected values indicate differences over the region. Note 2: Wind-disaster records of Public Safety Canada indicate for storms >100km/h national frequency rose 16% from 1970 to 1990 with most in coastal regions, except for tornadoes. Note 3: Major floods and landslides (from PSC data base), where intense rains, or rain on snow, apparently increased 80% nationally between the 1970s and 1990s. However, 1970s event recording may have been less thorough than in 1990s. Data base extends only to 2005.

10
BRITISH COLUMBIA SOUTHERN INTERIOR Page 3 Note 4: Wildfires: Approximately 80% of fires set by lightning. Lightning caused fires are projected to increase globally by 44% by 2100. Note 5: Annual variability above and below climate change driven trends is related to large-scale modes of the natural climate system. This region is especially affected by ENSO (El Nino-La Nina) and the Pacific Decal Oscillation (PDO). When PDO is in a warm phase and El Nino conditions develop, warmer, drier conditions with lower stream flow occur in Western Canada as departures from the global trend. Temperature trends in 1950-99 of 2.5°C were estimated in Western mountainous regions to have been 0.5°C less without a generally positive PDO. (Bonfils et al. 2008)

11
REGION: NORTHERN INTERIOR BRITISH COLUMBIA PAGE 1
OBSERVED (TRENDS)
BY 2050
(from 2000) TEMPERATURE See Note 1
Temperature oC (1950-2007) Max. oC Min. oC
Annual 1 to 1.5 1.5 to 2
Winter 2.5 to 3 2.5 to 3
Spring 1.5 to 2.5 1.5 to 2.5
Summer 0.5 to 1.5 1.5 to 1.5
Autumn 0.5 to -0.5 0.5 to -0.5
oC
2 oC
3.5
4
2
1
Temperature Extremes (1950-2003) Frost free days 10 to 30
Growing Season >5: 10 to 20 days
30days
20 days
PRECIPITATION See Note 1
Precipitation (1950-2007) %
Annual 5 to 10%
Winter -5 to 10
Spring 0 to 10
Summer 0 to 10
Autumn 15
%
10%
10
10
0
10
Ratio of Snow to Total Precipitation (1950-1998) %
Annual 0 to -6
Winter 0 to -3
Spring -18
Autumn 6 to 0
%
-5
-3
-20
0
Intense Precipitation (1950-2003) Very wet days >95percentile 5 days/yr
P 20 0 to 10% amt. P 20 →P7 to P 10
*WIND See Note 2
Intense Winter Storms (Central Pressure <970hpa) Over Northern Hemisphere (1950-2000) Numbers 8%
8 to 15% more
frequent

12
NORTHERN INTERIOR BRITISH COLUMBIA PAGE 2
OBSERVED (TRENDS) BY 2050 (from 2000)
RIVERFLOW See Note 3
Dates of Spring break-up (1948-2002) 10 to 20 days earlier except no change NE
10 days earlier
Snow Pack - 1 April (1950-1997 -20% to -40%
-30%
Streamflow (1967-1996) %
Annual -30% to 20
Minimum Daily -10% to 20
Maximum Daily -30% to 20
Low Flows (7 day) significant downward trend
%
0%
-10
0
Continue
FOREST WILDFIRES AND INSECTS See Note 4
Observed Nationally additional 100,000 km2 burned per 1oC temperature increase (1970-2000) Regionally – 6% of area burned/year 1957-1997
Projections Area burned increase by 50%
MOUNTAIN PINE BEETLE
9.2 million ha, in B.C.
Note 1: Ranges in observed and projected values indicate differences over the region. Note 2: Wind-disaster records of Public Safety Canada indicate for storms >100km/h national frequency rose 16% from 1970 to 1990 with most in coastal regions, except for tornadoes. Note 3: Major floods and landslides (from PSC data base), where intense rains, or rain on snow, apparently increased 80% nationally between the 1970s and 1990s. However, 1970s event recording may have been less thorough than in 1990s. Data base extends only to 2005. Note 4: Wildfires: Approximately 80% of fires set by lightning. Lightning caused fires are projected to increase globally by 44% by 2100.
13
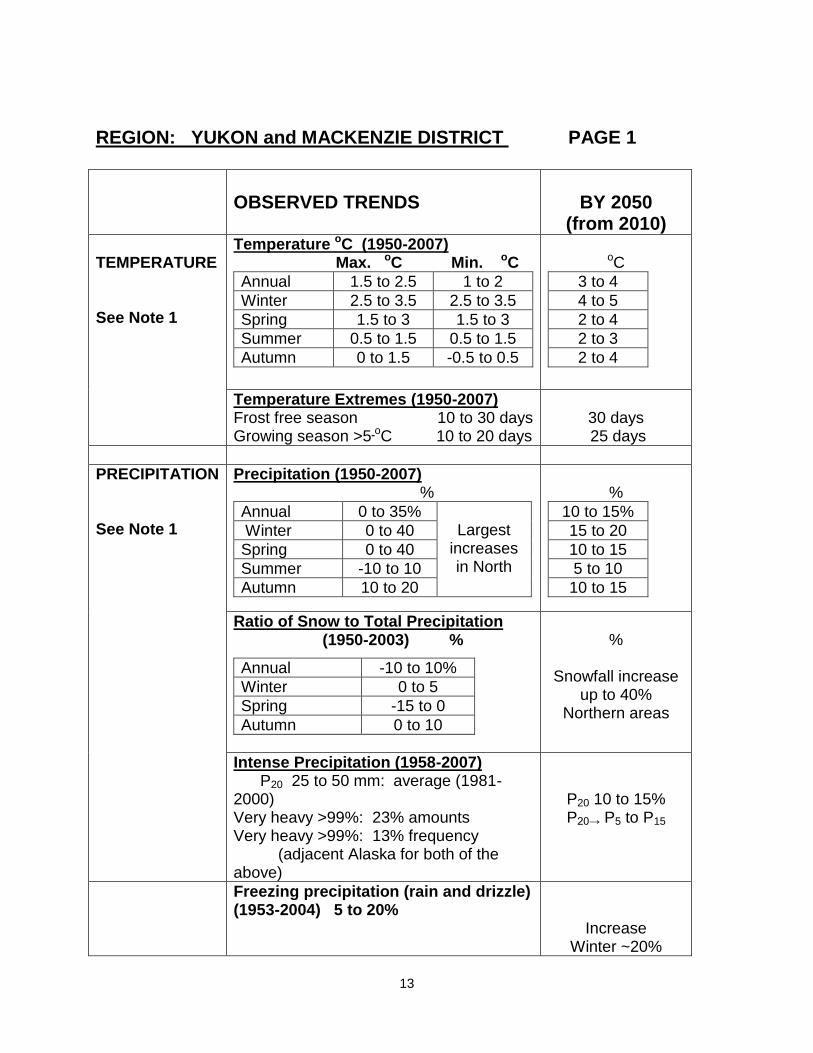
REGION: YUKON and MACKENZIE DISTRICT PAGE 1
OBSERVED TRENDS
BY 2050
(from 2010) TEMPERATURE See Note 1
Temperature oC (1950-2007) Max. oC Min. oC
Annual 1.5 to 2.5 1 to 2
Winter 2.5 to 3.5 2.5 to 3.5
Spring 1.5 to 3 1.5 to 3
Summer 0.5 to 1.5 0.5 to 1.5
Autumn 0 to 1.5 -0.5 to 0.5
oC
3 to 4
4 to 5
2 to 4
2 to 3
2 to 4
Temperature Extremes (1950-2007) Frost free season 10 to 30 days Growing season >5 oC 10 to 20 days
30 days 25 days
PRECIPITATION See Note 1
Precipitation (1950-2007) %
Annual 0 to 35% Largest
increases in North
Winter 0 to 40
Spring 0 to 40
Summer -10 to 10
Autumn 10 to 20
%
10 to 15%
15 to 20
10 to 15
5 to 10
10 to 15
Ratio of Snow to Total Precipitation (1950-2003) %
Annual -10 to 10%
Winter 0 to 5
Spring -15 to 0
Autumn 0 to 10
%
Snowfall increase up to 40%
Northern areas
Intense Precipitation (1958-2007) P20 25 to 50 mm: average (1981-2000) Very heavy >99%: 23% amounts Very heavy >99%: 13% frequency (adjacent Alaska for both of the above)
P20 10 to 15% P20→ P5 to P15
Freezing precipitation (rain and drizzle) (1953-2004) 5 to 20%
Increase Winter ~20%

14
YUKON and MACKENZIE DISTRICT PAGE 2
WIND See Note 2 and
4
Intense Winter Storms <970hpa central Northern Hemisphere pressure (1950-2000) 8% Coastal Storms number 75% (1980-2004)
8 to 15%
RIVERFLOW See Note 3
Dates of Spring break-up (1950-2005) 10 to 25 days earlier e.g. Dawson City (Yukon River) Breakup 1900-1980 in May: 1985-2005 in April
Continue earlier
Streamflow (1967-1996)
Annual -20%S to 7%N
Minimum Daily 0 to 20%
Maximum Daily -10 to 10%
10 to 30% Mainly in April to
July
SEA LEVEL See Note 4
Mean (1993-2007) 3.2/decade
15 to 25cm
PERMAFROST THAW
Some thaw in discontinuous permafrost areas
30% of southern
areas
WILDFIRES See Note 5
Area burned tripled from 1960s to 1990s ~10 days longer fire season
Note 1: Ranges in observed and projected values indicate differences over the region. Note 2: Wind-disaster records of Public Safety Canada indicate for storms >100km/h national frequency rose 16% from 1970 to 1990 with most in coastal regions, except for tornadoes. Note 3: Major floods and landslides (from PSC data base), where intense rains, or rain on snow, apparently increased 80% nationally between the 1970s and 1990s. However, 1970s event recording may have been less thorough than in 1990s. Data base extends only to 2005. Southern region – heavy rain on snow, floods in spring more frequent. Note 4: Sea level and storm surges: Sensitivity to sea level rise and storm surge is high to moderate in much of Beaufort Sea shoreline. Reduction of sea ice to protect shores from erosion and damages to continue and coastal land subsidence of 1.8 to 3 mm/yr exacerbates erosion. Annual number of open water storms on adjacent Alaskan coast averaged 15 (1950-1980) but 24 (1980-2004). Storm surges as high as 2m have been observed in areas near Tuktoyuktuk.
Note 5: Wildfires: Approximately 80% of fires set by lightning. Lightning caused fires are projected to increase globally by 44% by 2100.

15
REGION: SOUTHERN* ALBERTA PAGE 1
OBSERVED TRENDS
BY 2050
(from 2010) TEMPERATURE See note 1
Temperature oC (1950-2007) Max. oC Min. oC
Annual 1.5 to 2.5 0.5 to 1.5
Winter 2.5 to 3 1.5 to 3
Spring 2.5 to 3 2.5 to 2.5
Summer 0.5 to 2.5 -0.5 to 1.5
Autumn -0.5 to 0.5 -1.5 to 0.5
oC
2 to 4
3 to 4
2 to 4
2 to 3
2 to 3
Temperature Extremes (1950-2007) Frost free days -5 to 20 days
Growing Season >5 oC 15 to 30 days
25 days 30 days
PRECIPITATION See note 1 See note 6
Precipitation (1950-2007) % of long term average
Annual -20 to 0
Winter -15 to -5
Spring 0 to 5
Summer 0 to -10
Autumn -5 to 0
%
0 to 10
10 to 15
5 to 15
-5 to -10
0 to 5
Ratio of Snow to Total Precipitation (1950-2003) %
Annual -20 to -5
Winter 0 to 3
Spring -20 to 0
Autumn -5 to 0
%
-15
-10
-20
-10
Intense Precipitation (1958-2007) P20: 25 to 50 mm/day: average (1981-2000) P>99%: 13% frequency (adjacent USA) P>99%: 15% amount (adjacent USA)
P20: 10 to 15% severity P20→P10-15 frequency
WIND See Note 2
Intense Winter Storms <970hpa central pressure Northern Hemisphere 8%
8 to 15% *Roughly south of an E-W line through Red Deer

16
SOUTHERN ALBERTA PAGE 2
OBSERVED (TRENDS)
BY 2050
(from 2010) RIVERFLOW See Note 3
Dates of Spring break-up (1950-2005) Earlier date some significant (10 to 15 days)
Continue earlier
By 30 days
Snow Pack - 1 April (1950-1997) -20%
--40% ???
Glaciers – (1965-2004) -22% of mass balance (Peyto)
Continued loss
Streamflow (1967-1996) %
Annual -10 to -20
Minimum Daily -30% to 20
Maximum Daily -20 to -10
%
-5 to -15
-10 to -20
0
LIGHTNING Flash density See Note 5 See Note 7
(1999-2008) Average 0.5 to 3.5 flash/km2/year Max 0.5 to 4 flash/km2/year
Increase 20%
DROUGHT
(1900-2002) Palmer drought severity index: significant trend towards increased severity
Severe droughts twice
as frequent Note 1: Ranges in observed and projected values indicate differences over the region. Note 2: Wind-disaster records of Public Safety Canada indicate for storms >100km/h national frequency rose 16% from 1970 to 1990 with most in coastal regions, except for tornadoes. Fifty year return period maximum winds are 100 to 140 km/hr from Calgary region to extreme southwest. Note 3: Major floods and landslides (from PSC data base), where intense rains, or rain on snow, apparently increased 80% nationally between the 1970s and 1990s. However, 1970s event recording may have been less thorough than in 1990s. Data base extends only to 2005. Generally winter flows increasing and summer and autumn flows declining. Flash floods in small basins becoming more frequent spring and summer.

17
SOUTHERN ALBERTA PAGE 3 Note 4: Annual variability above and below climate change driven trends is related to large-scale modes of the natural climate system. This region is especially affected by ENSO (El Nino-La Nina) and the Pacific Decal Oscillation (PDO). When PDO is in a warm phase and El Nino conditions develop, warmer, drier conditions with lower stream flow occur in Western Canada as departures from the global trend. Temperature trends in 1950-99 of 2.5°C were estimated in Western mountainous regions to have been 0.5°C less without a generally positive PDO. (Bonfils et al. 2008) Note 5: Most wild fires set by lightning. Global estimate lightning increase by 44% in 21st century. (Price & Rind, 1994) Note 6: P20 signifies the precipitation likely to be equalled or exceeded only once in 20 years on average a long period. Note 7: Hail is relatively frequent (5 to 8 days per year) east of the Rocky Mountain range in Southern and Central Alberta. However, in drought periods, such as 2001 and 2002, with drier air in lower levels of the atmosphere, hail is substantially less frequent.

18
REGION: CENTRAL* ALBERTA PAGE 1
OBSERVED TRENDS
BY 2050
(from 2010) TEMPERATURE See Note 1
Temperature oC (1950-2007) Max. oC Min. oC
Annual 1 to 2.5 1 to 2.5
Winter 1.5 to 3 1.5 to 3
Spring 2.5 to 3.5 1.5 to 2.5
Summer 0.5 to 1.5 0.5 to 1.5
Autumn -0.5 to 0 -1.5 to -0.5
oC
2 to 4
3 to 4
3 to 4
2 to 3
2 to 3
Frost free season 10 to 20 days Growing season >5 oC 10 to 30 days
25 days 30 days
PRECIPITATION See Note 1
Precipitation (1950-2007) %
Annual -10 to -20
Winter -5 to 0
Spring -5 to 0
Summer -5 to -10
Autumn -5 to 5
%
5 to 10
5 to 10
10 to 15
0 to -5
5 to 10
Ratio of Snow to Total Precipitation (1950-2003) %
Annual -5 to -10
Winter 0
Spring -5 to -15
Autumn -5 to -10
%
-15
-10
-15
-5
Intense Precipitation (1958-2007) Spring heavy rains increased 5% per decade in frequency over past century
P20 5 to 10%amount
P20→P10 to 15frequency
Freezing precipitation (rain and drizzle) average (1961-1990) Precipitation: 15 to 20 hrs/year Increase up to 20% extreme North
Increase
WIND See Note 2
Intense Winter Storms Northern Hemisphere (1950-2000) 8%
8 to 15%
*Approximately between East/West line and through Red Deer and through Fort MacMurray

19
CENTRAL ALBERTA PAGE 2
OBSERVED TRENDS
BY 2050
(from 2010) RIVERFLOW See Note 3
Dates of Spring break-up (1973-1999) 10 days earlier (Peace River)
20 days earlier
Snow Pack - 1 April (1950-1997) -20%
-30%
Glaciers – (1965-1997) Average decrease 25%
Continued decrease
~5%/decade
Streamflow (1967-1996) %
Annual -20
Minimum daily -20 to 10
Maximum daily -30 to -10
%
-20
-20
0 to -10
PERMAFROST THAW
Declining at higher elevations in western areas
Continue decline to even higher elevations
WILDFIRES and LIGHTNING See Note 4 See Note 5
National area burned increased 100,000km2 per oC warming (1970-2000)
Continued increase. Area burned increase 15%
DROUGHT Palmer Drought Severity Index: significant increase in frequency and intensity over 20th century
Continued more intense drought: doubled frequency of severe events
Note 1: Ranges in observed and projected values indicate differences over the region. Note 2: Wind-disaster records of Public Safety Canada indicate for storms >100km/h national frequency rose 16% from 1970 to 1990 with most in coastal regions, except for tornadoes.

20
CENTRAL ALBERTA PAGE 3
Note 3: Major floods and landslides (from PSC data base), where intense rains, or rain on snow, apparently increased 80% nationally between the 1970s and 1990s. However, 1970s event recording may have been less thorough than in 1990s. Data base extends only to 2005. Note 4: Most fires set by lightning. Global estimate lightning increase by 44% in 21st century. (Price and Rind, 1994)
Note 5: Hail is relatively frequent (5 to 8 days per year) east of the Rocky Mountain range in Southern and Central Alberta. However, in drought periods, such as 2001 and 2002, with drier air in lower levels of the atmosphere, hail is substantially less frequent.
21
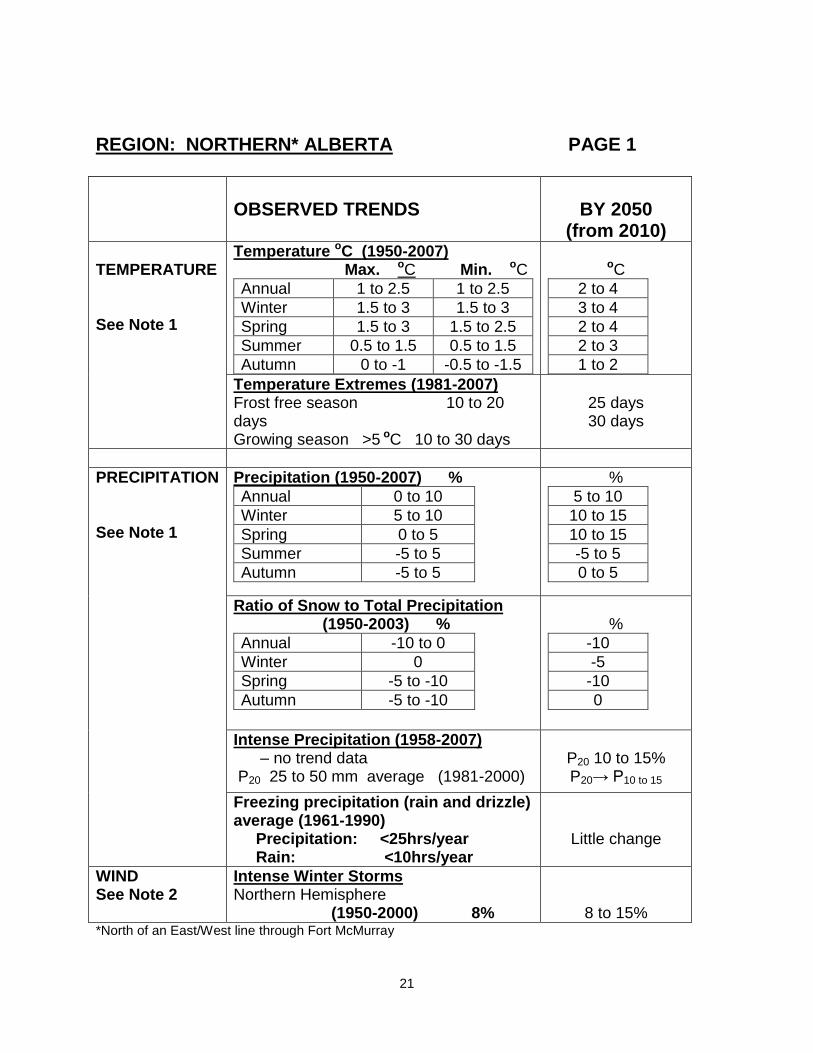
REGION: NORTHERN* ALBERTA PAGE 1
OBSERVED TRENDS
BY 2050
(from 2010) TEMPERATURE See Note 1
Temperature oC (1950-2007) Max. oC Min. oC
Annual 1 to 2.5 1 to 2.5
Winter 1.5 to 3 1.5 to 3
Spring 1.5 to 3 1.5 to 2.5
Summer 0.5 to 1.5 0.5 to 1.5
Autumn 0 to -1 -0.5 to -1.5
oC
2 to 4
3 to 4
2 to 4
2 to 3
1 to 2
Temperature Extremes (1981-2007) Frost free season 10 to 20 days Growing season >5 oC 10 to 30 days
25 days 30 days
PRECIPITATION See Note 1
Precipitation (1950-2007) %
Annual 0 to 10
Winter 5 to 10
Spring 0 to 5
Summer -5 to 5
Autumn -5 to 5
%
5 to 10
10 to 15
10 to 15
-5 to 5
0 to 5
Ratio of Snow to Total Precipitation (1950-2003) %
Annual -10 to 0
Winter 0
Spring -5 to -10
Autumn -5 to -10
%
-10
-5
-10
0
Intense Precipitation (1958-2007) – no trend data P20 25 to 50 mm average (1981-2000)
P20 10 to 15% P20→ P10 to 15
Freezing precipitation (rain and drizzle) average (1961-1990) Precipitation: <25hrs/year Rain: <10hrs/year
Little change
WIND See Note 2
Intense Winter Storms Northern Hemisphere (1950-2000) 8%
8 to 15% *North of an East/West line through Fort McMurray

22
NORTHERN ALBERTA PAGE 2
OBSERVED TRENDS
BY 2050
(from 2010) RIVERFLOW See Note 3
Dates of Spring break-up (1950-2005) Earlier date non-significant statistically
Continue earlier
Snow Pack - 1 April (1950-1997) -20%
-25%
Glaciers – (1965-2004) – Central Alberta -22 to -25% mass balance
(Peyto and Athabasca)
Continued loss
Streamflow (1967-1996) %
Annual -20 to 0%
Minimum daily -10 to 20
Maximum daily -30 to 10
%
-20
-20
-10
PERMAFROST THAW
In discontinuous permafrost areas
Continued thaw. Drying of peatland Increase active layer depth by 50%
WILDFIRES and LIGHTNING See Note 4
0.5 to 2 flashes/km2/year (1999-2008) National area burned increases 100,000km2 per oC warming.
Increased lightning and fire incidence ~20%
DROUGHT Palmer Drought Severity Index: significant increase in frequency and intensity over 20th century
Continued more intense drought: doubled frequency
Note 1: Ranges in observed and projected values indicate differences over the region. Note 2: Wind-disaster records of Public Safety Canada indicate for storms >100km/h national frequency rose 16% from 1970 to 1990 with most in coastal regions, except for tornadoes. Note 3: Major floods and landslides (from PSC data base), where intense rains, or rain on snow, apparently increased 80% nationally between the 1970s and 1990s. However, 1970s event recording may have been less thorough than in 1990s. Data base extends only to 2005. Note 4: Most fires set by lightning. Global estimate lightning increase by 44% in 21st century.

23
REGION: SOUTHERN SASKATCHEWAN and MANITOBA PAGE 1
OBSERVED TRENDS
BY 2050
(from 2010) TEMPERATURE See Note 1
Temperature oC (1950-2007) Max. oC Min. oC
Annual 1 to 2 0.5 to 2
Winter 1.5 to 3 1 to 3
Spring 0.5 to 3 1 to 2.5
Summer -0.5 to 2.5 -0.5 to 1.5
Autumn -0.5 -0.5 to 1
oC
2 to 4
3 to 4
3 to 4
2 to 4
1 to 2
Temperature Extremes (1950-2007) Frost Free Days 10 to 30 days Growing Days >5 oC -10 to 20
Tmax20: 2 to 4 oC Tmax20→ Tmax10-15
25 days 20 days
PRECIPITATION See Note 1
Precipitation (1950-2007) %
Annual -10 to 20
Winter -10 to 15
Spring -10 to 15
Summer -10 to 10
Autumn 5 to 20
%
-5 to 10
0 to 15
5 to 15
-10 to 10
-10 to 10
Ratio of Snow to Total Precipitation (1950-2003) %
Annual -5 to 0
Winter 0
Spring -10 to 5
Autumn -5 to 10
%
-10
-10
-15
-5
Intense Precipitation (1958-2007) Days with amounts in events >99% 15% (adjacent USA) Days with heavy rain >99% frequency 13% (adjacent USA) P20 25 to 50mm (Average 1981-2000)
P20: 5 to 10%
P20→ P10-P15
WIND See Note 2
Intense Winter Storms <970hpa central pressure Northern Hemisphere (1950-2000) 8%
8 to 15%

24
SOUTHERN SASKATCHEWAN and MANITOBA PAGE 2
OBSERVED TRENDS
BY 2050
(from 2010) RIVERFLOW See Note 3 and Note 4
Dates of Spring break-up (1950-2005) Earlier date: non-significant
Continue earlier
Streamflow (1967-1996)
Annual -30 to -40%
Minimum Daily -10 to 30%
Maximum Daily -20 to -30%
%
-20
-20
-0
Permafrost Thaw
Occurring in mid province in discontinuous permafrost areas
Permafrost gone from region with drying of peatlands
Lightning
Flash density average (1999-2008) 1.5 to 4 flash/km2/yr
increase
Note 1: Ranges in observed and projected values indicate differences over the region. Note 2: Wind-disaster records of Public Safety Canada indicate for storms >100km/h national frequency rose 16% from 1970 to 1990 with most in coastal regions, except for tornadoes. Note 3: Major floods and landslides (from PSC data base), where intense rains, or rain on snow, apparently increased 80% nationally between the 1970s and 1990s. However, 1970s event recording may have been less thorough than in 1990s. Data base extends only to 2005. Note 4: An exception to declining flows is Red River through Winnipeg. Climate change induces greater moisture transport from Gulf of Mexico and more precipitation in the U.S. headwaters of the Red River in spring. This suggests increasing flood threats along the Red River.

25
REGION: NORTHERN SASKATCHEWAN and MANITOBA PAGE 1
OBSERVED TRENDS
BY 2050
(from 2010) TEMPERATURE See Note 1
Temperature oC (1950-2007) Max. oC Min. oC
Annual 0.5 to 2.5 0.5 to 1.5
Winter 0.5 to 1.5 0.5 to 1.5
Spring 1.5 to 2.5 0.5 to 2.5
Summer 0.5 to 1.5 0.5 to 1.5
Autumn -0.5 to 1.5 -0.5 to 0.5
oC
2 to 3
3 to 4
2 to 3
2 to 3
1 to 3
Temperature Extremes (1981-2007) Frost Free days 20 Growing Season days >5 oC 10 to 20
25 days 15 days
PRECIPITATION See Note 1
Precipitation (1950-2007) %
Annual -5 to 15%
Winter -10 to 15
Spring -5 to 15 E
Summer 0 to 15
Autumn 5 to 15
%
0 to 15
5 to 20
15W to 25E
-5 to 15
5 to 15
Ratio of Snow to Total Precipitation (1950-2003) %
Annual 0 to 5 E
Winter 0
Spring -10 to 10 E
Autumn 0 to 5
% -5 -5
-10 0
Intense Precipitation (1950-2007) Number of days with rain >99% -5 to 0 P20 average (1981-2000): 25 to 50 mm
P20: 10mm (severity)
P20→ P10-15
(frequency)
WIND See Note 2
Intense Winter Storms <970hpa central pressure Northern Hemisphere ( 1950-2000) 8%
8 to 15%

26
NORTHERN SASKATCHEWAN and MANITOBA PAGE 2
OBSERVED TRENDS
BY 2050
(from 2010) RIVERFLOW See Note 3 and footnote for southern Manitoba and Saskatchewan page 2
Dates of Spring break-up (1950-2005) Earlier date non-significant
Continue earlier Ice free season on Hudson Bay increases towards late November into December
Streamflow (1967-1996) %
Annual -20 to 10%
Minimum Daily -20 to 10
Maximum Daily -30 to 10
%
-10
-10
-15
SEA LEVEL
Mean (1993-2007) 3.2cm/decade
20cm
PERMAFROST THAW
In discontinuous permafrost areas Throughout area with drying of peatlands
LIGHTNING FLASH DENSITY WILDFIRES
0.5 to 2 flashes/sq.km/yr Regionally: >400,000ha average burned (1959-1997) Nationally: area burned increased by 100,000km2 per oC increase in temperature (1970-2000)
Further increase
50% increase area burned
Note 1: Ranges in observed and projected values indicate differences over the region. Note 2: Wind-disaster records of Public Safety Canada indicate for storms >100km/h national frequency rose 16% from 1970 to 1990 with most in coastal regions, except for tornadoes.

27
NORTHERN SASKATCHEWAN and MANITOBA PAGE 3 Note 3: Major floods and landslides (from PSC data base), where intense rains, or rain on snow, apparently increased 80% nationally between the 1970s and 1990s. However, 1970s event recording may have been less thorough than in 1990s. Data base extends only to 2005. Note 4: Most fires set by lightning. Global estimate lightning increase by 44% in 21st century.

28
REGION: WESTERN NUNAVUT PAGE 1
OBSERVED TRENDS
BY 2050
(from 2010) TEMPERATURE See Note 1 See Note 5
Temperature oC (1966-2003)
Annual 0.5 to 1.5/decade
Winter -0.5 to 1.5/decade
Spring 0.5 to 1.5/decade
Summer 0 to 1.5/decade
Autumn 0.5 to 1.5/decade
oC
2 to 4
3 to 5
0 to 3
1 to 3
3 to 6
Temperature Extremes (1981-2007) Frost days: -20 to -10 Heating degree days: -300 to -500o days
-20
-500o days
PRECIPITATION See Note 1
Precipitation %/decade (1966-2003)
%
Annual -10 to 15%
Winter -10 to 10
Spring -5 to 15
Summer --5 to 15
Autumn -10 to 15
%
10 to 25
10 to 25
10 to 20
10 to 15
10 to 20
Ratio of Snow to Total Precipitation (1950-2003) %
Annual 10 to 30
Winter 0 to 10
Spring 0 to 5
Autumn -5 to 10
%
-10
5
0
-15
Intense Precipitation (1958-2007) P>10mm: 2 to 6 days per decade P20: 15 to 35mm average 1981-2000
P20: 10 to 20% P20→P10 to 15
Freezing precipitation (rain and drizzle) average (1961-1990) Precipitation: <25hrs Rain: <10hrs
8% increase/decade in
spring
WIND See Note 2
Intense Winter Storms <970hpa central pressure
Northern Hemisphere (1950-2000) 8%
8 to 15%

29
WESTERN NUNAVUT PAGE 2
OBSERVED TRENDS
BY 2050
(from 2010) RIVERFLOW See Note 3
Dates of Spring break-up (1950-2005) Earlier date non-significant
Continue earlier especially in western
areas
Snow Pack
As ice free season on Hudson Bay and Beaufort Sea increases, greater snow pack will develop in early winter in eastern mainland areas and western archipelago.
Streamflow (1967-1996) %
Annual 10 to 30%
Minimum daily -10 to 30
Maximum daily 15 to 30
In mainland area
%
10 to 30
0 to 10
20 to 30
SEA LEVEL See Note 4
Mean (1993-2007) 3.2cm/decade
15 to 25cm
PERMAFROST THAW
Initial thawing in discontinuous permafrost areas.
Continuous permafrost becoming discontinuous
GLACIERS Mass loss Arctic archipelago 25km3/year (1995-2000)
Increase in loss of mass
Note 1: Ranges in observed and projected values indicate differences over the region. Note 2: Wind-disaster records of Public Safety Canada indicate for storms >100km/h national frequency rose 16% from 1970 to 1990 with most in coastal regions, except for tornadoes. Note 3: Major floods and landslides (from PSC data base), where intense rains, or rain on snow, apparently increased 80% nationally between the 1970s and 1990s. However, 1970s event recording may have been less thorough than in 1990s. Data base extends only to 2005.

30
WESTERN NUNAVUT PAGE 3 Note 4: Sea level and storm surges: Sensitivity to sea level rise and storm surge is high to moderate on the Beaufort Sea coastline much of which is subsiding. Sea ice to protect shores from erosion and damages is being reduced and frequency of severe storms increasing. Note 5: Re Arctic Archipelago: The most completely analyzed climate record in the Canadian Arctic archipelago is for Eureka on Western Ellesmere Island at 79.98°N and 85.93°W. This is near the dividing line between Western and Eastern Nunavut. Observations taken 7 times a day from 1953 to 2007 reveal a strong reversal of temperature trends in the early 1970s. Temperatures were falling from 1960 to 1972 but have shown a strong rise since then, with a trend of +0.88 degrees per decade. Winter trends since 1972 have been 0.67 degrees/decade, spring: 1.14 degrees/decade, summer: 0.42 degrees/decade and autumn: 1.25 degrees/decade. Similar annual trends were found for 11 stations globally, North of 75°N, by the Goddard Institute for Space Studies. With large scale climate change driven overwhelmingly by greenhouse gases since about 1970, it can be assumed that the observed rising trend since 1972 will continue. The falling temperature trend from 1953 to 1970 was due probably to internal variability through the Arctic and North Atlantic Oscillations. Thus for indications of future trends the warming of the past approximately 4 decades is likely to continue and accelerate as climate models suggest and as more ice disappears from the surrounding seas. Unfortunately for this analysis published trend data for elsewhere in the Canadian Arctic is for 1900 to 2007 and 1950 to 2007 (Vincent and Mekis 2009) which include the cooling phase and the greenhouse gas driven warming and so substantially underestimates current and projected warming rates for the next 4 decades.

31
REGION: NORTHERN ONTARIO PAGE 1
OBSERVED TRENDS
BY 2050
(from 2010) TEMPERATURE See Note 1
Temperature oC (1950-2007) oC Max. oC Min. oC
Annual 1.5N to 2.5S 0.5N to 2.5S
Winter 1.5 to 2.5 0.5 to 2.5
Spring 1.5 to 3.5 1.5 to 2.5
Summer 1.5 to 2.5 -0.5 to 1.5
Autumn 0.5 to 1.5 -1.5 to 1
oC
2 to 5
4 to 6N 2 to 4S
2 to 4
2 to 4
2 to 4
Temperature Extremes (1950-2007) Frost free season 10 to 20 days Warm days Tmax >25 oC: 10 to 15 days
Tmax20 2 to 4oC Tmin20 4 to 6oC
20 days
15 days
PRECIPITATION See Note 2
Precipitation (1950-2007) %
Annual -20 to 20
Winter -10 to 5
Spring -10 to 5
Summer 0 to 10
Autumn 0 to 15
%
5 to 15 20 to 30N 10 to 20S
10 to 20
0 to 10
0 to 10
Ratio of Snow to Total Precipitation (1950-2007) %
Annual -5 to -10
Winter 0 to 3
Spring -6 to 3
Autumn -3 to 0
%
-15
-10
-5
-15
Intense Precipitation (1958-2007) Amounts in severe events (>99%): 31% (adjacent USA) Frequency heavy rain amounts (>99%): 27% (adjacent USA) Number of days with amounts ≥ 95th percentile: 3 to 6
P20: 5 to 10%
severity P20→P10 to 15
frequency
Freezing precipitation (rain and drizzle) average (1961-1990) Precipitation: <35hrs Rain: <10hrs
60 to 85% increase
in freezing rain events

32
NORTHERN ONTARIO PAGE 2
OBSERVED TRENDS
BY 2050
(from 2010) WIND See Note 2
Intense Winter Storms Northern Hemisphere <970hpa central pressure 8%
8 to 15%
RIVERFLOW See Note 3
Dates of Spring break-up (1950-2002) Earlier, mostly significant Snow Pack
Earlier still As ice free season on Hudson and James Bays increases towards late November and into December, greater snow pack will develop in early winter in coastal areas.
Streamflow (1967-1996) %
Annual -40 to 10
Minimum Daily -30 to 10
Maximum daily -40 to 10
%
-20
-20
-10
Forest Fires Area burned increased 27% from 1981-1990 to 1991-2000 (But large fire year 1980)
50 to 500% increase
in area
Permafrost and Peatlands
Thawing evident Southern area
Greatest impact Northern area with peatlands drying out
Note 1: Ranges in observed and projected values indicate differences over the region. Note 2: Wind-disaster records of Public Safety Canada indicate for storms >100km/h national frequency rose 16% from 1970 to 1990 with most in coastal regions, except for tornadoes. Note 3: Major floods and landslides (from PSC data base), where intense rains, or rain on snow, apparently increased 80% nationally between the 1970s and 1990s. However, 1970’s event recording may have been less thorough than in 1990s. Data base extends only to 2005. Spring floods earlier but summer rain – induced floods more frequent.

33
REGION: SOUTHERN ONTARIO PAGE 1
OBSERVED (TRENDS)
BY 2050
(from 2010)
TEMPERATURE See Note 1 See Note 6
Temperature oC (1950-2007) Max. oC Min. oC
Annual 0 to 1 0.5 to 1.5
Winter 0.5 to 1 0.5 to 1.5
Spring 0.5 to 1.5 0.5 to 1.5
Summer 0.5 to 1.5 1.5
Autumn -0.5 to -1 0.5
oC
2 to 3.5
2 to 3.5
2 to 4
2. to 3
2 to 3
Temperature Extremes (1950-2007) Frost free days 0 to 30 Growing days >5oC 10 to 30 Toronto Tmax>30 oC ~20 days average (2000-2010)
25 20
Double
Tmax20 4
oC Tmax20→ Tmax10
(i.e. double frequency)
PRECIPITATION See Note 1
Precipitation (1950-2007) (compared to long term average)
Annual 10 to 20%: 1.5 to 5mm/decade
Winter 0 to 3mm/decade most in lee of Gt. Lakes
Spring 0 to 1.5mm/decade
Summer 0
Autumn 1.5 to 3mm/decade Annual
%
5
5 to 20
10 to 15
0 to 10
0
Ratio of Snow to Total Precipitation (1950-2007) Annual -1.5%/decade
-5 to -10%

34
SOUTHERN ONTARIO PAGE 2
Precipitation cont’d See Note 5
Intense Precipitation (1958-2007) P20 = 50 to 75 mm: average (1981-2000) Severity of precipitation events (>99%) 31% (adjacent USA) Frequency heavy rain amounts (>99%) 27% (adjacent U.S.A.) Greatest % increase observed in Spring
7 to 15% per decade (May)
P20 10% Increase severity
P20 → P10
(double in frequency)
Precipitation cont’d
Freezing precipitation (rain and drizzle) average (1961-1990) Precipitation: 50 hours Rain: 10 to 25 hours
>6 hr events:
40% over frequency of (1965-2005)
WIND See Note 2 and 4
Intense Winter Storms (Central Pressure <970hpa) Over Northern Hemisphere (1950-2000) Numbers 8%
8 to 15%
RIVERFLOW See Note 3 See Note 5
Dates of Spring break-up (1948-2002) Earlier – not significant
15 days earlier
Ice Cover (1973-2008) Great Lakes – average winter cover 30% to 15% Huron 33% to 10% Erie
Great Lakes Winter Ice
Cover Close to zero
Streamflow (1967-1996) %
Annual 10 to -20
Minimum Daily 10 to -20
Maximum Daily -10 to -30
%
-10
-20
-10 to 10
Note 1: Ranges in observed and projected values indicate differences over the region. Note 2: Wind-disaster records of Public Safety Canada indicate for storms >100km/h national frequency rose 16% from 1970 to 1990 with most in coastal regions, except for tornadoes. Ontario recorded 29 tornadoes in 2006 and again in 2009 – long term average is 11.

35
SOUTHERN ONTARIO PAGE 3 Note 3: Major floods and landslides (from PSC data base), where intense rains, or rain on snow, apparently increased 80% nationally between the 1970s and 1990s. However, 1970s event recording may have been less thorough than in 1990s. Data base extends only to 2005. (See Note 5) Note 4: Storm surges: Trends towards reduced ice cover and stronger winds over Great Lakes increase incidence of damaging storm surges. e.g. Average Wind Lake Superior increased 4.5 to 4.9m/sec from 1985 to 2007. Note 5: Intense Precipitation: 7 flood-producing heavy rain events Toronto area (1987-2007) all >P2o
from previous records. Rain intensities greatest seasonal increase in Spring over southern Ontario. Severe flash floods - Stratford, Peterborough, Toronto, Hamilton etc. (2000-2009). Record observed short duration rain intensities: Tobermory Cypress Lake: 60 min 112mm, two hour 118mm (2003) Toronto North York: 15 min 66mm, 30 min 90mm, 2 hour 132mm (2005) Upper Grand River basin: 1 day >200mm (2004) Peterborough (Trent University), one day 240 mm (2004)
Note 6: In some places near the Great Lakes little change or declines in number of hot days Tmas>30:C are due to cooler waters of the lakes in spring and summer.

36
REGION: EASTERN ONTARIO, OTTAWA VALLEY and MONTREAL PAGE 1
OBSERVED TRENDS
BY 2050
(from 2010) TEMPERATURE See Note 1
Temperature oC (1950-2007) Max. oC Min. oC
Annual 0.5 to 1.5 0.5 to 1.5
Winter 0.5 to 1.5 0 to 1.5
Spring 0.5 to 1.5 0.5 to 1.5
Summer 1 to 1.5 1.5 to 2
Autumn -0.5 to 0.5 -0.5 to 0.5
oC
2.5 to 4
3 to 4
3 to 4
2 to 4
2 to 3
Temperature Extremes (1950-2007) Frost-free days 20 to 30 Growing season 10 to 20 days
25 days
20 days
PRECIPITATION See Note 1
Precipitation (1950-2007) %
Annual 5 to 15%
Winter -5 to 15
Spring 5 to 15
Summer 0 to 10
Autumn 0 to 15
%
5 to 15
10 to 15
15 to 20
0 to 10
0 to 10
Ratio of Snow to Total Precipitation (1950-2007) %
Annual 0 to -10%
Winter 0 to -5
Spring 0 to -10
Autumn 0 to 5
%
-10 to -20% -15 -15
-5 to -10
Intense Precipitation (1981-2000) P20: 50 to 75 mm (average) Greatest 1 day rainfall 1950-2007 trend 15mm SE to -10mm NW Number of days with rainfall ≥ 95th percentile 6SE, -3NW (1950 to 2007)
P20: amount 5 to 10%
P20→P10 to 15
(frequency)
Freezing precipitation (rain and drizzle) average (1961-1990) Precipitation: 50 hours annual average Rain: 25 hours annual average
Events >6hr duration Winter(DJF) 65% Nov. & Spring 0

37
EASTERN ONTARIO, OTTAWA VALLEY and MONTREAL PAGE 2
OBSERVED TRENDS
BY 2050
(from 2010) WIND See Note 2
Intense Winter Storms <970hpa central pressure Northern Hemisphere (1950-2000) 8% more frequent
8 to 15% more frequent
RIVERFLOW See Note 3
Dates of Spring break-up (1950-2005) Earlier date non-significant
Continue earlier
Streamflow (1967-1996) %
Annual -10 to -30
Minimum Daily 10 to -20
Maximum Daily -20
%
-10
-10
0
Note 1: Ranges in observed and projected values indicate differences over the region. Note 2: Wind-disaster records of Public Safety Canada indicate for storms >100km/h national frequency rose 16% from 1970 to 1990 with most in coastal regions, except for tornadoes. Note 3: Major floods and landslides (from PSC data base), where intense rains, or rain on snow, apparently increased 80% nationally between the 1970s and 1990s. However, 1970s event recording may have been less thorough than in 1990s. Data base extends only to 2005. Increased frequency of flash floods in small watersheds, spring and summer. Note 4: Intense Precipitation: Recent one-day intense event Ottawa (M-C Airport) 137mm
(Sept.2004).

38
REGION: CENTRAL and NORTHERN QUEBEC and LABRADOR PAGE 1
OBSERVED TRENDS
BY 2050
(from 2010) TEMPERATURE See Note 1
Temperature oC (1950-2007*)
Max. oC Min. oC
Annual 0.5 oC -0.5 to 1.5 oC
Winter -0.5 to -1.5 -0.5 to 1.5
Spring 0.5 -1.5 to 1.5
Summer 0.5 to 1.5 0.5 to 1.5
Autumn 1.5 1.5
oC
4
5
3
3
3.5
Temperature Extremes (1950-2007) Frost free days 10 to 30 Growing days (>5 oC) 20 to 30
Days 10 to 30 20 to 30
PRECIPITATION See Note 1
Precipitation (1950-2007) %
Annual 10 to 30% ~100mm
Winter -5 to 15
Spring 15 to 25
Summer 0 to 15
Autumn 10 to 35
%
10 to 15
5 to 20
10 to 20
0 to 10
0 to 20
Ratio of Snow to Total Precipitation (1950-2007) Annual 10%
-10 to 10%
Intense Precipitation (1958-2007) P20 25 to 50 mm
P20 10 to 15%
Freezing precipitation (rain and drizzle) average (1961-1990) Precipitation: <25hrs Rain: <10hrs
Increasing
WIND See Note 2
Intense Winter Storms <970hpa central pressure Northern Hemisphere (1950-2000) 8%
8 to 15%
* Note: North East parts of this region were cooling from 1950 to early 1990s and warming since. See Note 5 for explanation.

39
CENTRAL and NORTHERN QUEBEC and LABRADOR PAGE 2
OBSERVED TRENDS
BY 2050
(from 2010) RIVERFLOW See Note 3
Dates of Spring break-up (1948-2002) Earlier date non-significant
Continue earlier especially in western areas As ice free season on Hudson Bay increases towards late November to December, greater snow pack will accumulate in early winter in western areas.
Streamflow (1967-1996)
Annual 0 to 20%
Minimum Daily -10%
Maximum Daily -10%
increases
Annual and Maximum Continued
decrease minimum
SEA LEVEL See Note 4
Mean (1993-2007) 3.2cm/decade
15 to 25cm
PERMAFROST THAW
Occurring in discontinuous permafrost areas
13 of 14 community airports threatened with disruption. Greatest impact James Bay lowlands
WILDFIRES National: Additional 100,000km2 burned per oC average temperature increase - 1970-2000. Regional average 400,000ha. (1959-1997) area burned
50% increase in area burned

40
CENTRAL and NORTHERN QUEBEC and LABRADOR PAGE 3
Note 1: Ranges in observed and projected values indicate differences over the region. Note 2: Wind-disaster records of Public Safety Canada indicate for storms >100km/h national frequency rose 16% from 1970 to 1990 with most in coastal regions, except for tornadoes.
Note 3: Major floods and landslides (from PSC data base), where intense rains, or rain on snow, apparently increased 80% nationally between the 1970s and 1990s. However, 1970s event recording may have been less thorough than in 1990s. Data base extends only to 2005. Flash floods in small watersheds more frequent with rain on snow events spring and rain events in summer. Note 4: Sea level and storm surges: Sensitivity to sea level rise and storm surge is high to moderate in much of Ungava Bay, and a few embayments in Northern Labrador. Sea ice to protect shores from erosion and damages gradually reduced on Hudson Bay and other coasts. While much of St. Lawrence North Shore is rising, erosion with reduced ice and storm surges is increasing problem (see N.B. and P.E.I.). Higher sea levels extend up St. Lawrence River estuary. For a 20cm increase in sea level (by 2050) a 14cm rise expected at Quebec city and Rimouski. By then damaging storm surges at Rimouski would be 3 times more frequent. Note 5: Newfoundland and Labrador and Eastern Arctic: The North Atlantic Oscillation (NAO), linked to the Arctic Oscillation (AO), is a mode of the internal variation of the global climate system that periodically changes from positive to negative. In its positive phase it brings colder water and air to coastal regions of Labrador and Newfoundland with strong north-easterly winds. The negative phase of NAO brings warmer conditions with warmer, drier winters especially in eastern coastal regions. Temperature trends from 1950 to 1998 reflect a mainly positive NAO phase. There is a hint in climate model outputs that positive NAO may be more frequent in a greenhouse gas forced climate. Thus, general warming in inland (western) parts of Newfoundland and Labrador are likely to be faster than that felt along the east coast.

41
REGION: EASTERN NUNAVUT (Baffin and Ellesmere Islands) PAGE 1
OBSERVED TRENDS BY 2050 (from 2010)
TEMPERATURE See Note 1 See Note 5
Temperature oC (1950-2007)* Max. oC Min. oC
Annual 0 0 to 0.5
Winter -0.5 to 0.5 -0.5 to 0.5
Spring -0.5 to 0.5 -0.5 to 0
Summer 0.5 to 0 0.5 to 0
Autumn 1 to 0 1.5 to 0
oC
2 to 4
3 to 4
2 to 4
1 to 2
3 to 4
Temperature Extremes (1981-2007) Frost Free Season: Start -10days, End 30 days later Heating degree days: -100 to -500
20 days
-300 degree days
Temperature Trends - Eureka (1972-2007)
Annual 0.88°C/dec.
Winter 0.67°C/dec
Spring 1.14°C/dec
Summer 0.42°C/dec
Autumn 1.25°C/dec
As above
PRECIPITATION See Note 1 See Note 3
Precipitation (1950-2007) %
Annual 10S to 35N
Winter -20S to 45N
Spring 15S to 45N
Summer 15S to 20N
Autumn 20S to 40N
%
10 to 25
10 to 25
10 to 20
5 to 10
15 to 35
Ratio of Snow to Total Precipitation (1950-2003)
Annual 0 S to 5 N
Winter 15
Spring 0
Autumn 10 S to 0 N
0
5
-5
0
Intense Precipitation (1981-2000) P20 25 to 50 mm S 10 to 25mm N (Average values)
P20 10 to 20% P20→P7 to 15

42
PRECIPITATION Cont’d
EASTERN NUNAVUT PAGE 2 Freezing precipitation (rain and drizzle) average (1961-1990) Precipitation: <25hrs Rain: <10hrs Trend: 5 to 20% (1953 to 2004)
8% Increase/decade especially spring
WIND See Note 2
Intense Winter Storms Northern Hemisphere (1950-2000) 8%
8 to 15%
RIVERFLOW See Note 3
Dates of Spring break-up (1950-2005) Earlier date non-significant
Continue earlier
Streamflow (1967-1996) Annual Minimum Daily NO DATA Maximum daily
Decrease autumn, Increase spring
SEA LEVEL See Note 4
Mean (1993-2007) 3.2cm/decade
15 to 25cm
PERMAFROST THAW
In discontinuous permafrost areas
Continuous permafrost becomes discontinuous in many areas.
GLACIERS Mass loss Arctic archipelago 25km3/year (1995-2000)
Increase in loss of mass
Note 1: Ranges in observed and projected values indicate differences over the region. Note 2: Wind-disaster records of Public Safety Canada indicate for storms >100km/h national frequency rose 16% from 1970 to 1990 with most in coastal regions, except for tornadoes. Note 3: Major floods and landslides (from PSC data base), where intense rains, or rain on snow, apparently increased 80% nationally between the 1970s and 1990s. However, 1970s event recording may have been less thorough than in 1990s. Data base extends only to 2005. Increasing frequency heavy rain or snow, spring and summer, Baffin Island causing floods, e.g. Pangnirtung, June 2008.

43
EASTERN NUNAVUT (Baffin and Ellesmere Islands) PAGE 3 Note 4: Sea level and storm surges: Sea ice to protect shores from erosion and damages being reduced. Note 5: Re Arctic Archipelago: The most completely analyzed climate record in the Canadian Arctic archipelago is for Eureka on Western Ellesmere Island at 79.98°N and 85.93°W. This is near the dividing line between Western and Eastern Nunavut. Observations taken 7 times a day from 1953 to 2007 reveal a strong reversal of temperature trends in the early 1970s. Temperatures were falling from 1960 to 1972 but have shown a strong rise since then, with a trend of +0.88 degrees per decade. Winter trends since 1972 have been 0.67 degrees/decade, spring: 1.14 degrees/decade, summer: 0.42 degrees/decade and autumn: 1.25 degrees/decade. Similar annual trends were found for 11 stations North of 75°N by the Goddard Institute for Space Studies. With large scale climate change driven overwhelmingly by greenhouse gases since about 1970, it can be assumed that the observed rising trend since 1972 will continue. The falling temperature trend from 1953 to 1970 was due probably to internal variability through the Arctic and North Atlantic Oscillations. Thus for indications of future trends the warming of the past approximately 4 decades is likely to continue and accelerate as climate models suggest and as more ice disappears from the surrounding seas. Unfortunately for this analysis published trend data for elsewhere in the Arctic is for 1900 to 2007 and 1950 to 2007 (Vincent and Mekis 2009) which include the cooling phase and the greenhouse gas driven warming and so substantially underestimates current and projected warming rates for the next 4 decades. Note 6: In recent years, a surface wind of 120 km/hr has been observed at Iqaluit, and 132 km/hr at Pangnirtung (Feb. 2010). Both were influenced by downslope terrain.

44
REGION: NEW BRUNSWICK and PRINCE EDWARD ISLAND PAGE 1
OBSERVED (TRENDS)
BY 2050
(from 2010) TEMPERATURE See Note 1
Temperature oC (1950-2007)
Max. oC Min. oC
Annual - 0.5 to 0.5 -0.5 to 0.5
Winter -1.5 to 0.5 -0.5 to 0.5
Spring 0 to 0.5 0 to 0.5
Summer 0.5 0.5 to 1.5
Autumn -0.5 0 to 0.5
oC
2.5
3
2.5
2 to 3
2.5
Temperature Extremes (1950-2007) Frost free days: 10 to 30 Growing season >5oC: 10 to 20 days
20 days 20 days
T max20: 2 to 4 oC T min 20: 4 to 6 oC
PRECIPITATION See Note 1
Precipitation (1950-2007) %
Annual -20 to 20
Winter -5 to -10
Spring 5 to 10
Summer -10 to 10
Autumn 5 to 15
%
0 to 10
0 to 10
5 to 15
-5 to 10
0 to 5
Ratio of Snow to Total Precipitation (1950-2007)
Annual 0 to 5
Winter 0 to 5
Spring 0 to 5
Autumn 0 to 5
- 10
-10
- 10
-10
Intense Precipitation (1958-2007) For NB Amounts of Precipitation in severe Events (>99 percentile) 67% (adjacent USA Maine)
Frequency heavy daily rain (>99 percentile) 58% (adjacent USA)
P20 10%+ (severity)
P20 → P10 to 15 (frequency)

45
NEW BRUNSWICK and PRINCE EDWARD ISLAND PAGE 2
OBSERVED (TRENDS) BY 2050 (from 2010)
WIND See Note 2
Intense Winter Storms N. Hemisphere 1950 to 2000 (<970hpa) Numbers 8%
8 to 15%
Significant Wave Heights (1950-2000) 2 cm
5 cm
Hurricanes (June to Nov.)
More frequent intense events
RIVERFLOW See Note 3
Dates of Spring break-up (1948-2002) Several times causing ice jams and floods
Continued multiple breakups Average 5 days earlier
Streamflow (1967-1996) %
Annual -30%
Minimum daily -20 to -30
Maximum daily -20 to -30
-30% Lower minima
SEA LEVEL See Note 4
Mean (1993-2007) +3.2cm/decade (Also land subsiding)
15 to 25cm
Storm Surge Southern Gulf >3.6M (2000) 1 in 40 years
>4m 1 in 20 yrs
>3.6m 1 in 2 yrs
FREEZING PRECIPITATION
Average (1961-1990) Precipitation (rain + drizzle): 50 hours Rain: 25 hours
Little change but more in winter, less in spring.
Note 1: Ranges in observed and projected values indicate differences over the region. Note 2: Wind-disaster records of Public Safety Canada indicate for storms >100km/h national frequency rose 16% from 1970 to 1990 with most in coastal regions, except for tornadoes. Hurricanes or hurricane spawned storms, more frequent in Atlantic Provinces, as water temperatures in source region increases (2:C by 2050). Path of hurricanes unlikely to change but more intense storms will survive the long path from source regions in southern North Atlantic.

46
NEW BRUNSWICK and PRINCE EDWARD ISLAND PAGE 3 Note 3: Major floods and landslides (from PSC data base), where intense rains, or rain on snow, apparently increased 80% nationally between the 1970s and 1990s. However, 1970s event recording may have been less thorough than in 1990s. Data base extends only to 2005. Flash floods in small watersheds increase spring and summer, due to heavy rains, and in autumn with more frequent hurricanes. Note 4: Sea level and storm surges: Rising relative sea level plus increase in frequency of intense winter storms and hurricanes suggest much more frequent storm surge flooding in future as indicated in tables.

47
REGION: NOVA SCOTIA Page 1
OBSERVED (TRENDS)
BY 2050
(from 2010) TEMPERATURE See Note 1
Temperature oC (1950-2007) Max. oC Min. oC
Annual -0.5 to 0.5 -0.5 to 0.5
Winter 0 to -0.5 -0.5 to -1
Spring 0 0.5
Summer 1 1
Autumn -0.5 to 0 0 to 0.5
oC
2 to 3
2 to 4
2
2 to 3
2 to 3
Temperature Extremes (1950-2007) Frost free days 10 to 20 Growing Season 10 to 20 days
days 20
15
PRECIPITATION See Note 1
Precipitation (1950-2007) %
Annual 5 to 30% of long term average
Winter -5 to 5
Spring 15 to 20
Summer -5 to 5
Autumn 5 to 15
%
0 to 10
0 to 10
10 to 15
0 to 5
10 to 15
Ratio of Snow to Total Precipitation (1950-2003 %
Annual 0 to 5
Winter 5
Spring 5
Autumn 5
%
-8
-5
-5
-5
Intense Precipitation (1958-2007) P20 50mm to 75mm Days with severe events - rain (>95percentile) 2 to 4 (See Hurricanes under Note 2)
P20: 5 to 10% (Severity) P20→P10 -15
(frequency)
Freezing precipitation (rain and drizzle) average (1961-1990) Precipitation: 50 hours Rain: 25 hours
Little change, more winter less in spring
48
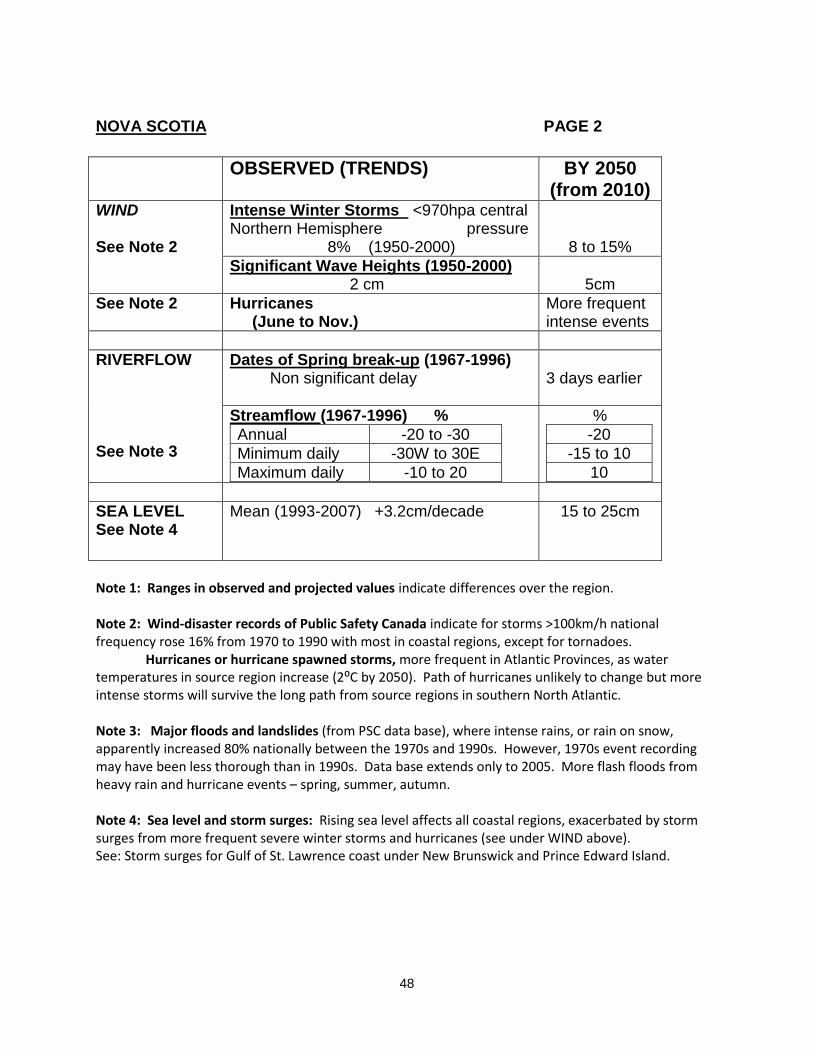
NOVA SCOTIA PAGE 2
OBSERVED (TRENDS) BY 2050 (from 2010)
WIND See Note 2
Intense Winter Storms <970hpa central Northern Hemisphere pressure 8% (1950-2000)
8 to 15%
Significant Wave Heights (1950-2000) 2 cm
5cm
See Note 2 Hurricanes (June to Nov.)
More frequent intense events
RIVERFLOW See Note 3
Dates of Spring break-up (1967-1996) Non significant delay
3 days earlier
Streamflow (1967-1996) %
Annual -20 to -30
Minimum daily -30W to 30E
Maximum daily -10 to 20
%
-20
-15 to 10
10
SEA LEVEL See Note 4
Mean (1993-2007) +3.2cm/decade 15 to 25cm
Note 1: Ranges in observed and projected values indicate differences over the region. Note 2: Wind-disaster records of Public Safety Canada indicate for storms >100km/h national frequency rose 16% from 1970 to 1990 with most in coastal regions, except for tornadoes. Hurricanes or hurricane spawned storms, more frequent in Atlantic Provinces, as water temperatures in source region increase (2:C by 2050). Path of hurricanes unlikely to change but more intense storms will survive the long path from source regions in southern North Atlantic. Note 3: Major floods and landslides (from PSC data base), where intense rains, or rain on snow, apparently increased 80% nationally between the 1970s and 1990s. However, 1970s event recording may have been less thorough than in 1990s. Data base extends only to 2005. More flash floods from heavy rain and hurricane events – spring, summer, autumn. Note 4: Sea level and storm surges: Rising sea level affects all coastal regions, exacerbated by storm surges from more frequent severe winter storms and hurricanes (see under WIND above). See: Storm surges for Gulf of St. Lawrence coast under New Brunswick and Prince Edward Island.

49
REGION: NEWFOUNDLAND* PAGE 1
OBSERVED TRENDS
BY 2050
(from 2010) TEMPERATURE See Notes 1 and 5
Temperature oC (1950-2007)
Max. oC Min. oC
Annual 0 to -0.5 -1
Winter -1.5 -0.5 to -2.5
Spring 0.5 -0.5 to 0.5
Summer 0.5 to 1 0.5 to 1.5
Autumn 0 0.5 to 1
oC
2.5
2 to 4
2
2 to 4
2 to 4
Temperature Extremes (1950-2007) Frost Free Days 5 to 30 Growing season ≥5oC: 0 to 20W
30
20 central and
West
PRECIPITATION See Note 1
Precipitation (1950-2007) %
Annual 10 to 15
Winter -5 to 5
Spring 0 to 10
Summer 10
Autumn 10
%
5
10
5
0 to 5
5
5
Ratio of Snow to Total Precipitation (1950-2003) %
Annual 3
Winter 6
Spring -6
Autumn 6
%
-10
-10
- 5
-5
Intense Precipitation (1950-2007) P20: 50 to 75mm: Average (1981-2000) Frequency heavy rain amounts (>99%) increase 2 to 4 days over period
P 20: 5 to 10%
P 20: → P10
For Labrador, see North and Central Quebec and Labrador.
(These are climatic, not political regions.)

50
NEWFOUNDLAND PAGE 2
OBSERVED TRENDS BY 2050 (from 2010)
WIND See Note 2
Intense Winter Storms N. Hemisphere (1950-2000) <970hpa central pressure 8%
8 to 15%
Significant Wave Heights (1950-2000) 2cm
5cm
Hurricanes (See Note 2)
More frequent intense events
RIVERFLOW See Note 3
Dates of Spring break-up (1950-2005) Earlier: non-significant trend
10 days
Streamflow (1967-1996) %
Annual -10 to -30 except +10 SE
Minimum Daily -30
Maximum daily 10 to -10
%
-20
-30
0
SEA LEVEL See Note 4
Mean (1993-2007) 3.2cm/decade 15 to 25cm
Freezing Precipitation (1961-1990)
Rain plus drizzle 50 hrs W to 150 hrs E Rain 25 hrs W
Increase
Note 1: Ranges in observed and projected values indicate differences over the region. Note 2: Wind-disaster records of Public Safety Canada indicate for storms >100km/h national frequency rose 16% from 1970 to 1990 with most in coastal regions, except for tornadoes. Hurricanes or hurricane spawned storms, more frequent in Atlantic Provinces, as water temperatures in source region increase (2:C by 2050). Path of hurricanes unlikely to change but more intense storms will survive the long path from source regions in southern North Atlantic. Note 3: Major floods and landslides (from PSC data base), where intense rains, or rain on snow, apparently increased 80% nationally between the 1970s and 1990s. However, 1970s event recording may have been less thorough than in 1990s. Data base extends only to 2005. More flash floods in intense rain events and hurricanes – spring, summer, autumn.

51
NEWFOUNDLAND PAGE 3 Note 4: Sea level and storm surges: 40 year return period storm surge ~1m near Middle Arm. Most of coast not vulnerable but beaches impacted by hurricanes 5 times from 1990 to 2005. Severe winter storms and hurricanes becoming more frequent, reducing return period and increasing damages (see under WIND above). Note 5: Newfoundland and Labrador and Eastern Arctic: The North Atlantic Oscillation (NAO), linked to the Arctic Oscillation (AO), is a mode of the internal variation of the global climate system that periodically changes from positive to negative. In its positive phase it brings colder water and air to coastal regions of Eastern Arctic, Labrador and Newfoundland with strong north-easterly winds. The negative phase of NAO brings warmer conditions with warmer, drier winters especially in eastern coastal regions. Temperature trends from 1950 to 1998 reflect a mainly positive NAO phase. There is a hint in climate model outputs that positive NAO may be more frequent in a greenhouse gas forced climate. Thus, general warming in inland and western parts of Newfoundland and Labrador are likely to be faster than that felt along the east coast.

52
V REFERENCE LIST Abeysirigunawardena, D.S. and I. J. Walker, 2008. Sea level response to climate variability and change in northern British Columbia, Atmosphere-Ocean. 46.3:277-296. Alexander, L.V., X. Zhang, et al., 2006. Global observed changes in daily climate extremes of temperature and precipitation, J. of Geophysical Research, Vol. III,D05109, 42pgs. Black, R., J.P. Bruce and M. Egener, 2009. Risk Management Guide for Community Adaptation to Climate Change in Alberta. adaptation.nrcan.gc.ca/projdb/pdf/176a_e.pdf (similar Guides have been developed for Southern Ontario, southern British Columbia and Northern Canada) Bonfils C. et al, 2008. Detection and attribution of temperature changes in the mountainous western U.S. J. of Climate 21. 23:6404-6424. Bonsal, B. and A. Shabbar, 2008. Impacts of large scale circulation variability on low stream flows over Canada’s rivers. CWRJ 33.2:137-153. Bruce, J. P. 2007. Oil and water – will they mix in a changing climate? The Athabasca R. story. Study for WWF Canada. 33 pp. + 3 Figs. Burrows. W., et al., 2010. Canadian lightning data, Atmosphere-Ocean (in press). Cheng, C.S., H. Auld, G. Li, J. Klassen and Q. Li, 2007. Possible impacts of climate change on freezing rain in south-central Canada using downscaled future climate scenarios, Nat. Hazards and Earth Syst.Science.7:71-87. Cheng, C. S., Li, Li and Auld. 2008. Statistical downscaling of hourly and daily climate scenarios for various meteorological variables in south-central Canada. Theor. Appl. Climatol. 91:129-147. Dai, A. K., K. E. Trenberth, T, Qion, 2004. A global data set of Palmer Drought severity index for 1870 to 2002. J. of Hydrology 5:1117-1129. Demuth, M. N., et al., 2008. Recent and past century variations in the glacier resources of Canadian Rocky Mountains. in Tetra Glacialis, Servizia Glaciologico Lombardo: 27-52. Ehsanzadeh, S. and K. Adamowski, 2007. Detection of trends in low flow across Canada. Can. Water Resources J. 32.4:251-264. Environment Canada, 2009. Canadian annual temperature trends 1948 to 2008. Flannigan, M. D. et al., 2005. Future area burned in Canada. Climate Change 72. Ghatak, D. et al., 2010. North America temperature and snowfall and snow depth response to winter climate modes. J. of Climate 23:2320-2332. Goulev, S. K. et al., 2004. Last century change in wind-wave heights from global visual wave data. Geophys. Res. Letters 31.24:L24302. Hanesiak, J. M. and X. L. Wang 2005. Adverse weather trends in the Canadian Arctic. J. of Climate 18.16: 3140-3156.

53
REFERENCES cont’d Hudon, Christiane, et al., 2009. Variations in water temperatures and levels in the St. Lawrence River and potential implications for 3 common fish species: Hydrobiologia, Springer publ. on line 14 Sept. 2009. Intergovernmental Panel on Climate Change, 2007. V.1 The Physical Science Basis and V.2 Impacts, Adaptation and Vulnerability, Cambridge University Press, 2008. International Upper Great Lakes Study, 2009. Impacts on Upper Great Lakes Water Levels: St. Clair River: Report to International Joint Commission, Dec. 2009, 224p. Karl, T.R., J.M. Melillo and T.C. Peterson, (eds.) 2009. Global climate change impacts in the United States, U.S. Global Change Research Program, Cambridge University Press, 188p. Kaliq, M. N. et al., 2008. Temporal evolution of low flow regimes in Canadian rivers. Water Resources Res. 44.W08346, doc 1029/2007 WR006132. Kharin, V.V., F.W. Zwiers, X. Zhang and G.C. Hegerl, 2007. Changes in temperature and precipitation extremes in IPCC ensemble of Global Coupled Model Simulations, J. of Climate 20.8:1419-1444. Kochtubadja, B., et al., 2006. Lightning and Fires in the Northwest Territories and Responses to Future Climate Change, Arctic 59.2:211-221. Lambert, S.J., 2004. Changes in winter cyclone frequencies and strengths in transient enhanced greenhouse warming simulations using two coupled models, Atmosphere-Ocean 42.3:173-181. Lemmen, D.S., F.J. Warren, J. Lacroix, E. Bush, eds., 2008. From impacts to adaptation: Canada in a changing climate, 2007, Natural Resources, Government of Canada, Ottawa, 448p. LeQuere, C., 2009. Closing the global budget for CO2, Global Change 74:28-31, Intl. Geosphere Biosphere Program (IGBP)., Lesins, G. et al. 2010. Climate trends at Eureka in the Canadian High Arctic. Atmosphere-Ocean 42.2:59-80, June. McBean, G. R. et al., 2005. Arctic Climate: Past and Present. Ch. 2 in Arctic Climate Impact Assessment (ACIA), Cambridge Univ. Press. (and other chapters in ACIA) Meteorological Service, Environment Canada, 2007. Icewatch 2007: Changes in lake ice signal a, 12p. Mills, E., 2005. Insurance in a climate of change, Science, V.309:1040-1044, 12 Aug. Minder, J. R., 2010. Sensitivity of mountain snowpack accumulation to climate warming. J. of Climate 23: May, 2634-2650. Mote, P.W., et al., 2003. Declining snowpack in western North America, Bull. Amer. Met. Soc. 86:39-49. Phillips, D., 1990. The Climates of Canada, Government of Canada, Ottawa, 176p. Phillips, D., 2010. Top 10 Canadian weather stories for 2009, CMOS Bull. 38.1:18-24. Price, C and D. Rind, 1994. Possible implications of global climate change on global lightning distribution and frequencies, J. of Geophys. Res. 99:10823-10831.

54
REFERENCES cont’d Stuart, R.A. and G.A. Isaac, 1999. Freezing precipitation in Canada, Atmosphere-Ocean, 37.1:87-102. Tarnocai, C., 2009. The impact of climate change on Canadian peatlands, Can. Water Resources Journal, 34.4:467-485. Vincent, L.A. and E. Mekis, 2009. Trends in temperature and precipitation indices in Canada for the periods 1950-2007 and 1900-2007, Draft, Environment Canada, Nov. 2009. Walker, I. and R. Sidneysmith, et al. 2008. Ch. 8 in From Impacts to Adaptation. D. S. Lemmen et al. eds: 329-386. Zhang, X., L. A. Vincent, W.D. Hogg and A. Nitsoo, 2000. Temperature and precipitation trends in Canada during the Twentieth century, Atmosphere-Ocean 38.3:481-503. Zhang, X., K.D. Harvey, W. D. Hogg and T.R. Yuzyk, 2001. Trends in Canadian streamflow, Water Resources Research 37.4:987-998.


![Raksthai book [mainstreaming climate change adaptation]](https://img.pdfslide.tips/doc/110x75/568bbac61a28ab777e8b925f/raksthai-book-mainstreaming-climate-change-adaptation.jpg)