Embed Size (px)
Citation preview

CoconutRoadTrafficStudy
FromEsteroBaytoThreeOaksParkway
Village of Estero, FL 03/25/2016
Prepared for: Prepared by:
Village of Estero Trebilcock Consulting Solutions, PA
9401 Corkscrew Palms Circle 1205 Piper Boulevard, Suite 202
Estero, FL 33928 Naples, FL 34110
Phone: 239.221.5035 Phone: 239.566.9551
Email: [email protected]

Coconut Road Traffic Study – March 2016 DRAFT
Trebilcock Consulting Solutions, PA P a g e | 2
StatementofCertification
I certify that this Traffic Study has been prepared by me or under my immediate supervision
and that I have experience and training in the field of Traffic and Transportation Engineering.
Norman J. Trebilcock, AICP, P.E.
FL Registration No. 47116
Trebilcock Consulting Solutions, PA
1205 Piper Boulevard, Suite 202
Naples, FL 34110
Company Cert. of Auth. No. 27796

Coconut Road Traffic Study – March 2016 DRAFT
Trebilcock Consulting Solutions, PA P a g e | 3
TableofContents
Project Description ......................................................................................................................... 4
Existing Roadway Conditions .......................................................................................................... 5
Traffic Volume Data Collection ....................................................................................................... 7
Traffic Corridor Level of Service Analysis ........................................................................................ 9
Coconut Road and US 41 Intersection Analysis ............................................................................ 25
Coconut Road – Safety Review ..................................................................................................... 38
Conclusions and Recommendations ............................................................................................. 41
APPENDICES
Appendix A: Lee County DOT Functional Classification ............................................................... 42
Appendix B: FDOT Federal‐Aid Report (Excerpts) ....................................................................... 45
Appendix C: Lee County Road Maintenance Map ....................................................................... 49
Appendix D: Lee County 2015 Concurrency Report (Excerpts) ................................................... 51
Appendix E: Lee County 2015 Traffic Count Report (Excerpts) ................................................... 54
Appendix F: TCS Corridor Volume Counts ................................................................................... 59
Appendix G: 2014 FDOT Peak Season Factor Category Report (Excerpt).................................... 71
Appendix H: 2013 Lee County Link – Specific Volumes (Excerpt) ............................................... 73
Appendix I: Lee County 2035 LRTP (Excerpts) ............................................................................. 75
Appendix J: Potential Development – ITE Period Analysis Reports ............................................. 79
Appendix K: FDOT Traffic Online – T24 Factors ........................................................................... 86
Appendix L: Lee County – Intersection Signal Data ..................................................................... 88
Appendix M: Intersection Analysis ‐ HCS 2010 Printouts ............................................................ 99
Appendix N: Intersection Alternative – HCS 2010 Analysis ....................................................... 109
Appendix O: Crash Data – West of US 41 .................................................................................. 112
Appendix P: Crash Data – East of US 41 .................................................................................... 114
Coconut Road Traffic Study – March 2016 DRAFT
Trebilcock Consulting Solutions, PA P a g e | 4
ProjectDescription
Traffic counts on major roadways in Lee County had dropped significantly around 2007‐2008
due to the downturn in the economy. With the improved economy, more development activity
has been the result. As such, Lee County roadway traffic has been climbing up towards pre‐
recession levels.
Many roadways in the Village of Estero are faced with increased traffic congestion and delays.
The Coconut Road Traffic Study was initiated by the Village of Estero, Department of
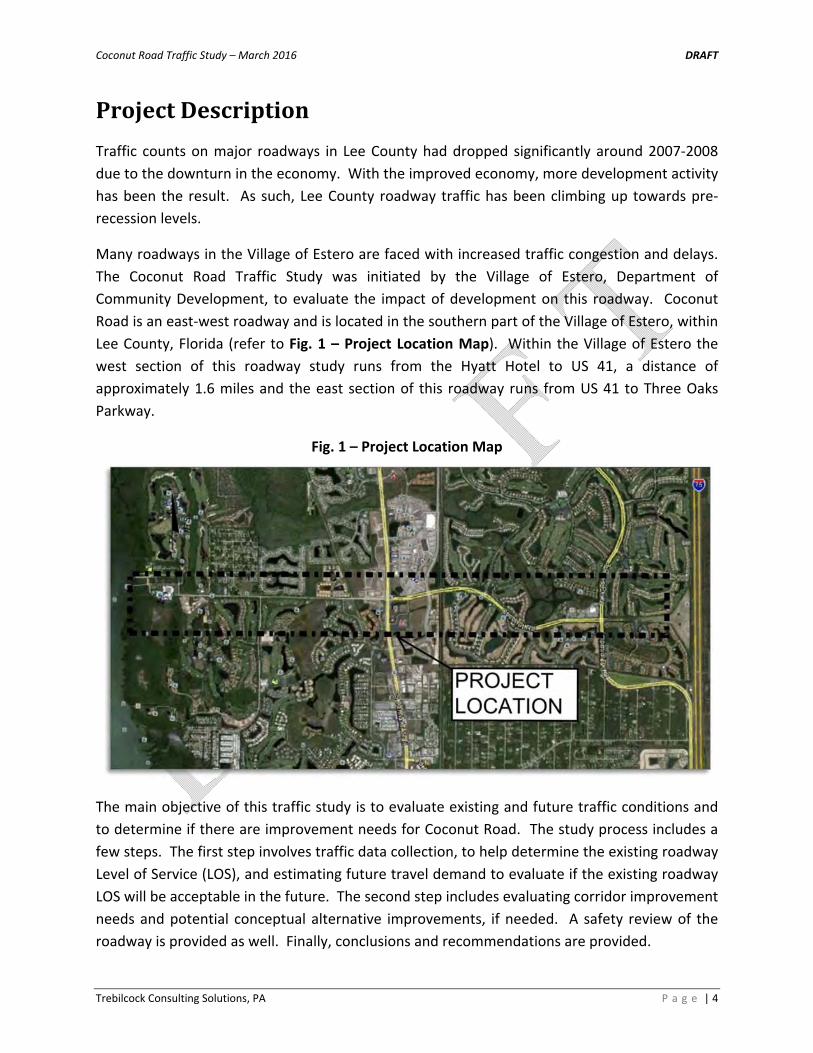
Community Development, to evaluate the impact of development on this roadway. Coconut
Road is an east‐west roadway and is located in the southern part of the Village of Estero, within
Lee County, Florida (refer to Fig. 1 – Project Location Map). Within the Village of Estero the
west section of this roadway study runs from the Hyatt Hotel to US 41, a distance of
approximately 1.6 miles and the east section of this roadway runs from US 41 to Three Oaks
Parkway.
Fig. 1 – Project Location Map
The main objective of this traffic study is to evaluate existing and future traffic conditions and
to determine if there are improvement needs for Coconut Road. The study process includes a
few steps. The first step involves traffic data collection, to help determine the existing roadway
Level of Service (LOS), and estimating future travel demand to evaluate if the existing roadway
LOS will be acceptable in the future. The second step includes evaluating corridor improvement
needs and potential conceptual alternative improvements, if needed. A safety review of the
roadway is provided as well. Finally, conclusions and recommendations are provided.

Coconut Road Traffic Study – March 2016 DRAFT
Trebilcock Consulting Solutions, PA P a g e | 5
ExistingRoadwayConditions
Coconut Road is classified as a major collector under
the jurisdiction and maintenance of the Lee County
Department of Transportation, and it stretches from
Estero Bay to the west to just west of Interstate 75 to
the east (Pebble Pointe at the Brooks).
Refer to Appendix A: Lee County DOT Functional
Classification, Appendix B: FDOT Federal – Aid Road
Report (Excerpts) and Appendix C: Lee County Road
Maintenance Map.
Coconut Road is an undivided two‐lane roadway at its
western terminus and has mainly an open drainage
system. East of the Hyatt hotel, the roadway has turn
lanes at many access points. There is also a sidewalk
along the south side of the roadway. The posted speed
limit for the east‐west section is 40 mph. About 900 ft.
west of the intersection with US 41 the roadway
changes to curb and gutter with a closed drainage
system and sidewalks on both sides of the roadway. East
of US 41, the roadway is a four‐lane divided curb and
gutter facility with a posted speed limit of 45 mph. In the
eastern section (from US 41 to Three Oaks Parkway),
there are undesignated on‐street bicycle lanes on both
sides and an asphalt pathway on the south side. Turn
lanes are provided as well.
Lee County develops a concurrency report annually that
includes an inventory of the maximum utilized and
available capacity of public facilities for which minimum
Level of Service (LOS) standards are prescribed. The
latest report is the October 2015 Concurrency Report.
The transportation inventory from the Concurrency
Report shows roadway link traffic volumes and its
corresponding LOS by “Existing” 2014 100th Highest Hour,
a short‐term projected “Future” estimated 2015 100th
Highest Hour, and Future Forecast Volume.
East‐west portion of Coconut Road terminates at the Hyatt Hotel and the roads runs north‐south for a short length (<500 ft) and then west for another 2,000 ft.
Coconut Road west of US 41 is mainly an undivided 2‐lane section of roadway.

Coconut Road Traffic Study – March 2016 DRAFT
Trebilcock Consulting Solutions, PA P a g e | 6
Lee County Department of Transportation (Lee DOT)
continues to comply with the requirements within the
Lee County Comprehensive Land Use Plan (the Lee
Plan) by updating the calculations of the maximum
service volume for LOS A through LOS E. The
maximum service volumes are based on the existing
roadway characteristics plus any changes that are part
of an improvement that has been programmed for
construction in the first three (3) years of the adopted
5‐year Lee County Capital Improvement Program (CIP)
or the Florida Department of Transportation (FDOT)
Work Program.
The existing roadway conditions are extracted from
the Lee County October 2015 Concurrency Report and
illustrated in Table 1, Existing Roadways Conditions.
Table 1 Existing Roadways Conditions
Roadway Link Name
Lee County Link No.
Lee County Roadway Link
Location
Exist Roadway(1)
Standard LOS
Standard Volume(2)
2014 100th Highest Hour LOS
2014 100th Highest Hour Volume(2)
Coconut Road
05000 Spring Creek Road to US 41
2LN E 860 C 366
Coconut Road
05030 US 41 to Three Oaks Parkway
4LD E 1,790 C 588
Note(s): (1) 2LN = 2‐narrow lanes roadway; 4LD =4‐lane divided roadway, respectively; (2) Peak Hour, Peak Season, Peak Direction.
Refer to Appendix D: Lee County 2015 Concurrency Report (Excerpts).
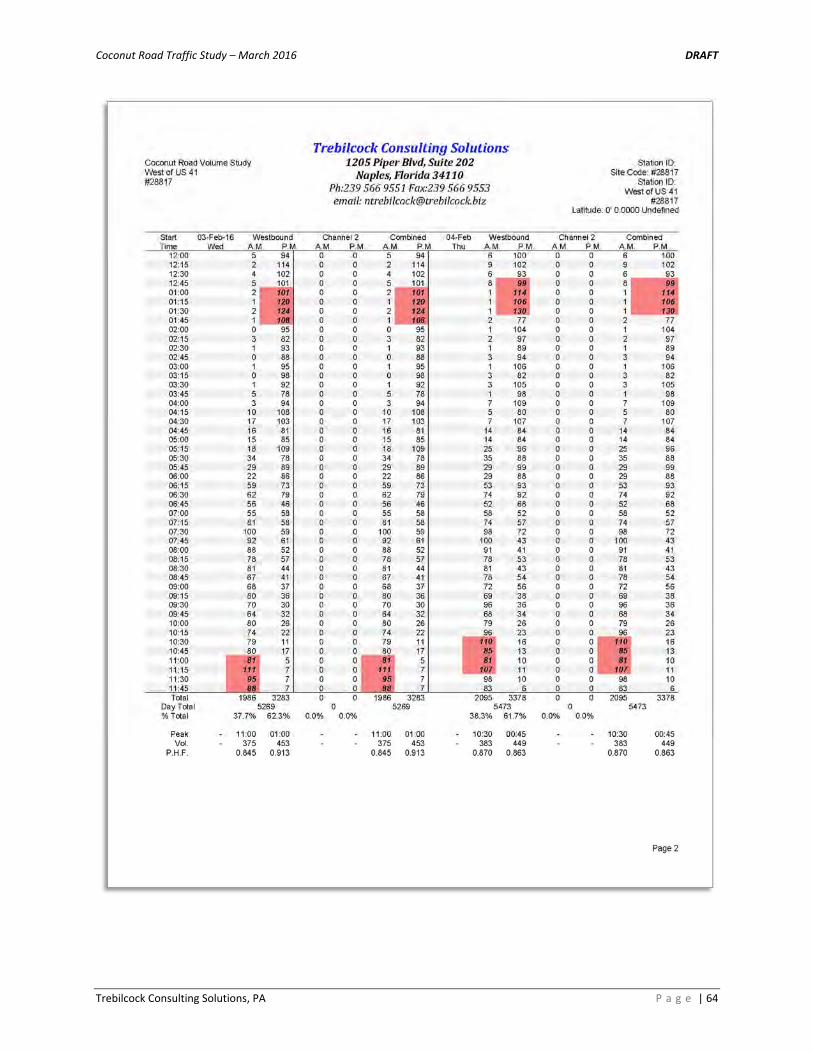
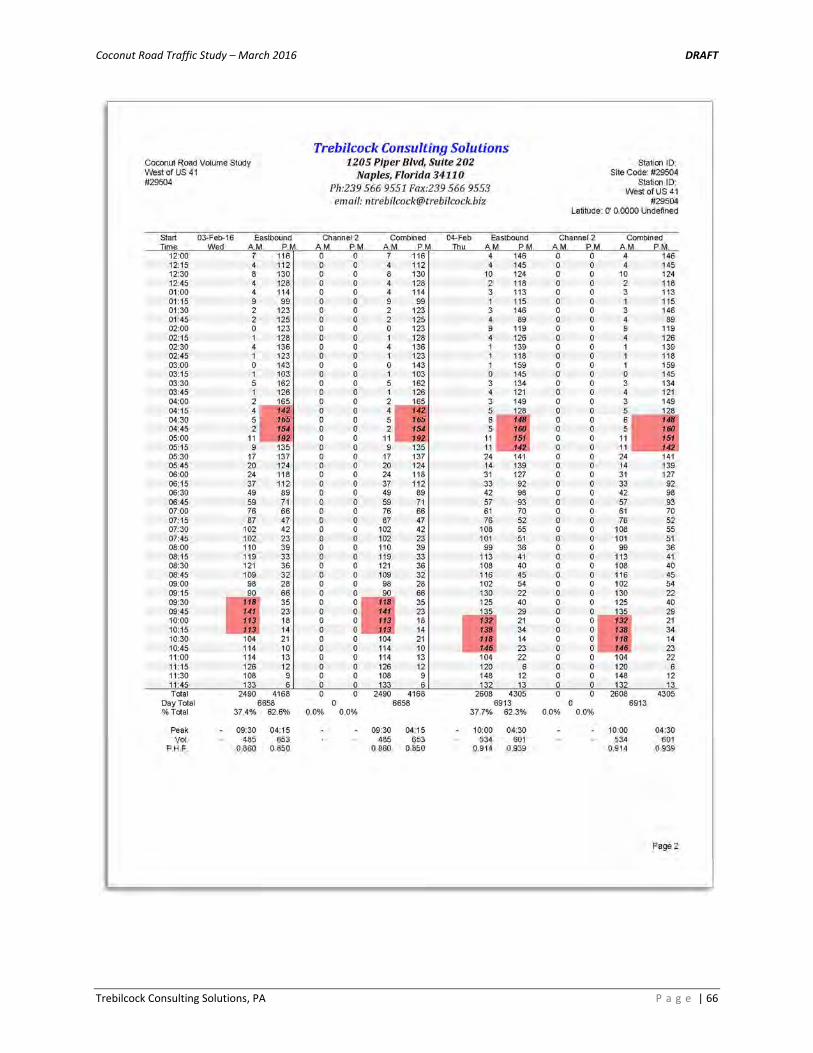
Lee DOT operates traffic count programs on its major roadways to provide traffic characteristics
and historical data. Coconut Road traffic count data is provided in Appendix E: Lee County
2015 Traffic Count Report (Excerpts).
Coconut Road east of US 41 is a divided 4‐lane section of roadway.

Coconut Road Traffic Study – March 2016 DRAFT
Trebilcock Consulting Solutions, PA P a g e | 7
TrafficVolumeDataCollection
Existing daily and peak hour traffic count data were collected by Trebilcock Consulting Solutions
(TCS) for the study corridor. This included traffic counts conducted along the corridor and its
intersection with US 41 and count data provided by Lee DOT.
Bi‐directional 72‐hour machine traffic counts were conducted along the Coconut Road study
corridor in February 2016 at four (4) selected locations (refer to Appendix F: TCS Corridor
Volume Counts).
Selected corridor traffic count locations are illustrated in Fig. 2 and Table 2.
For the purpose of this study, turning movement counts for the intersection of Coconut Road
and US 41 were conducted on Wednesday, January 27, 2016, from 7AM to 9AM, and from 4PM
to 6PM.

Coconut Road Traffic Study – March 2016 DRAFT
Trebilcock Consulting Solutions, PA P a g e | 8
Fig. 2 – Project Traffic Count Locations
Table 2 TCS Count Locations
Roadway Link Name
TCS Count Location
TCS Roadway Segment Lee County Link No.
Coconut Road 1 From Spring Creek Road to US 41 05000
Coconut Road 2 From Spring Creek Road to US 41 05000
Coconut Road 3 From US 41 to Via Coconut Point 05030
Coconut Road 4 From Via Coconut Point to Three Oaks
Parkway 05030

Coconut Road Traffic Study – March 2016 DRAFT
Trebilcock Consulting Solutions, PA P a g e | 9
TrafficCorridorLevelofServiceAnalysis
Collected daily and peak hour traffic count data was analyzed in accordance with FDOT and Lee
DOT procedures.
1. Annual Average Daily Traffic (AADT)
Based on the FDOT procedures outlined in the Project Traffic Forecasting Handbook, the
AADT volumes can be determined from short‐term traffic count data collected by applying
correction factors, such as Weekly Seasonal Correction Factor (SF) and the Axle Correction
Factor (AF). The AADT is calculated based on the following formula: AADT = ADT x SF x AF.
The Average Daily Traffic (ADT) is the total traffic volume during a given time period divided
by the number of days in that time period. For the purpose of this report, the 72‐hour
traffic volume is averaged for Tuesday, Wednesday and Thursday. The calculated 2016
AADT volumes for the field traffic counts are rounded to the nearest hundredths.
Weekly Seasonal Correction Factor (SF) is extracted from the latest published FDOT Peak
Season Factor Category Report as shown in Appendix G: 2014 FDOT Peak Season Factor
Category Report (Excerpt).
As illustrated in the FDOT Traffic Monitoring Handbook, axle factor categories are more
highway‐specific than seasonal factor categories. For the purpose of this report, the AADT
has not been adjusted with axle correction factor. Projected 2016 AADT volumes are
illustrated in Table 3.
Table 3 Coconut Road – 2016 AADT
Coconut Road Traffic Study – March 2016 DRAFT
Trebilcock Consulting Solutions, PA P a g e | 10
2. Traffic Characteristics and Existing 2016 Level of Service (LOS)
The evaluation of existing and future traffic operating conditions along Coconut Road is
determined based on Directional Design Hourly Volumes (DDHV). DDHV are obtained by
applying a number of traffic factors such as Design Hour Factor (K) and Directional
Factor (D).
Consistent with the information contained within the 2015 Lee County Traffic Count Report
and the 2015 Lee County Concurrency Report, the current 2016 peak season, peak hour,
peak direction is calculated by factoring the 2016 AADT by the appropriate K‐100 and D‐100
factors, approximating the 100th highest hour of the year.
The Lee County Traffic Count Report provides traffic characteristics for roadway stations
located on all major roadways in Lee County. Monthly, daily and hourly factors are
available for all permanent count station. Traffic characteristics of the permanent count
stations are used to factor the periodic count location. A review of 2015 Lee County Traffic
Count Report – Permanent Count Station 15 (PCS) – was conducted to determine K‐100
factor.
The Directional Distribution, D‐100 factor is the percentage of the total, two‐way design
hour traffic (the 100th highest hour of the year) traveling in the peak direction. The D‐100
factor is used in Lee County in calculating the level of service for a roadway.
A “D” factor associated with a specific roadway link is derived using permanent traffic
counters located throughout Lee County. As illustrated in the FDOT Traffic Monitoring
Handbook, Florida values for “D” range between 50% and 80%.
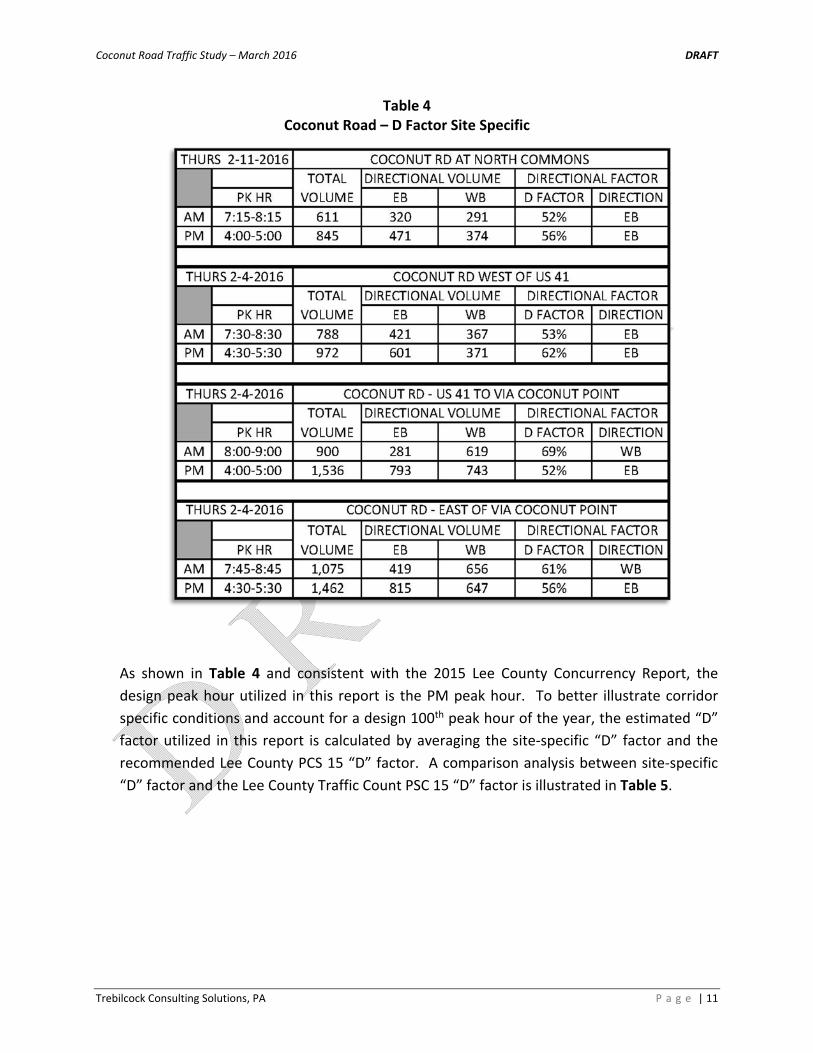
Site‐specific “D” factors are calculated for all four (4) TCS traffic count locations during the
AM peak hour of 7‐9 AM, and PM peak hour of 4‐6 PM. It is noted that based on collected
site traffic counts, the eastbound was the peak direction movement in the AM and PM for
the Coconut Road link west of US 41. For the Coconut Road segment located east of US 41,
it was observed that westbound was the peak direction in the AM, while eastbound was the
peak direction in the PM. Site‐specific “D” factor values are illustrated in Table 4.
Coconut Road Traffic Study – March 2016 DRAFT
Trebilcock Consulting Solutions, PA P a g e | 11
Table 4 Coconut Road – D Factor Site Specific
As shown in Table 4 and consistent with the 2015 Lee County Concurrency Report, the
design peak hour utilized in this report is the PM peak hour. To better illustrate corridor
specific conditions and account for a design 100th peak hour of the year, the estimated “D”
factor utilized in this report is calculated by averaging the site‐specific “D” factor and the
recommended Lee County PCS 15 “D” factor. A comparison analysis between site‐specific
“D” factor and the Lee County Traffic Count PSC 15 “D” factor is illustrated in Table 5.

Coconut Road Traffic Study – March 2016 DRAFT
Trebilcock Consulting Solutions, PA P a g e | 12
Table 5 Coconut Road – Estimated D‐100 Factor
Existing 2016 operating conditions were determined for roadway segments along Coconut
Road as follows: from Spring Creek Road to US 41; from US 41 to Via Coconut Point; and
from Via Coconut Point to Three Oaks Parkway. Based on our field observations and a
review of the Lee County Traffic Count Report data associated with Coconut Road, it is our
recommendation to use TCS counter location #2 (west of US 41) to represent data
corresponding to Coconut Road segment from Spring Creek to US 41.
In agreement with the Lee DOT level of service calculations, daily volumes are converted to
peak hour, peak season, peak directional volumes by applying K‐100 factor, the estimated
D‐100 factor and Lee County PCS 15 day of the week fraction. The estimated Directional
Design Hour Volume (DDHV) is illustrated In Table 6.
Table 6 Coconut Road – Estimated Directional Design Hour Volume

Coconut Road Traffic Study – March 2016 DRAFT
Trebilcock Consulting Solutions, PA P a g e | 13
The estimated 2016 DDHV is then compared to the directional capacities obtained from
2015 Lee County Concurrency Report and the Lee County Generalized Peak‐Hour
Directional Service Values. The LOS is reflected in Table 7.
Table 7 Coconut Road – Estimated 2016 LOS
Consistent with operation performance standard of LOS E for Coconut Road roadway
segments as illustrated in the 2015 Lee County Concurrency Report, no level of service
deficiencies were identified for existing 2016 peak hour, peak season, peak direction
background traffic conditions.
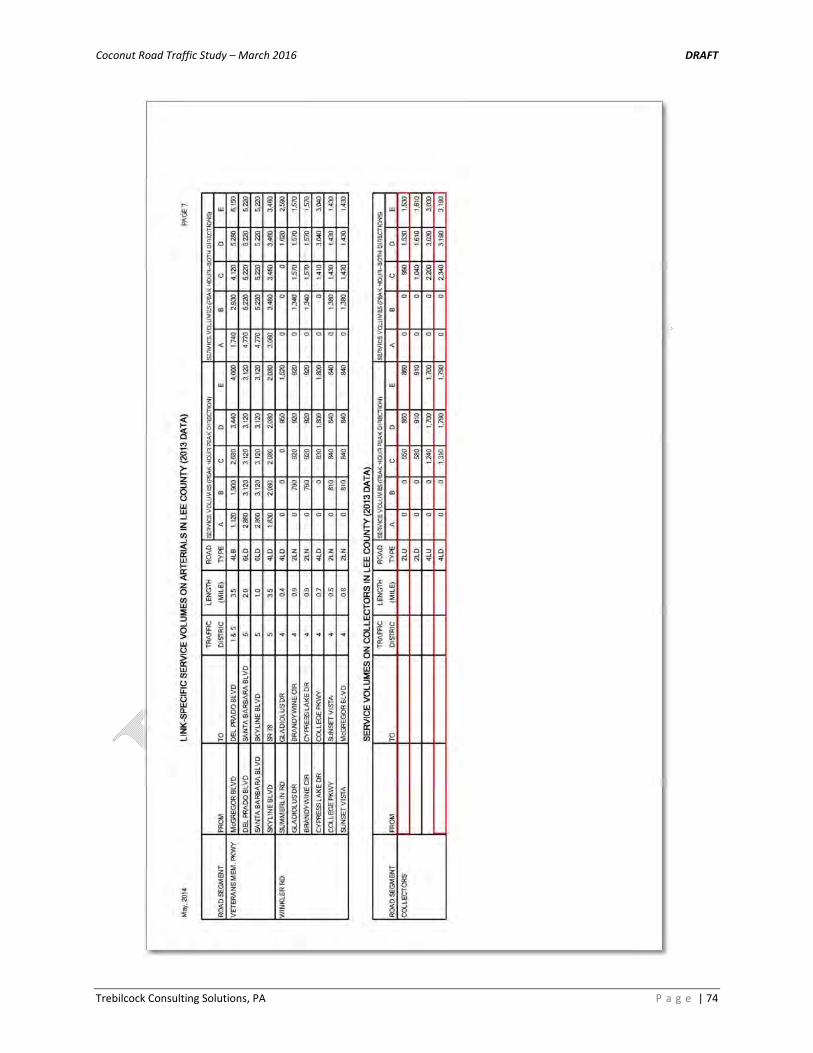
Lee County service volumes for peak hour and peak direction are provided in Appendix H:
2013 Lee County Link – Specific Service Volumes (Excerpt).
3. Future Area Growth
The Coconut Road region has been experiencing significant growth, not only in population
but also in economic activities.
The historical traffic data was obtained from the 2015 Lee County Traffic Count Report
(excerpts are included in Appendix E) and is summarized in Table 8.
Table 8 Coconut Road – Historical Traffic Data
ROADWAY SEGMENT FROM TO
NUMBER OF
LANES
AADT* GROWTH RATE
2006 2007 2008 2009 2010 2011 2012 2013 2014 2015
Coconut Road
Spring Creek Road
US 41 2 LN 6000 9300 N/A N/A N/A 7800 N/A 7600 N/A 9200 4.85%
US 41 Three Oaks Pkwy
4 LD 15100 15500 12600 9900 10700 9900 N/A 12200 N/A 12200 -2.35%
US 41 South of
Hickory Dr 6 LD 43300 41300 41200 40200 38600 42000 N/A 36600 37700 42500 -0.20%
Note(s): *Refer to 2015 Lee Traffic Count Report

Coconut Road Traffic Study – March 2016 DRAFT
Trebilcock Consulting Solutions, PA P a g e | 14
A review of the historical traffic data indicates that the annual growth rate is 4.85% for
Coconut Road west of US 41, and it is negative for the US 41 and Coconut Road segment
located east of US 41. As coordinated with the Village of Estero Transportation staff, a
minimum growth rate of one percent (1%) was utilized for the Coconut Road segment east
of US 41.
The exponential growth formula was implemented to calculate estimated annual growth
rate as follows: F = P x (1+r)n where – F = future volume; P = base year traffic volume; r =
growth rate percentage; n = number of years from the base year.
4. Coconut Road Corridor Development Potential
Several government documents were reviewed in an effort to determine the consistency
with future transportation demand and develop strategies for potential solutions along the
corridor. As part of this report, the following documents were reviewed: Lee County
Transportation Improvement Program, Fiscal Year 2015/2016 to Fiscal Year 2019/2020 (as
adopted September 15, 2015); 2015 Lee County Concurrency Report; and the Lee County
Metropolitan Planning Organization (MPO) 2035 Long‐Range Transportation Plan (LRTP).
The 2035 LRTP is a long‐range plan for transportation needs developed by the Lee County
MPO. The 2035 LRTP recommends major transportation projects, systems, strategies, and
policies in order to maintain and improve the current transportation system with the
objective of meeting future travel demand.
Based on the review of these documents, there are no major improvements depicted in the
2035 LRTP Needs Plan. As such, the existing Coconut Road corridor conditions are
consistent with the adopted 2035 LRTP.
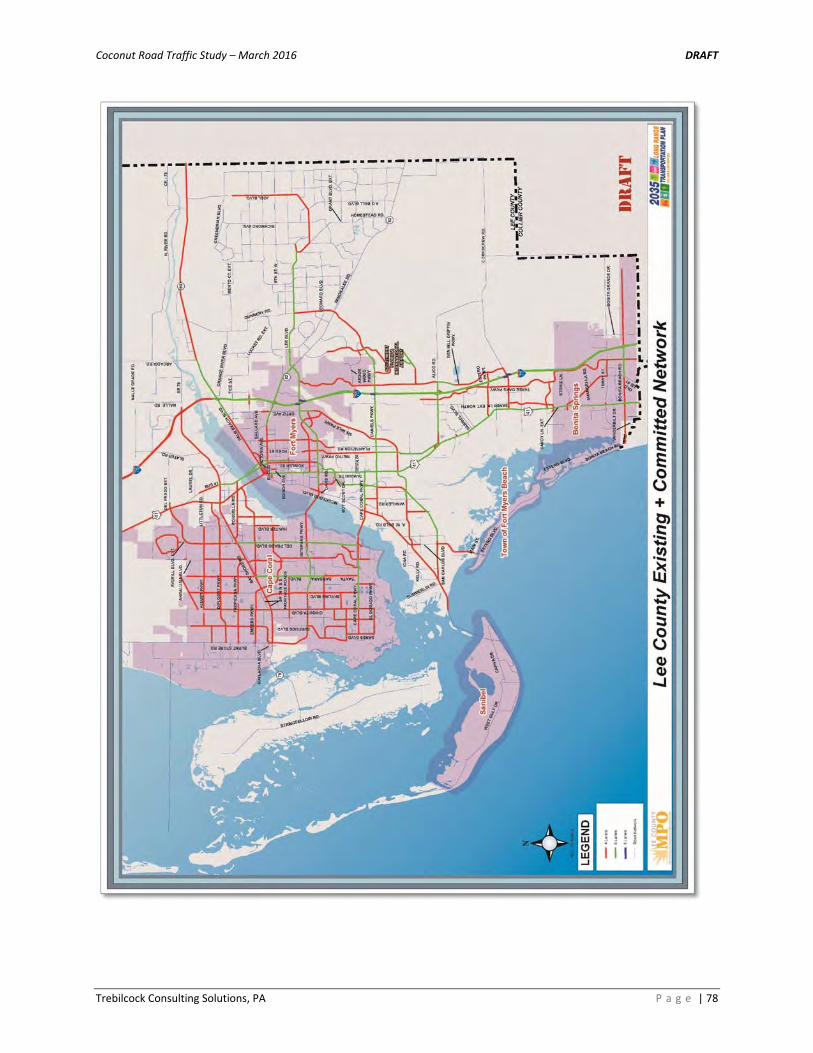
The latest Lee County Draft Highway Needs Plan (roadway improvements for Needs Plan)
and Lee County Existing and Committed Network are provided in Appendix I: Lee County
2035 LRTP (Excerpts).
Although the economic down‐turn since 2007‐2008 has decelerated the pace of planned
projects from this area, several developments approved by either Lee County staff or the
City of Bonita Springs Planning staff are still moving forward. The result of this localized
growth and implementation of the approved developments are impacting roadway
conditions. In addition to the zoning approved developments, there are undeveloped
parcels that may be considered for future construction permitting.

Coconut Road Traffic Study – March 2016 DRAFT
Trebilcock Consulting Solutions, PA P a g e | 15
For the purpose of this report, zoning approved developments are expected to be
completed within the next five (5) years, while the potential future permitting is expected
to develop within the next ten (10) or more years.
The projected Coconut Road development potential is summarized in Table 9 and Fig. 3 –
Coconut Road Development Potential Map.
Table 9 Coconut Road – Estimated Development Potential
ID #
STRAP # PARCEL NAME DEVELOPMENT PARAMETERS
ZONING APPROVALS
NOT YET CONSTRUCTED
POTENTIAL FUTURE
CONSTRUCTION PERMITTING
1 07-47-25-B2-00004.00CE Pelican Landing Community Association
Marina – 20 berths; Restaurant – 3,000sf X
2A 07-47-25-B2-00003.0370 Estero Bay Marine LLC (Weeks Fish Camp)
Residential – Multi Family – 360 dwelling units – high-rise buildings X
2B 07-47-25-B2-00003.0000
3 07-47-25-B2-00000.0010 WCI/Pelican Landing DRI (Raptor Bay)
Residential – Multi Family – 360 dwelling units – high-rise buildings
X
4 06-47-25-00-00002.0030 Pelican Landing Timeshare Ventures LP
Timeshare – Rental Townhouses – 267 dwelling units X
5 17-47-25-B1-00001.012A WCI Communities Inc (Altaira High Rise)
High-Rise Residential Condominium/ Townhouse – 76 dwelling units X
6 17-47-25-B1-U1681.1891 WCI Communities Inc (Two Future High Rises)
Residential – Multi Family – 150 dwelling units – high-rise buildings
X
7 08-47-25-01 + Eldorado Acres Subdivision Residential – Single Family – 98 dwelling units – platted lots X
8 08-47-25-00-00003.0030 John T. Watson Residential – Single Family – 2 dwelling units X
9 08-47-25-01-00016.0000 Judy K. Doyle Residential – Single Family – 15 dwelling units
X
10 08-47-25-00-00004.0000 Dhaliwal + J/T Residential – Single Family – 3 dwelling units
X
11 08-47-25-E2-U1757.2005 Dhaliwal + J/T X
12 09-47-25-E1-U1823.2024 Dewane/Docese of Venice Residential – Multi Family – 93 dwelling units
X
13 09-47-25-E4-U1882.1994 Coconut Road Associates LLC General Office Building – 122,484sf X
14 09-47-25-E1-U1874.2023 HG Coconut LLC Shopping Center – 210,000sf Medical Office Building – 40,000sf Multi-Family Residential – 525 dwelling units Assisted Living – 152 beds Hotel – 130 Rooms
X 15A 09-47-25-E1-U1877.2039
OBE Florida CRE Holdings LLC 15B 09-47-25-E2-U1900.2033
15C 09-47-25-E2-U1902.2012
16 09-47-25-E3-31000.0050 Allsee Investment LP General Office Building – 27,500sf X
17 09-47-25-E3-31000.0010 Naples Diagnostic Imaging General Office Building – 15,000sf X
22A 09-47-25-E3-373A1.0000 Lee Memorial Health System
Acute Care Hospital – 160 beds Shopping Center – 60,000sf Medical Office Building – 198,000sf General Office Building – 102,000sf
X 22B 09-47-25-E3-373A2.0000
22C 09-47-25-E3-373A3.0010

Coconut Road Traffic Study – March 2016 DRAFT
Trebilcock Consulting Solutions, PA P a g e | 16
Fig. 3 – Coconut Road Development Potential Map
The trip generation for the potential development influencing Coconut Road was
determined by referencing the Institute of Transportation Engineer’s (ITE) report, titled Trip
Generation Manual, the most current edition (9th Edition). The software program OTISS
(Online Traffic Impact Study Software, Version 4.0.1) is used to create the raw unadjusted
trip generation for the project. The ITE – OTISS trip generation – period analysis reports are
provided in Appendix J: Potential Development – ITE Period Analysis Reports. A summary
of the estimated trip generation for potential development along Coconut Road is
summarized in Tables 10A, 10B and 10C.
Coconut Road Traffic Study – March 2016 DRAFT
Trebilcock Consulting Solutions, PA P a g e | 17
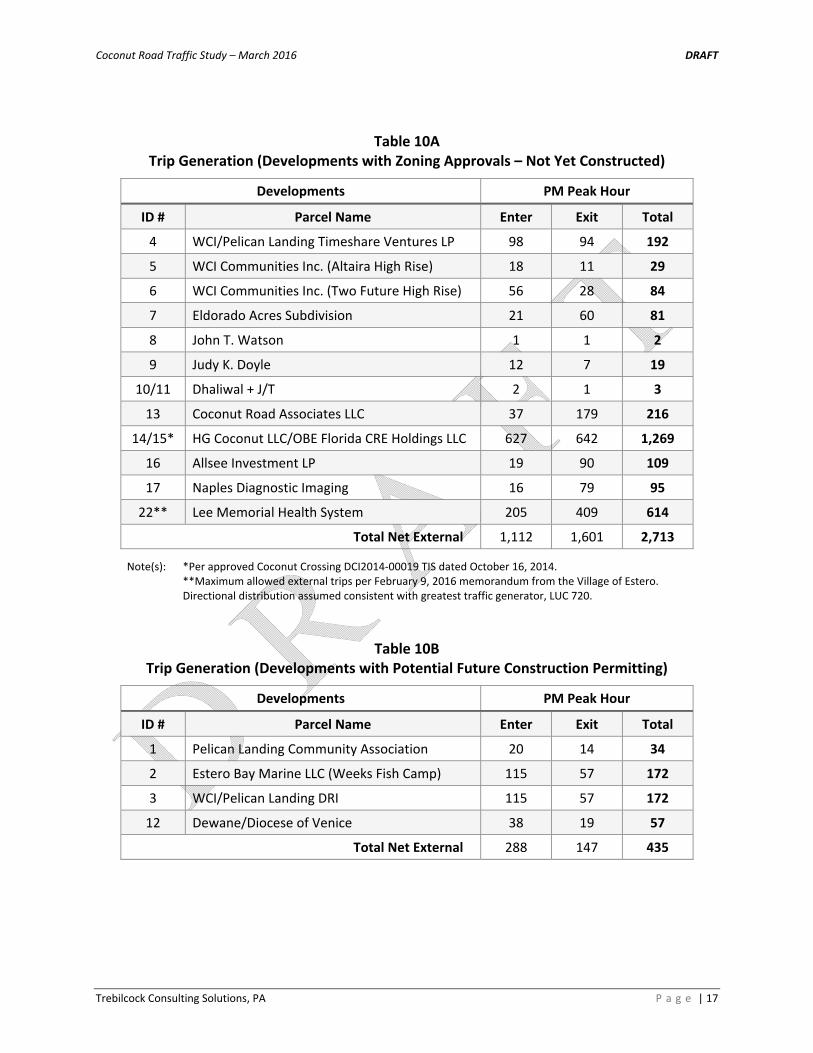
Table 10A Trip Generation (Developments with Zoning Approvals – Not Yet Constructed)
Developments PM Peak Hour
ID # Parcel Name Enter Exit Total
4 WCI/Pelican Landing Timeshare Ventures LP 98 94 192
5 WCI Communities Inc. (Altaira High Rise) 18 11 29
6 WCI Communities Inc. (Two Future High Rise) 56 28 84
7 Eldorado Acres Subdivision 21 60 81
8 John T. Watson 1 1 2
9 Judy K. Doyle 12 7 19
10/11 Dhaliwal + J/T 2 1 3
13 Coconut Road Associates LLC 37 179 216
14/15* HG Coconut LLC/OBE Florida CRE Holdings LLC 627 642 1,269
16 Allsee Investment LP 19 90 109
17 Naples Diagnostic Imaging 16 79 95
22** Lee Memorial Health System 205 409 614
Total Net External 1,112 1,601 2,713
Note(s): *Per approved Coconut Crossing DCI2014‐00019 TIS dated October 16, 2014. **Maximum allowed external trips per February 9, 2016 memorandum from the Village of Estero. Directional distribution assumed consistent with greatest traffic generator, LUC 720.
Table 10B Trip Generation (Developments with Potential Future Construction Permitting)
Developments PM Peak Hour
ID # Parcel Name Enter Exit Total
1 Pelican Landing Community Association 20 14 34
2 Estero Bay Marine LLC (Weeks Fish Camp) 115 57 172
3 WCI/Pelican Landing DRI 115 57 172
12 Dewane/Diocese of Venice 38 19 57
Total Net External 288 147 435

Coconut Road Traffic Study – March 2016 DRAFT
Trebilcock Consulting Solutions, PA P a g e | 18
Table 10C Trip Generation (Total Future Projected Development Potential)
Developments PM Peak Hour
Enter Exit Total
Zoning Approvals – Not Yet Constructed 1,112 1,601 2,713
Potential Future Construction Permitting 288 147 435
Total Net External 1,400 1,748 3,148
Projected traffic generated by the future potential development is assigned to the Coconut
Road segments using the knowledge of the area, associated approved traffic impact
statements, and as coordinated with Village of Estero Transportation Planning staff.
The assignment of proposed trip distribution is illustrated consistent with the peak hour,
peak direction as shown in Tables 11A, 11B and 11C.

Coconut Road Traffic Study – March 2016 DRAFT
Trebilcock Consulting Solutions, PA P a g e | 19
Table 11A Traffic Distribution* ‐ Developments with Zoning Approvals – Not Yet Constructed
Note(s): *Peak hour, peak direction traffic volumes are Bold and Underlined as applicable.
ID # Parcel Name
Traffic Dist. %
Spring Creek to US 41
Traffic Dist. %
US 41 to Via Coconut Point
Traffic Dist. %
Via Coconut Point to Three Oaks
Parkway
Enter Exit Enter Exit
Enter Exit
4 WCI/Pelican Landing Timeshare Ventures
LP 100%
WB‐98 EB‐94 25%
WB‐25 EB‐24 20%
WB‐20 EB‐19
5 WCI Communities Inc. (Altaira High
Rise) 100%
WB‐18 EB‐11 20%
WB‐4 EB‐2 15%
WB‐3 EB‐2
6 WCI Communities
Inc. (Two Future High Rise)
100% WB‐56 EB‐28
20% WB‐11 EB‐6
15% WB‐8 EB‐4
7 Eldorado Acres Subdivision 100% WB‐21 EB‐60 20% WB‐4 EB‐12 15% WB‐3 EB‐9
8 John T. Watson 100% WB‐1 EB‐1 20% WB‐0 EB‐0 15% WB‐0 EB‐0
9 Judy K. Doyle 100% WB‐12 EB‐7 20% WB‐2 EB‐1 15% WB‐2 EB‐1
10/11
Dhaliwal + J/T 100% WB‐2 EB‐1 20% WB‐0 EB‐0 15% WB‐0 EB‐0
13 Coconut Road Associates LLC 75% WB‐28 EB‐134 20% WB‐7 EB‐36 15% WB‐6 EB‐27
14/15
HG Coconut LLC/OBE Florida CRE Holdings
LLC 20%
WB‐125 EB‐128 30%
WB‐188
EB‐193 25%
WB‐157 EB‐161
16 Allsee Investment LP 100% WB‐19 EB‐90 20% WB‐4 EB‐18 15% WB‐3 EB‐14
17 Naples Diagnostic
Imaging 100% WB‐16 EB‐79 20% WB‐3 EB‐16 15% WB‐2 EB‐12
22 Lee Memorial Health
System 20% EB‐41 WB‐82 25% EB‐51 WB‐102 20% EB‐41 WB‐82
Peak Direction Total EB – 674 EB – 359 EB – 290

Coconut Road Traffic Study – March 2016 DRAFT
Trebilcock Consulting Solutions, PA P a g e | 20
Table 11B Traffic Distribution* ‐ Developments with Potential Future Construction Permitting
Note(s): *Peak hour, peak direction traffic volumes are Bold and Underlined as applicable.
Table 11C Traffic Distribution* ‐ Total Future Projected Development Potential
Note(s): *Peak hour, peak direction traffic volumes are Bold and Underlined as applicable.
For the purpose of this report, estimated future Coconut Road demand is analyzed under
2021 and 2026 traffic conditions. Future projected background traffic volumes are
calculated based on historic growth rates calculated from annual counts illustrated in the
Lee County 2015 Traffic Count Report (as previously summarized in Table 8 – Coconut Road
– Historical Traffic Data).
A review of the historical traffic data indicates that the annual growth rate is negative for
the Coconut Road segments located east of US 41. As such, a minimum growth rate of one
percent (1%) was utilized for Coconut Road segments east of US 41.
For the purpose of this report, the future traffic growth for the Coconut Road segment
located west of US 41 is considered associated with the future projected development
Traffic Dist. %
Spring Creek to US 41
Traffic Dist. %
US 41 to Via Coconut Point
Traffic Dist. %
Via Coconut Point to Three Oaks Parkway
ID # Parcel Name Enter Exit Enter Exit
Enter Exit
1 Pelican Landing
Community Association 100% WB‐20 EB‐14
20% WB‐4 EB‐3
15% WB‐3 EB‐2
2 Estero Bay Marine LLC (Weeks Fish Camp) 100%
WB‐115 EB‐57 25%
WB‐29 EB‐14 20%
WB‐23 EB‐11
3 WCI/Pelican Landing
DRI 100% WB‐115 EB‐57 25% WB‐29 EB‐14 20% WB‐23 EB‐11
12 Dewane/Diocese of
Venice 100% WB‐38 EB‐19 20% WB‐8 EB‐4 15% WB‐8 EB‐3
Peak Direction Total EB – 147 EB – 35 EB –27
Coconut Road Development Potential
Spring Creek to US 41 US 41 to
Via Coconut Point Via Coconut Point to Three Oaks Parkway
Development Zoning Approvals
EB – 674 EB – 359 EB – 290
Development Potential Future Construction
Permitting EB – 147 EB – 35 EB – 27
Total Peak Hour Traffic Volume
EB – 821 EB – 394 EB – 317
Coconut Road Traffic Study – March 2016 DRAFT
Trebilcock Consulting Solutions, PA P a g e | 21
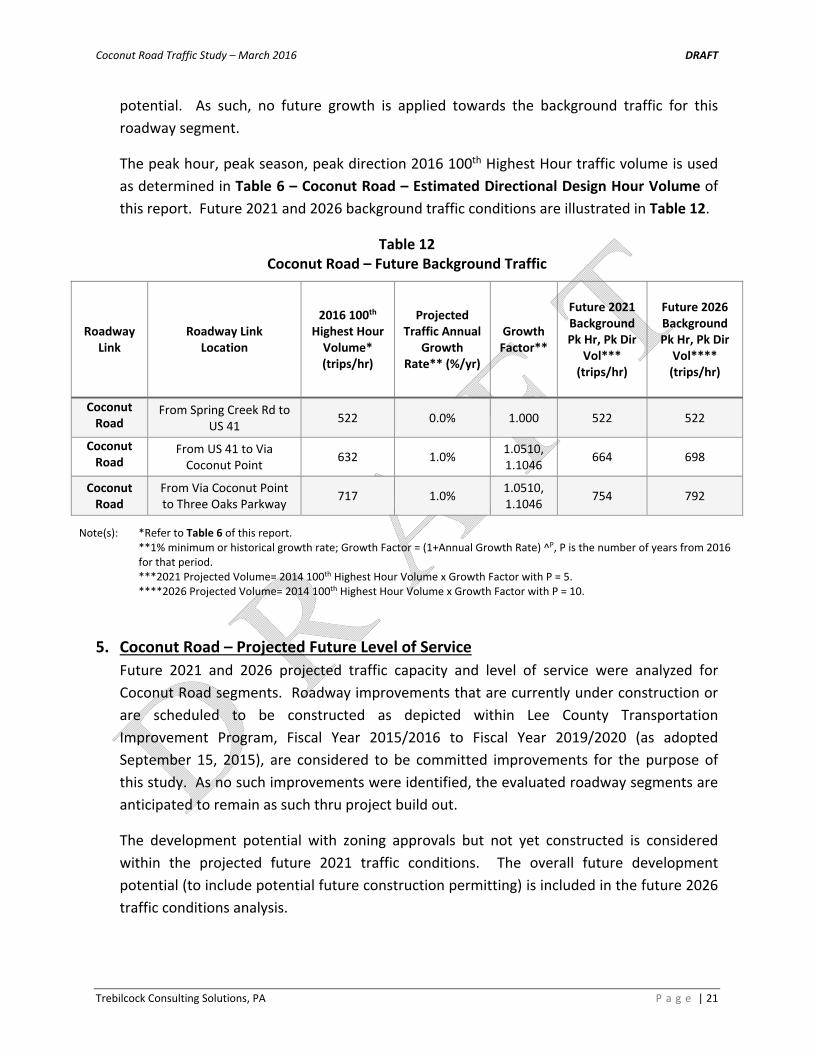
potential. As such, no future growth is applied towards the background traffic for this
roadway segment.
The peak hour, peak season, peak direction 2016 100th Highest Hour traffic volume is used
as determined in Table 6 – Coconut Road – Estimated Directional Design Hour Volume of
this report. Future 2021 and 2026 background traffic conditions are illustrated in Table 12.
Table 12 Coconut Road – Future Background Traffic
Roadway Link
Roadway Link Location
2016 100th Highest Hour Volume* (trips/hr)
Projected Traffic Annual
Growth Rate** (%/yr)
Growth Factor**
Future 2021 Background Pk Hr, Pk Dir
Vol*** (trips/hr)
Future 2026 Background Pk Hr, Pk Dir Vol**** (trips/hr)
Coconut Road
From Spring Creek Rd to US 41
522 0.0% 1.000 522 522
Coconut Road
From US 41 to Via Coconut Point
632 1.0% 1.0510, 1.1046
664 698
Coconut Road
From Via Coconut Point to Three Oaks Parkway
717 1.0% 1.0510, 1.1046
754 792
Note(s): *Refer to Table 6 of this report. **1% minimum or historical growth rate; Growth Factor = (1+Annual Growth Rate) ^P, P is the number of years from 2016 for that period. ***2021 Projected Volume= 2014 100th Highest Hour Volume x Growth Factor with P = 5. ****2026 Projected Volume= 2014 100th Highest Hour Volume x Growth Factor with P = 10.
5. Coconut Road – Projected Future Level of Service Future 2021 and 2026 projected traffic capacity and level of service were analyzed for
Coconut Road segments. Roadway improvements that are currently under construction or
are scheduled to be constructed as depicted within Lee County Transportation
Improvement Program, Fiscal Year 2015/2016 to Fiscal Year 2019/2020 (as adopted
September 15, 2015), are considered to be committed improvements for the purpose of
this study. As no such improvements were identified, the evaluated roadway segments are
anticipated to remain as such thru project build out.
The development potential with zoning approvals but not yet constructed is considered
within the projected future 2021 traffic conditions. The overall future development
potential (to include potential future construction permitting) is included in the future 2026
traffic conditions analysis.

Coconut Road Traffic Study – March 2016 DRAFT
Trebilcock Consulting Solutions, PA P a g e | 22
The estimated future 2021 and 2026 peak season, peak hour, peak direction traffic volumes
were compared to the to the Level of Service thresholds volumes obtained from 2015 Lee
County Concurrency Report and the Lee County Generalized Peak‐Hour Directional Service
Values. The future projected LOS for Coconut Road segments are reflected in Table 13 and
Table 14.
Table 13 Coconut Road – Estimated Future 2021 LOS
Table 14 Coconut Road – Estimated Future 2026 LOS
Based upon the results illustrated in the level of service analysis, the Coconut Road segment
located west of US 41 is anticipated to be overcapacity in the year 2021 and 2026 future
conditions. All other analyzed segments are projected to operate within the adopted level
of service standard at future conditions.
Coconut Road Traffic Study – March 2016 DRAFT
Trebilcock Consulting Solutions, PA P a g e | 23
Coconut Road – Segment west of US 41 – No build Alternative
This option would maintain the existing two‐lane geometry for the entire section of
Coconut Road, west of US 41. As more developments may be approved for
construction as shown within this report, significant congestion and delays will
increase with generated traffic along this roadway segment.
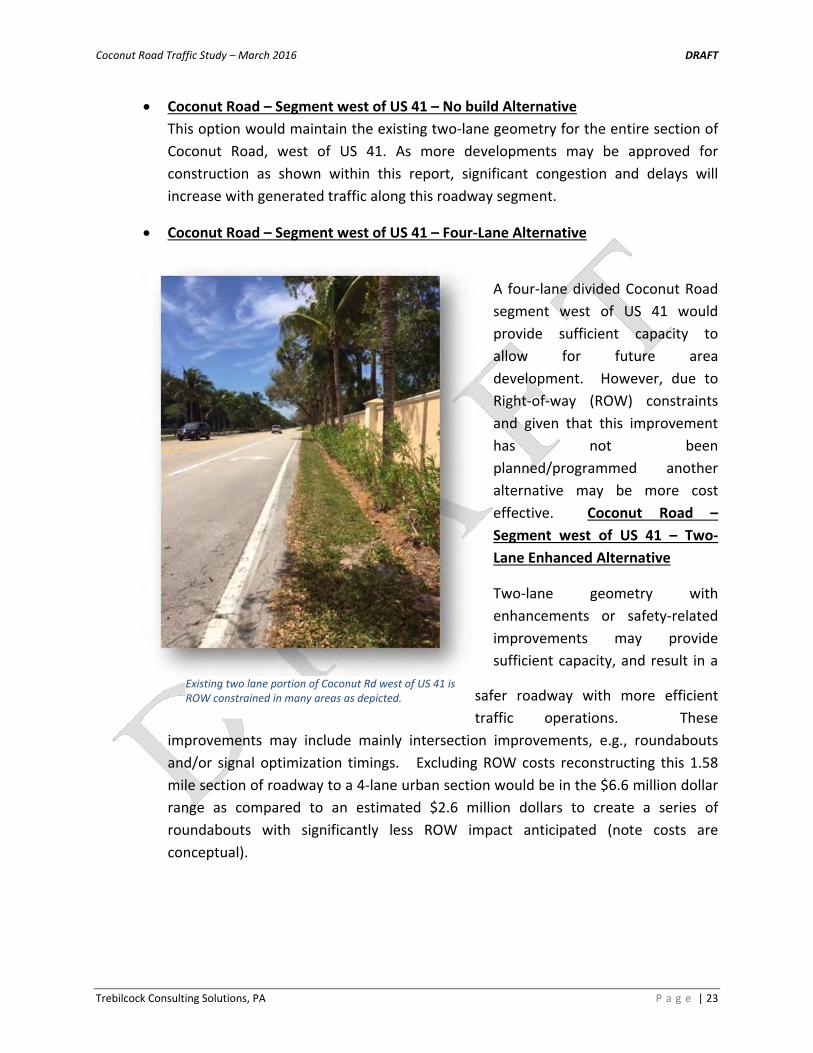
Coconut Road – Segment west of US 41 – Four‐Lane Alternative
A four‐lane divided Coconut Road
segment west of US 41 would
provide sufficient capacity to
allow for future area
development. However, due to
Right‐of‐way (ROW) constraints
and given that this improvement
has not been
planned/programmed another
alternative may be more cost
effective. Coconut Road –
Segment west of US 41 – Two‐
Lane Enhanced Alternative
Two‐lane geometry with
enhancements or safety‐related
improvements may provide
sufficient capacity, and result in a
safer roadway with more efficient
traffic operations. These
improvements may include mainly intersection improvements, e.g., roundabouts
and/or signal optimization timings. Excluding ROW costs reconstructing this 1.58
mile section of roadway to a 4‐lane urban section would be in the $6.6 million dollar
range as compared to an estimated $2.6 million dollars to create a series of
roundabouts with significantly less ROW impact anticipated (note costs are
conceptual).
Existing two lane portion of Coconut Rd west of US 41 is ROW constrained in many areas as depicted.

Coconut Road Traffic Study – March 2016 DRAFT
Trebilcock Consulting Solutions, PA P a g e | 24
Over the past several years, roundabouts have become more popular for
intersection solutions as they offer several advantages over other traffic controls,
they may cost less to install, can accommodate a series of U‐turns and left‐turn lanes
and reduce delay. They may have lower operation and maintenance costs as
compared to signal alternatives. Roundabouts can improve safety by simplifying
conflicts, reducing vehicle speeds and providing a clearer indication of the driver’s
right‐of way compared to other forms of channelization. They also provide an
opportunity to improve aesthetics of an intersection with landscaping in connection
with community enhancement projects. Roundabouts are particularly suited at
intersections on local roads where it is not desirable to give priority to either road or
where overall traffic calming is desired, or needed.
It is our recommendation that a series of roundabouts along this segment should be
considered for the roadway west of US 41.

Coconut Road Traffic Study – March 2016 DRAFT
Trebilcock Consulting Solutions, PA P a g e | 25
CoconutRoadandUS41IntersectionAnalysis
1. Existing 2016 Conditions
The intersection of US 41 and Coconut Road is a major four‐legged signalized intersection.
For the purpose of this report, US 41 is considered as the Major Street, while Coconut Road
is analyzed as the Minor Street.
US 41 (SR 45) is a principal arterial roadway which runs generally north‐south and provides
connectivity to Naples to the south and Fort Myers to the north. At this location, its typical
cross section is a suburban six‐lane divided roadway with dedicated bicycle lanes , curbed
median and a paved shoulder (not curbed). The posted legal speed limit is 50 mph in the
vicinity of the intersection.
The north approach has three (3) through lanes, one (1) right‐turn lane and double
dedicated left turn lanes. The south approach has three (3) through lanes, one (1)
dedicated left‐turn lane and one (1) right turn lane.
Sidewalks are provided on both sides of the roadway. There are overhead power lines
along the west side of the roadway. Intersection street lighting is provided.
Coconut Road is a major collector roadway. The west approach is a curb and gutter facility
with a closed drainage system and no dedicated bicycle lanes. The posted legal speed limit
for this approach is 40 mph in the vicinity of the intersection. The east approach typical
cross section is a four‐lane divided roadway with dedicated bicycle lanes, curb and gutter,
and a closed drainage system. The posted legal speed limit for this approach is 45 mph in
the vicinity of the intersection.
The west approach has one through lane, one right‐turn lane and double dedicated left‐turn
lanes. The east approach has one through lane, one right‐turn lane and double dedicated
left‐turn lanes.
Sidewalks are provided on both sides of the roadway on the west approach, and on the
south side for the east approach. There are overhead power lines along the south side of
the roadway on the west approach.
The existing intersection lane configuration is illustrated in Fig. 4.

Coconut Road Traffic Study – March 2016 DRAFT
Trebilcock Consulting Solutions, PA P a g e | 26
Fig. 4 – Existing Intersection Lane Configuration
2. Intersection Turning Movement Traffic Volumes
For the purpose of this study, turning movement counts for the intersection were
conducted on‐site on Wednesday, January 27, 2016, from 7AM to 9AM, and from 4PM to
6PM.
Traffic count data is adjusted for peak season by applying a peak season conversion factor
to the turning movements. Peak Season Conversion Factor (PSCF) is extracted from the
latest published FDOT Peak Season Factor Category Report as shown in Appendix G: 2014
FDOT Peak Season Factor Category Report (Excerpt).
For the purpose of this report, intersection operational analysis was completed following
three scenarios: (1) Existing 2016 Conditions; (2) Future 2021 background conditions plus
estimated development potential with zoning approvals not yet constructed; and (3) Future
2026 background conditions plus estimated future development potential (to include
potential future construction permitting).

Coconut Road Traffic Study – March 2016 DRAFT
Trebilcock Consulting Solutions, PA P a g e | 27
In addition, the future traffic growth for the Coconut Road segment located west of US 41 is
considered associated with the future projected development potential. As such, no future
growth is applied towards the background traffic for this roadway segment.
The historical traffic data was obtained from the 2015 Lee County Traffic Count Report
(excerpts are included in Appendix E) and it was previously analyzed in this report (refer to
Table 8). A review of the historical traffic data indicates that the annual growth rate is
negative for US 41 and Coconut Road, for the segment located east of US 41. As
coordinated with Village of Estero Transportation staff, a minimum growth rate of one
percent (1%) was utilized for the Coconut Road segment east of US 41.
The exponential growth formula was implemented to calculate future traffic volumes for
the intersection, as follows: F = P x (1+r)n where: F = future volume; P = base year traffic
volume; r = growth rate percentage; n = number of years from the base year.
A summary of the intersection turning movement count for peak season 2016 existing
conditions is illustrated in Fig. 5A and Fig. 5B.

Coconut Road Traffic Study – March 2016 DRAFT
Trebilcock Consulting Solutions, PA P a g e | 28
Fig. 5A – Intersection Count Summary – Existing 2016 Conditions – AM Peak Hour

Coconut Road Traffic Study – March 2016 DRAFT
Trebilcock Consulting Solutions, PA P a g e | 29
Fig. 5B – Intersection Count Summary – Existing 2016 Conditions – PM Peak Hour
Coconut Road Traffic Study – March 2016 DRAFT
Trebilcock Consulting Solutions, PA P a g e | 30
Based on the traffic count data, the AM and PM peak hours for the intersection are
determined to be 7.45 – 8.45 AM, and 4.15 – 5.15 PM, respectively.
Peak hour factor (PHF) is the hourly volume during the peak hour divided by the peak
15‐min flow rate within the peak hour Highway Capacity Manual 2010 (HCM 2010). As
illustrated in the 2014 FDOT Project Traffic Forecasting Handbook, PHF is a measure of
traffic demand fluctuation within the analysis design hour. For the purpose of this analysis,
PHF is determined to be 0.98 for AM and PM peak hour.
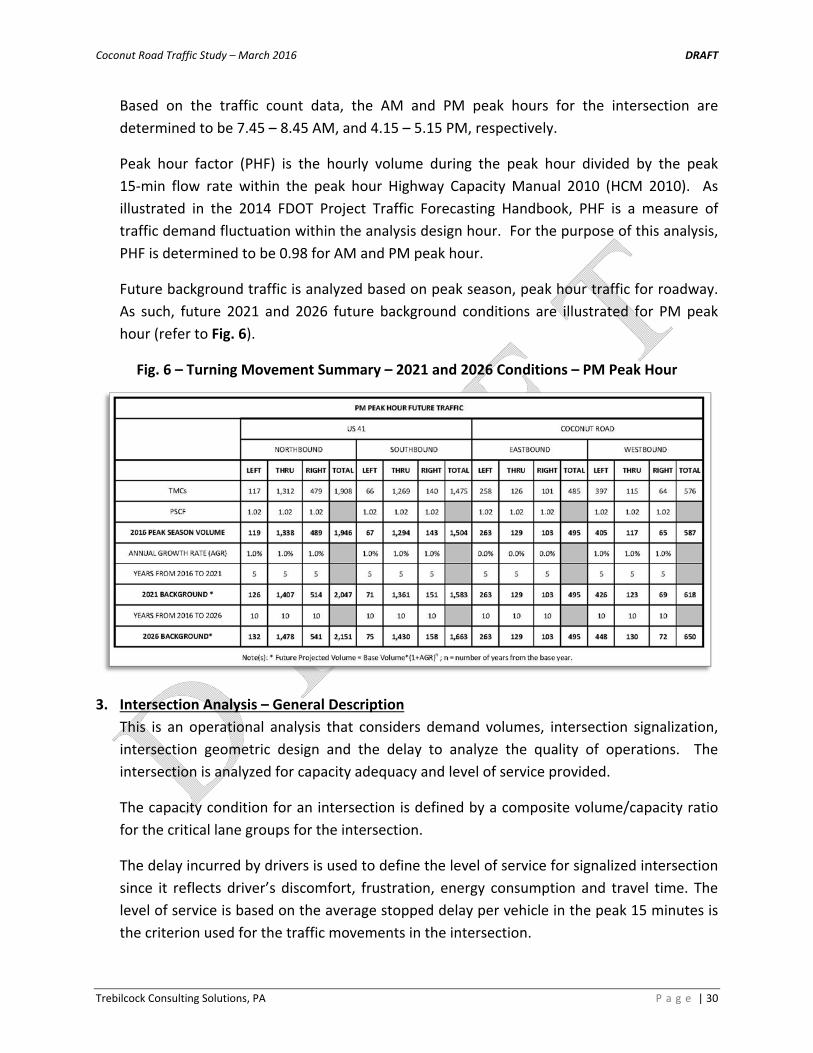
Future background traffic is analyzed based on peak season, peak hour traffic for roadway.
As such, future 2021 and 2026 future background conditions are illustrated for PM peak
hour (refer to Fig. 6).
Fig. 6 – Turning Movement Summary – 2021 and 2026 Conditions – PM Peak Hour
3. Intersection Analysis – General Description
This is an operational analysis that considers demand volumes, intersection signalization,
intersection geometric design and the delay to analyze the quality of operations. The
intersection is analyzed for capacity adequacy and level of service provided.
The capacity condition for an intersection is defined by a composite volume/capacity ratio
for the critical lane groups for the intersection.
The delay incurred by drivers is used to define the level of service for signalized intersection
since it reflects driver’s discomfort, frustration, energy consumption and travel time. The
level of service is based on the average stopped delay per vehicle in the peak 15 minutes is
the criterion used for the traffic movements in the intersection.

Coconut Road Traffic Study – March 2016 DRAFT
Trebilcock Consulting Solutions, PA P a g e | 31
Turn lanes are used at intersections to accommodate speed changes and maneuvering of
turning traffic, and to increase capacity through an intersection. The length of turn lanes
consists of deceleration length (to include entering taper) and storage length. Turn lanes
should comply with FDOT Design Standards, Index 301 to the extent practical. The available
queue length provided should be based on a traffic study.
The blockage of the turning traffic by the through vehicles should be avoided.
Left Turn Lanes
Left turn lanes are probably the single item having the most influence on
intersection operations. Intersection capacity analysis procedures (as consistent
with the most current Highway Capacity Manual – HCM) are used to determine the
number and use of the left turn lanes.
In agreement with FDOT Plan Preparation Manual (PPM), Volume 1, where left turn
volumes exceed 300 vehicles per hour (vph), a double left‐turn lane should be
considered. Fully protected signal phasing is required for double left turns.
Right Turn Lanes
Exclusive right‐turn lanes are less critical in terms of safety than left‐turn lanes. As
illustrated in FDOT Plan Preparation Manual (PPM), Volume 1, right‐turns are
generally made more efficient than left‐turns. Right‐turn storage lanes should be
considered when right‐turn volume exceeds 300 vph and the adjacent through
volume also exceeds 300 vehicles per hour per lane (vphpl).
Right‐turn lanes can significantly improve the level of service of signalized
intersection by providing means of deceleration and stacking for right turn traffic.
4. Level of Service Analysis
An assessment of the level of service (LOS) of the analyzed intersection was conducted
based on existing (current 2016) traffic conditions, future year 2021 (to account for
estimated development potential with zoning approvals not yet constructed) and future
year 2026 (to include potential future construction permitting).
The intersection was analyzed for Level of Service (LOS) using the Highway Capacity
Software 2010 (HCS 2010) computer modeling software, most current version (Release
6.80). The HCS 2010 analyzes signalized intersections by implementing the HCM 2010
procedures.
According to HCM 2010, the level of service criterion for signalized intersections is shown in
Table 15.

Coconut Road Traffic Study – March 2016 DRAFT
Trebilcock Consulting Solutions, PA P a g e | 32
Table 15 Level of Service for Signalized Intersections
The HCS 2010 percent heavy vehicle is assumed the design hour truck (DHT) – the percent
of trucks expected to use the roadway segment during the design hour of the design year.
DHT is determined as half of T24 (annual 24‐hour percentage of trucks), as illustrated in
2014 FDOT Project Traffic Forecasting Handbook. The T24 factor was extracted from FDOT
Florida Traffic Online (T24 = 3.1 for all approaches) and illustrated in Appendix K: FDOT
Traffic Online – T24 Factors. Conservatively, a 2% heavy vehicle factor was assumed for all
movements for the purpose of this analysis.
The existing signal timings/ phasing as obtained from Lee County Department of
Transportation was utilized in this analysis. The approved signalization plan, signal pattern
plan and signal timing plan are illustrated in Appendix L: Lee County – Intersection Signal
Data.
The level of service standard for Coconut Road and US 41 is E, as illustrated in the Lee
County Concurrency Report. Each approach was analyzed to ensure that vehicles do not
experience excessive delay.
The results of the traffic HCS 2010 intersection analysis for Existing 2016 Conditions, Future
2021 background conditions plus estimated development potential with zoning approvals
not yet constructed, and Future 2026 background conditions plus estimated future
development potential (to include potential future construction permitting) are summarized
in Table 13A, Table 13B and Table 13C. Based on the existing 2016 conditions data, the
weekday PM peak hour had higher intersection volumes than the weekday AM peak hour.

Coconut Road Traffic Study – March 2016 DRAFT
Trebilcock Consulting Solutions, PA P a g e | 33
As such, the PM peak hour characteristics were selected for use in establishing the future
background weekday design hour traffic.
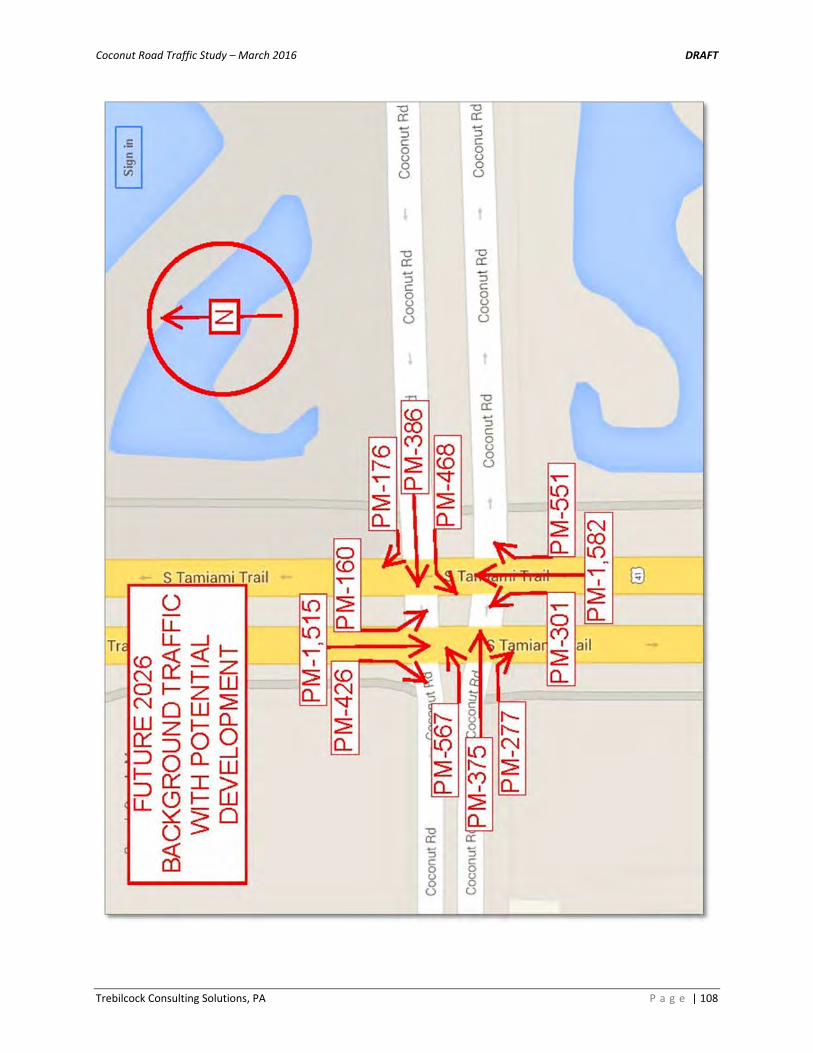
Future background traffic with potential development is illustrated in Fig. 7.
Fig. 7 – 2021 and 2026 Background Traffic with Potential Development – PM Peak Hour
The HCS intersection worksheets and future projected total traffic are provided in Appendix
M: Intersection Analysis – HCS 2010 Printouts.
Table 13A Intersection LOS – Existing 2016 Traffic
Intersection Configuration
EB Approach Delay*/LOS
WB Approach Delay*/LOS
NB Approach Delay*/LOS
SB Approach Delay*/LOS
Overall Delay*/LOS
AM Peak Hour
Existing 2016 63.7/E 64.8/E 24.2/C 32.8/C 37.7/D
PM Peak Hour
Existing 2016 85.7/F 85.0/F 24.3/C 22.7/C 38.4/D
NOTE(S) *Approach Delay in s/veh.

Coconut Road Traffic Study – March 2016 DRAFT
Trebilcock Consulting Solutions, PA P a g e | 34
Table 13B Intersection LOS – Future Background Traffic
Intersection Configuration
EB Approach Delay*/LOS
WB Approach Delay*/LOS
NB Approach Delay*/LOS
SB Approach Delay*/LOS
Overall Delay*/LOS
PM Peak Hour
Future 2021 85.4/F 85.3/F 25.4/C 24.0/C 39.0/D
PM Peak Hour
Future 2026 85.4/F 85.8/F 26.6/C 25.5/C 39.9/D
NOTE(S) *Approach Delay in s/veh.
Table 13C Intersection LOS – Future Background with Potential Development Traffic
Intersection Configuration
EB Approach Delay*/LOS
WB Approach Delay*/LOS
NB Approach Delay*/LOS
SB Approach Delay*/LOS
Overall Delay*/LOS
PM Peak Hour
Future 2021 156.9/F 148.4/F 49.6/D 40.2/D 80.3/F
PM Peak Hour
Future 2026 219.5/F 209.9/F 68.0/E 41.3/D 108.5/F
NOTE(S) *Approach Delay in s/veh.
The intersection HCS 2010 analysis for the existing 2016 conditions shows that eastbound
and westbound approaches operate at Level of Service (LOS) F. In addition, the overall
intersection background traffic will exhibit an acceptable LOS D for future 2026 conditions.
The intersection HCS 2010 analysis for future 2021 and 2026 conditions with projected
potential development shows an overall intersection LOS F. As illustrated in Appendix M,
queue spillover from turn lanes is present (Queue Storage Ratio exceeds 1.0). Additionally,
the extended queue generated from downstream intersections can spill back into the
upstream intersection and diminish the performance of the upstream treatment. This
phenomenon is frequently observed in large urban areas where the traffic volume is heavy,
intersection spacing is short and cycle length is long. As such, intersection treatments such
as adding/extending turning lanes, turning movement restrictions that are traditionally
applied to improve intersection capacity may not realize the expected benefits of relieving
congestion and reducing delay.

Coconut Road Traffic Study – March 2016 DRAFT
Trebilcock Consulting Solutions, PA P a g e | 35
5. Volume to Capacity Ratio Analysis
Failure of an intersection is also dependent on the volume over capacity ratio (v/c) being
greater than the value of 1 on any approach of the intersection. The outputs provided by
HCS (refer to Appendix M: Intersection Analysis – HCS 2010 Printouts) include volume
over capacity ratios for each approach. The results of the traffic HCS 2010 volume over
capacity analysis for Existing 2016 Conditions, Future 2021 background conditions plus
estimated development potential with zoning approvals not yet constructed, and Future
2026 background conditions plus estimated future development potential (to include
potential future construction permitting) are summarized in Table 14A, Table 14B and
Table 14C.
Table 14A Intersection V/C Ratio – Existing 2016 Traffic
Intersection Configuration
EB Approach V/C Ratio
WB Approach V/C Ratio
NB Approach V/C Ratio
SB Approach V/C Ratio
AM Peak Hour
Existing 2016 LT – 0.753 TH – 0.484 RT – 0.840
LT – 0.899 TH – 0.370 RT – 0.208
LT – 0.796 TH – 0.374 RT – 0.271
LT – 0.436 TH – 0.837 RT – 0.265
PM Peak Hour
Existing 2016 LT – 0.864 TH – 0.837 RT – 0.773
LT – 0.902 TH – 0.620 RT – 0.406
LT – 0.861 TH – 0.440 RT – 0.563
LT – 0.528 TH – 0.435 RT – 0.154
Table 14B Intersection v/c ratio – Future Background Traffic
Intersection Configuration
EB Approach V/C Ratio
WB Approach V/C Ratio
NB Approach V/C Ratio
SB Approach V/C Ratio
PM Peak Hour
Future 2021 LT – 0.862 TH – 0.836 RT – 0.773
LT – 0.907 TH – 0.607 RT – 0.402
LT – 0.868 TH – 0.467 RT – 0.598
LT – 0.556 TH – 0.465 RT – 0.166
PM Peak Hour
Future 2026 LT – 0.862 TH – 0.836 RT – 0.773
LT – 0.912 TH – 0.607 RT – 0.397
LT – 0.873 TH – 0.496 RT – 0.636
LT – 0.584 TH – 0.497 RT – 0.177
Coconut Road Traffic Study – March 2016 DRAFT
Trebilcock Consulting Solutions, PA P a g e | 36
Table 14C Intersection v/c ratio – Future Background with Potential Development Traffic
Intersection Configuration
EB Approach V/C Ratio
WB Approach V/C Ratio
NB Approach V/C Ratio
SB Approach V/C Ratio
PM Peak Hour
Future 2021 LT – 1.031 TH – 1.251 RT – 1.016
LT – 0.912 TH – 1.332 RT – 0.883
LT – 1.156 TH – 0.588 RT – 0.714
LT – 0.813 TH – 0.602 RT – 0.396
PM Peak Hour
Future 2026 LT – 1.163 TH – 1.445 RT – 1.235
LT – 0.917 TH – 1.669 RT – 0.898
LT – 1.449 TH – 0.616 RT – 0.752
LT – 0.820 TH – 0.631 RT – 0.570
The threshold value of failure for the background traffic volume over capacity ratio (V/C) is
not exceeded by any of the scenario years for the intersection.
However, the threshold (V/C) value is exceeded under future 2021 and 2026 traffic
conditions when potential development is considered.
6. Intersection Alternatives
Based on the HCS analysis performed for future projected traffic conditions, a significant
increase in vehicle delay is expected and one or more pf the following conditions are
expected to occur: thru vehicle queues extend back and block access to exclusive left‐turn
and right‐turn lanes, left‐turn and right‐turn vehicle queues extend back and spill over into
the adjacent thru lanes, and vehicles require more than one signal cycle to clear the
intersection.
Signal retiming and intersection geometric improvements are recommended to promote
safety, decreased vehicle delay and sufficient capacity.
To support future general growth in the area and to provide for improved intersection
operations a number of intersection improvements are recommended as follows:
intersection signal retiming; on Coconut Road – extend eastbound right‐turn lane and
extend westbound dual left‐turn lanes; on US 41 (SR 45) – extend southbound right‐turn
lane and provide northbound dual left‐turn lanes.
Additional HCS 2010 analyses were conducted to illustrate potential benefits that would be
achieved with these improvements. The HCS intersection worksheets and future projected
total traffic are provided in Appendix N: Intersection Alternative – HCS 2010 Analysis.

Coconut Road Traffic Study – March 2016 DRAFT
Trebilcock Consulting Solutions, PA P a g e | 37
The HCS 2010 analysis for year 2026 potential future conditions shows that all approaches
operate at Level of Service (LOS) E or better. In addition, all movements exhibit a volume over
capacity ratio less than 1.0 for future 2026 estimated traffic.
The results of the traffic HCS 2010 intersection analysis for future 2021 and 2026 estimated
overall traffic are summarized in Table 15A and Table 15B.
Table 15A Intersection LOS – Potential Alternative
Intersection Configuration
EB Approach Delay*/LOS
WB Approach Delay*/LOS
NB Approach Delay*/LOS
SB Approach Delay*/LOS
Overall Delay*/LOS
PM Peak Hour
Future 2021 61.6/E 61.3/E 43.2/D 39.4/D 48.0/D
PM Peak Hour
Future 2026 59.0/E 63.9/E 56.4/E 51.5/D 56.5/E
NOTE(S) *Approach Delay in s/veh.
Table 15B Intersection v/c ratio – Potential Alternative
Intersection Configuration
EB Approach V/C Ratio
WB Approach V/C Ratio
NB Approach V/C Ratio
SB Approach V/C Ratio
PM Peak Hour
Future 2021 LT – 0.900 TH – 0.800 RT – 0.475
LT – 0.892 TH – 0.921 RT – 0.461
LT – 0.834 TH – 0.732 RT – 0.655
LT – 0.775 TH – 0.691 RT – 0.323
PM Peak Hour
Future 2026 LT – 0.910 TH – 0.716 RT – 0.449
LT – 0.896 TH – 0.937 RT – 0.397
LT – 0.859 TH – 0.902 RT – 0.765
LT – 0.781 TH – 0.895 RT – 0.524

Coconut Road Traffic Study – March 2016 DRAFT
Trebilcock Consulting Solutions, PA P a g e | 38
CoconutRoad–SafetyReview
West of US 41
Accident data was supplied by Lee County Transportation staff for the corridor between the
west end of Coconut Road, east to Walden Center Drive. The data covers a four year period
(12/31/2011 thru 11/13/2015) of accident report information from the Lee County Sheriff’s
office and Florida Highway Patrol. During this time there were 11 crashes reported. None were
fatal. Four of the crashes occurred at night. Weather conditions were clear for 10 of the 11
crashes. Two of the 11 crashes involved possible injuries. None of the accidents involved bikes,
motorcycles, pedestrians, intoxication, speeding, loss of control. Five of the crashes involved
aggressive driving, two involved distracted driving. One was an angle collision, two were left
turn crashes, one was a head on, one involved a heavy truck, one and involved a teen. None of
the accidents required an access management review. The table below provides a summary of
the crash locations during the reported period. Based on the crash data there does not appear
to be any significant crash conditions along the west corridor. Additional crash detail can be
found in Appendix O.

Coconut Road Traffic Study – March 2016 DRAFT
Trebilcock Consulting Solutions, PA P a g e | 39
East of US 41
Accident data was supplied by Lee County Transportation staff for the corridor between US 41,
east to Three Oaks Parkway. The data covers a three year period (1/1/2013 thru 12/30/2015)
of accident report information from the Lee County Sheriff’s office and Florida Highway Patrol.
During this time there were fifty crashes reported, which is nearly six times more than the west
section of the corridor for the same period of time. None were fatal. Eight of the crashes
occurred at night. Weather conditions were clear for twenty‐nine of the fifty crashes. Six of
the fifty crashes involved possible injuries. One crash involved a bicycle. Two crashed involved
a motorcycle. Fives crashes involved speeding, or driving too fast for conditions. Two crashes
involved pedestrians. None of the accidents involved intoxication, or loss of control. Sixteen of
the crashes involved aggressive driving, six involved distracted driving. Eleven were angle
collisions, ten were left turn crashes, two a head on, three involved a heavy truck, and ten
involved a teen. None of the accidents required an access management review. The following
table provides a summary of the crash locations during the reported period. Based on the crash
data provided, there does not appear to be any particular systemic crash conditions along the
east corridor. Additional crash detail can be found in Appendix P. No crash is provided for the
intersection of US 41 and Coconut Road, which is a signalized intersection.

Coconut Road Traffic Study – March 2016 DRAFT
Trebilcock Consulting Solutions, PA P a g e | 40

Coconut Road Traffic Study – March 2016 DRAFT
Trebilcock Consulting Solutions, PA P a g e | 41
ConclusionsandRecommendations
The main objective of this traffic study is to evaluate engineering data, document information,
and to determine if there are improvement needs for Coconut Road future traffic conditions.
Once forecasts were developed, a roadway segment analyses was performed for future 2021
and 2026 conditions. The Level of Service E standard was utilized as a screening method to
evaluate whether a roadway segment was deficient for the future condition. Based upon the
results illustrated in corridor segment level of service analysis, the Coconut Road segment
located west of US 41 is anticipated to be over capacity in the year 2021 and 2026 future
conditions. All other analyzed segments are projected to the adopted level of service standard
at future conditions.
A significant benefit to overall mobility on Coconut Road west of US 41 is provided by a series of
roundabouts along this segment. We would recommend analyzing this option as a way to meet
the future buildout along this corridor.
The operational analyses completed for the intersection of Coconut Road and US 41 indicates
the need for future intersection improvements to accommodate future volume growth. These
improvements include turn lane extensions on Coconut Rd/US 41 and a dual northbound left on
US 41.
To provide adequate operations through the 2026 future traffic conditions, new intersection
lane configuration and signal retiming are recommended to produce lower delays, sufficient
capacity and acceptable level of service.

Coconut Road Traffic Study – March 2016 DRAFT
Trebilcock Consulting Solutions, PA P a g e | 42
AppendixA:LeeCountyDOTFunctionalClassification(2 Sheets)

Coconut Road Traffic Study – March 2016 DRAFT
Trebilcock Consulting Solutions, PA P a g e | 43

Coconut Road Traffic Study – March 2016 DRAFT
Trebilcock Consulting Solutions, PA P a g e | 44

Coconut Road Traffic Study – March 2016 DRAFT
Trebilcock Consulting Solutions, PA P a g e | 45
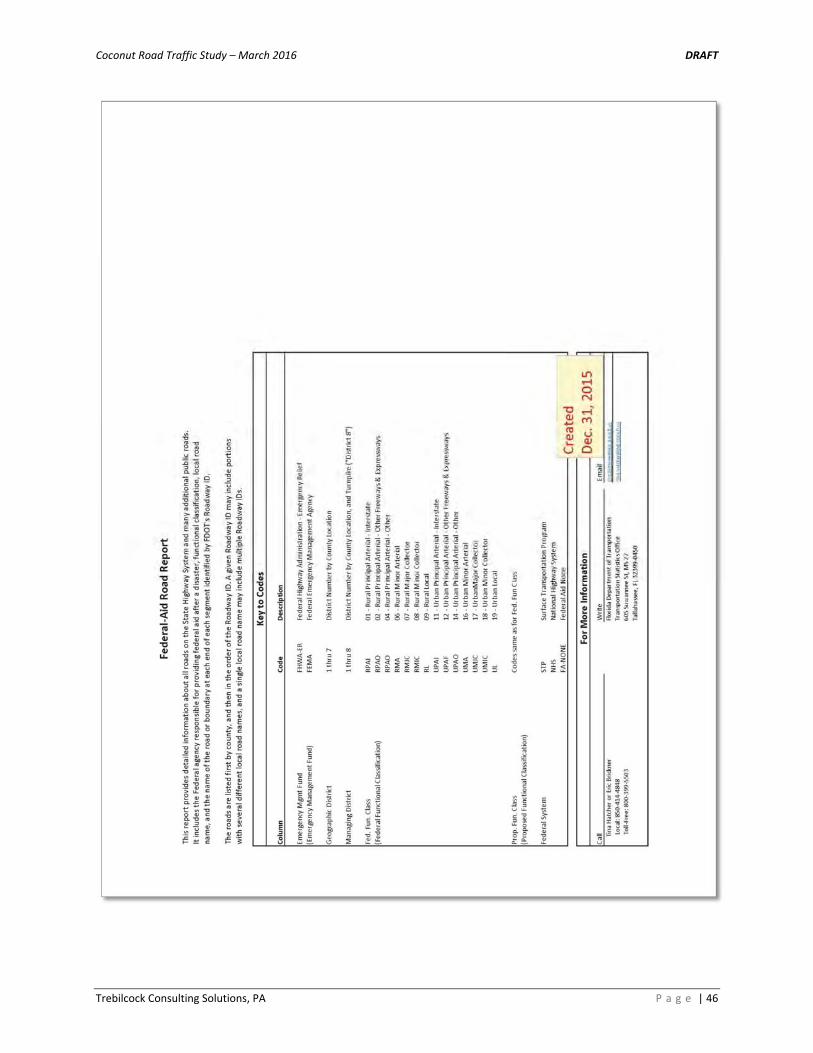
AppendixB:FDOTFederal‐AidReport(Excerpts)(3 Sheets)
Coconut Road Traffic Study – March 2016 DRAFT
Trebilcock Consulting Solutions, PA P a g e | 46

Coconut Road Traffic Study – March 2016 DRAFT
Trebilcock Consulting Solutions, PA P a g e | 47

Coconut Road Traffic Study – March 2016 DRAFT
Trebilcock Consulting Solutions, PA P a g e | 48

Coconut Road Traffic Study – March 2016 DRAFT
Trebilcock Consulting Solutions, PA P a g e | 49
AppendixC:LeeCountyRoadMaintenanceMap(1 Sheet)

Coconut Road Traffic Study – March 2016 DRAFT
Trebilcock Consulting Solutions, PA P a g e | 50

Coconut Road Traffic Study – March 2016 DRAFT
Trebilcock Consulting Solutions, PA P a g e | 51
AppendixD:LeeCounty2015ConcurrencyReport(Excerpts)
(2 Sheets)

Coconut Road Traffic Study – March 2016 DRAFT
Trebilcock Consulting Solutions, PA P a g e | 52

Coconut Road Traffic Study – March 2016 DRAFT
Trebilcock Consulting Solutions, PA P a g e | 53
Coconut Road Traffic Study – March 2016 DRAFT
Trebilcock Consulting Solutions, PA P a g e | 54
AppendixE:LeeCounty2015TrafficCountReport(Excerpts)
(4 Sheets)

Coconut Road Traffic Study – March 2016 DRAFT
Trebilcock Consulting Solutions, PA P a g e | 55

Coconut Road Traffic Study – March 2016 DRAFT
Trebilcock Consulting Solutions, PA P a g e | 56

Coconut Road Traffic Study – March 2016 DRAFT
Trebilcock Consulting Solutions, PA P a g e | 57

Coconut Road Traffic Study – March 2016 DRAFT
Trebilcock Consulting Solutions, PA P a g e | 58

Coconut Road Traffic Study – March 2016 DRAFT
Trebilcock Consulting Solutions, PA P a g e | 59
AppendixF:TCSCorridorVolumeCounts(11 Sheets)

Coconut Road Traffic Study – March 2016 DRAFT
Trebilcock Consulting Solutions, PA P a g e | 60

Coconut Road Traffic Study – March 2016 DRAFT
Trebilcock Consulting Solutions, PA P a g e | 61

Coconut Road Traffic Study – March 2016 DRAFT
Trebilcock Consulting Solutions, PA P a g e | 62

Coconut Road Traffic Study – March 2016 DRAFT
Trebilcock Consulting Solutions, PA P a g e | 63
Coconut Road Traffic Study – March 2016 DRAFT
Trebilcock Consulting Solutions, PA P a g e | 64

Coconut Road Traffic Study – March 2016 DRAFT
Trebilcock Consulting Solutions, PA P a g e | 65
Coconut Road Traffic Study – March 2016 DRAFT
Trebilcock Consulting Solutions, PA P a g e | 66

Coconut Road Traffic Study – March 2016 DRAFT
Trebilcock Consulting Solutions, PA P a g e | 67

Coconut Road Traffic Study – March 2016 DRAFT
Trebilcock Consulting Solutions, PA P a g e | 68

Coconut Road Traffic Study – March 2016 DRAFT
Trebilcock Consulting Solutions, PA P a g e | 69

Coconut Road Traffic Study – March 2016 DRAFT
Trebilcock Consulting Solutions, PA P a g e | 70

Coconut Road Traffic Study – March 2016 DRAFT
Trebilcock Consulting Solutions, PA P a g e | 71
AppendixG:2014FDOTPeakSeasonFactorCategoryReport(Excerpt)
(1 Sheet)

Coconut Road Traffic Study – March 2016 DRAFT
Trebilcock Consulting Solutions, PA P a g e | 72

Coconut Road Traffic Study – March 2016 DRAFT
Trebilcock Consulting Solutions, PA P a g e | 73
AppendixH:2013LeeCountyLink–SpecificVolumes(Excerpt)
(1 Sheet)
Coconut Road Traffic Study – March 2016 DRAFT
Trebilcock Consulting Solutions, PA P a g e | 74

Coconut Road Traffic Study – March 2016 DRAFT
Trebilcock Consulting Solutions, PA P a g e | 75
AppendixI:LeeCounty2035LRTP(Excerpts)(3 Sheets)

Coconut Road Traffic Study – March 2016 DRAFT
Trebilcock Consulting Solutions, PA P a g e | 76

Coconut Road Traffic Study – March 2016 DRAFT
Trebilcock Consulting Solutions, PA P a g e | 77
Coconut Road Traffic Study – March 2016 DRAFT
Trebilcock Consulting Solutions, PA P a g e | 78

Coconut Road Traffic Study – March 2016 DRAFT
Trebilcock Consulting Solutions, PA P a g e | 79
AppendixJ:PotentialDevelopment–ITEPeriodAnalysisReports
(6 Sheets)

Coconut Road Traffic Study – March 2016 DRAFT
Trebilcock Consulting Solutions, PA P a g e | 80
ID # STRAP # PARCEL NAME DEVELOPMENT PARAMETERS
ZONING APPROVALS
NOT YET CONSTRUCTED
POTENTIAL FUTURE
CONSTRUCTION PERMITTING
1 07-47-25-B2-00004.00CE Pelican Landing Community Association Marina – 20 berths; Restaurant – 3,000sf X
2A 07-47-25-B2-00003.0370 Estero Bay Marine LLC (Weeks Fish Camp)
Residential – Multi Family – 360 dwelling units – high-rise buildings X
2B 07-47-25-B2-00003.0000
3 07-47-25-B2-00000.0010 WCI/Pelican Landing DRI (Raptor Bay)
Residential – Multi Family – 360 dwelling units – high-rise buildings X
4 06-47-25-00-00002.0030 Pelican Landing Timeshare Ventures LP
Timeshare – Rental Townhouses – 267 dwelling units
X
5 17-47-25-B1-00001.012A WCI Communities Inc (Altaira High Rise)
High-Rise Residential Condominium/ Townhouse – 76 dwelling units X
6 17-47-25-B1-U1681.1891 WCI Communities Inc (Two Future High Rises)
Residential – Multi Family – 150 dwelling units – high-rise buildings X
7 08-47-25-01 + Eldorado Acres Subdivision Residential – Single Family – 98 dwelling units – platted lots
X
8 08-47-25-00-00003.0030 John T. Watson Residential – Single Family – 2 dwelling units X
9 08-47-25-01-00016.0000 Judy K. Doyle Residential – Single Family – 15 dwelling units X
10 08-47-25-00-00004.0000 Dhaliwal + J/T Residential – Single Family – 3 dwelling units
X
11 08-47-25-E2-U1757.2005 Dhaliwal + J/T X
12 09-47-25-E1-U1823.2024 Dewane/Docese of Venice Residential – Multi Family – 93 dwelling units X
13 09-47-25-E4-U1882.1994 Coconut Road Associates LLC
General Office Building – 122,484sf X
14 09-47-25-E1-U1874.2023 HG Coconut LLC Shopping Center – 210,000sf Medical Office Building – 40,000sf Multi-Family Residential – 525 dwelling units Assisted Living – 152 beds Hotel – 130 Rooms
X 15A 09-47-25-E1-U1877.2039
OBE Florida CRE Holdings LLC
15B 09-47-25-E2-U1900.2033
15C 09-47-25-E2-U1902.2012
16 09-47-25-E3-31000.0050 Allsee Investment LP General Office Building – 27,500sf X
17 09-47-25-E3-31000.0010 Naples Diagnostic Imaging
General Office Building – 15,000sf X
22A 09-47-25-E3-373A1.0000
Lee Memorial Health System
Acute Care Hospital – 160 beds Shopping Center – 60,000sf Medical Office Building – 198,000sf General Office Building – 102,000sf
X 22B 09-47-25-E3-373A2.0000
22C 09-47-25-E3-373A3.0010

Coconut Road Traffic Study – March 2016 DRAFT
Trebilcock Consulting Solutions, PA P a g e | 81

Coconut Road Traffic Study – March 2016 DRAFT
Trebilcock Consulting Solutions, PA P a g e | 82

Coconut Road Traffic Study – March 2016 DRAFT
Trebilcock Consulting Solutions, PA P a g e | 83

Coconut Road Traffic Study – March 2016 DRAFT
Trebilcock Consulting Solutions, PA P a g e | 84

Coconut Road Traffic Study – March 2016 DRAFT
Trebilcock Consulting Solutions, PA P a g e | 85

Coconut Road Traffic Study – March 2016 DRAFT
Trebilcock Consulting Solutions, PA P a g e | 86
AppendixK:FDOTTrafficOnline–T24Factors(1 Sheet)

Coconut Road Traffic Study – March 2016 DRAFT
Trebilcock Consulting Solutions, PA P a g e | 87

Coconut Road Traffic Study – March 2016 DRAFT
Trebilcock Consulting Solutions, PA P a g e | 88
AppendixL:LeeCounty–IntersectionSignalData(10 Sheets)

Coconut Road Traffic Study – March 2016 DRAFT
Trebilcock Consulting Solutions, PA P a g e | 89

Coconut Road Traffic Study – March 2016 DRAFT
Trebilcock Consulting Solutions, PA P a g e | 90

Coconut Road Traffic Study – March 2016 DRAFT
Trebilcock Consulting Solutions, PA P a g e | 91

Coconut Road Traffic Study – March 2016 DRAFT
Trebilcock Consulting Solutions, PA P a g e | 92

Coconut Road Traffic Study – March 2016 DRAFT
Trebilcock Consulting Solutions, PA P a g e | 93

Coconut Road Traffic Study – March 2016 DRAFT
Trebilcock Consulting Solutions, PA P a g e | 94

Coconut Road Traffic Study – March 2016 DRAFT
Trebilcock Consulting Solutions, PA P a g e | 95

Coconut Road Traffic Study – March 2016 DRAFT
Trebilcock Consulting Solutions, PA P a g e | 96

Coconut Road Traffic Study – March 2016 DRAFT
Trebilcock Consulting Solutions, PA P a g e | 97

Coconut Road Traffic Study – March 2016 DRAFT
Trebilcock Consulting Solutions, PA P a g e | 98
Coconut Road Traffic Study – March 2016 DRAFT
Trebilcock Consulting Solutions, PA P a g e | 99
AppendixM:IntersectionAnalysis‐HCS2010Printouts(9 Sheets)

Coconut Road Traffic Study – March 2016 DRAFT
Trebilcock Consulting Solutions, PA P a g e | 100

Coconut Road Traffic Study – March 2016 DRAFT
Trebilcock Consulting Solutions, PA P a g e | 101

Coconut Road Traffic Study – March 2016 DRAFT
Trebilcock Consulting Solutions, PA P a g e | 102

Coconut Road Traffic Study – March 2016 DRAFT
Trebilcock Consulting Solutions, PA P a g e | 103

Coconut Road Traffic Study – March 2016 DRAFT
Trebilcock Consulting Solutions, PA P a g e | 104

Coconut Road Traffic Study – March 2016 DRAFT
Trebilcock Consulting Solutions, PA P a g e | 105

Coconut Road Traffic Study – March 2016 DRAFT
Trebilcock Consulting Solutions, PA P a g e | 106

Coconut Road Traffic Study – March 2016 DRAFT
Trebilcock Consulting Solutions, PA P a g e | 107
Coconut Road Traffic Study – March 2016 DRAFT
Trebilcock Consulting Solutions, PA P a g e | 108

Coconut Road Traffic Study – March 2016 DRAFT
Trebilcock Consulting Solutions, PA P a g e | 109
AppendixN:IntersectionAlternative–HCS2010Analysis(2 Sheets)

Coconut Road Traffic Study – March 2016 DRAFT
Trebilcock Consulting Solutions, PA P a g e | 110

Coconut Road Traffic Study – March 2016 DRAFT
Trebilcock Consulting Solutions, PA P a g e | 111

Coconut Road Traffic Study – March 2016 DRAFT
Trebilcock Consulting Solutions, PA P a g e | 112
AppendixO:CrashData–WestofUS41(2 Sheets)

Coconut Road Traffic Study – March 2016 DRAFT
Trebilcock Consulting Solutions, PA P a g e | 113

Coconut Road Traffic Study – March 2016 DRAFT
Trebilcock Consulting Solutions, PA P a g e | 114
AppendixP:CrashData–EastofUS41(2 Sheets)

Coconut Road Traffic Study – March 2016 DRAFT
Trebilcock Consulting Solutions, PA P a g e | 115


![Ppt0000007 [Sólo lectura] - ICPA · ¾Engineering Long Lasting Pavements Using Pavement ... ¾Traffic growth outpaces road construction ... MATERIALS ENGINEERING](https://img.pdfslide.tips/doc/110x75/5b39eb587f8b9a5a518f0cd0/ppt0000007-solo-lectura-engineering-long-lasting-pavements-using-pavement.jpg)