Embed Size (px)
Citation preview
�
COFFEY INTERNATIONAL LIMITED Results - 6 months ended 31 December 2008
27 February 2009
Key highlights
Roger Olds, Managing Director
3
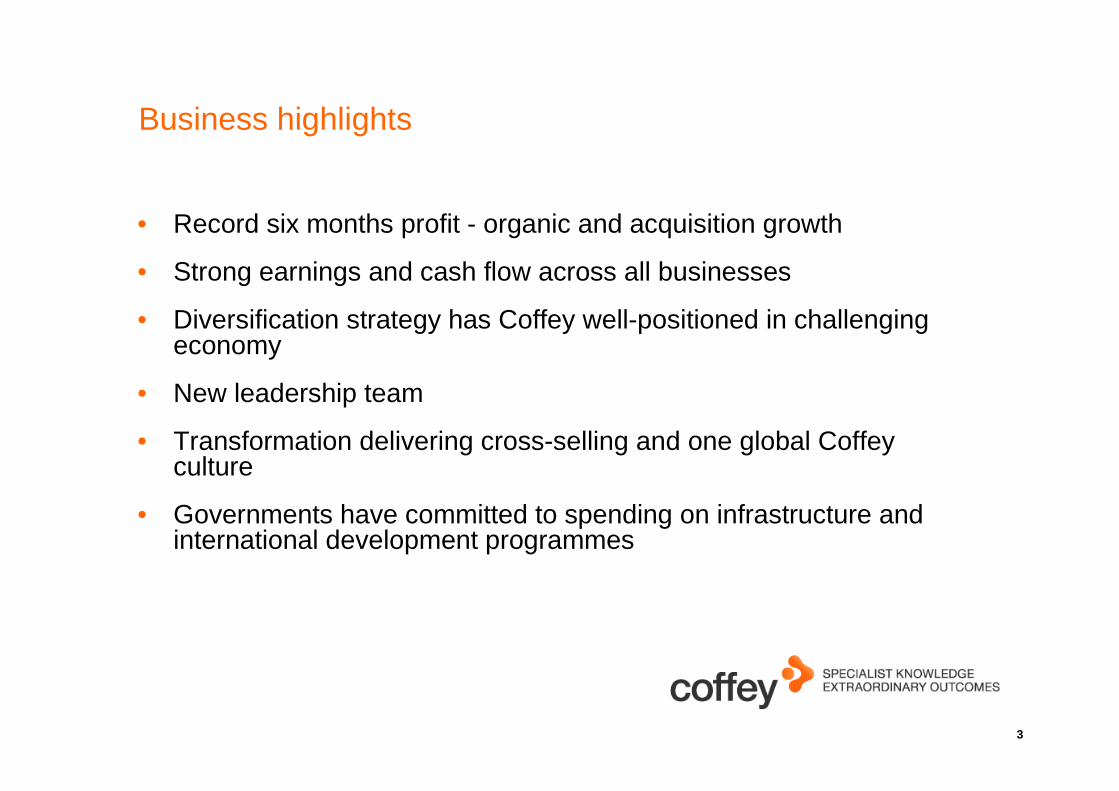
Business highlights
• Record six months profit - organic and acquisition growth
• Strong earnings and cash flow across all businesses
• Diversification strategy has Coffey well-positioned in challenging economy
• New leadership team
• Transformation delivering cross-selling and one global Coffey culture
• Governments have committed to spending on infrastructure and international development programmes
4
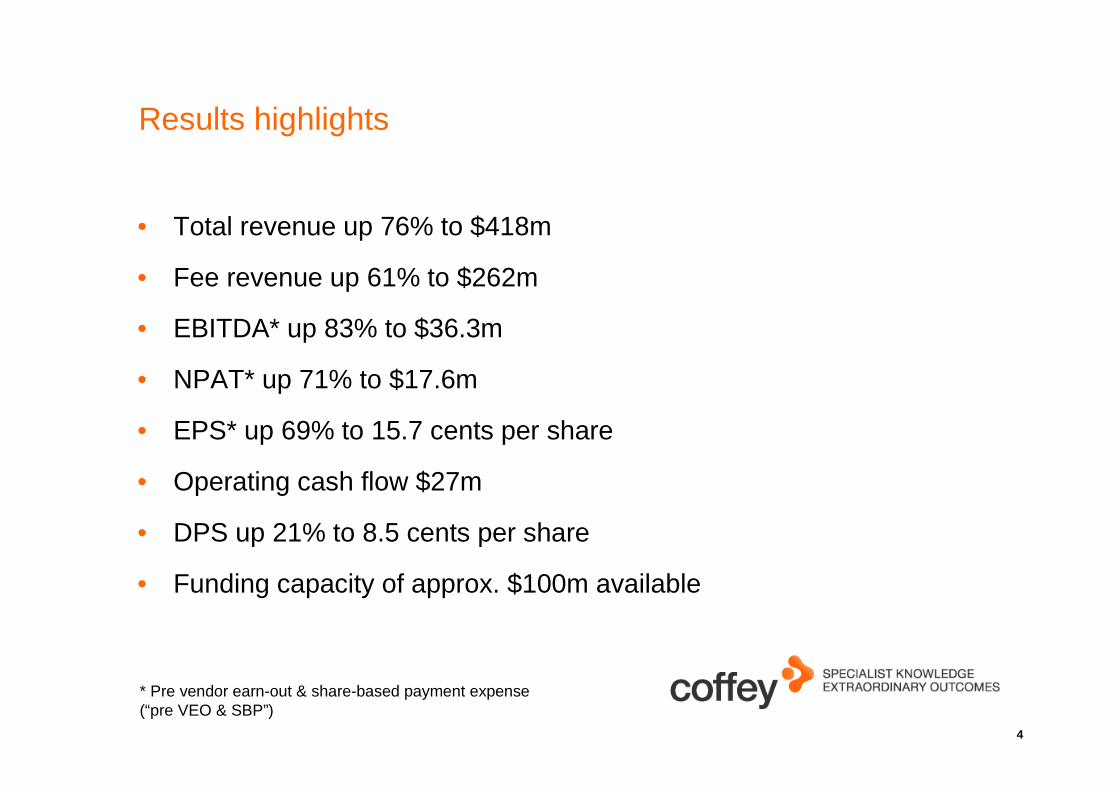
Results highlights
• Total revenue up 76% to $418m
• Fee revenue up 61% to $262m
• EBITDA* up 83% to $36.3m
• NPAT* up 71% to $17.6m
• EPS* up 69% to 15.7 cents per share
• Operating cash flow $27m
• DPS up 21% to 8.5 cents per share
• Funding capacity of approx. $100m available
* Pre vendor earn-out & share-based payment expense (“pre VEO & SBP”)
Financial performance
Urs Meyerhans, Director of Finance and Chief Financial Officer
6
Financial management overview
• Continued focus on:
– working capital management
– margin improvement
• Strong balance sheet
• Conservative gearing
• Senior finance team in place
• Share buy-back commenced
7
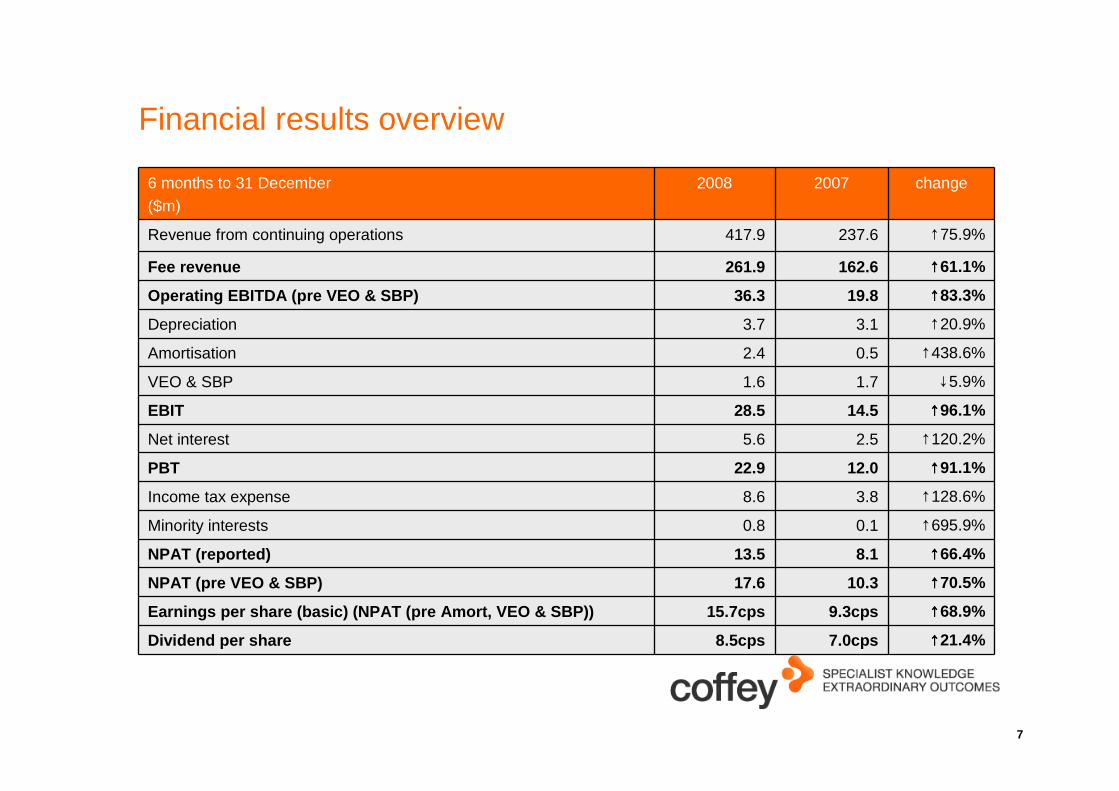
Financial results overview
6 months to 31 December($m)
2008 2007 change
Revenue from continuing operations 417.9 237.6 ↑75.9%
Fee revenue 261.9 162.6 ↑↑↑↑61.1%
Operating EBITDA (pre VEO & SBP) 36.3 19.8 ↑↑↑↑83.3%
Depreciation 3.7 3.1 ↑20.9%
Amortisation 2.4 0.5 ↑438.6%
VEO & SBP 1.6 1.7 ↓5.9%
EBIT 28.5 14.5 ↑↑↑↑96.1%
Net interest 5.6 2.5 ↑120.2%
PBT 22.9 12.0 ↑↑↑↑91.1%
Income tax expense 8.6 3.8 ↑128.6%
Minority interests 0.8 0.1 ↑695.9%
NPAT (reported) 13.5 8.1 ↑↑↑↑66.4%
NPAT (pre VEO & SBP) 17.6 10.3 ↑↑↑↑70.5%
Earnings per share (basic) (NPAT (pre Amort, VEO & SBP)) 15.7cps 9.3cps ↑↑↑↑68.9%
Dividend per share 8.5cps 7.0cps ↑↑↑↑21.4%
8
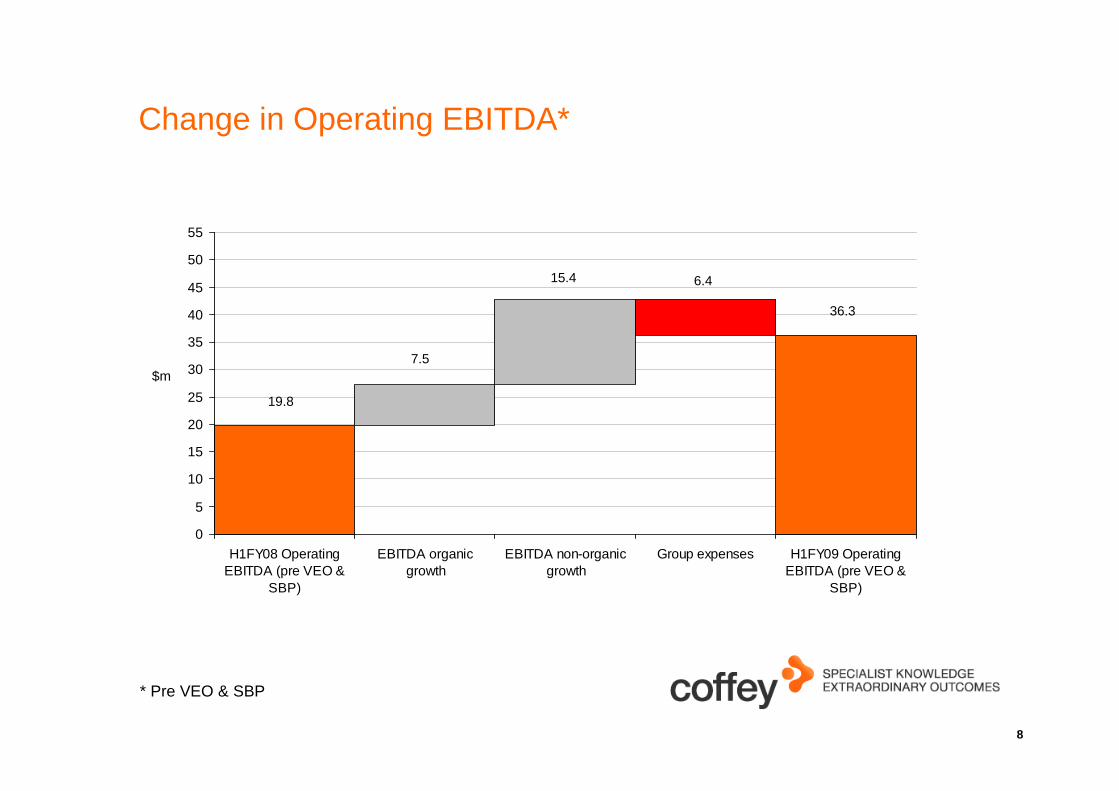
Change in Operating EBITDA*
0
5
10
15
20
25
30
35
40
45
50
55
H1FY08 OperatingEBITDA (pre VEO &
SBP)
EBITDA organicgrowth
EBITDA non-organicgrowth
Group expenses H1FY09 OperatingEBITDA (pre VEO &
SBP)
$m
19.8
6.4
36.3
15.4
7.5
* Pre VEO & SBP
9
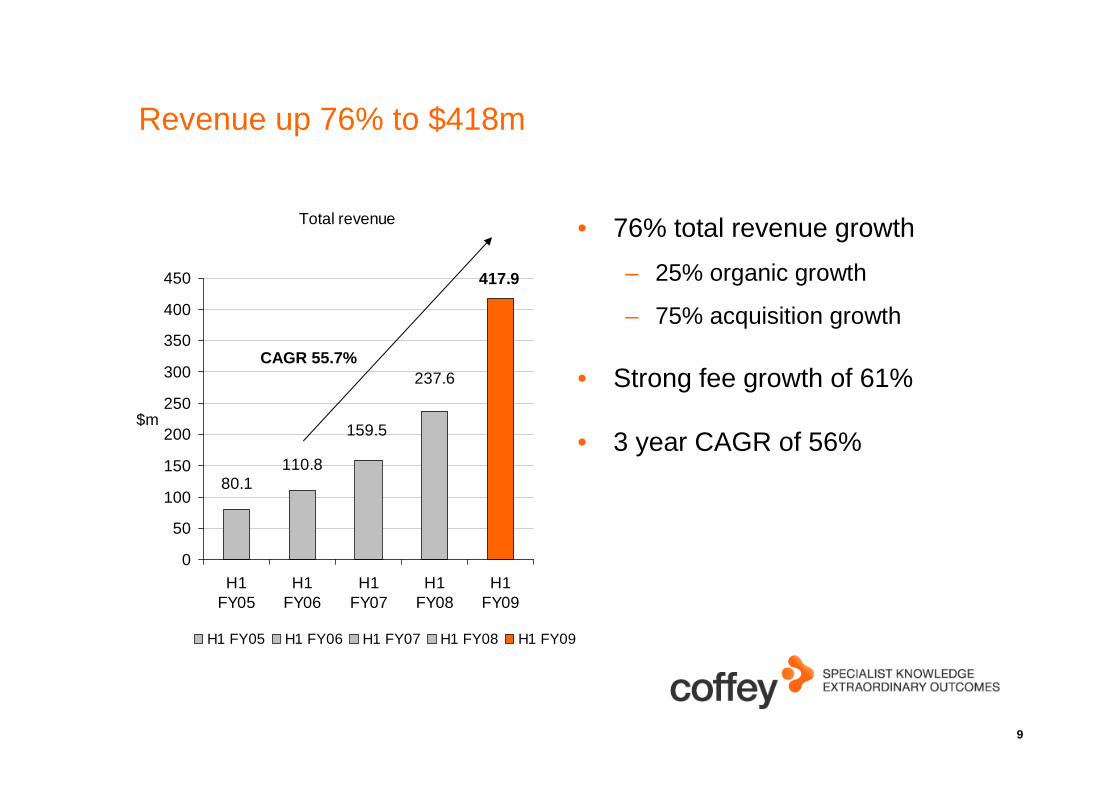
Revenue up 76% to $418m
• 76% total revenue growth
– 25% organic growth
– 75% acquisition growth
• Strong fee growth of 61%
• 3 year CAGR of 56%
Total revenue
237.6
159.5
110.880.1
417.9
0
50
100
150
200
250
300
350
400
450
H1FY05
H1FY06
H1FY07
H1FY08
H1FY09
$m
H1 FY05 H1 FY06 H1 FY07 H1 FY08 H1 FY09
CAGR 55.7%
10
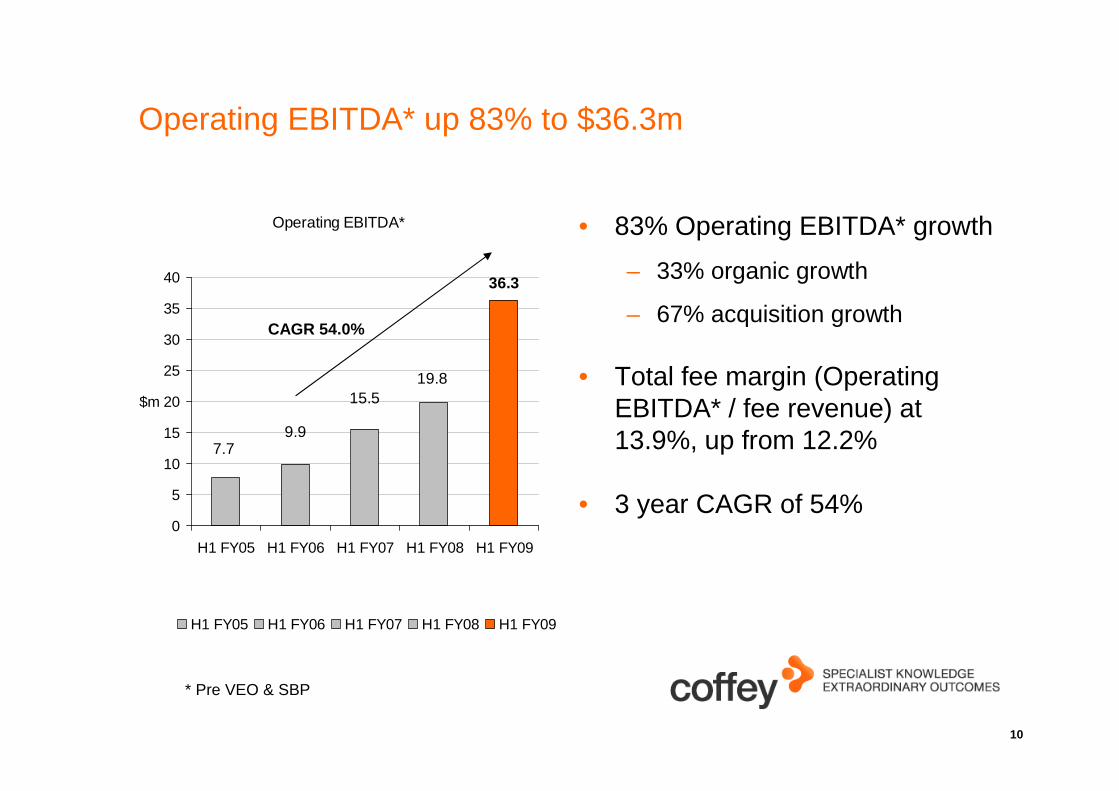
Operating EBITDA* up 83% to $36.3m
• 83% Operating EBITDA* growth
– 33% organic growth
– 67% acquisition growth
• Total fee margin (Operating EBITDA* / fee revenue) at 13.9%, up from 12.2%
• 3 year CAGR of 54%
Operating EBITDA*
19.815.5
9.97.7
36.3
0
5
10
15
20
25
30
35
40
H1 FY05 H1 FY06 H1 FY07 H1 FY08 H1 FY09
$m
H1 FY05 H1 FY06 H1 FY07 H1 FY08 H1 FY09
CAGR 54.0%
* Pre VEO & SBP
11
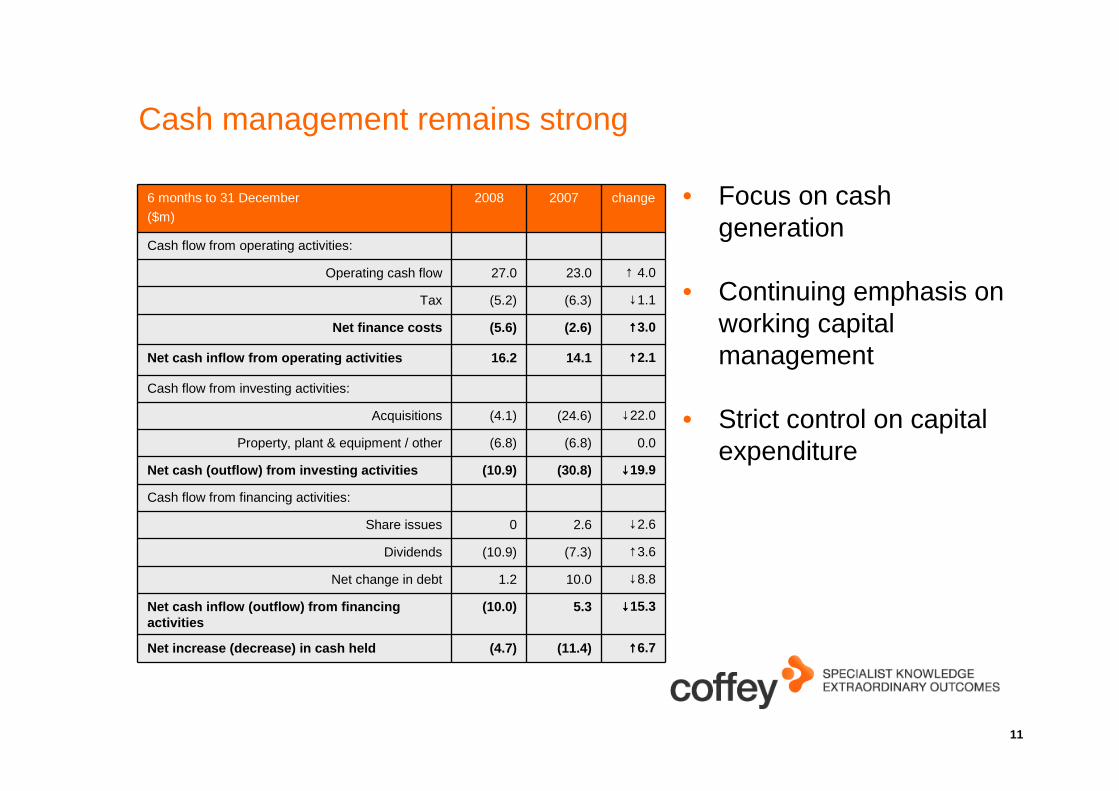
Cash management remains strong
• Focus on cash generation
• Continuing emphasis on working capital management
• Strict control on capital expenditure
6 months to 31 December
($m)
2008 2007 change
Cash flow from operating activities:
Operating cash flow 27.0 23.0 ↑ 4.0
Tax (5.2) (6.3) ↓1.1
Net finance costs (5.6) (2.6) ↑↑↑↑3.0
Net cash inflow from operating activities 16.2 14.1 ↑↑↑↑2.1
Cash flow from investing activities:
Acquisitions (4.1) (24.6) ↓22.0
Property, plant & equipment / other (6.8) (6.8) 0.0
Net cash (outflow) from investing activities (10.9) (30.8) ↓↓↓↓19.9
Cash flow from financing activities:
Share issues 0 2.6 ↓2.6
Dividends (10.9) (7.3) ↑3.6
Net change in debt 1.2 10.0 ↓8.8
Net cash inflow (outflow) from financing activities
(10.0) 5.3 ↓↓↓↓15.3
Net increase (decrease) in cash held (4.7) (11.4) ↑↑↑↑6.7
12
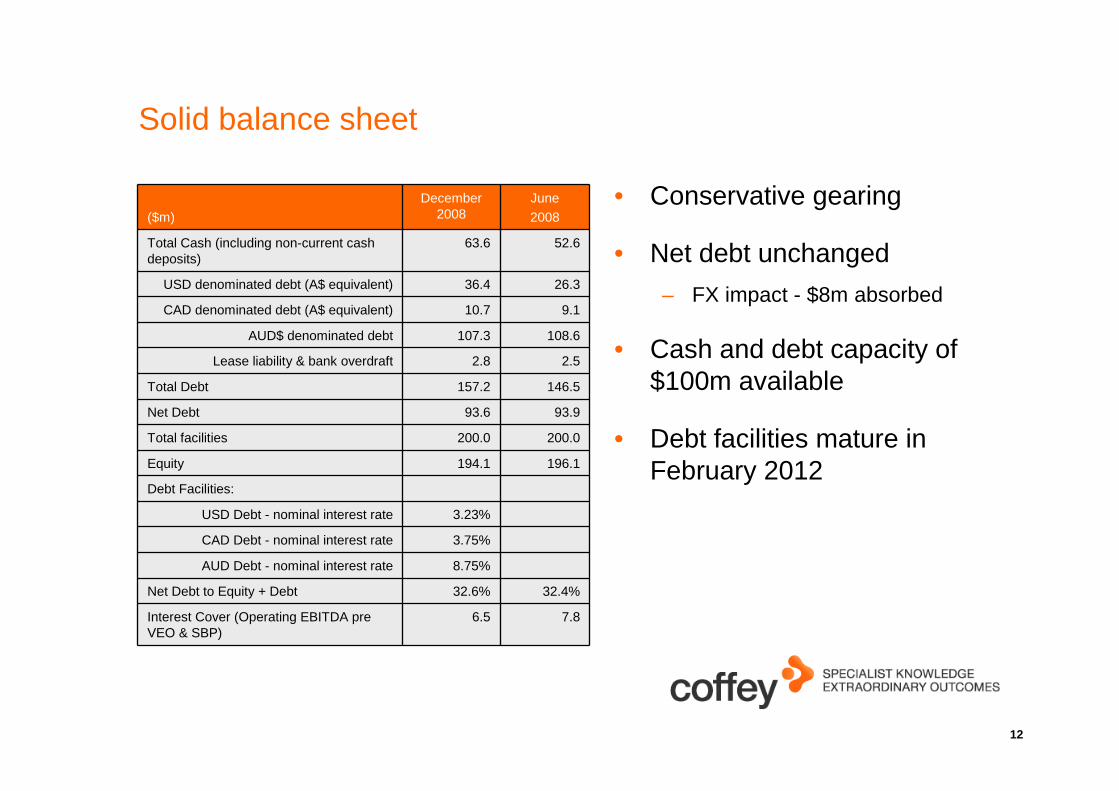
Solid balance sheet
• Conservative gearing
• Net debt unchanged
– FX impact - $8m absorbed
• Cash and debt capacity of $100m available
• Debt facilities mature in February 2012
($m)
December 2008
June
2008
Total Cash (including non-current cash deposits)
63.6 52.6
USD denominated debt (A$ equivalent) 36.4 26.3
CAD denominated debt (A$ equivalent) 10.7 9.1
AUD$ denominated debt 107.3 108.6
Lease liability & bank overdraft 2.8 2.5
Total Debt 157.2 146.5
Net Debt 93.6 93.9
Total facilities 200.0 200.0
Equity 194.1 196.1
Debt Facilities:
USD Debt - nominal interest rate 3.23%
CAD Debt - nominal interest rate 3.75%
AUD Debt - nominal interest rate 8.75%
Net Debt to Equity + Debt 32.6% 32.4%
Interest Cover (Operating EBITDA pre VEO & SBP)
6.5 7.8
13
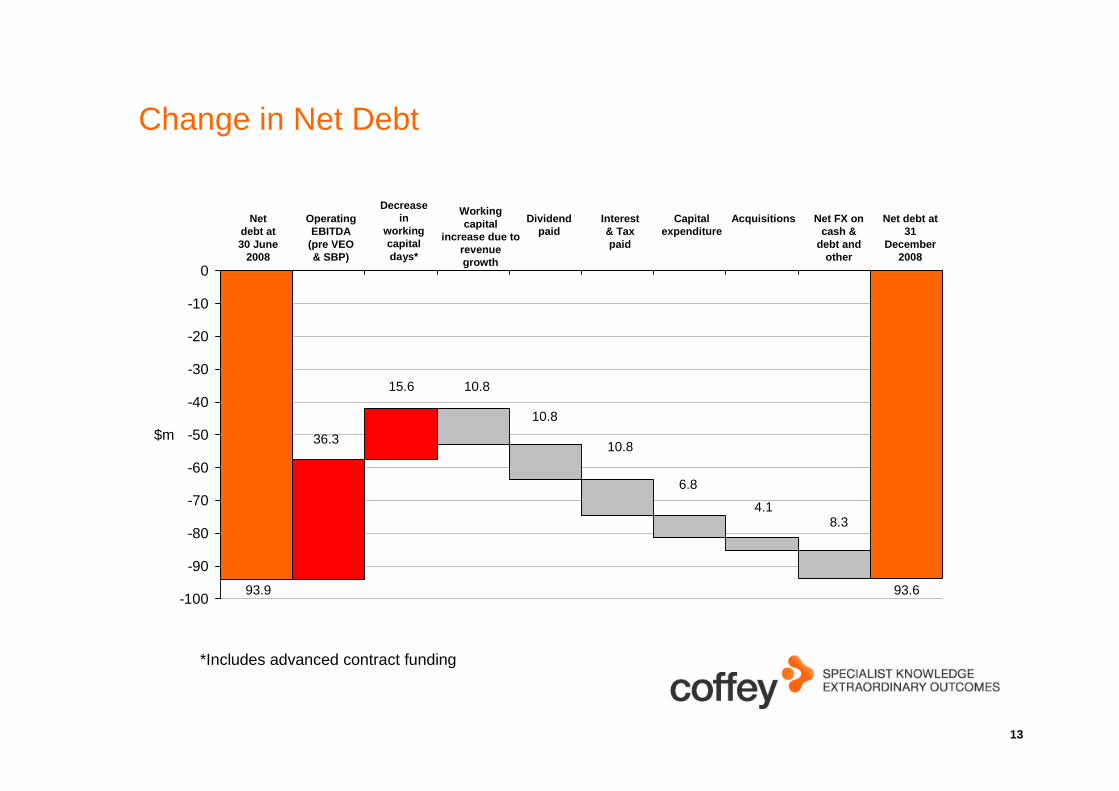
Change in Net Debt
-100
-90
-80
-70
-60
-50
-40
-30
-20
-10
0
$m
93.9
10.8
10.8
10.8
6.8
4.18.3
36.3
15.6
93.6
Net debt at 30 June
2008
Operating EBITDA
(pre VEO & SBP)
Decrease in
working capital days*
Working capital
increase due to revenue growth
Dividend paid
Interest & Tax paid
Capital expenditure
Acquisitions Net FX on cash &
debt and other
Net debt at 31
December 2008
*Includes advanced contract funding
14
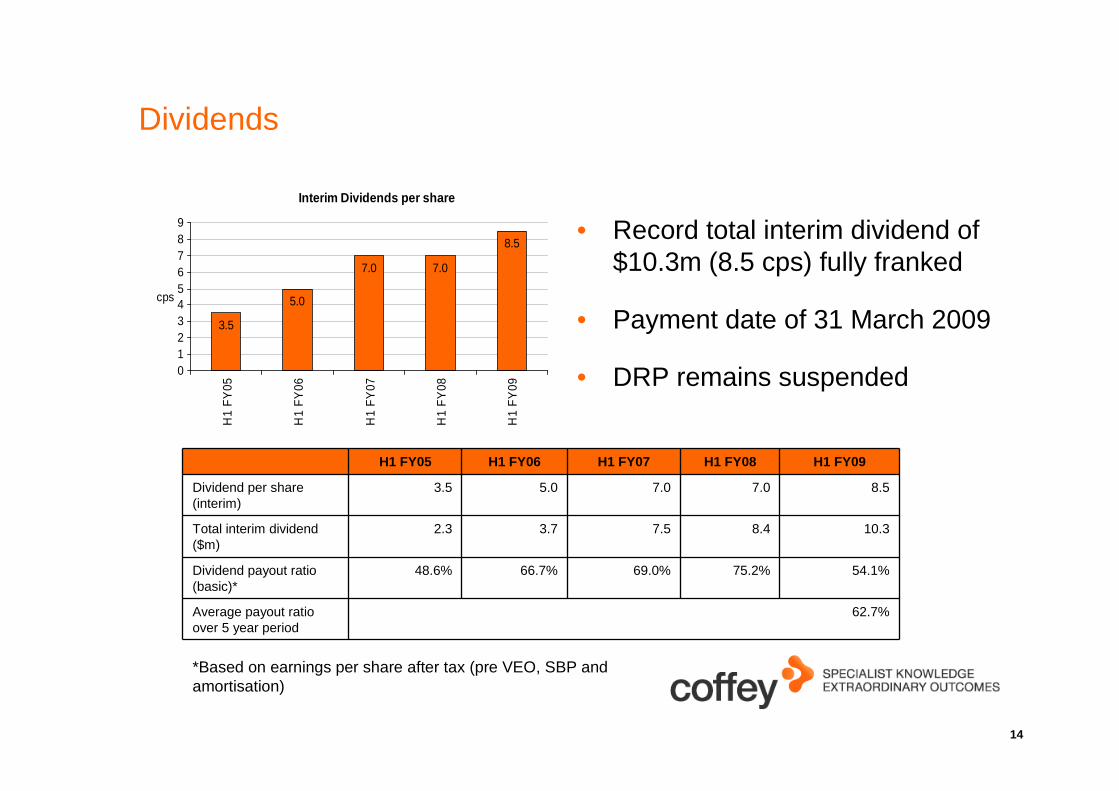
Dividends
Interim Dividends per share
3.5
5.0
7.0 7.0
8.5
0123456789
H1
FY
05
H1
FY
06
H1
FY
07
H1
FY
08
H1
FY
09
cps
H1 FY05 H1 FY06 H1 FY07 H1 FY08 H1 FY09
Dividend per share (interim)
3.5 5.0 7.0 7.0 8.5
Total interim dividend ($m)
2.3 3.7 7.5 8.4 10.3
Dividend payout ratio (basic)*
48.6% 66.7% 69.0% 75.2% 54.1%
Average payout ratio over 5 year period
62.7%
• Record total interim dividend of $10.3m (8.5 cps) fully franked
• Payment date of 31 March 2009
• DRP remains suspended
*Based on earnings per share after tax (pre VEO, SBP and amortisation)
15
Summary – financial performance
• Improving working capital management
• Improved fee margins with Operating EBITDA* / fee revenue up
from 12.2% to 13.9%
• Substantial growth in Operating EBITDA* up 83.3%
• EPS growth of 69%** on pcp (3 year CAGR of 28%)
• Solid balance sheet with conservative gearing
• Fully franked interim dividend of 8.5 cps - increased 21.4% on pcp
*Pre VEO & SBP
** Pre amortisation, VEO and SBP
Operational review
Roger Olds, Managing Director
17
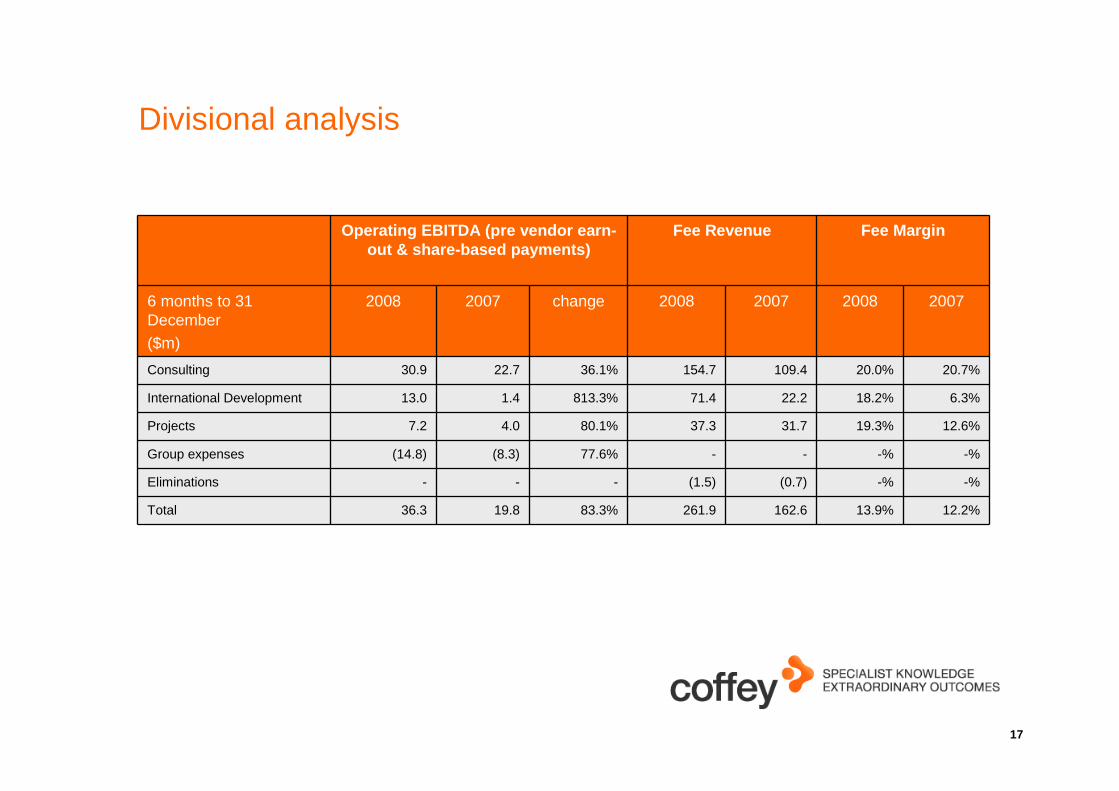
Divisional analysis
Operating EBITDA (pre vendor earn-out & share-based payments)
Fee Revenue Fee Margin
6 months to 31 December($m)
2008 2007 change 2008 2007 2008 2007
Consulting 30.9 22.7 36.1% 154.7 109.4 20.0% 20.7%
International Development 13.0 1.4 813.3% 71.4 22.2 18.2% 6.3%
Projects 7.2 4.0 80.1% 37.3 31.7 19.3% 12.6%
Group expenses (14.8) (8.3) 77.6% - - -% -%
Eliminations - - - (1.5) (0.7) -% -%
Total 36.3 19.8 83.3% 261.9 162.6 13.9% 12.2%
18
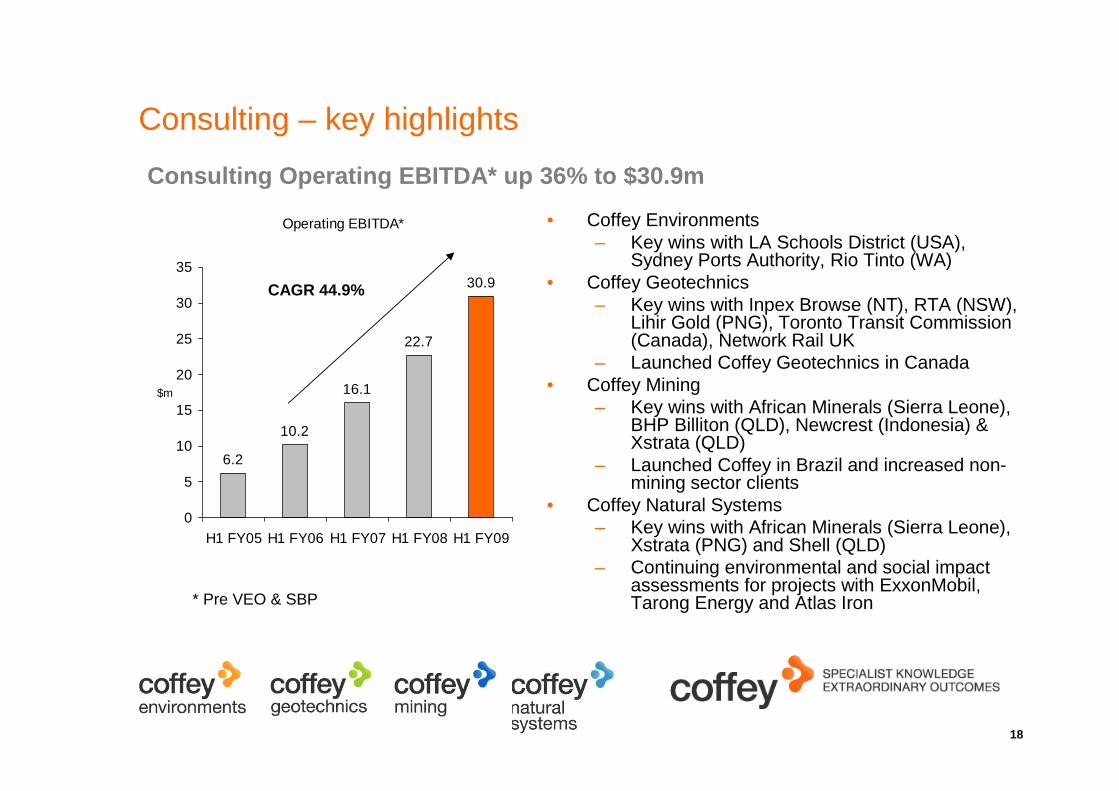
Consulting – key highlights
• Coffey Environments– Key wins with LA Schools District (USA),
Sydney Ports Authority, Rio Tinto (WA)• Coffey Geotechnics
– Key wins with Inpex Browse (NT), RTA (NSW), Lihir Gold (PNG), Toronto Transit Commission (Canada), Network Rail UK
– Launched Coffey Geotechnics in Canada• Coffey Mining
– Key wins with African Minerals (Sierra Leone), BHP Billiton (QLD), Newcrest (Indonesia) & Xstrata (QLD)
– Launched Coffey in Brazil and increased non-mining sector clients
• Coffey Natural Systems– Key wins with African Minerals (Sierra Leone),
Xstrata (PNG) and Shell (QLD) – Continuing environmental and social impact
assessments for projects with ExxonMobil, Tarong Energy and Atlas Iron
Operating EBITDA*
6.2
10.2
16.1
22.7
30.9
0
5
10
15
20
25
30
35
H1 FY05 H1 FY06 H1 FY07 H1 FY08 H1 FY09
$m
Consulting Operating EBITDA* up 36% to $30.9m
CAGR 44.9%
* Pre VEO & SBP
19
Consulting – key highlights (cont.)
• Coffey Information– Launched Coffey Information (out of Coffey Geotechnics) July 2008– Acquired Civil Lab in New Zealand (December 2008) and Testrite in Sydney (February 2009)– Key wins include Ballina Bypass Alliance (NSW), Horizon Alliance (QLD), Wodonga Rail
Bypass (NSW) & Airport Link (QLD) • Coffey Rail
– Key wins with VicTrack, MainCo and Department of Transport (VIC)– Pursuing opportunities throughout Australia and New Zealand– Integration of Teal Management Services (Sydney)
• Peron / Stratcorp– New CEO appointed to Peron– Key wins include development of Queensland Children’s Hospital & Sunshine Coast University
Hospital– Major project work with Victorian (MR3 Metro Rail Franchising) & Queensland Governments
(Western Corridor Recycled Water project)
20
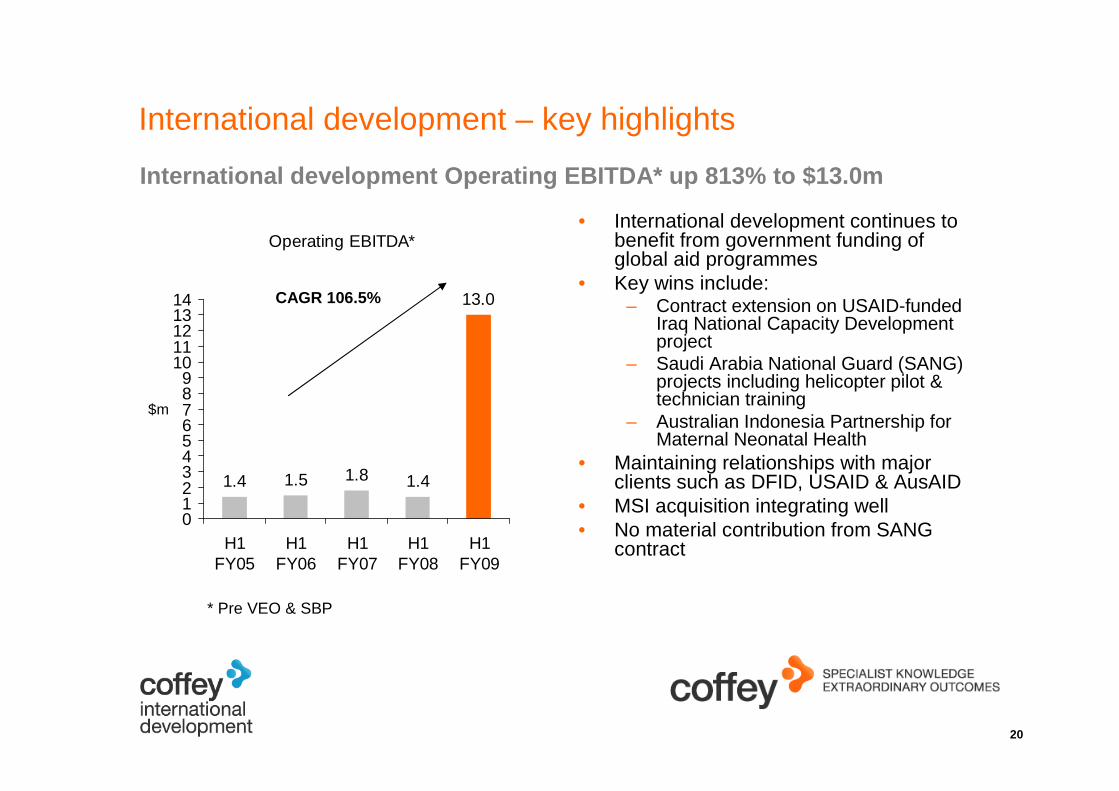
International development – key highlights
• International development continues to benefit from government funding of global aid programmes
• Key wins include:– Contract extension on USAID-funded
Iraq National Capacity Development project
– Saudi Arabia National Guard (SANG) projects including helicopter pilot & technician training
– Australian Indonesia Partnership for Maternal Neonatal Health
• Maintaining relationships with major clients such as DFID, USAID & AusAID
• MSI acquisition integrating well• No material contribution from SANG
contract
Operating EBITDA*
1.4 1.5 1.8 1.4
13.0
0123456789
1011121314
H1FY05
H1FY06
H1FY07
H1FY08
H1FY09
$m
International development Operating EBITDA* up 813% to $13.0m
CAGR 106.5%
* Pre VEO & SBP
21
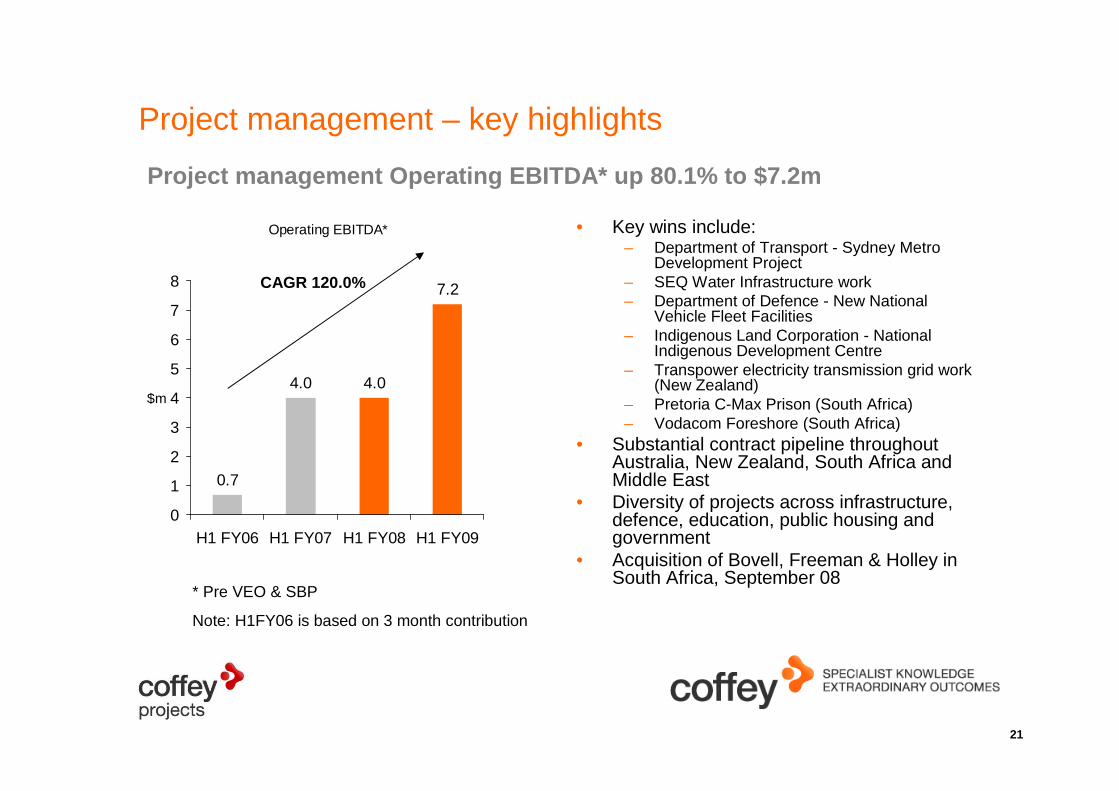
Project management – key highlights
• Key wins include:– Department of Transport - Sydney Metro
Development Project– SEQ Water Infrastructure work – Department of Defence - New National
Vehicle Fleet Facilities– Indigenous Land Corporation - National
Indigenous Development Centre – Transpower electricity transmission grid work
(New Zealand)– Pretoria C-Max Prison (South Africa)– Vodacom Foreshore (South Africa)
• Substantial contract pipeline throughout Australia, New Zealand, South Africa and Middle East
• Diversity of projects across infrastructure, defence, education, public housing and government
• Acquisition of Bovell, Freeman & Holley in South Africa, September 08
Operating EBITDA*
0.7
4.0 4.0
7.2
0
1
2
3
4
5
6
7
8
H1 FY06 H1 FY07 H1 FY08 H1 FY09
$m
Project management Operating EBITDA* up 80.1% to $7.2m
* Pre VEO & SBP
Note: H1FY06 is based on 3 month contribution
CAGR 120.0%
Strategy & outlook
Roger OldsManaging Director
23
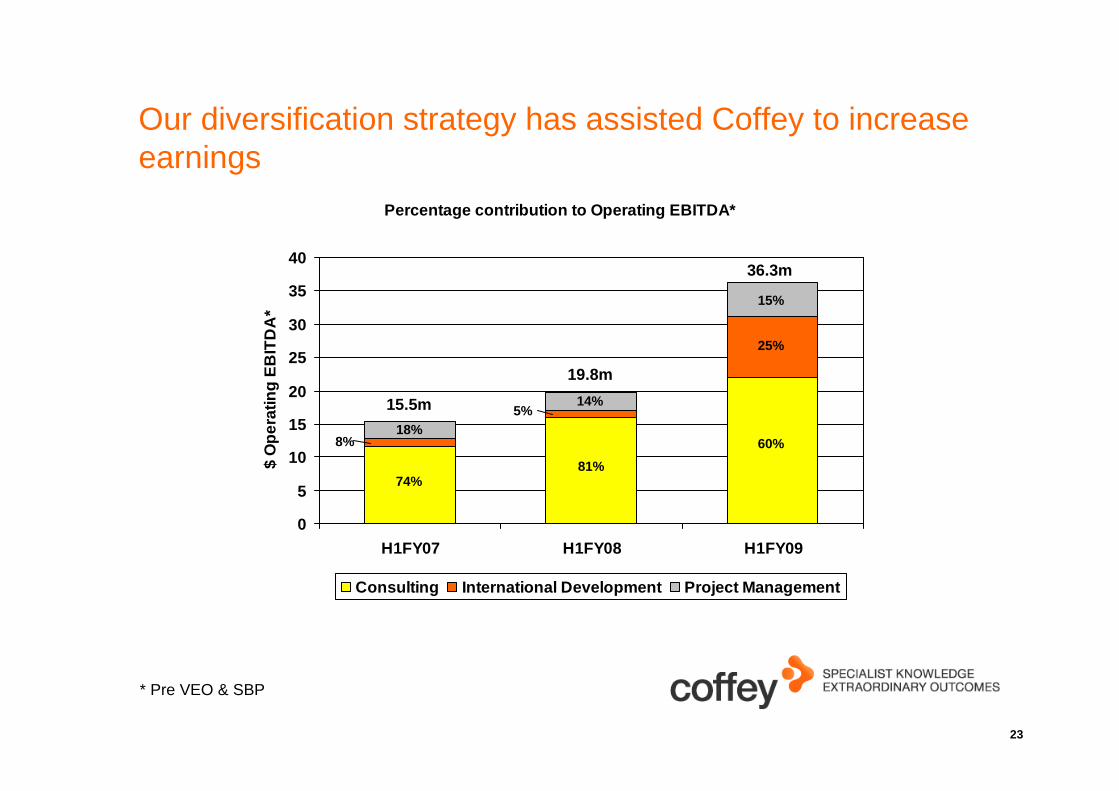
Our diversification strategy has assisted Coffey to increase earnings
* Pre VEO & SBP
Percentage contribution to Operating EBITDA*
0
5
10
15
20
25
30
35
40
H1FY07 H1FY08 H1FY09
$ O
per
atin
g E
BIT
DA
*
Consulting International Development Project Management
15.5m
19.8m
36.3m
74%81%
60%
25%
15%
14%5%
8%18%
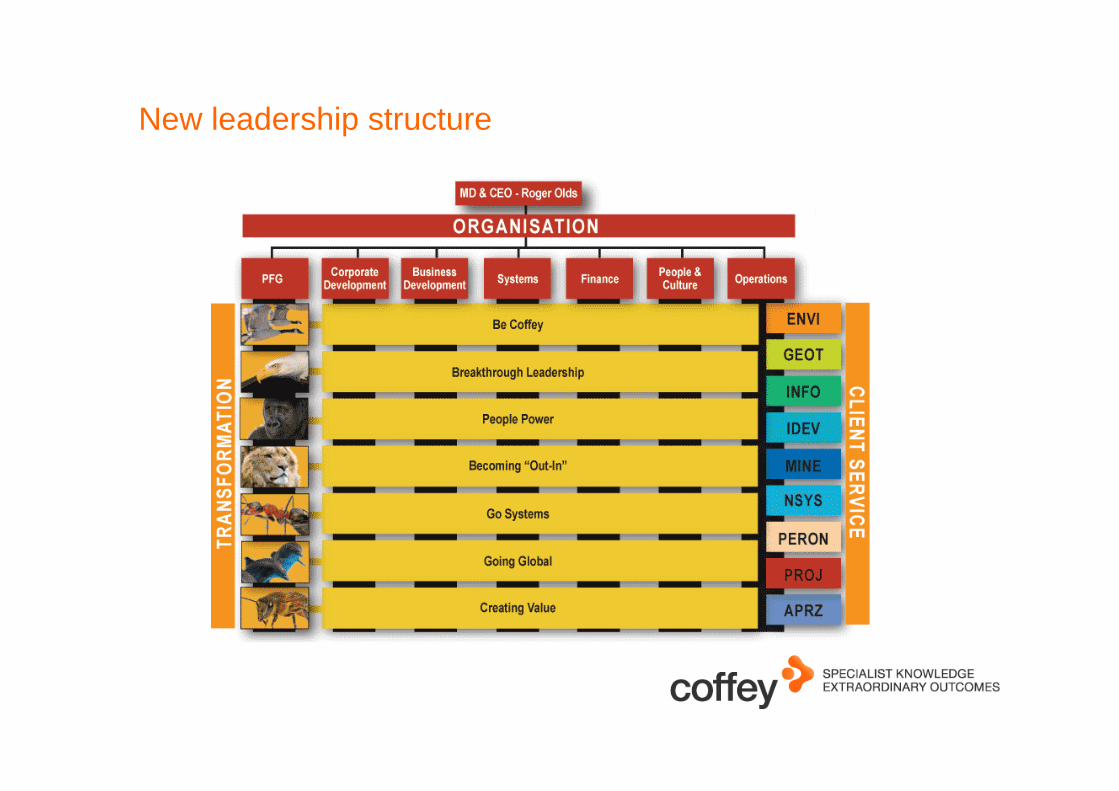
New leadership structure
25
Our growth platform is well established
• Organic growth
– Continued investment in staff
– Expanding services into new geographies
– Increased business development focused on cross-selling
– Strong diversified business across sectors and geographies
• Acquisition growth
– Funding available to support opportunities
– Bolt-on opportunities will continue
– But reduced focus over next few years
• Transformational growth
– Platform For Growth (PFG) programme: a global organisation transformation programme to:
• Create one global Coffey culture
• Globalise Coffey operations & service delivery processes
• Mobilise Coffey people to work across businesses
• Streamline systems & structures for greater efficiency
• Increase value to clients
26
Summary
• Record six months profit - organic and acquisition growth
• Strong earnings and cash flow across all businesses
• EPS* up 69% to 15.7 cents per share
• DPS up 21% to 8.5 cents per share
• Diversification strategy has Coffey well-positioned in challenging economy
• Transformation delivering cross-selling and one global Coffey culture
• Governments have committed to spending on infrastructure and international development programmes
* Pre VEO & SBP
Questions and answers
Appendix
29
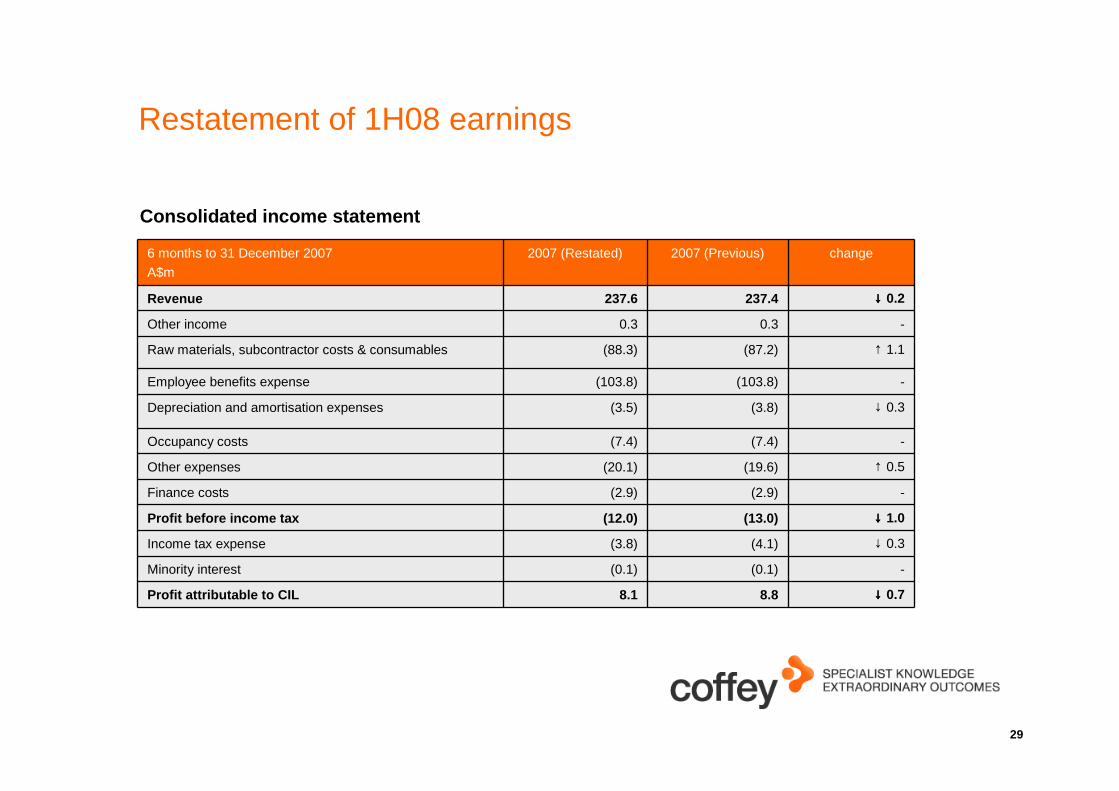
Restatement of 1H08 earnings
6 months to 31 December 2007
A$m
2007 (Restated) 2007 (Previous) change
Revenue 237.6 237.4 ↓↓↓↓ 0.2
Other income 0.3 0.3 -
Raw materials, subcontractor costs & consumables (88.3) (87.2) ↑ 1.1
Employee benefits expense (103.8) (103.8) -
Depreciation and amortisation expenses (3.5) (3.8) ↓ 0.3
Occupancy costs (7.4) (7.4) -
Other expenses (20.1) (19.6) ↑ 0.5
Finance costs (2.9) (2.9) -
Profit before income tax (12.0) (13.0) ↓↓↓↓ 1.0
Income tax expense (3.8) (4.1) ↓ 0.3
Minority interest (0.1) (0.1) -
Profit attributable to CIL 8.1 8.8 ↓↓↓↓ 0.7
Consolidated income statement
30
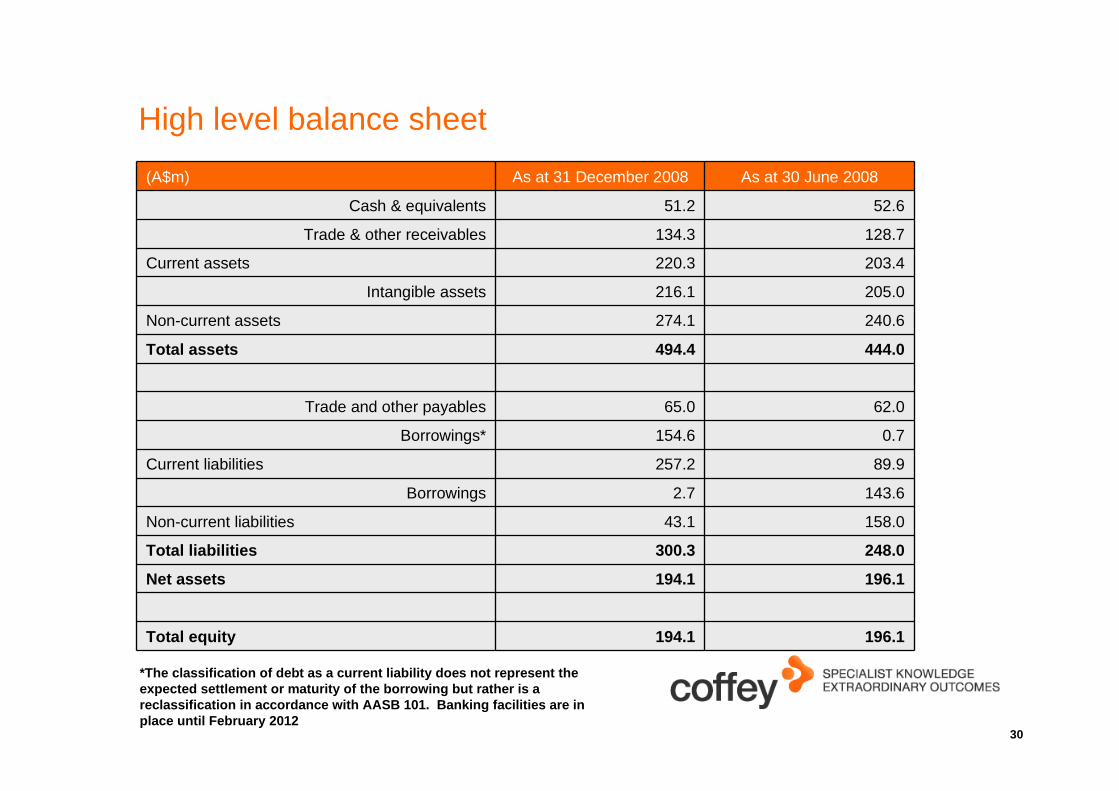
High level balance sheet
(A$m) As at 31 December 2008 As at 30 June 2008
Cash & equivalents 51.2 52.6
Trade & other receivables 134.3 128.7
Current assets 220.3 203.4
Intangible assets 216.1 205.0
Non-current assets 274.1 240.6
Total assets 494.4 444.0
Trade and other payables 65.0 62.0
Borrowings* 154.6 0.7
Current liabilities 257.2 89.9
Borrowings 2.7 143.6
Non-current liabilities 43.1 158.0
Total liabilities 300.3 248.0
Net assets 194.1 196.1
Total equity 194.1 196.1
*The classification of debt as a current liability does not represent the expected settlement or maturity of the borrowing but rather is areclassification in accordance with AASB 101. Banking facilities are in place until February 2012
31
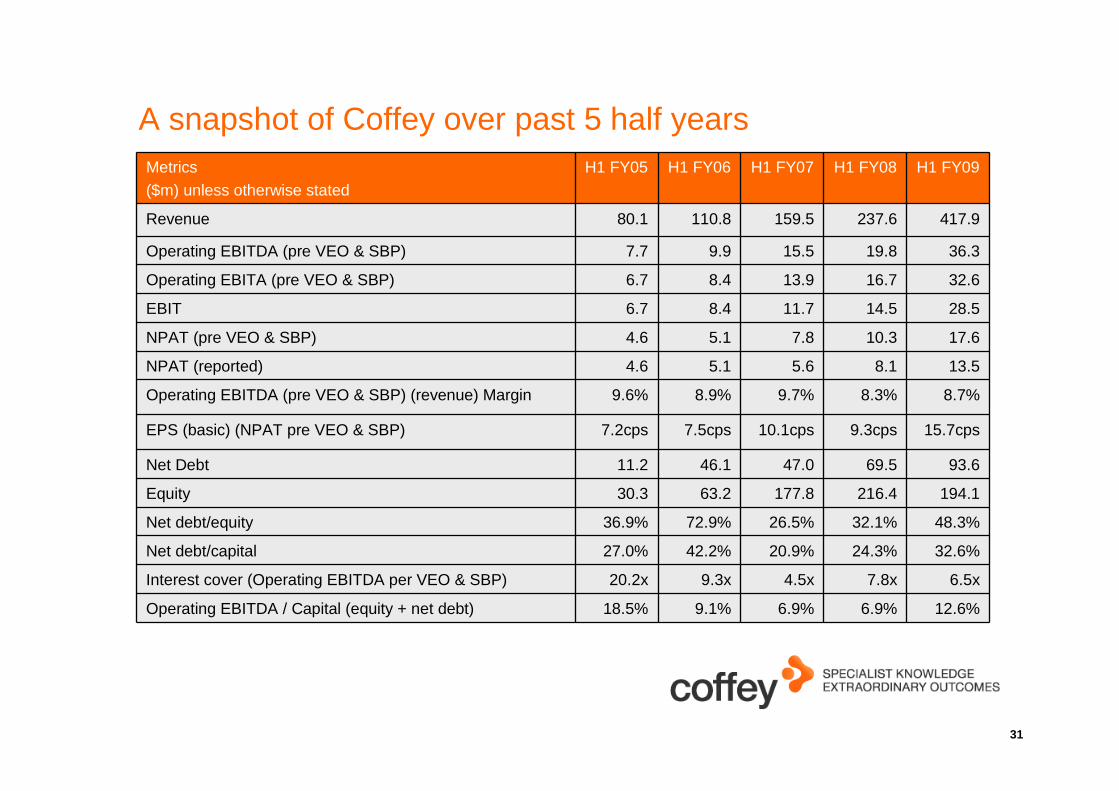
A snapshot of Coffey over past 5 half yearsMetrics($m) unless otherwise stated
H1 FY05 H1 FY06 H1 FY07 H1 FY08 H1 FY09
Revenue 80.1 110.8 159.5 237.6 417.9
Operating EBITDA (pre VEO & SBP) 7.7 9.9 15.5 19.8 36.3
Operating EBITA (pre VEO & SBP) 6.7 8.4 13.9 16.7 32.6
EBIT 6.7 8.4 11.7 14.5 28.5
NPAT (pre VEO & SBP) 4.6 5.1 7.8 10.3 17.6
NPAT (reported) 4.6 5.1 5.6 8.1 13.5
Operating EBITDA (pre VEO & SBP) (revenue) Margin 9.6% 8.9% 9.7% 8.3% 8.7%
EPS (basic) (NPAT pre VEO & SBP) 7.2cps 7.5cps 10.1cps 9.3cps 15.7cps
Net Debt 11.2 46.1 47.0 69.5 93.6
Equity 30.3 63.2 177.8 216.4 194.1
Net debt/equity 36.9% 72.9% 26.5% 32.1% 48.3%
Net debt/capital 27.0% 42.2% 20.9% 24.3% 32.6%
Interest cover (Operating EBITDA per VEO & SBP) 20.2x 9.3x 4.5x 7.8x 6.5x
Operating EBITDA / Capital (equity + net debt) 18.5% 9.1% 6.9% 6.9% 12.6%
32
Disclaimer
The material in this presentation is a summary of the results of Coffey International Limited (Coffey) for the 6 months ended 31 December 2008 and an update on Coffey’s activities and is current at the date of preparation, 27 February 2009. Further details are provided in the Company’s full year accounts and results announcement released on 27 February 2009.
No representation, express or implied, is made as to the fairness, accuracy, completeness or correctness of information contained in this presentation, including the accuracy, likelihood of achievement or reasonableness of any forecasts, prospects, returns or statements in relation to future matters contained in the presentation (“forward-looking statements”). Such forward-looking statements are by their nature subject to significant uncertainties and contingencies and are based on a number of estimates and assumptions that are subject to change (and in many cases are outside the control of Coffey and its Directors) which may cause the actual results or performance of Coffey to be materially different from any future results or performance expressed or implied by such forward-looking statements.
This presentation provides information in summary form only and is not intended to be complete. It is not intended to be relied upon as advice to investors or potential investors and does not take into account the investment objectives, financial situation or needs of any particular investor.
Due care and consideration should be undertaken when considering and analysing Coffey’s financial performance. All references to dollars are to Australian Dollars unless otherwise stated.
To the maximum extent permitted by law, neither Coffey nor its related corporations, Directors, employees or agents, nor any other person, accepts any liability, including, without limitation, any liability arising from fault or negligence, for any loss arising from the use of this presentation or its contents or otherwise arising in connection with it. This presentation should be read in conjunction with other publicly available material. Further information including historical results and a description of the activities of Coffey is available on our website, coffey.com