Embed Size (px)
Citation preview
Cognitive Radio Technology for Improving Capacity of Mobile Communication Systems in
Palestine
91
Cognitive Radio Technology for Improving Capacity
of Mobile Communication Systems in Palestine
Dr. Anwar M. Mousa University of Palestine-Gaza- Palestine
2014يناير –العدد السادس –مجلة جامعة فلسطين لألبحاث والدراسات
02
1. Introduction
Radio frequency regulators in the world found that most part of the
spectrum was inefficiently utilized [1]. Fixed spectrum assignment prevents
rarely used frequencies from being used even when any unlicensed users
would not cause noticeable interference to the assigned service. Joseph
Mitola [2] proposed the technology of Cognitive Radio (CR), during his
PhD thesis in 1998, as a promising technology to balance between spectrum
underutilization and spectrum scarcity. CR [3] is a model for wireless
communication in which either a network or a wireless node changes its
transmission or reception parameters to communicate efficiently without
interfering with licensed users. A transceiver in CR can intelligently detect
which communication channels are in use and which are not, and instantly
move into vacant channels while avoiding occupied ones. This optimizes the
use of available spectrum bands while minimizing interference to other
users. Hence CR has the potential to exploit the inefficiently utilized
licensed bands without causing interference to incumbent users.
Historically, up until now, the mobile industry has relied on spectrum
dedicated for mobile communication and licensed to a certain operator.
However, in situations where licensed spectrum is not available, other
possibilities for increasing the spectrum availability are of interest. This
could include the use of unlicensed spectrum, or secondary spectrum
primarily used for other communication services, as a complement to
operation in the licensed spectrum. Broadcast spectrum not used in some
areas is often referred to as “white space” [4]. The applicability of CR to
cellular communication relies on software-defined radio (SDR) [5] and it is
a relatively new area where further studies are required to assess the
feasibility and impact of such usage.
In CR, spectrum sensing locates unused spectrum segments and optimally
use these segments without harmful interference to the licensed user. This
includes measuring which frequencies are being used, when they are used,
estimating the location of transmitters and receivers, and determining signal
modulation. Results from sensing the environment would be used to
determine radio settings.
The main purpose of the research is to evaluate the gain of applying
cognitive radio technologies on mobile networks’ capacities and is
organized as follows: Section 2 presents main types of cognitive radio and
defines spectrum holes for both GSM and UMTS bands based on previous
Cognitive Radio Technology for Improving Capacity of Mobile Communication Systems in
Palestine
09
measurements and studies. In section 3, capacity of multiple channels was
investigated based on trunking theory where approximated linear equations
are derived for the relation between traffic intensity and the number of
channels per cell for the different values of grade of services. Section 4
illustrates the expected overall gain of applying cognitive radio technologies
on Palestinian mobile networks’ capacities and section 5 concludes the
article.
2. Cognitive radio (CR)
As the radio spectrum becomes a more scarce resource and the needs for
frequency bands are in steady increase, regulatory bodies all over the world
started to look at how to use spectrum more effectively by the idea of CR.
2.1 Types of cognitive radio
Depending on transmission and reception parameters, the main types of
cognitive radio [6]:
Full Cognitive Radio, in which all observable parameter by a
wireless node is considered.
Spectrum-Sensing Cognitive Radio, in which only the radio-
frequency spectrum is considered. Most research work focuses on
sensing methods where the chief problem is designing high-quality
spectrum-sensing devices and algorithms for exchanging spectrum-
sensing data between nodes.
Licensed-Band Cognitive Radio, capable of using bands assigned to
licensed users
Unlicensed-Band Cognitive Radio, which can only utilize unlicensed
parts of the radio frequency spectrum.
After detecting (sensing) the spectrum holes the following steps are carried
out for spectrum management:
Spectrum decision: choose the best available spectrum channel
Spectrum sharing: Provides a fair spectrum-scheduling method;
share the spectrum with primary users ,
Spectrum mobility: Process, by which a cognitive-radio user changes
its frequency of operation, allowing radio terminals to operate in the
best available frequency band.
2014يناير –العدد السادس –مجلة جامعة فلسطين لألبحاث والدراسات
00
2.2 Unused Spectrum (Spectrum Holes)
A spectrum hole is defined as a frequency band that is assigned to a primary
user exclusively, but is not allocated by this user at a specific time and place
[7]. A spectrum hole is also called white spaces where these spaces are free
of local interferers. White spaces can support dynamic allocation
techniques. On the other hand, black spaces are highly occupied by local
interferers and hence are no proper candidates for dynamic spectrum
allocation. Grey spaces come in between where these spaces are partially
occupied by interferers and can partially support dynamic allocation
techniques. The CR is expected to operate in the UHF band (frequency
range from 300MHz to 3GHz) within which the propagation of the
electromagnetic waves is favorable for mobile wireless communications
devices.
2.2.1 GSM band’s spectrum holes
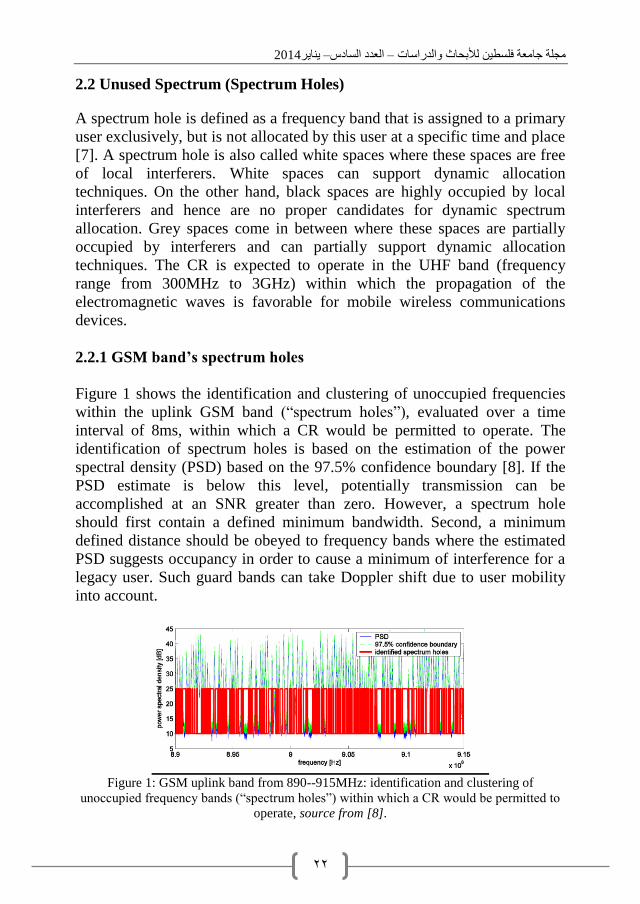
Figure 1 shows the identification and clustering of unoccupied frequencies
within the uplink GSM band (“spectrum holes”), evaluated over a time
interval of 8ms, within which a CR would be permitted to operate. The
identification of spectrum holes is based on the estimation of the power
spectral density (PSD) based on the 97.5% confidence boundary [8]. If the
PSD estimate is below this level, potentially transmission can be
accomplished at an SNR greater than zero. However, a spectrum hole
should first contain a defined minimum bandwidth. Second, a minimum
defined distance should be obeyed to frequency bands where the estimated
PSD suggests occupancy in order to cause a minimum of interference for a
legacy user. Such guard bands can take Doppler shift due to user mobility
into account.
Figure 1: GSM uplink band from 890--915MHz: identification and clustering of
unoccupied frequency bands (“spectrum holes”) within which a CR would be permitted to
operate, source from [8].
Cognitive Radio Technology for Improving Capacity of Mobile Communication Systems in
Palestine
02
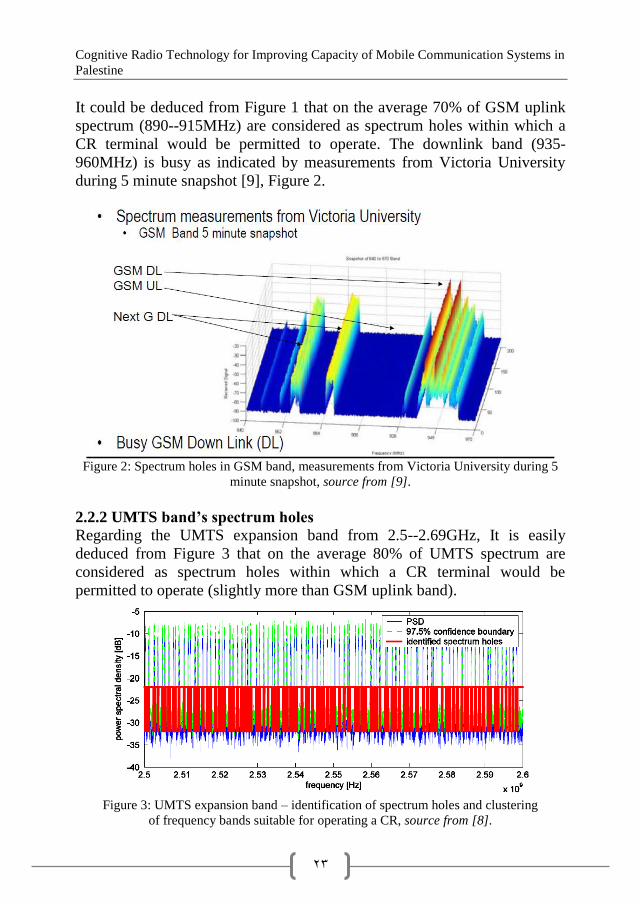
It could be deduced from Figure 1 that on the average 70% of GSM uplink
spectrum (890--915MHz) are considered as spectrum holes within which a
CR terminal would be permitted to operate. The downlink band (935-
960MHz) is busy as indicated by measurements from Victoria University
during 5 minute snapshot [9], Figure 2.
Figure 2: Spectrum holes in GSM band, measurements from Victoria University during 5
minute snapshot, source from [9].
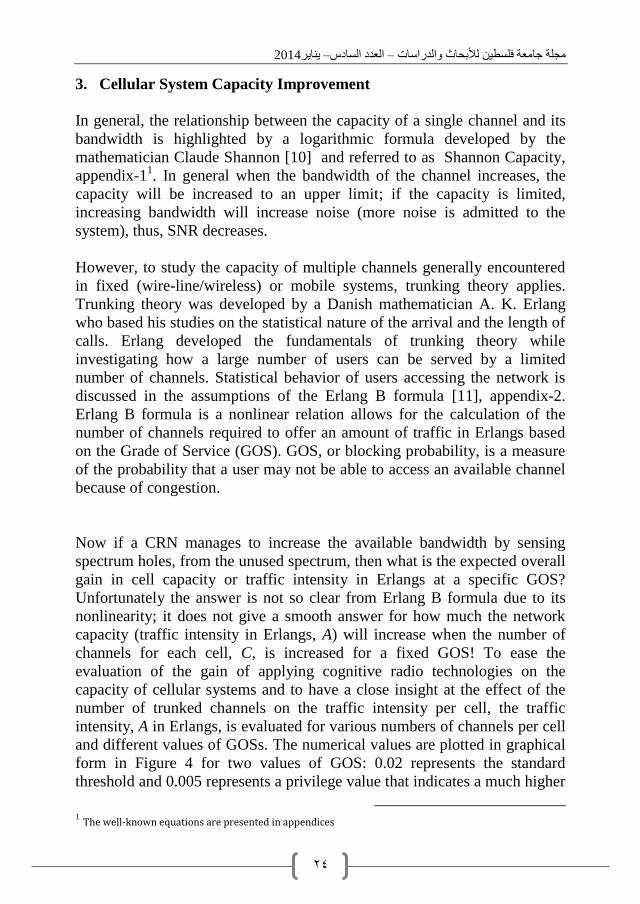
2.2.2 UMTS band’s spectrum holes
Regarding the UMTS expansion band from 2.5--2.69GHz, It is easily
deduced from Figure 3 that on the average 80% of UMTS spectrum are
considered as spectrum holes within which a CR terminal would be
permitted to operate (slightly more than GSM uplink band).
Figure 3: UMTS expansion band – identification of spectrum holes and clustering
of frequency bands suitable for operating a CR, source from [8].
2014يناير –العدد السادس –مجلة جامعة فلسطين لألبحاث والدراسات
02
3. Cellular System Capacity Improvement
In general, the relationship between the capacity of a single channel and its
bandwidth is highlighted by a logarithmic formula developed by the
mathematician Claude Shannon [10] and referred to as Shannon Capacity,
appendix-11. In general when the bandwidth of the channel increases, the
capacity will be increased to an upper limit; if the capacity is limited,
increasing bandwidth will increase noise (more noise is admitted to the
system), thus, SNR decreases.
However, to study the capacity of multiple channels generally encountered
in fixed (wire-line/wireless) or mobile systems, trunking theory applies.
Trunking theory was developed by a Danish mathematician A. K. Erlang
who based his studies on the statistical nature of the arrival and the length of
calls. Erlang developed the fundamentals of trunking theory while
investigating how a large number of users can be served by a limited
number of channels. Statistical behavior of users accessing the network is
discussed in the assumptions of the Erlang B formula [11], appendix-2.
Erlang B formula is a nonlinear relation allows for the calculation of the
number of channels required to offer an amount of traffic in Erlangs based
on the Grade of Service (GOS). GOS, or blocking probability, is a measure
of the probability that a user may not be able to access an available channel
because of congestion.
Now if a CRN manages to increase the available bandwidth by sensing
spectrum holes, from the unused spectrum, then what is the expected overall
gain in cell capacity or traffic intensity in Erlangs at a specific GOS?
Unfortunately the answer is not so clear from Erlang B formula due to its
nonlinearity; it does not give a smooth answer for how much the network
capacity (traffic intensity in Erlangs, A) will increase when the number of
channels for each cell, C, is increased for a fixed GOS! To ease the
evaluation of the gain of applying cognitive radio technologies on the
capacity of cellular systems and to have a close insight at the effect of the
number of trunked channels on the traffic intensity per cell, the traffic
intensity, A in Erlangs, is evaluated for various numbers of channels per cell
and different values of GOSs. The numerical values are plotted in graphical
form in Figure 4 for two values of GOS: 0.02 represents the standard
threshold and 0.005 represents a privilege value that indicates a much higher
1 The well-known equations are presented in appendices
Cognitive Radio Technology for Improving Capacity of Mobile Communication Systems in
Palestine
02
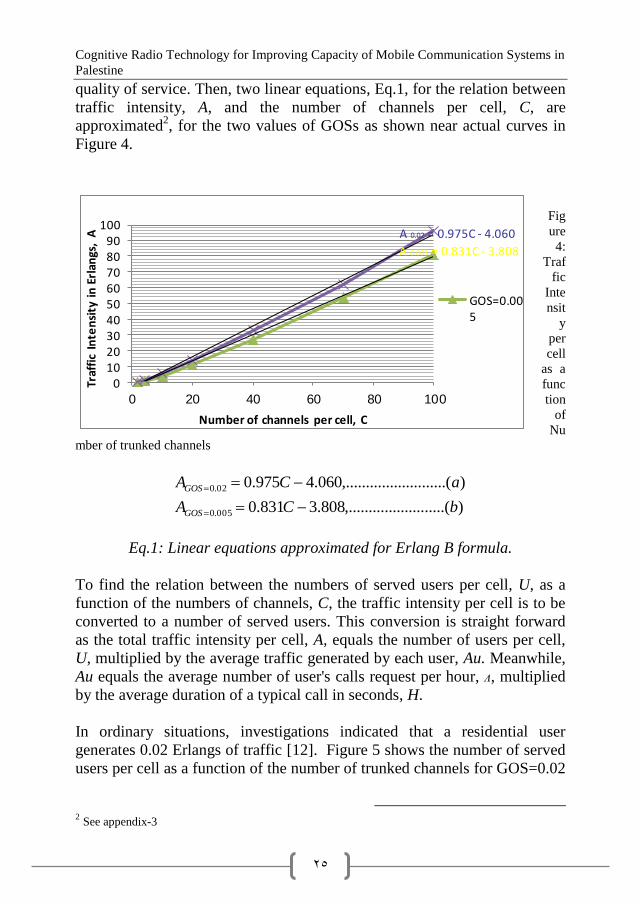
quality of service. Then, two linear equations, Eq.1, for the relation between
traffic intensity, A, and the number of channels per cell, C, are
approximated2, for the two values of GOSs as shown near actual curves in
Figure 4.
Fig
ure
4:
Traf
fic
Inte
nsit
y
per
cell
as a
func
tion
of
Nu
mber of trunked channels
).....(..........,.........808.3831.0
)......(..........,.........060.4975.0
005.0
02.0
bCA
aCA
GOS
GOS
Eq.1: Linear equations approximated for Erlang B formula.
To find the relation between the numbers of served users per cell, U, as a
function of the numbers of channels, C, the traffic intensity per cell is to be
converted to a number of served users. This conversion is straight forward
as the total traffic intensity per cell, A, equals the number of users per cell,
U, multiplied by the average traffic generated by each user, Au. Meanwhile,
Au equals the average number of user's calls request per hour, ᴧ, multiplied
by the average duration of a typical call in seconds, H.
In ordinary situations, investigations indicated that a residential user
generates 0.02 Erlangs of traffic [12]. Figure 5 shows the number of served
users per cell as a function of the number of trunked channels for GOS=0.02
2 See appendix-3
A 0.005 = 0.831C - 3.808
A 0.02 = 0.975C - 4.060
0102030405060708090
100
0 20 40 60 80 100
Traf
fic
Inte
nsi
ty i
n E
rlan
gs,
A
Number of channels per cell, C
GOS=0.005
2014يناير –العدد السادس –مجلة جامعة فلسطين لألبحاث والدراسات
02
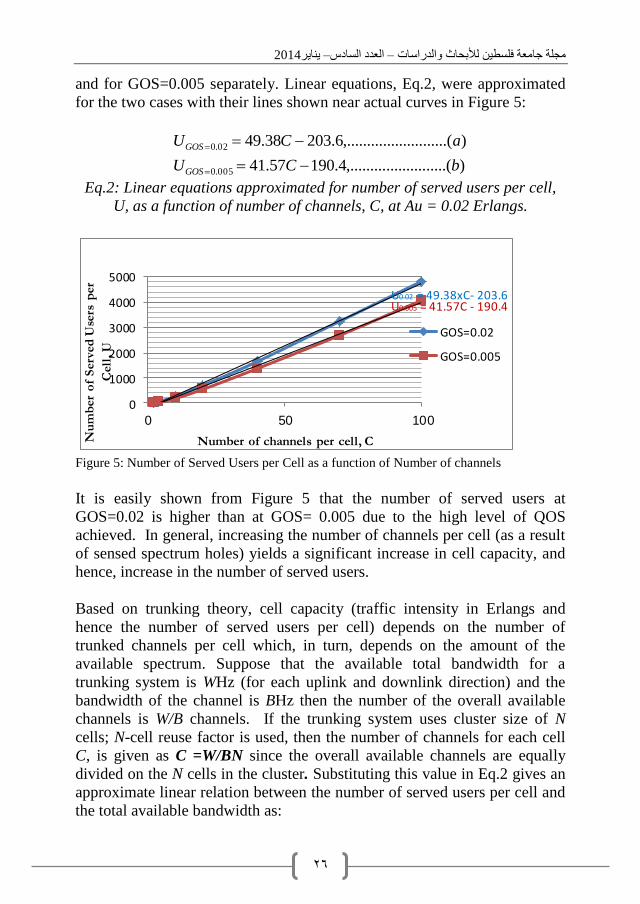
and for GOS=0.005 separately. Linear equations, Eq.2, were approximated
for the two cases with their lines shown near actual curves in Figure 5:
).....(..........,.........4.19057.41
)......(..........,.........6.20338.49
005.0
02.0
bCU
aCU
GOS
GOS
Eq.2: Linear equations approximated for number of served users per cell,
U, as a function of number of channels, C, at Au = 0.02 Erlangs.
Figure 5: Number of Served Users per Cell as a function of Number of channels
It is easily shown from Figure 5 that the number of served users at
GOS=0.02 is higher than at GOS= 0.005 due to the high level of QOS
achieved. In general, increasing the number of channels per cell (as a result
of sensed spectrum holes) yields a significant increase in cell capacity, and
hence, increase in the number of served users.
Based on trunking theory, cell capacity (traffic intensity in Erlangs and
hence the number of served users per cell) depends on the number of
trunked channels per cell which, in turn, depends on the amount of the
available spectrum. Suppose that the available total bandwidth for a
trunking system is WHz (for each uplink and downlink direction) and the
bandwidth of the channel is BHz then the number of the overall available
channels is W/B channels. If the trunking system uses cluster size of N
cells; N-cell reuse factor is used, then the number of channels for each cell
C, is given as C =W/BN since the overall available channels are equally
divided on the N cells in the cluster. Substituting this value in Eq.2 gives an
approximate linear relation between the number of served users per cell and
the total available bandwidth as:
U0.02 = 49.38xC- 203.6U0.005 = 41.57C - 190.4
0
1000
2000
3000
4000
5000
0 50 100
Nu
mb
er
of
Serv
ed
Use
rs p
er
Cell
, U
Number of channels per cell, C
GOS=0.02
GOS=0.005
Cognitive Radio Technology for Improving Capacity of Mobile Communication Systems in
Palestine
02
).....(..........,.........4.19057.41
)......(..........,.........6.20338.49
005.0
02.0
bBN
WU
aBN
WU
GOS
GOS
Eq.3: Approximated linear equations for number of served users per cell, U,
as a function of total available bandwidth
Finally if the total number of working cells in the trunked cellular system is
K, then the total number of served users Ut, is given by
).....(..........,.........4.19057.41
)......(..........,.........6.20338.49
005.0
02.0
bBN
KWU
aBN
KWU
GOS
GOS
t
t
Eq.4: Approximated linear equations for the total number of served users as
a function of total available bandwidth
If the average traffic generated by each user, Au, is increased to 0.05 Erlangs
then, from Eq.1 and solving for U=A/Au:
).(..........,.........16.7662.16
)......(..........,.........2.815.19
005.0
02.0
bCU
aCU
GOS
GOS
Eq.5: Linear equations approximated for number of served users per cell,
U, as a function of number of channels, C, at Au = 0.05 Erlangs.
And the linear equations approximated for the total number of served users
as a function of total available bandwidth are approximated as follows:
).....(..........,.........16.7662.16
)(....................,.........2.815.19
005.0
02.0
bBN
WU
aBN
WU
GOS
GOS
Eq.6: Linear equations approximated for the total number of served users
as a function of total available bandwidth at Au = 0.05 Erlangs.
2014يناير –العدد السادس –مجلة جامعة فلسطين لألبحاث والدراسات
02
4. Existing Palestinian Cellular Systems and expected overall gain
Although the political and economic situation in Palestine is considered as
the most unstable among all the middle-east countries, the Palestinian
telecom sector has been developing at a continuous rate over the last ten
years. In the mobile sector, there is, in practice, a competitive market
between the two legal and licensed Palestinian companies, Jawwal" and
"Wataniya Mobile", and four unlicensed and illegal Israeli mobile operators,
"Orange", "Cellcom", "Pelephone" and, to a small extent, "MIRS". These
Israeli operators use their base stations located inside the Israeli settlements
and offer their products and services illegally in the so-called “border
coverage overlap areas. Jawwal and Wataniya provide state-of-the-art
mobile voice and data telecommunications services in the West Bank and
Gaza Strip. Wataniya has the right to establish and provide a third
generation (3G) network and international telecommunications services but
no spectrum offered yet for 3G!
4.1 Frequency bandwidths assigned to Palestinian Operators
The total bandwidth offered for Jawwal to operate GSM 900 was around
2x2.4 MHz where 2.4 MHz are available for each direction (uplink or
downlink) in addition to 2.4 MHz share with Orange. Similarly, Wataniya is
allocated two blocks of 2.4MHz, one at 900MHz and one at 1800MHz, with
the former being temporary while a more permanent allocation was sought
[13]. That permanent allocation was supposed to come from Orange's
operations in Israel, or from the Palestine incumbent Jawwal.
4.2 Expected overall gain in Palestinian mobile networks’ capacity
As mentioned above, the total bandwidth offered for Palestinian operator
(whether Jawwal or Wataniya) to operate GSM network was around 2.4
MHz in each direction (uplink and downlink). Taking into account that the
GSM channel bandwidth is 200 KHz, hence, from Equation 3, 2400/200=12
total available frequency-channels. If N-cell cluster size is used then the
number of frequency-channels per cell will 12/N. Remembering that TDMA
is also implemented in GSM system where each channel is divided into 8
time slots, hence 12*8/N useful resources (time slots-channel) is available
for each cell. The capacity of a cellular system is directly proportional to the
number of times a cluster is replicated in a fixed service area. The cluster
uses the complete set of available channels, W/B. If N is reduced while the
cell size is kept constant, more clusters are required to cover the service area
and hence more capacity is achieved. The increased capacity is due to
increased number of channels allocated per cell. Even though, the smallest
Cognitive Radio Technology for Improving Capacity of Mobile Communication Systems in
Palestine
01
value of N is desirable, however, reduced N yields increased co-channel
interference because co-channel cells are located much closer.
0
2000
4000
6000
8000
10000
12000
14000
1200 2400 3600 4800 6000 7200 8400 9600 10800 12000 13200 14400 15600 16800 18000 19200 20400 21600 22800 24000 25200
Nu
mb
er
of
serv
ed
use
rs p
er
cell,
Au
=0
.02
Total available bandwidth (KHz)
N=7, GOS=0.02
N=4, GOS=0.02
N=7, GOS=0.005
N=4, GOS=0.005
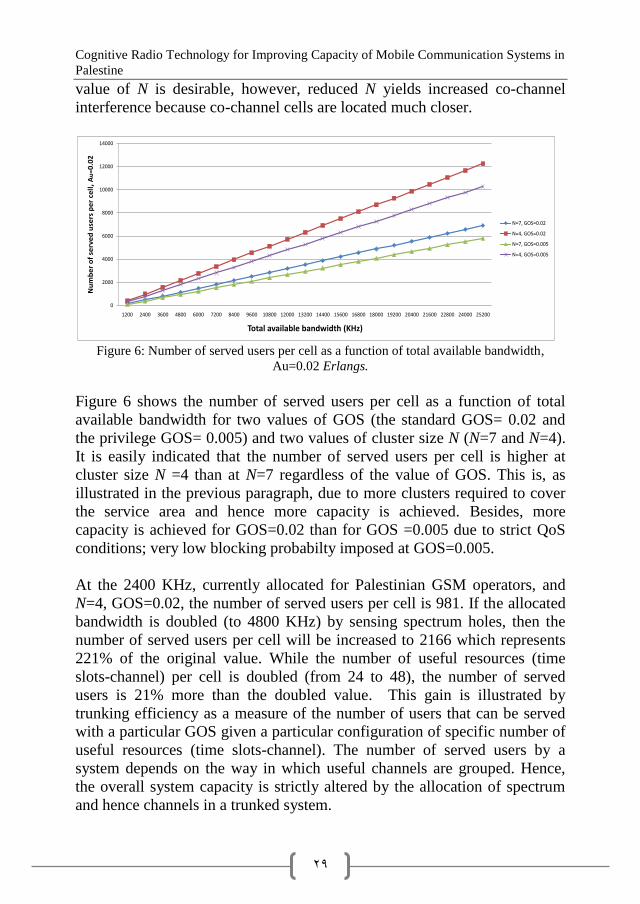
Figure 6: Number of served users per cell as a function of total available bandwidth,
Au=0.02 Erlangs.
Figure 6 shows the number of served users per cell as a function of total
available bandwidth for two values of GOS (the standard GOS= 0.02 and
the privilege GOS= 0.005) and two values of cluster size N (N=7 and N=4).
It is easily indicated that the number of served users per cell is higher at
cluster size N =4 than at N=7 regardless of the value of GOS. This is, as
illustrated in the previous paragraph, due to more clusters required to cover
the service area and hence more capacity is achieved. Besides, more
capacity is achieved for GOS=0.02 than for GOS =0.005 due to strict QoS
conditions; very low blocking probabilty imposed at GOS=0.005.
At the 2400 KHz, currently allocated for Palestinian GSM operators, and
N=4, GOS=0.02, the number of served users per cell is 981. If the allocated
bandwidth is doubled (to 4800 KHz) by sensing spectrum holes, then the
number of served users per cell will be increased to 2166 which represents
221% of the original value. While the number of useful resources (time
slots-channel) per cell is doubled (from 24 to 48), the number of served
users is 21% more than the doubled value. This gain is illustrated by
trunking efficiency as a measure of the number of users that can be served
with a particular GOS given a particular configuration of specific number of
useful resources (time slots-channel). The number of served users by a
system depends on the way in which useful channels are grouped. Hence,
the overall system capacity is strictly altered by the allocation of spectrum
and hence channels in a trunked system.
2014يناير –العدد السادس –مجلة جامعة فلسطين لألبحاث والدراسات
22
The standard total bandwidth allocated for GSM 900 system is 25 MHz [14]
of which a small percentage (less than 10%; 2.4 MHz) is granted for
Palestinian operators and the rest is used by the Israeli operators. The
application of cognitive radio will clearly increase the capacity of
Palestinian cellular systems by searching the unused spectrum at the Israeli
side and use it at the free time. Then, what is the average percentage of the
unused spectrum (Spectrum Holes) of the Israeli part and for how much
average time? Hence, what is the expected overall gain in Palestinian
systems capacity? Given that 70% of GSM spectrum (about 17.5 MHz) is
considered as identified spectrum holes within which a CRN would be
permitted to operate, this unused spectrum constitutes a huge room for
increasing bandwidth and the number of served users in a specific time and
location. It should be stressed on the fact that not all the 70% of unused
spectrum could be used by the CRN without interference in a specific time
and location. The amount of sensed spectrum holes depends on the
efficiency of the CRN and the applied spectrum sensing techniques. At
some time and location, the bandwidth available to CRN could be doubled a
number of times given that efficient spectrum sensing techniques are used.
At other time and same or other location the bandwidth available to CRN
could to be increased at some percentage.
If the Palestinian GSM network, enhanced with CR, manages to sense 35%
of the spectrum holes in this band, then the expected increase in bandwidth
will be about 6 MHz; (0,35*17.5 MHz). The ratio 35% is chosen since the
power of the Palestinian mobile networks represents, at maximum, half the
power of the Israeli mobile networks. Adding 6 MHz to 2.4MHz yields 8.4
MHz and from Figure 6, 8400 KHz serves 3944users per cell at GOS=0.02
and cluster size of 4. Comparing this result with only 981users per cell at the
current available 2400 KHz, the gain is more than 400% increase in number
of served users. At higher cluster size (N=7) with same GOS =0.02, lower
number users per cell are served, enjoying lower co-channel interference.
However the increase in bandwidth form 2400 KHz to 8400 KHz gives a
slightly higher gain in number of served users; 457%, from 473 users per
cell to 2166. When GOS=0.005, Figure 6 shows higher numbers of served
users at N =4 than at N=7 for GOS =0.02. This indicates that the effect of
decreased size of the cluster is more significant than the effect of decreased
GOS. The lowest numbers of served users is seen at N=7 for GOS=0.005 as
expected.
Cognitive Radio Technology for Improving Capacity of Mobile Communication Systems in
Palestine
29
The benefits of CRN deos not stop at increasing the number of served users.
However, if no need to increase the number of served users in a specific
area, benefits of CRN could be reflected in the following aspects:
increasing the cluster size, hence inter-cell interference is decreased,
increasing the average traffic generated by each user, hence more
service is offered,
decreasing the GOS (blocking probability), hence more user'
satisfaction is achieved
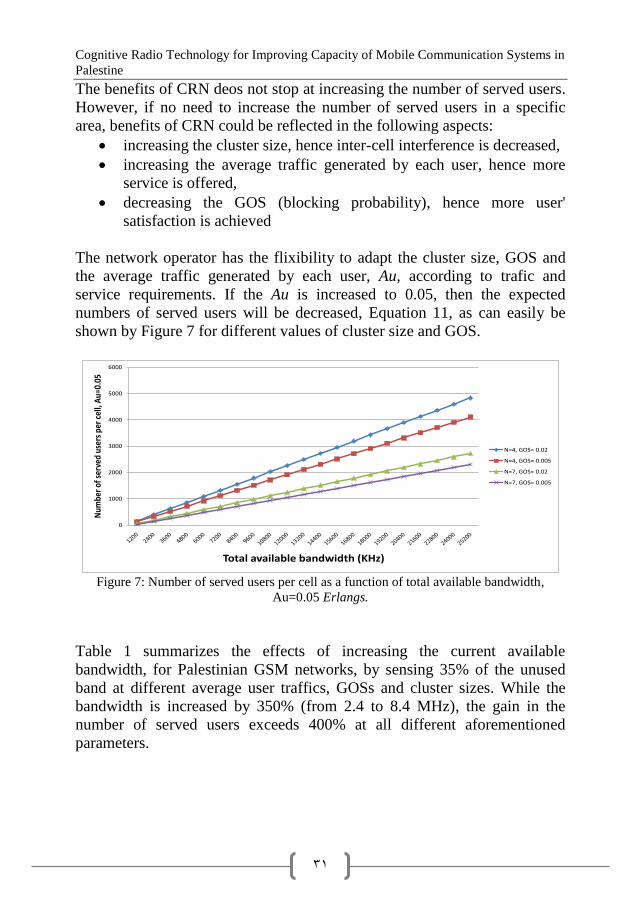
The network operator has the flixibility to adapt the cluster size, GOS and
the average traffic generated by each user, Au, according to trafic and
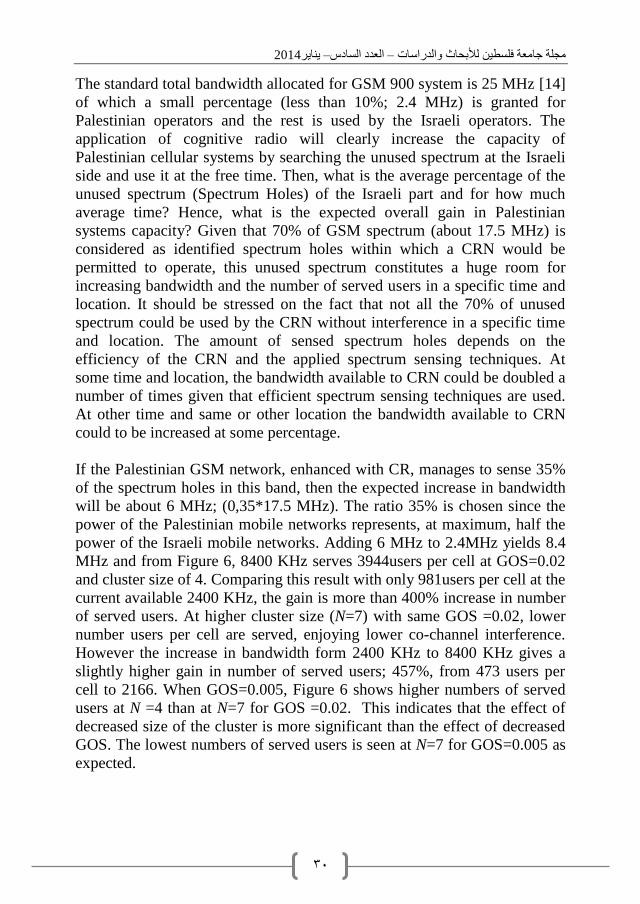
service requirements. If the Au is increased to 0.05, then the expected
numbers of served users will be decreased, Equation 11, as can easily be
shown by Figure 7 for different values of cluster size and GOS.
0
1000
2000
3000
4000
5000
6000
Num
ber o
f ser
ved
user
s pe
r ce
ll, A
u=0.
05
Total available bandwidth (KHz)
N=4, GOS= 0.02
N=4, GOS= 0.005
N=7, GOS= 0.02
N=7, GOS= 0.005
Figure 7: Number of served users per cell as a function of total available bandwidth,
Au=0.05 Erlangs.
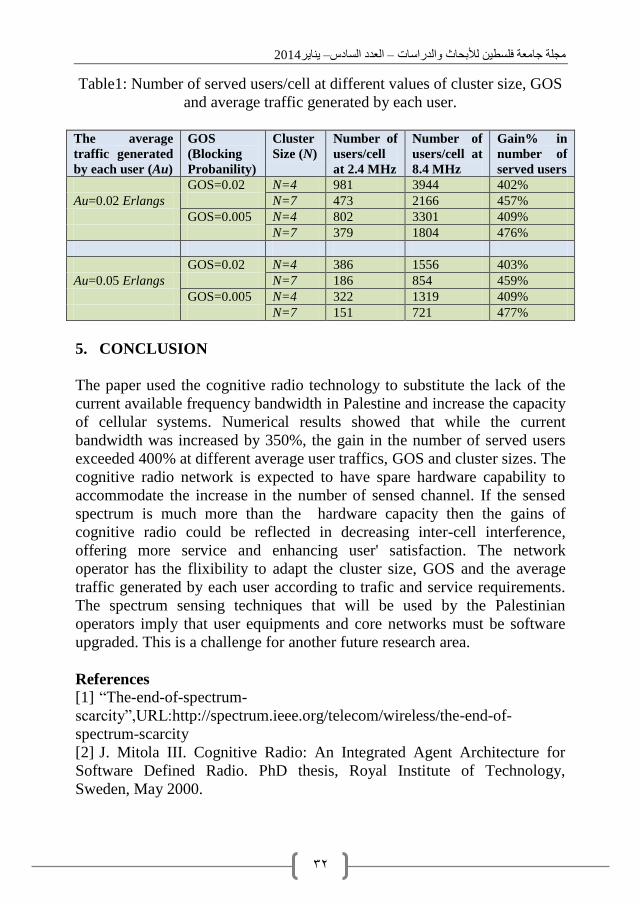
Table 1 summarizes the effects of increasing the current available
bandwidth, for Palestinian GSM networks, by sensing 35% of the unused
band at different average user traffics, GOSs and cluster sizes. While the
bandwidth is increased by 350% (from 2.4 to 8.4 MHz), the gain in the
number of served users exceeds 400% at all different aforementioned
parameters.
2014يناير –العدد السادس –مجلة جامعة فلسطين لألبحاث والدراسات
20
Table1: Number of served users/cell at different values of cluster size, GOS
and average traffic generated by each user.
The average
traffic generated
by each user (Au)
GOS
(Blocking
Probanility)
Cluster
Size (N)
Number of
users/cell
at 2.4 MHz
Number of
users/cell at
8.4 MHz
Gain% in
number of
served users
GOS=0.02 N=4 981 3944 402%
Au=0.02 Erlangs N=7 473 2166 457%
GOS=0.005 N=4 802 3301 409%
N=7 379 1804 476%
GOS=0.02 N=4 386 1556 403%
Au=0.05 Erlangs N=7 186 854 459%
GOS=0.005 N=4 322 1319 409%
N=7 151 721 477%
5. CONCLUSION
The paper used the cognitive radio technology to substitute the lack of the
current available frequency bandwidth in Palestine and increase the capacity
of cellular systems. Numerical results showed that while the current
bandwidth was increased by 350%, the gain in the number of served users
exceeded 400% at different average user traffics, GOS and cluster sizes. The
cognitive radio network is expected to have spare hardware capability to
accommodate the increase in the number of sensed channel. If the sensed
spectrum is much more than the hardware capacity then the gains of
cognitive radio could be reflected in decreasing inter-cell interference,
offering more service and enhancing user' satisfaction. The network
operator has the flixibility to adapt the cluster size, GOS and the average
traffic generated by each user according to trafic and service requirements.
The spectrum sensing techniques that will be used by the Palestinian
operators imply that user equipments and core networks must be software
upgraded. This is a challenge for another future research area.
References
[1] “The-end-of-spectrum-
scarcity”,URL:http://spectrum.ieee.org/telecom/wireless/the-end-of-
spectrum-scarcity
[2] J. Mitola III. Cognitive Radio: An Integrated Agent Architecture for
Software Defined Radio. PhD thesis, Royal Institute of Technology,
Sweden, May 2000.
Cognitive Radio Technology for Improving Capacity of Mobile Communication Systems in
Palestine
22
[3] Cognitive Radio Definitions and Nomenclature: SDR Forum, Cognitive
Radio Working Group 6, January 10 2006.
[4] “White-Space-Database-
Administration”,URL:http://www.fcc.gov/encyclopedia/white-space-
database-administration
[5] Dillinger, M. et al. "Software defined radio: architectures, systems, and
functions". Wiley, 2003
[6] Li, Z. et al. “A Distributed Consensus-Based Cooperative Spectrum
Sensing in Cognitive Radios,” IEEE Trans. Vehicular Technology, vol. 59,
no. 1, pp. 383–393, Jan. 2010.
[7] Haykin, S "Cognitive Radio: Brain-empowered Wireless
Communications", IEEE Journal on Selected Areas of Communications,
vol. 23, No. 2, pp. 201–220, 2005.
[8] Ofcom, Qinetiq "CR Implementation for Spectral Gains Analysis"–
Volume 2, 2006, pp 89-110
[9] Faulkner, M., Conder, Ph. “Cognitive Radio: Spectrum, the next
frontier” Lund Circuit Design Workshop-2009.
[10] Thomas M. et al. "Elements of Information Theory", John Wiley &
Sons, (2006), New York.
[11] Theodore S. Rappaport, (Wireless Communications-Principles
and Practices), Second Edition 2004.
[12] “Teletrafic Engineering”, URL:
http://en.wikiversity.org/wiki/Teletraffic_engineering/Trunking.
[13] “Telecommunication Sector-Frequency Allocation” URL:
http://www.mtit.gov.ps/
[14] 3GPP TS 05.05 version 8.20.0 Release 1999 Pages 9 and 10
Biography
Anwar Mousa is currently working as an Associate Professor at the College
of Information Technology at the University of Palestine. He was granted
his PhD on 4G Cellular and WLAN Inter-working Networks from the
National Technical University of Athens, Department of Electrical and
Computer Engineering in 2004. He obtained his DEA in Digital
Telecommunication Systems from EcoleNationaleSupérieure des
Télécommunications, Paris in 1996 and BSc in Electronic Engineering from
Middle East Technical University, Ankara in 1992.
2014يناير –العدد السادس –مجلة جامعة فلسطين لألبحاث والدراسات
22
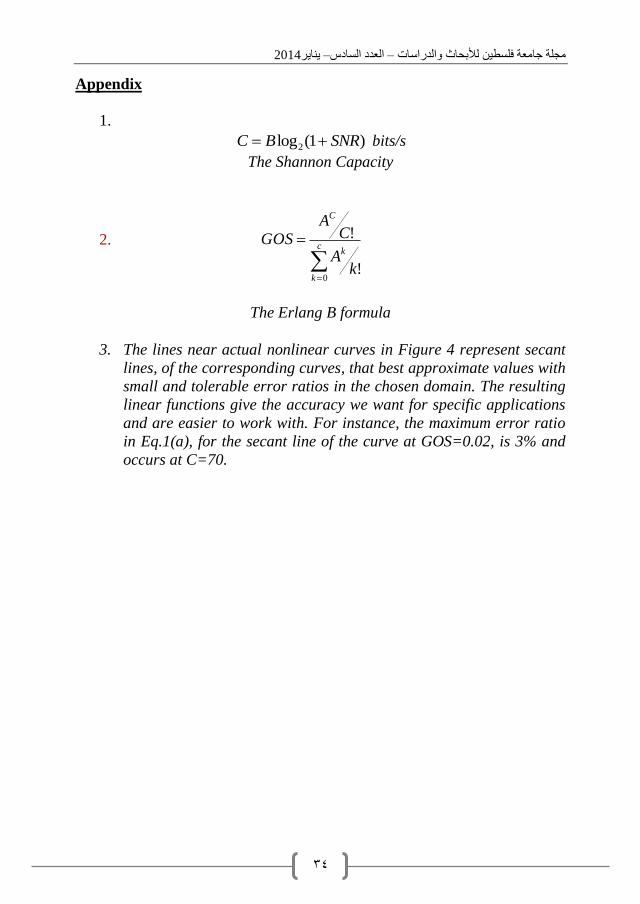
Appendix
1.
)1(log2 SNRBC bits/s
The Shannon Capacity
2.
c
k
k
C
kA
CA
GOS
0!
!
The Erlang B formula
3. The lines near actual nonlinear curves in Figure 4 represent secant
lines, of the corresponding curves, that best approximate values with
small and tolerable error ratios in the chosen domain. The resulting
linear functions give the accuracy we want for specific applications
and are easier to work with. For instance, the maximum error ratio
in Eq.1(a), for the secant line of the curve at GOS=0.02, is 3% and
occurs at C=70.