Embed Size (px)
Citation preview

BABSON COLLEGE FUND Capital One (COF)
BCF – Executive Portfolio Team 1/109/28/12
Rating: BUY Price Target: USD $ 65.00
Close 9/27/12
Price $56.96
Shares Outstanding (mm)
580.9
Market Cap (bn) $32,478Source: Thomson ONE
Basic Information
Beta 1.45
2011 BV Per Share $64.50
Trailing P/E 9.5
WACC 5.96%
P/BV 0.85
Forward P/E (NTM) 9.1
Dividend Yield 0.35%
Tier‐1 Capital Ratio 9.9%
EV/EBITDA 11.81
Source: Thomson ONE, Capital IQ, BCF Estimates
Company Overview
Capital One Financial Corp. is a diversified financial services company. The company and its affiliates subsidiaries offer a range of financial products and services to consumers, small businesses and commercial clients through branches, the internet and other distribution channels. It has three segments: credit cards, consumer banking/loans and commercial banking. In Feb. ’12, COF purchased ING Direct and in June ’12, purchased HSBC’s consumer portfolio. Source: Thomson ONE
Analysts
BCF Executive Portfolio Team: Peter Scannapieco Jason Breton
http://invest.babson.edu
Capital One Financial Corp. (NYSE: COF) Industry: Financial Services – Consumer Finance
Source: Thomas One, Bloomberg, and BCF Estimates
Investment Thesis and Valuation We are initiating coverage on Capital One Financial Corp. (COF) with a BUY rating
and a price target of $65. The key drivers for the company along with our PT are:
1. An industry‐leading Tier‐1 Capital Ratio of ~10%, well above Basel 1 min. 2. The potential for an increase in dividend payouts and share repurchases 3. The recent acquisitions of ING Direct and HSBC’s consumer loans portfolio 4. Decreasing charge‐offs and delinquencies within their consumer portfolio 5. As exemplified below, an attractive historical TBV vs. its competitors: *9/27/12 Closing Prices: COF ($56.96), DFS ($39.71), AXP ($56.57), MA ($452.17) & V ($133.91):
COF Earnings Model Summary
($ in millions, except per share items) 2009 2010 2011 2012 2013 2014 2015
Total Revenue $12,983.0 $16,171.0 $16,279.0 $21,152.0 $23,028.0 $23,739.0 $25,681.0
% growth y/y 24.6% 0.7% 29.9% 8.9% 3.1% 8.2%
Operating Income ‐ EBIT $1,487.0 $4,267.0 $4,608.0 $6,626.0 $8,534.0 $8,778.0 $9,497.8
% Operating Margin 11.5% 26.4% 28.3% 31.3% 37.1% 37.0% 37.0%
Reported Net Income $320.0 $2,743.0 $3,121.0 $3,550.0 $4,064.0 $4,178.0 $4,588.0
EPS (BCF) $6.11 $6.99 $7.19 $7.90
EPS Consensus $0.74 $6.01 $6.80 $6.17 $6.87 $7.26 $8.19
Difference ($0.06) $0.12 ($0.07) ($0.29)
EstimatesActuals
0.00
5.00
10.00
15.00
20.00
25.00
30.00
35.00
40.00
2011 2010 2009 2008 2007 2006 2005 2004
COF
DFS
AXP
MA
V

BABSON COLLEGE FUND Capital One (COF)
BCF – Executive Portfolio Team 2/109/28/12
Key Investment Thesis:
COF’s Industry‐leading Tier‐1 Capital Ratio – With the acquisitions of ING Direct and HSBC’s US Card portfolio, COF qualified for having to comply with the Standardized and Advanced versions of Basel II. Unlike Basel III, II is more punitive on companies with relatively large subprime consumer loan concentrations and therefore impacts COF more than most other banks. However, our takeaway is that the implications of Basel II and III are manageable for the company and despite their impacts, COF’s capital ratios remain comfortably over minimums, which means the company should be in a good position to return capital next year from capital generation of these acquisitions. As reference, COF’s Tier‐1 Capital Ratio of 9.9% is well above the regulatory minimum of 4.5% in 2013 and furthermore, even above the minimum “plus buffer’” of 8%. Therefore, we believe the most likely scenario is a dividend increase and for comparison’s sake, below are COF’s competitors’ Tier‐1 Ratios which have recently increased their dividends:
Source: KBW Research Report
Capital Return via Increasing Dividend Payouts & Share Repurchases – While there remains a lot of uncertainty on how the ultimate regulatory requirements will impact the company; we continue to believe that the company should be in a good capital position given the strong earnings generation potential and its ability to return some portion of its capital‐surplus to shareholders.
ING Direct & HSBC –We believe Capital One has the ability to generate meaningful earnings in a challenged environment for financials via their complimentary acquisitions. The ING online platform provides a substantial deposit‐gathering platform that should serve as a funding vehicle for further asset generation and acquisitions. With its $27B HSBC acquisition, Capital One will replace ING's lower‐yielding securities and mortgages with higher‐yielding credit card receivables thereby increasing net interest margins.
Decreasing charge‐offs & delinquencies – COF’s 30‐plus –day delinquency rate has been relatively steady and near record lows at ~3% for the past five months, which gives us confidence that the company will be able to utilize their strong capital ratios and ability to return capital to shareholders.
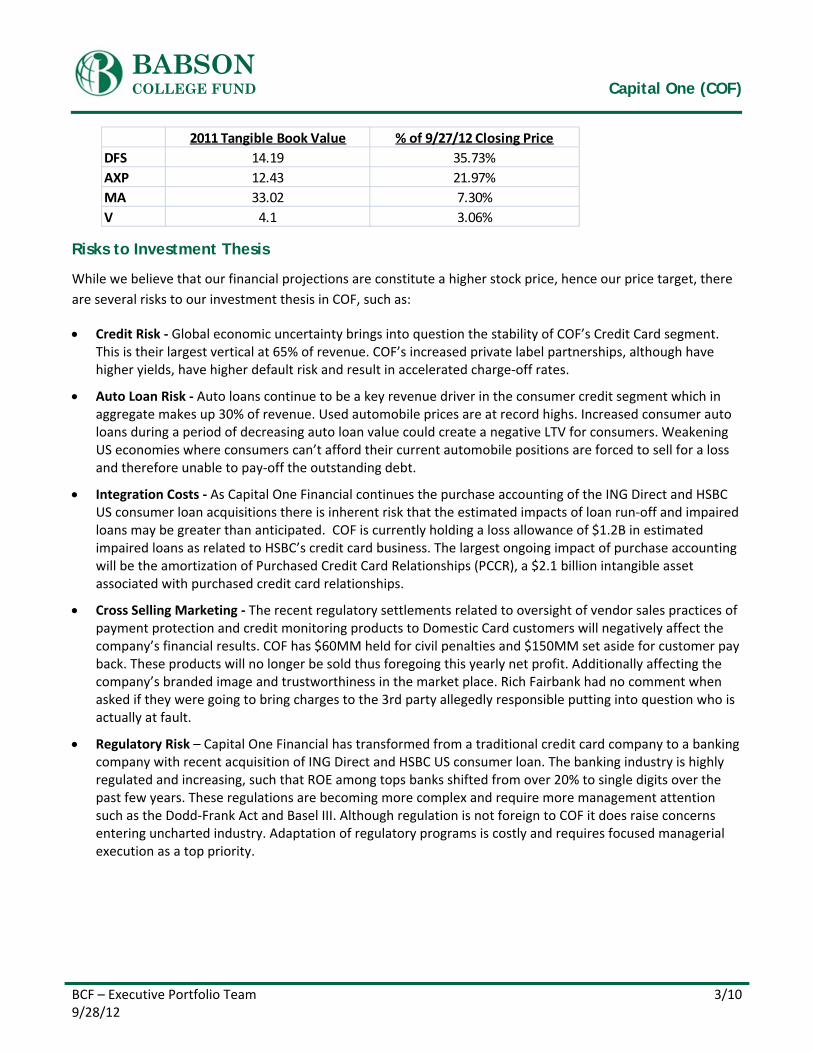
Tangible Book Value – COF’s 2011 tangible book value of $33.62 is the company’s net worth of physical assets if it were to ever go into liquidation. Therefore, based off COF’s 9/27/12 closing price of $56.96, the company’s TBV trades much closer to its current stock price (or 60% of which) than its competitors and indicates it is much more attractively valued on a TBV basis. For example, COF’s competitors’ TBV:
BABSON COLLEGE FUND Capital One (COF)
BCF – Executive Portfolio Team 3/109/28/12
Risks to Investment Thesis
While we believe that our financial projections are constitute a higher stock price, hence our price target, there
are several risks to our investment thesis in COF, such as:
Credit Risk ‐ Global economic uncertainty brings into question the stability of COF’s Credit Card segment. This is their largest vertical at 65% of revenue. COF’s increased private label partnerships, although have higher yields, have higher default risk and result in accelerated charge‐off rates.
Auto Loan Risk ‐ Auto loans continue to be a key revenue driver in the consumer credit segment which in aggregate makes up 30% of revenue. Used automobile prices are at record highs. Increased consumer auto loans during a period of decreasing auto loan value could create a negative LTV for consumers. Weakening US economies where consumers can’t afford their current automobile positions are forced to sell for a loss and therefore unable to pay‐off the outstanding debt.
Integration Costs ‐ As Capital One Financial continues the purchase accounting of the ING Direct and HSBC US consumer loan acquisitions there is inherent risk that the estimated impacts of loan run‐off and impaired loans may be greater than anticipated. COF is currently holding a loss allowance of $1.2B in estimated impaired loans as related to HSBC’s credit card business. The largest ongoing impact of purchase accounting will be the amortization of Purchased Credit Card Relationships (PCCR), a $2.1 billion intangible asset associated with purchased credit card relationships.
Cross Selling Marketing ‐ The recent regulatory settlements related to oversight of vendor sales practices of payment protection and credit monitoring products to Domestic Card customers will negatively affect the company’s financial results. COF has $60MM held for civil penalties and $150MM set aside for customer pay back. These products will no longer be sold thus foregoing this yearly net profit. Additionally affecting the company’s branded image and trustworthiness in the market place. Rich Fairbank had no comment when asked if they were going to bring charges to the 3rd party allegedly responsible putting into question who is actually at fault.
Regulatory Risk – Capital One Financial has transformed from a traditional credit card company to a banking company with recent acquisition of ING Direct and HSBC US consumer loan. The banking industry is highly regulated and increasing, such that ROE among tops banks shifted from over 20% to single digits over the past few years. These regulations are becoming more complex and require more management attention such as the Dodd‐Frank Act and Basel III. Although regulation is not foreign to COF it does raise concerns entering uncharted industry. Adaptation of regulatory programs is costly and requires focused managerial execution as a top priority.
2011 Tangible Book Value % of 9/27/12 Closing Price
DFS 14.19 35.73%
AXP 12.43 21.97%
MA 33.02 7.30%
V 4.1 3.06%

BABSON COLLEGE FUND Capital One (COF)
BCF – Executive Portfolio Team 4/109/28/12
Stock Performance
Stock Performance versus the SPX Index over the last one years
Stock Performance versus the SPX Index over the last five years
Source: Bloomberg

BABSON COLLEGE FUND Capital One (COF)
BCF – Executive Portfolio Team 5/109/28/12
BUSINESS DESCRIPTION
Company Profile
Capital One Financial Corporation is a financial holding company whose subsidiaries, which include Capital One, N.A., Capital One Bank (USA), N. A., and ING Bank, fsb, had $213.9 billion in deposits and $296.6 billion in total assets outstanding as of June 30, 2012. Capital One offers a broad spectrum of financial products and services to consumers, small businesses and commercial clients through a variety of channels. Capital One, N.A. has approximately 1,000 branch locations primarily in New York, New Jersey, Texas, Louisiana, Maryland, Virginia, and the District of Columbia. History
Capital One (COF), which began in 1984 as part of Signet Bank and was spun off in 1994, is the fifth‐largest credit
card issuer in the world, ranked by out standings, with over $50bn in credit card loans. Over the last decade, the
company has expanded beyond U.S. credit cards into Canada and the U.K., auto lending, and most recently
banking through the acquisitions of Hibernia in 2005 and North Fork in 2007. In February and June of 2012,
Capital One Financial announced the purchases of ING Direct and HSBC’s consumer loan portfolio.
Strengths, Weakness, Opportunities and Threats (SWOT) Analysis
Large market share amoung U.S. banks Integration costs
Buying power/acquisition of ING Direct Exposure to interest rates
Credit outperformance to large banks on aggregate Regulatory Risk
Partnerships with Private Label retailers
Divesified revenue sources
Recovering US banking industry Global economy
Growth in credit card and deposit business Credit Risk
through recent acquisitions Seasonality of spending
Auto loan segment accelerated growth Partnerships with Private Label retailers
Exposure to 3rd party related litigation
Strengths Weakness
Opportunities Threats

BABSON COLLEGE FUND Capital One (COF)
BCF – Executive Portfolio Team 6/109/28/12
Valuation Price Target
We are initiating coverage on Capital One Financial (COF) with a BUY rating and a price target of $65. This
valuation is based on a 2013 forward P/E multiple of 9.1x and 2013 EPS of $6.99 (BCF Estimate – below). Our
2012 estimated EPS is derived mainly from management’s expected range for revenue for the year.
Valuation Summary:
Valuation Summary
DCF $70.70
2011 Book Value $64.50
Fair Stock Value (BCF Estimate) $69.23
Forward PE 9.1x * 6.99 (2013 BCF Est. EPS) $63.61
Fair Equity Value (Price Target): $65.00
Valuation Methodology
Our $65 price target takes into consideration the following BCF estimates:
COF Earnings Model Summary Actuals Estimates ($ in millions, except per share items) 2009 2010 2011 2012 2013 2014 2015
Total Revenue $12,983.0 $16,171.0 $16,279.0 $21,152.0 $23,028.0 $23,739.0 $25,681.0
% growth y/y 24.6% 0.7% 29.9% 8.9% 3.1% 8.2%
Operating Income ‐ EBIT $1,487.0 $4,267.0 $4,608.0 $6,626.0 $8,534.0 $8,778.0 $9,497.8
% Operating Margin 11.5% 26.4% 28.3% 31.3% 37.1% 37.0% 37.0%
Reported Net Income $320.0 $2,743.0 $3,121.0 $3,550.0 $4,064.0 $4,178.0 $4,588.0
EPS (BCF) $6.11 $6.99 $7.19 $7.90
EPS Consensus $0.74 $6.01 $6.80 $6.17 $6.87 $7.26 $8.19
Difference ($0.06) $0.12 ($0.07) ($0.29)
Therefore, we believe that the Street is underestimating the following:
1.) COF’s Tier‐1 Capital Ratio should allow it to redeploy capital reserves in the form of increasing dividends
and share repurchases.
2.) The stock’s P/E and forward P/E resemble more of a bank’s multiple rather than a credit card or
transactions network, therefore, the stock price should increase as the earnings do (as we expect).
3.) Lastly, the stock’s historical book value and tangible book value appear to make it attractive investment:

BABSON COLLEGE FUND Capital One (COF)
BCF – Executive Portfolio Team 7/109/28/12
CompCo
Additionally, the following CompCo valuation model was derived using a forward P/E multiple of 9.23 and 2011
Tangible Book Value (TBV) of 33.62:
DCF Model
The following is the DCF model utilizing a formula derived from a financial equity analyst’s suggestion for
changes in working capital:
$0.00$10.00$20.00$30.00$40.00$50.00$60.00$70.00$80.00
2013Est.
2012Est.
2011 2010 2009 2008 2007 2006 2005 2004
Book Value:
Tangible BV:
9/27/12 ClosingPrice: $56.96
TBV
Company Price on 9Market C Enterprise Valu LTM 2012E LTM 2012E FY2011
American Express (AXP) 57.86 65.59 103.027 4.29 4.4 13.49 13.09 12.43Mastercard (MA) 459.52 57.35 52.402 16.74 21.8 27.45 21.12 33.02
Discover (DSF) 38.62 19.97 33.878 4.3 4.2 8.94 9.12 14.19Visa (V) 135 90.4 85.177 1.96 3.4 68.88 39.36 4.10
Citigroup 32.97 96.68 -35.91 3.55 3.5 9.29 9.42 49.76Wells Fargo (WFC) 34.76 183.61 206.64 3.06 3.3 11.36 10.41 18.00
Bank of America (BAC) 8.97 96.67 140.91 0.95 0.6 9.44 16.31 12.69JPM Chase (JPM) 40.68 154.53 10.16 4.34 4.8 9.37 8.56 32.97
Mean 19.8 15.9 22.1Median 10.4 11.8 16.1
High 68.88 39.36 49.76Low 8.94 8.56 4.10
Capital One Financial (COF) 57.26 33.27 63.16 6.1 6.1 11.9 9.23 57.26
Implied Value per Share Low HighLTM P/E 54.09 416.71
2012E P/E 51.81 238.12TBV 4.10 49.76
Average 36.67 234.86
Net Average 135.76
Basic EPS P/E
BABSON COLLEGE FUND Capital One (COF)
BCF – Executive Portfolio Team 8/109/28/12
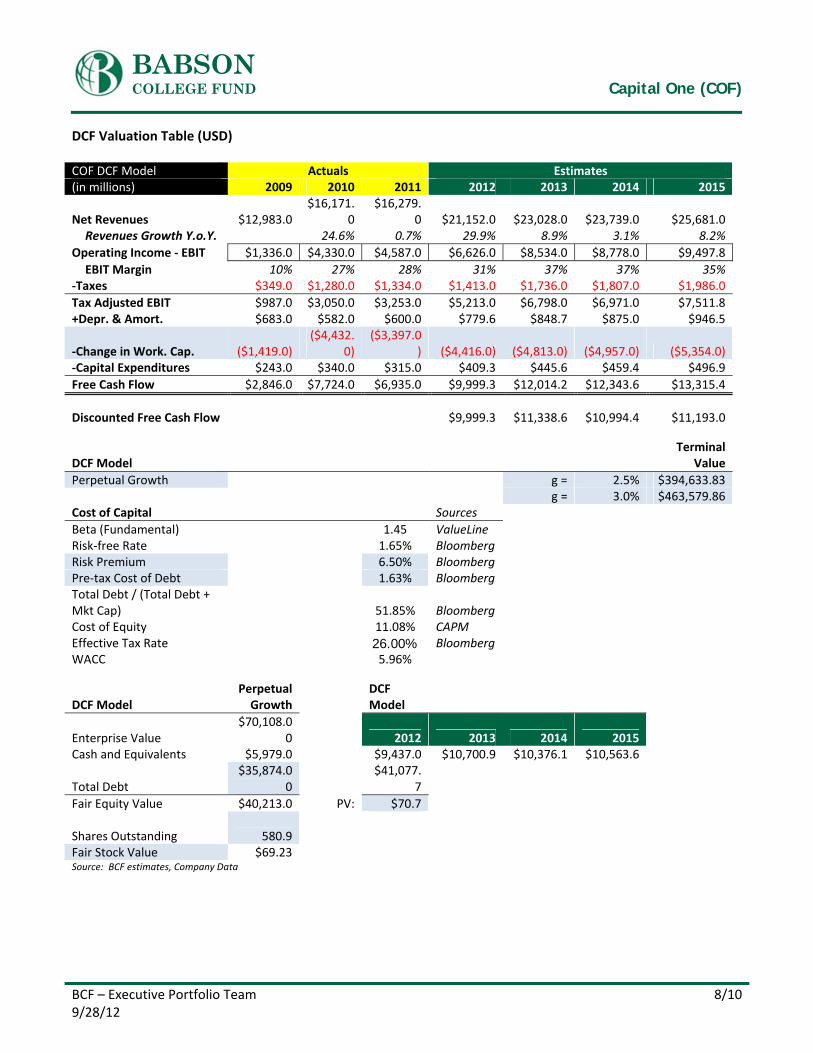
DCF Valuation Table (USD) COF DCF Model Actuals Estimates (in millions) 2009 2010 2011 2012 2013 2014 2015
Net Revenues $12,983.0 $16,171.
0 $16,279.
0 $21,152.0 $23,028.0 $23,739.0 $25,681.0 Revenues Growth Y.o.Y. 24.6% 0.7% 29.9% 8.9% 3.1% 8.2%
Operating Income ‐ EBIT $1,336.0 $4,330.0 $4,587.0 $6,626.0 $8,534.0 $8,778.0 $9,497.8
EBIT Margin 10% 27% 28% 31% 37% 37% 35%‐Taxes $349.0 $1,280.0 $1,334.0 $1,413.0 $1,736.0 $1,807.0 $1,986.0
Tax Adjusted EBIT $987.0 $3,050.0 $3,253.0 $5,213.0 $6,798.0 $6,971.0 $7,511.8 +Depr. & Amort. $683.0 $582.0 $600.0 $779.6 $848.7 $875.0 $946.5
‐Change in Work. Cap. ($1,419.0) ($4,432.
0) ($3,397.0
) ($4,416.0) ($4,813.0) ($4,957.0) ($5,354.0) ‐Capital Expenditures $243.0 $340.0 $315.0 $409.3 $445.6 $459.4 $496.9
Free Cash Flow $2,846.0 $7,724.0 $6,935.0 $9,999.3 $12,014.2 $12,343.6 $13,315.4
Discounted Free Cash Flow $9,999.3 $11,338.6 $10,994.4 $11,193.0
DCF Model Terminal
Value
Perpetual Growth g = 2.5% $394,633.83 g = 3.0% $463,579.86
Cost of Capital Sources
Beta (Fundamental) 1.45 ValueLineRisk‐free Rate 1.65% BloombergRisk Premium 6.50% BloombergPre‐tax Cost of Debt 1.63% BloombergTotal Debt / (Total Debt + Mkt Cap) 51.85% Bloomberg Cost of Equity 11.08% CAPMEffective Tax Rate 26.00% BloombergWACC 5.96%
DCF Model Perpetual Growth
DCF Model
Enterprise Value $70,108.0
0 2012 2013 2014 2015 Cash and Equivalents $5,979.0 $9,437.0 $10,700.9 $10,376.1 $10,563.6
Total Debt $35,874.0
0 $41,077.
7
Fair Equity Value $40,213.0 PV: $70.7
Shares Outstanding
580.9 Fair Stock Value $69.23 Source: BCF estimates, Company Data

BABSON COLLEGE FUND Capital One (COF)
BCF – Executive Portfolio Team 9/109/28/12
IMPORTANT DISCLOSURE
Babson College Fund
The Babson College Fund (BCF) is an academic program in which selected students manage a portion of the
Babson College endowment. The program seeks to provide a rich educational experience through the
development of investment research skills and the acquisition of equity analysis and portfolio management
experience.
Please visit http://invest.babson.edu for more information.
Analyst Contact Information Peter Scannapieco 617‐834‐0400 [email protected]
Jason Breton 617‐438‐8921 [email protected]
Definition of Ratings BUY: Expected to outperform the iShares Financial Sector Index Fund (IYF), producing above‐average returns.
HOLD: Expected to perform in line with the iShares Financial Sector Index Fund (IYF), producing average returns.
SELL: Expected to underperform the iShares Financial Sector Index Fund (IYF), producing below‐average returns.
References 1. BCF Estimates
2. Company website
3. Company SEC filings
4. CapitalIQ
5. Thomson ONE
6. Don Sauber – BNY Mellon Financial Services Equity Analyst (The Boston Company)
7. Bloomberg
8. KBW, Trefis & William Blair Equity Research Reports
BABSON COLLEGE FUND Capital One (COF)
BCF – Executive Portfolio Team 10/109/28/12