Embed Size (px)
Citation preview

Come Rain or Shine: Evidence on Flood Insurance Purchases in Florida
Erwann Michel-Kerjan The Wharton School
University of Pennsylvania
Carolyn Kousky Resources for
the Future
March 2009
Working Paper # 2009-03-16
_____________________________________________________________________ Risk Management and Decision Processes Center The Wharton School, University of Pennsylvania 3730 Walnut Street, Jon Huntsman Hall, Suite 500
Philadelphia, PA, 19104 USA
Phone: 215‐898‐4589 Fax: 215‐573‐2130
http://opim.wharton.upenn.edu/risk/ ___________________________________________________________________________

CITATION AND REPRODUCTION
This document appears as Working Paper of the Wharton Risk Management and Decision Processes Center, The Wharton School of the University of Pennsylvania. Comments are welcome and may be directed to the authors.
This paper may be cited as: Erwann Michel‐Kerjan and Carolyn Kousky, “Come Rain or Shine: Evidence on Flood Insurance Purchases in Florida,” Risk Management and Decision Processes Center, The Wharton School of the University of Pennsylvania, March 2009.
The views expressed in this paper are those of the author and publication does not imply their endorsement by the Wharton Risk Center and the University of Pennsylvania. This paper may be reproduced for personal and classroom use. Any other reproduction is not permitted without written permission of the authors.
THE WHARTON RISK MANAGEMENT AND DECISION PROCESSES CENTER
Established in 1984, the Wharton Risk Management and Decision Processes Center develops and promotes effective corporate and public policies for low‐probability events with potentially catastrophic consequences through the integration of risk assessment, and risk perception with risk management strategies. Natural disasters, technological hazards, and national and international security issues (e.g., terrorism risk insurance markets, protection of critical infrastructure, global security) are among the extreme events that are the focus of the Center’s research.
The Risk Center’s neutrality allows it to undertake large‐scale projects in conjunction with other researchers and organizations in the public and private sectors. Building on the disciplines of economics, decision sciences, finance, insurance, marketing and psychology, the Center supports and undertakes field and experimental studies of risk and uncertainty to better understand how individuals and organizations make choices under conditions of risk and uncertainty. Risk Center research also investigates the effectiveness of strategies such as risk communication, information sharing, incentive systems, insurance, regulation and public‐private collaborations at a national and international scale. From these findings, the Wharton Risk Center’s research team – over 50 faculty, fellows and doctoral students – is able to design new approaches to enable individuals and organizations to make better decisions regarding risk under various regulatory and market conditions.
The Center is also concerned with training leading decision makers. It actively engages multiple viewpoints, including top‐level representatives from industry, government, international organizations, interest groups and academics through its research and policy publications, and through sponsored seminars, roundtables and forums.
More information is available at http://opim.wharton.upenn.edu/risk.
1
Come Rain or Shine: Evidence on Flood Insurance Purchases in Florida*
Erwann Michel-Kerjan† The Wharton School
University of Pennsylvania
Carolyn Kousky Resources for
the Future
March 2009
* This paper results from a multi-year research project on Managing and Financing Large-Scale Risks in a New Era of Catastrophes undertaken by the Wharton School’s Risk Management and Decision Processes Center, in conjunction with Georgia State University, and in collaboration with a number of public and private organizations interested in the future of disaster insurance and mitigation. We would like to thank Neil Doherty, Martin Grace, Robert Klein, Howard Kunreuther, Edward Pasterick, Mark Pauly, Tim Scoville, and Richard Zeckhauser for insightful discussions on the market for catastrophic risks, the operation of the National Flood Insurance Program and their comments on previous versions of this article. Support from the Wharton Risk Management and Decision Processes Center, the Department of Economics of the Ecole Polytechnique (France), the Climate Decision Making Center (CDMC) located in the Department of Engineering and Public Policy (cooperative agreement between the NSF (SES-0345798) and Carnegie Mellon University), and a grant from the Federal Emergency Management Agency Preparedness Policy, Planning and Analysis Division in the National Preparedness Directorate, U.S. Department of Homeland Security (Grant # 2008-GA-T8-K004) is acknowledged. The views and opinions expressed are those of the authors and should not be interpreted as representing these organizations.
† Corresponding author: Erwann Michel-Kerjan, The Wharton School, University of Pennsylvania, 3730 Walnut St., Huntsman Hall, Room 556, Philadelphia, PA 19104, USA – Email: [email protected]

2
Come Rain or Shine:
Evidence on Flood Insurance Purchases in Florida
Abstract
This paper provides a detailed analysis of the operation of the National Flood Insurance
Program (NFIP) in Florida, which accounts for 40 percent of the NFIP portfolio. We study the
demand for flood insurance with a database of more than 7.5 million NFIP policies-in-force (the
largest ever studied) for the years 2000-2005, as well as all the NFIP claims filed in Florida. We
answer four questions: What are the characteristics of the buyers of flood insurance? What types
of contracts (deductibles and coverage levels) are purchased? Where and when are claims paid?
How are prices determined and how much does NFIP insurance cost?
Keywords: flood insurance market; public-private collaboration; National Flood Insurance
Program (NFIP); contract choice; Florida, decision-making under uncertainty.
JEL Classification: D78, D81, G22, Q54

3
1. Introduction
The economic costs of natural disasters have risen dramatically over the past several
decades. In the 1950s, damages from natural disasters worldwide were $53.6 billion, and by the
1990s, they had risen to $778.3 billion (Munich Re, 2008). The year 2008 alone inflicted
$200 billion in direct economic damages from natural catastrophes worldwide, the third most
costly year ever.
This growth in damages from natural disasters has made the question of how to manage
catastrophe risk more salient and has attracted the attention of policymakers and scholars alike.
Such radical changes in the rhythm and scale of disasters highlight the necessity of developing
adequate and sustainable financial protection for potential victims of future disasters. Insurance
has typically played a key role in providing financial protection against catastrophes. And insured
losses have been growing along with total damages. Looking at insured losses only, of the
25 most costly insured losses over the period 1970–2008, 14 occurred since 2001, 13 of which
were in the United States (Swiss Re, 2008a, b). We have now entered a new era of catastrophes.
Within the spectrum of natural hazards, floods are of particular concern because, during
the 20th century in the United States, they accounted for the most lives lost and the most
property damage of all natural disasters (Perry, 2000). In the United States, standard multiperil
homeowners insurance policies are normally required as a condition for a mortgage. These
policies cover damage from fire, wind, hail, lightning, and winter storms, among other common
non-catastrophe perils. Coverage for flood damage resulting from rising water is explicitly
excluded in homeowners insurance policies, but coverage for these losses has been available
through the federally managed National Flood Insurance Program (NFIP) since 1968.
4
Federal law requires property owners in 100-year floodplains—referred to as Special
Flood Hazard Areas (SFHAs)—with a mortgage from a federally backed or regulated lender to
purchase flood insurance; yet the effectiveness of this requirement in practice has been
questioned as take-up rates have been found to be quite low in many places across the country.
For example, after a 1998 flood in northern Vermont, the Federal Emergency Management
Agency (FEMA) found that 84 percent of residents in SFHAs did not have insurance, even
though 45 percent of these uninsured residents were required to purchase this coverage (Tobin
and Calfee, 2005). Hurricane Katrina in 2005 again revealed lower-than-expected take-up rates
for flood insurance.1 Lack of nationwide data on the number of properties in floodplains,
however, makes a complete assessment of NFIP market penetration difficult. Two recent studies
attempt to fill the gap. The first finds that, in a sample of coastal areas, 49 percent of eligible
properties participated in the NFIP (Kriesel and Landry, 2004). A 2006 RAND report estimates
that about 49 percent of properties in SFHAs purchased NFIP flood insurance, and only
1 percent of properties outside SFHAs purchased insurance, even though one-third of NFIP
policies are outside SFHAs (Dixon et al., 2006). The RAND estimates represent a national
average that masks high regional variation; take-up rates are much lower in some parts of the
country, such as the Midwest.
Despite these concerns about take-up rates, very little research has empirically examined
homeowners’ demand for flood insurance. Browne and Hoyt (2000) provide the first empirical
analysis. In spite of its important contribution to the field, the state-level aggregation of the data
limits the interpretation of the results for decision-making at an individual level. In this paper,
1 In the Louisiana parishes affected by Katrina, the percentage of homeowners with flood insurance ranged from 57.7 percent in St. Bernard’s to 7.3 percent in Tangipahoa. Only 40 percent of the residents in Orleans parish had flood insurance (Hartwig and Wilkinson, 2005). These low percentages are particularly striking because the NFIP requires that homes located in SFHAs purchase insurance as a condition for federally backed mortgages.

5
we extend the empirical work on the market for flood insurance by providing a detailed analysis
of the demand for NFIP insurance in the state of Florida. We draw on a unique database of all
NFIP flood insurance policies issued in the state over six consecutive years (2000–2005); this
amounts to more than 7.5 million policies. We chose to focus our analysis on the state of Florida
because it has become a world-peak zone for disaster financing and also because it has—at
around 40 percent—by far the largest share of policies of the entire NFIP. We use the data to
answer four specific questions about flood insurance demand in Florida: (1) What are the
characteristics of the buyers of flood insurance? (2) What type of contracts (deductibles and
coverage levels) are purchased? (3) Where and when are claims paid? (4) How are prices
determined and how much does NFIP insurance cost?
We find that most NFIP policies in Florida are for single-family, residential properties.
Just as the program overall is concentrated in only a few states, policies in Florida are highly
concentrated in a few counties. The majority of policies are located within 100-year floodplains,
but a sizable percentage of property owners nevertheless insure outside of these areas. The NFIP
places a limit on the amount of coverage property owners can purchase, but in Florida, about 75
percent of homeowners insure below this limit. Most homeowners insure both their home and its
contents, but about 13 percent do not insure their contents at all. However, these state-level
averages mask variations across counties.
On contract choices, we find that 98 percent of customers chose a deductible lower than
the maximum available, and almost 80 percent of policyholders chose the lowest possible
deductible (i.e., $500) in 2005. Our results on deductible choices are consistent with the literature
on other insurance markets, albeit much more pronounced than previous work and based here on
the largest sample ever studied. We also find, interestingly, that deductible choice varies with

6
flood zone, with more homeowners in the riskiest areas—where the mandatory purchase
requirement applies—choosing a higher deductible. Not many individuals appear to insure only
catastrophes, as those at the limit of coverage are more likely to choose the lowest possible
deductible. As anticipated, we also find that people have reacted to the 2004 floods in Florida by
choosing a lower deductible and higher limit then they previously did.
An analysis of the determinants of claims payments finds that claims are higher in 100-
year floodplains and lower when a property is elevated, has more than one floor, or has a
basement. The analysis also confirms that claims are lower in communities that have undertaken
flood mitigation activities. Finally, we find that the average premium per policy and per $1,000
of coverage in Florida is among the lowest in the nation, which is somewhat counterintuitive
given the storm surge exposure in this state. This can be explained by the fact that NFIP
premiums are set for each flood zone nationally and do not vary by state or locality so variations
in price reflect variations who is purchasing policies. Furthermore, a recent U.S. Government
Accountability Office (GAO) report noted that the NFIP rate-setting process uses out-of-date
data (GAO, 2008a). This might be even more pronounced in Florida given the fast urban
development that has occurred there over the past 30 years.
The next section of the paper provides an overview of aspects of the NFIP program that
are relevant to the analysis we conduct in this study. Section 2 also provides a cross-state
comparison of several metrics of the NFIP to put our analysis of Florida in a national context.
Section 3 systematically addresses each of the four questions above. Finally, section 4 concludes
and offers some policy recommendations for improving the NFIP.

7
2. History of the National Flood Insurance Program and Cross-State Comparisons
Creation of the NFIP
The NFIP grew out of a widespread belief among private insurance companies that flood
peril was not insurable. It was argued in the United States that floods could not be insured by the
private sector because: (1) only particular areas are subject to the risk, and as such, adverse
selection would be a problem; (2) the premiums necessary would be so high that no one would
be willing to pay them; and (3) flood losses can be catastrophic, that is, enough premiums could
not be collected to cover catastrophic events (Overman, 1957; Gerdes, 1963; Anderson, 1974).
This concern culminated in the passage of the NFIP in 1968 following major floods that
demonstrated the lack of coverage in many hazardous areas. It was thought that a government
program could potentially be successful because it might pool risks more broadly, have funds to
jumpstart the program, subsidize existing homeowners while charging actuarial rates to new
construction, and tie insurance to land-use changes that might lower risks (Grossman, 1958). The
program would also have the capacity to spread losses over time thanks to the potential for the
program to borrow money from the federal government to compensate for a punctual deficit,
something private insurers cannot do.
Flood Risk Designations
To set premiums and support local governments, the NFIP maps participating
communities, designating flood risks through different flood zones. These maps are called Flood
Insurance Rate Maps (FIRMs). A building that was in place pre-FIRM—before the mapping of
flood risk was completed in that area—is given subsidized rates.2 New constructions built after
2 The subsidy applies only to the first $35,000 of coverage on the building and $10,000 on contents, although the mean and median claims in 2004 were below these limits (CBO, 2007).

8
the risk mapping has been made public are charged actuarial rates. The expectation was that
fewer policies would be subsidized over time. However, around a quarter of properties are still
subsidized today since the housing stock is turning over more slowly than predicted, partly
because of new construction and renovation techniques that have extended the life of buildings
(Pasterick, 1998; Wetmore et al., 2006; CBO, 2007).3
Although it constitutes a declining percentage of all NFIP policies, the number of
properties receiving subsidized premium rates has grown since 1985; by 2007 it was at its
highest point in almost 30 years (GAO, 2008b). Of particular relevance to Florida, the
Congressional Budget Office found that many subsidized properties in coastal areas (23 percent
of their sample of 10,000 properties) were second homes, vacation homes, or rentals (CBO,
2007).4
The analysis in this paper is based on the risk estimates (in the form of designated flood
zones) from FEMA FIRMs. There is some question about the accuracy of these maps, however.
Flood risks are not stationary. Development that reduces impervious surface area can increase
flooding, as can the engineering of rivers (e.g., Criss and Shock, 2001) and possibly climate
change. A recent GAO study reveals that many FIRMs are out of date, and thus the maps can
severely underestimate the true risk (GAO, 2008a)5. FEMA has begun a map modernization
program to correct this problem.
3 Subsidized properties only become required to pay actuarial rates when they are damaged at half the property value or are improved, creating an increase in value of 50 percent (CBO, 2007). 4 For more on the effects of eliminating NFIP subsidies, see PricewaterhouseCoopers (1999). 5 This was also found by Temple University researchers who undertook a detailed analysis of the Pennypack Creek Watershed in Pennsylvania and found that their assessment designated more 100-year floodplains than the existing FIRM (Center for Sustainable Communities, 2006).

9
Operation of the NFIP
The NFIP was originally designed as a voluntary partnership between the federal
government and communities: local governments enacted floodplain management regulations; in
exchange, property owners in participating communities were eligible for federal flood
insurance.6 To encourage further mitigation, the NFIP runs the Community Rating System
(CRS), which is a voluntary program that rewards communities that undertake mitigating
activities with lower premiums.
The majority of NFIP policies are written through the Write-Your-Own (WYO) Program.
The WYO program allows participating property/casualty insurance companies to write and
service NFIP’s standard flood insurance policy in their own names. The insurance companies
bear no risk and are compensated for writing policies and settling claims, while the federal
government benefits from the private industry’s marketing channels and the presence of many
insurers in participating communities. Nearly all of the flood policies issued today are written by
companies that write flood insurance through the WYO program (99 percent in Florida over the
period 2000–2005).
Despite this potentially synergistic effort between the NFIP and private companies, take-
up rates for flood insurance have historically been low. One reason is that private insurance
agents do not seem to market NFIP policies (Anderson, 1974); in addition, individuals are not
interested in voluntarily purchasing flood insurance because of behavioral biases in evaluating
low-probability risks and/or a lack of information (Anderson, 1974; Kunreuther, 1979; Power
and Shows, 1979). Tropical Storm Agnes in 1972 demonstrated to Congress that very few people
were participating in the NFIP; this led to the passage of the Flood Disaster Protection Act of
1973 (Anderson, 1974; FEMA, 2002). This act limited the federal disaster assistance for 6 For more on the history and functioning of the NFIP, see Pasterick (1998).

10
nonparticipating communities and also created a mandatory purchase requirement: federally
backed or regulated lenders must require the purchase of flood insurance by anyone taking out a
mortgage on property acquired or developed in a SFHA. Although this led to a large relative
increase in policies-in-force, the 1993 floods in the Midwest revealed that the mandatory
purchase requirement was not being widely enforced, and sanctions on lenders were tightened in
1994.7
As discussed in the introduction, however, it is difficult to determine how well these
regulations are working because of a lack of nationwide data on the number of properties in 100-
year floodplains (Kriesel and Landry, 2004; Dixon et al., 2006). Despite this important
limitation, one can look at the absolute evolution of flood insurance coverage over time. The
combination of FEMA’s attempts to raise awareness regarding the risk of floods and a series of
major flooding episodes that occurred in 1992–1993 significantly contributed to increasing the
number of flood policies issued by the NFIP.8 A more significant increase started in 2004 and
accelerated in the aftermath of Hurricane Katrina and major floods in Louisiana. In December
2007, 5.65 million policies were in place—almost 700,000 more than were in place in 2005.
Over the same period, the total value of property insured under the NFIP grew rapidly. Total
exposure was nearly $214 billion nationwide in 1990 and $568 billion in 2000. In December
2007, it reached $1.14 trillion and it continues to grow. Not surprisingly, premiums collected for
flood coverage have significantly increased as well, from $670 million in 1990, to $2.85 billion
at the end of December 2007.
7 The National Flood Insurance Reform Act of 1994 created financial penalties for lenders that did not comply with the mandatory purchase requirement, stated that liability is not altered by sale or transfer of the loan, and mandated that lenders purchase insurance on behalf of the borrower if the borrower fails to do so. 8 Three significant flood events in 1992 (a Texas flood, hurricane Andrew, and a Nor’Easter) generated more than $500 million in insured losses; a March storm and the floods in the Midwest in 1993 also generated $500 million in payments by the NFIP. The Texas floods in October 1994, the Louisiana floods in May 1995, and Hurricane Opal cost the NFIP a total of more than $1.2 billion.
11
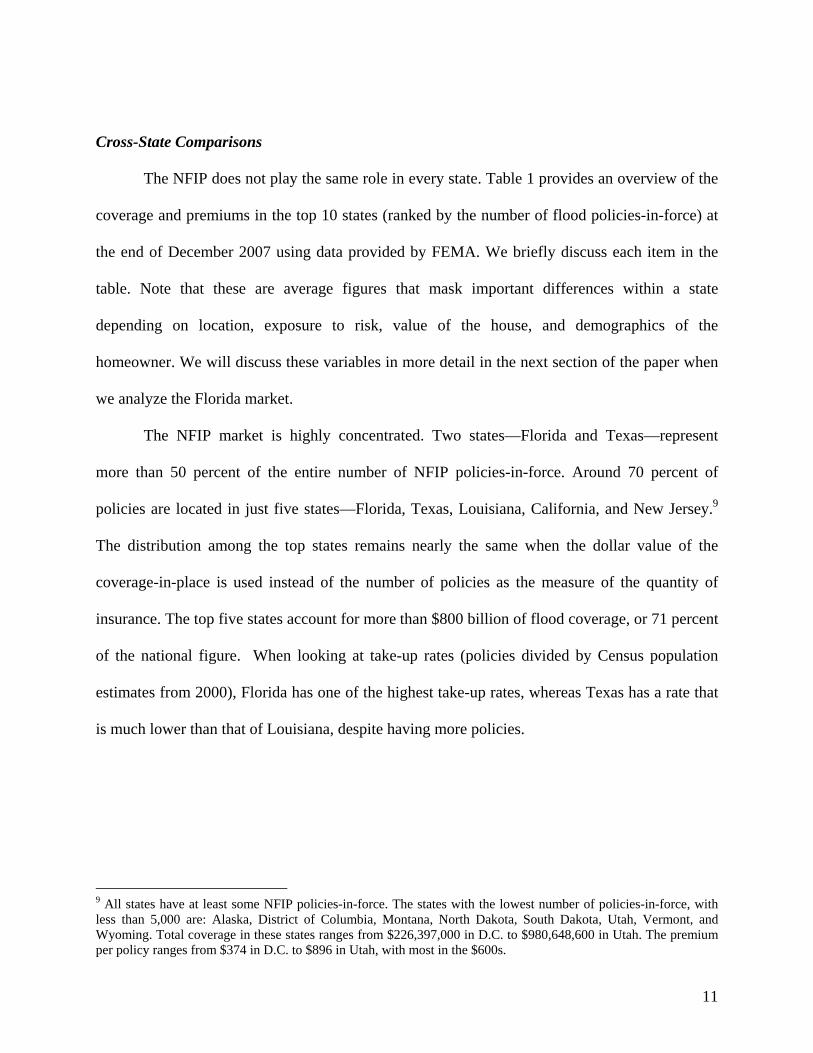
Cross-State Comparisons
The NFIP does not play the same role in every state. Table 1 provides an overview of the
coverage and premiums in the top 10 states (ranked by the number of flood policies-in-force) at
the end of December 2007 using data provided by FEMA. We briefly discuss each item in the
table. Note that these are average figures that mask important differences within a state
depending on location, exposure to risk, value of the house, and demographics of the
homeowner. We will discuss these variables in more detail in the next section of the paper when
we analyze the Florida market.
The NFIP market is highly concentrated. Two states—Florida and Texas—represent
more than 50 percent of the entire number of NFIP policies-in-force. Around 70 percent of
policies are located in just five states—Florida, Texas, Louisiana, California, and New Jersey.9
The distribution among the top states remains nearly the same when the dollar value of the
coverage-in-place is used instead of the number of policies as the measure of the quantity of
insurance. The top five states account for more than $800 billion of flood coverage, or 71 percent
of the national figure. When looking at take-up rates (policies divided by Census population
estimates from 2000), Florida has one of the highest take-up rates, whereas Texas has a rate that
is much lower than that of Louisiana, despite having more policies.
9 All states have at least some NFIP policies-in-force. The states with the lowest number of policies-in-force, with less than 5,000 are: Alaska, District of Columbia, Montana, North Dakota, South Dakota, Utah, Vermont, and Wyoming. Total coverage in these states ranges from $226,397,000 in D.C. to $980,648,600 in Utah. The premium per policy ranges from $374 in D.C. to $896 in Utah, with most in the $600s.

12
TABLE 1. NFIP SUMMARY STATISTICS WITH A FOCUS ON THE TOP 10 STATES
Number of flood policies in place
Insurance penetration (policies divided by 2000 population in 100s)
Quantity of insurance in place ($U.S.)
Total annual premiums ($U.S.)
Average premium per policy
verage emium r $1,000 coverage
Average quantity of insurance per policy
Nation 5,554,041 1.97% 1,120,767,708,600 2,810,863,345 $506 $2.51 $201,793 Florida 2,189,759 13.70% 454,409,776,100 901,071,362 $411 $1.98 $207,516 % nationwide 39.43% 40.54% 32.06% Texas 666,920 3.20% 145,170,577,200 279,895,243 $420 $1.93 $217,673 % nationwide 12.01% 12.95% 9.96% Louisiana 502,085 11.23% 93,608,829,200 286,015,533 $570 $3.06 $186,440 % nationwide 9.04% 8.35% 10.18% California 266,171 0.79% 62,041,065,600 168,952,788 $635 $2.72 $233,087 % nationwide 4.79% 5.54% 6.01% New Jersey 223,650 2.66% 45,945,494,500 159,123,884 $711 $3.46 $205,435 % nationwide 4.03% 4.10% 5.66% TOP 5 STATES 3,848,585 4.60% 801,175,742,600 1,795,058,810 $466 $2.24 $208,174 % nationwide 69.29% 71.48% 63.86% South Carolina 197,334 4.92% 43,090,182,300 101,117,712 $512 $2.35 $218,362 % nationwide 3.55% 3.84% 3.60% New York 144,253 0.76% 31,598,332,600 109,182,682 $757 $3.46 $219,048 % nationwide 2.60% 2.82% 3.88% North Carolina 133,955 1.66% 28,618,309,100 74,043,712 $553 $2.59 $213,641 % nationwide 2.41% 2.55% 2.63% Virginia 105,860 1.50% 23,137,990,700 57,149,668 $540 $2.47 $218,572 % nationwide 1.91% 2.06% 2.03% Georgia 88,429 1.08% 19,465,735,700 49,644,456 $561 $2.55 $220,128 % nationwide 1.59% 1.74% 1.77% TOP 10 STATES 4,518,416
3.48% 947,086,293,000
2,186,197,040 $484 $2.31 $209,606
% nationwide 81.35% 84.50% 77.78% Sources: Authors’ calculation from FEMA data as of December 31, 2007.
13
With a high take-up rate and total number of policies, Florida represents about one-third
of the total $2.81 billion in premiums collected by the NFIP nationwide. As discussed in section
4 in more detail, prices for NFIP insurance are set nationally and vary only by flood zone and
characteristics of the house. They do not vary by state or locality, so the numbers reported here
reflect the variety in flood risk by state, variation in the composition of who buys insurance, and
of course, how much coverage is bought per policy—a function of the value of homes. Finally,
the average quantity of insurance coverage per policy varies somewhat by state from the national
average of $202,000. In December 2007, it ranged from $186,000 in Louisiana to $233,000 in
California.
3. Analysis of the Flood Insurance Market in the State of Florida
With more than 40 percent of the policies-in-force in the United States, Florida offers a
natural setting to better understand the functioning of the NFIP and the characteristics of
homeowners who choose to buy flood coverage. Moreover, the state is highly exposed to
hurricane risks and has the greatest concentration of exposed value in high-risk areas; Florida is
thus of particular interest to many policymakers.
In this section, we answer four questions regarding flood insurance in Florida: (1) What
are the characteristics of the buyers of flood insurance? (2) What type of contracts (coverage
levels and deductibles) are purchased? (3) Where and when are claims paid? (4) How are prices
determined and how much does NFIP insurance cost?

14
To answer these questions we compiled data from several sources. The first is a dataset of
more than 7.5 million flood insurance policies provided to us by the NFIP.10 It includes all of the
policies-in-force in Florida for six consecutive years (2000–2005): more than 1.21 million
policies in 2000, 1.24 million in 2001, 1.26 million in 2002 and 2003, 1.29 million in 2004, and
1.37 million in 2005. The dataset excludes identifying information of the homeowner, preventing
us from doing a household-level analysis, but it does have the zip code, city, and county in which
the policyholder is located. The dataset contains a variety of variables relating to the policy, such
as the coverage level, premium, and deductible. The dataset also has the flood zone, the CRS
number, and the type of policy (e.g., single-family or commercial).
From the NFIP, we also received a claims dataset that contains all claims filed in Florida
through August 31, 2006, excluding identifying information. It includes information on the
claim, such as the date of the loss, the catastrophe with which it is associated, the amount of
damage, and how much was paid. It also contains information for a subset of the policies on the
house and contents associated with the claim, such as structural features of the house and the
value of the house and contents.
Finally, we also drew on data from the 2000 U.S. Census. This gave us county-level
demographic information, such as median income and median value of owner-occupied housing.
Although these figures have certainly evolved since 2000, they are the most recently available
Census data. We used such measures to better understand the factors driving the decision to
purchase insurance.
10 We are indebted to Tim Scoville and Ed Pasterick for sharing this dataset and the claims dataset for the purpose of our research project and for the many discussions we had together on the practical operation of the program over the past several years.
15
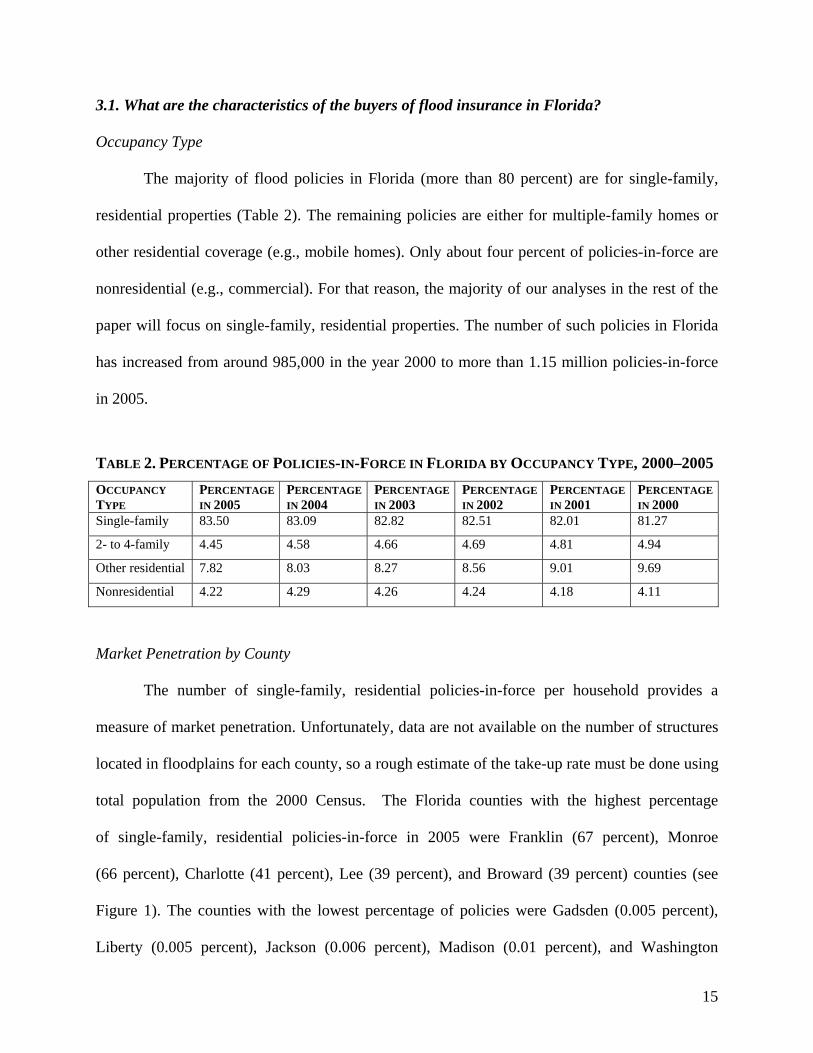
3.1. What are the characteristics of the buyers of flood insurance in Florida?
Occupancy Type
The majority of flood policies in Florida (more than 80 percent) are for single-family,
residential properties (Table 2). The remaining policies are either for multiple-family homes or
other residential coverage (e.g., mobile homes). Only about four percent of policies-in-force are
nonresidential (e.g., commercial). For that reason, the majority of our analyses in the rest of the
paper will focus on single-family, residential properties. The number of such policies in Florida
has increased from around 985,000 in the year 2000 to more than 1.15 million policies-in-force
in 2005.
TABLE 2. PERCENTAGE OF POLICIES-IN-FORCE IN FLORIDA BY OCCUPANCY TYPE, 2000–2005
OCCUPANCY
TYPE PERCENTAGE
IN 2005 PERCENTAGE
IN 2004 PERCENTAGE
IN 2003 PERCENTAGE
IN 2002 PERCENTAGE
IN 2001 PERCENTAGE
IN 2000 Single-family 83.50 83.09 82.82 82.51 82.01 81.27
2- to 4-family 4.45 4.58 4.66 4.69 4.81 4.94
Other residential 7.82 8.03 8.27 8.56 9.01 9.69
Nonresidential 4.22 4.29 4.26 4.24 4.18 4.11
Market Penetration by County
The number of single-family, residential policies-in-force per household provides a
measure of market penetration. Unfortunately, data are not available on the number of structures
located in floodplains for each county, so a rough estimate of the take-up rate must be done using
total population from the 2000 Census. The Florida counties with the highest percentage
of single-family, residential policies-in-force in 2005 were Franklin (67 percent), Monroe
(66 percent), Charlotte (41 percent), Lee (39 percent), and Broward (39 percent) counties (see
Figure 1). The counties with the lowest percentage of policies were Gadsden (0.005 percent),
Liberty (0.005 percent), Jackson (0.006 percent), Madison (0.01 percent), and Washington
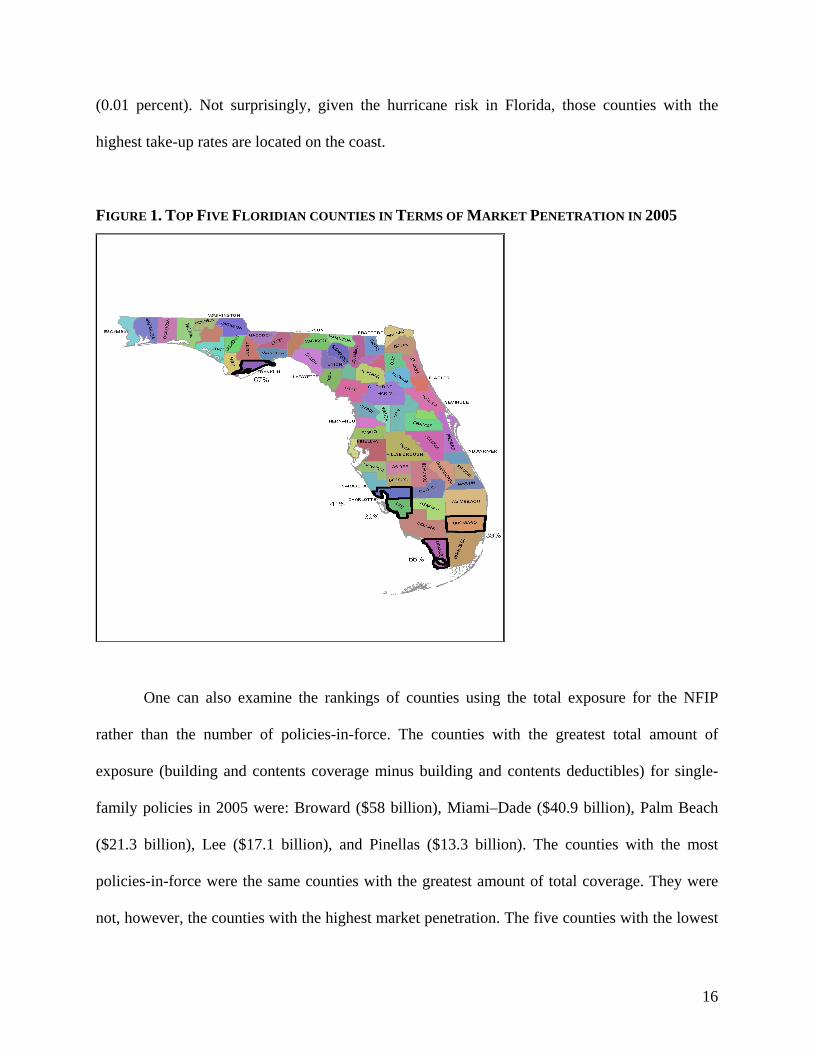
16
(0.01 percent). Not surprisingly, given the hurricane risk in Florida, those counties with the
highest take-up rates are located on the coast.
FIGURE 1. TOP FIVE FLORIDIAN COUNTIES IN TERMS OF MARKET PENETRATION IN 2005
One can also examine the rankings of counties using the total exposure for the NFIP
rather than the number of policies-in-force. The counties with the greatest total amount of
exposure (building and contents coverage minus building and contents deductibles) for single-
family policies in 2005 were: Broward ($58 billion), Miami–Dade ($40.9 billion), Palm Beach
($21.3 billion), Lee ($17.1 billion), and Pinellas ($13.3 billion). The counties with the most
policies-in-force were the same counties with the greatest amount of total coverage. They were
not, however, the counties with the highest market penetration. The five counties with the lowest
17
amounts of total exposure were: Madison ($8.85 million), Jefferson ($6.78 million), Hamilton
($6.05 million), Union ($4.04 million) and Liberty ($1.69 million).
Market Penetration by Flood Zone
The number of policies-in-force also varies by FEMA mapped risk zone. As already
stated, we would ideally like to be able to look at take-up rate by flood zone. Unfortunately, no
dataset of the number of households in each flood zone by county is available. From our data,
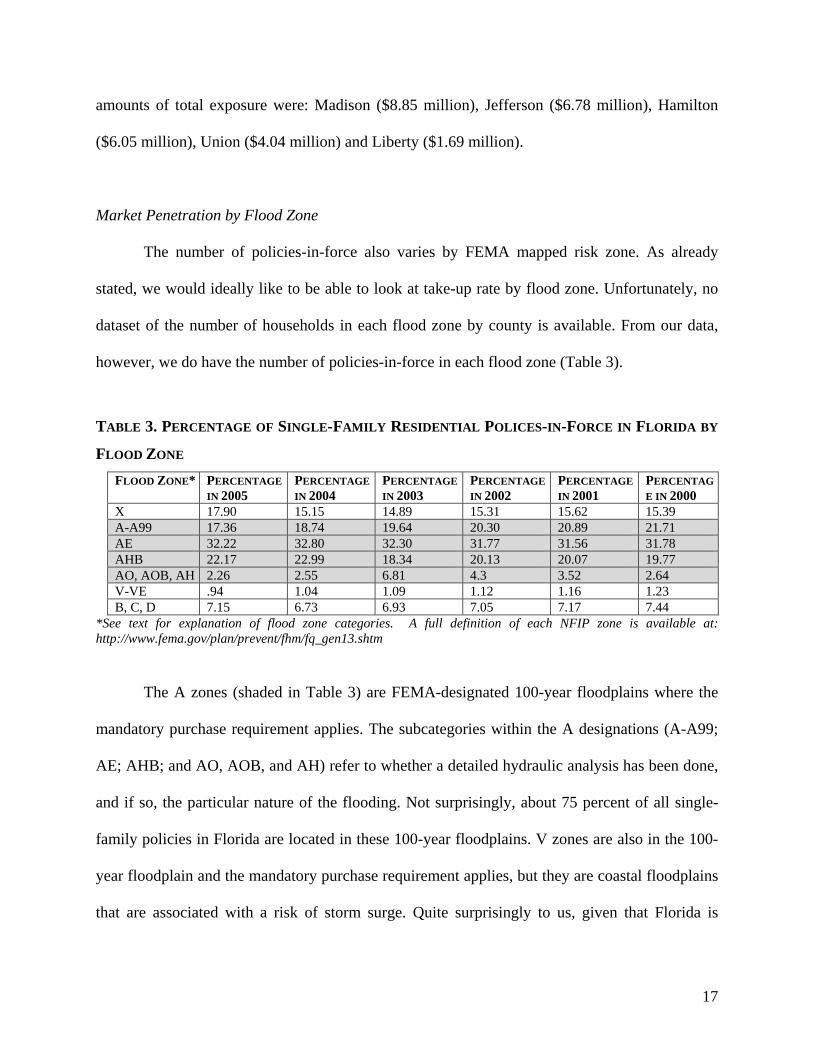
however, we do have the number of policies-in-force in each flood zone (Table 3).
TABLE 3. PERCENTAGE OF SINGLE-FAMILY RESIDENTIAL POLICES-IN-FORCE IN FLORIDA BY
FLOOD ZONE
FLOOD ZONE* PERCENTAGE
IN 2005 PERCENTAGE
IN 2004 PERCENTAGE
IN 2003 PERCENTAGE
IN 2002 PERCENTAGE
IN 2001 PERCENTAG
E IN 2000 X 17.90 15.15 14.89 15.31 15.62 15.39 A-A99 17.36 18.74 19.64 20.30 20.89 21.71 AE 32.22 32.80 32.30 31.77 31.56 31.78 AHB 22.17 22.99 18.34 20.13 20.07 19.77 AO, AOB, AH 2.26 2.55 6.81 4.3 3.52 2.64 V-VE .94 1.04 1.09 1.12 1.16 1.23 B, C, D 7.15 6.73 6.93 7.05 7.17 7.44
*See text for explanation of flood zone categories. A full definition of each NFIP zone is available at: http://www.fema.gov/plan/prevent/fhm/fq_gen13.shtm
The A zones (shaded in Table 3) are FEMA-designated 100-year floodplains where the
mandatory purchase requirement applies. The subcategories within the A designations (A-A99;
AE; AHB; and AO, AOB, and AH) refer to whether a detailed hydraulic analysis has been done,
and if so, the particular nature of the flooding. Not surprisingly, about 75 percent of all single-
family policies in Florida are located in these 100-year floodplains. V zones are also in the 100-
year floodplain and the mandatory purchase requirement applies, but they are coastal floodplains
that are associated with a risk of storm surge. Quite surprisingly to us, given that Florida is

18
highly exposed to hurricane risk, very few policies were in the V zones. This could be because
they cover a very small geographic area.
Zone B designates moderate flood risk, and Zone C designates minimal flood risk. Both
areas are outside of the 100-year floodplain. Zone D consists of areas with possible flood risks,
but no analysis has been completed on these areas. These three zones represent only a small
percentage of policies in Florida. Flood Zone X is composed of those areas determined to be
outside of the 100-year and 500-year floodplains, and thus designates minimal flood risk. About
18 percent of all residential, single-family policies-in-force were in Zone X in 2005, up from
15.4 percent in 2000. The mandatory purchase requirement does not apply in Zones B, C, D, or
X, but if a property owner’s community is participating in the NFIP they may still purchase
insurance at rates lower than those for the 100-year floodplain.
Market Penetration by Community Rating Systems (CRS) Class
We also examined how policies broke down across CRS levels. The deduction in
premiums that a community can receive by participating in the CRS and undertaking mitigating
activities—such as improved storm water management, land use regulations, or outreach
campaigns—ranges from 0 to 45 percent of the full actuarial rate (as defined by FEMA),
depending on the level of actions taken. Table 4 shows how policies-in-force break down by
CRS class. In 2005, about a quarter of residential policies-in-force were in communities with no
CRS discount. The remaining three-quarters of policies benefitted from some type of price
discount ranging from 5 to 25 percent. Virtually no policies got a discount higher than
25 percent.

19
TABLE 4. PERCENTAGE OF RESIDENTIAL POLICIES-IN-FORCE IN FLORIDA BY CRS CLASS
CRS DISCOUNT Percentage in 2005
Percentage in 2004
Percentagein 2003
Percentagein 2002
Percentage in 2001
Percentage in 2000
0% 26.36 23.15 22.97 23.03 23.08 22.20 5% 5.09 6.83 7.67 0.01 3.84 7.50 10% 25.24 27.57 28.15 31.62 33.10 35.81 15% 21.68 20.52 9.68 7.41 25.64 23.90 20% 8.22 8.64 8.30 7.21 3.79 09 25% 3.41 3.29 3.23 72 55 5 More than 25%11 0 0 0 0 0 0
Table 4 also shows how these percentages varied between 2000 and 2005. Over this time
period, an increasing percentage of policies was receiving no discount, but also, an increasing
percentage was receiving a 20 or 25 percent discount. For instance, between 2000 and 2002, less
than 1 percent of the policies were located in communities that received a 25 percent discount on
their premiums. That proportion significantly increased in the following two years, with more
than 13 percent of the policies having such a discount in 2005.
Tenure of Flood Policies
How long homeowners keep their policies and whether low retention rates can explain
the lower-than-desired take-up rates in many flood-prone areas in the United States is an open
question (GAO, 2006). As with other catastrophe risks, homeowners may drop their coverage
after a certain period if they have not suffered a loss; this has been described as the “natural
disaster syndrome” (Kunreuther, 1978).
From our sample, we can track the unique identifying policy number for all of the
policies-in-force in the year 2000 and see how many of these were still in place in subsequent
years (Figure 2). In 2000, there were roughly 985,000 single-family, residential policies-in-force.
11 Only a few policies in the dataset are in CRS classes that provide a discount higher than 25 percent. The dataset includes 1 such policy (with a 50 percent discount) in 2004, 1 in 2002 (with a 30 percent discount), 35 policies in 2000 (with a 75 percent discount), and no policies with a discount greater than 25% in 2005, 2003, and 2001.

20
By 2005, only about 38 percent of the policies purchased in 2000 were still in force. This result
should be viewed with caution, however, since we are unable to determine whether a policy
dropped from our database because a homeowner moved elsewhere or because a homeowner
dropped her policy while staying in the same house.
FIGURE 2. TENURE OF POLICIES-IN-FORCE IN 2000
In conclusion, a more granular analysis of flood insurance policies in Florida reveals
patterns in flood insurance demand. Like the country overall, the NFIP market in Florida is
highly concentrated, with just a few counties responsible for the majority of policies and
coverage. Most of these policies are for single-family homes and, naturally, most of the
coverage-in-force is located along the coasts and in SFHAs. That said, almost 20 percent of
homeowners are buying insurance outside of the mandatory purchase areas. Retention appears to
be a problem in Florida, but we do not know for sure whether a policy is terminated because the
homeowner relocates or whether s/he decides to stop buying flood insurance.

21
3.2. What type of contracts (deductibles, coverage levels) do policyholders purchase?
We now focus more specifically on the design of the flood insurance contract Floridians
purchase. We first explore the coverage levels that homeowners in Florida choose and then
examine deductible choices. Finally, we look at how these choices changed in 2005, following
the active hurricane season and flood surge that affected Florida in 2004; that year, Florida was
hit with four hurricanes—Charley, Frances, Ivan, and Jeanne—as well as tropical storm Bonnie.
Coverage Levels
The amount of insurance that homeowners can purchase from the NFIP has evolved over
time. The NFIP has always had two maximum coverage limits, one for the structure and one for
the contents. In 1968 they were $17,500 and $5,000, respectively for residential property, and
have since been modified several times. This maximum has remained unchanged since 1994 at
$250,000 for the structure and $100,000 for contents.12 Homeowners affected by the mandatory
purchase requirement also must meet a minimum coverage level: the principal remaining on the
outstanding mortgage (unless this amount is above the maximum coverage limit). To compare
the evolution of the real value of this maximum, we indexed the current total limit for building
and contents coverage of $350,000 to 2008 prices. Figure 3 depicts this 2008-index total policy
limit over the period 1968–2008 using the official U.S. inflation rate for each year. In real prices,
the maximum limit on a flood policy in 2008 was about the same as it was 20 years before and
much lower where it was in 1978, despite significant inflation over this period and despite real
estate prices that increased in many areas at a much higher rate than inflation. Over the years,
some have argued that the $350,000 coverage limit is too low. This concern was raised again
12 Commercial (nonresidential) buildings are eligible for up to $500,000 in building coverage and up to $500,000 on personal property. According to FEMA, as of June 2007, nearly 2 million of the 5.4 million policies-in-force had building coverage only, 3.4 million had both building and content coverage, and 100,000 had content coverage only.

22
following Hurricane Katrina. With our data, we were able to gauge whether that $350,000
threshold really constitutes a limitation on the demand side for homeowners in Florida.
FIGURE 3. FLOOD TOTAL COVERAGE LIMITS BY YEAR INDEXED TO 2008 DOLLARS
$0.000
$100.000
$200.000
$300.000
$400.000
$500.000
$600.000
$700.000
$800.000
1968
1970
1972
1974
1976
1978
1980
1982
1984
1986
1988
1990
1992
1994
1996
1998
2000
2002
2004
2006
2008
Source: Authors’ calculation
After considering all policies-in-force in Florida in 2005, we conclude that the limit is not
binding for the majority of homeowners. More specifically, we find that about 73 percent of
single-family homes had building coverage below the $250,000 limit in 2005.13 Given that the
median value of owner-occupied housing units in Florida reported in the 2000 Census was only
$105,000, this result should not be surprising. Although much media attention has been paid to
the multimillion dollar houses on the beach, the majority of residences in Florida are valued at
less than the NFIP building coverage limit for residential properties.14 Further, flood damages
13 Note that we are looking at the amount of coverage purchased here and not coverage as a percentage of home value. 14 Moreover, in many areas in Florida, it is likely that property prices are heavily determined by the price of the land more than the cost of the house itself.

23
may not always completely destroy a structure, so not insuring the full value of the home may be
quite rational (see Figure 5).
FIGURE 4. BUILDING AND CONTENTS COVERAGE FOR SINGLE-FAMILY HOMES IN FLORIDA
FOR 2005
Figure 4 depicts the percentage of the 1.14 million single-family flood policies in 2005
that selected a given limit for building and contents coverage. Although almost three-quarters of
homeowners did not purchase building insurance at the coverage limit, about 27 percent did
(Figure 4, left). Presumably many of these policyholders would welcome the option of choosing
a higher limit.15 Moreover, the number and proportion of policyholders who have purchased the
$250,000 limit has been growing steadily. In 2000, only around 10 percent of single-family
policyholders were at the coverage maximum limit. This percentage rose in 2003 to 17 percent
15 Not surprisingly, several private insurers, including AIG and Chubb, offer private insurance in excess of the NFIP policy limits. However, the same problems of insurability that the NFIP was set up to deal with affect private programs. To our knowledge, AIG and Chubb only offer coverage in a handful of states, none of which are Gulf Coast states (Silverman, 2005; Best’s Review, 2006). RAND recently examined the market of private flood insurance, estimating that between 130,000 and 190,000 policies are entirely from private companies and perhaps 180,000–260,000 policies are just for coverage in excess of the NFIP cap (Dixon et al., 2007). Compared to the 5.7 million NFIP policies-in-force, this is quite a small number.
24
and to 27 percent in 2005. In part, this reflects the growth of Florida’s population over this time
period and the increased value of the real estate.
About 23 percent of single-family policies in Florida in 2005 were at the $100,000 limit
for contents coverage—very close to the 27 percent number at the building coverage limit
(Figure 4, right). Out of all the 1.14 million single-family policies-in-force in 2005, roughly 12.5
percent had zero contents coverage. The number with zero contents coverage has been declining
slowly since 2000, however, whereas the number at the coverage limit rose substantially over
this time, from 7.5 percent in 2000 to almost 23 percent in 2005.
These state averages mask considerable county-level variability in whether policyholders
are up against the maximum coverage limit. In 2005, some counties, such as Liberty and
Lafayette Counties, had virtually no policyholders at the limit, whereas in other counties, such as
Walton, Nassau, Collier, and Martin Counties, half or more of the policyholders were at the
limit. Over time, more counties are finding more policyholders at the coverage limit. In 2000, the
counties with the highest percentages of policies at the limit had only about 25 percent at the
limit (these were Indian River, Walton, and Martin Counties), whereas in 2005, the highest
percentages were more than 50 percent. Given these results, there would certainly be a demand
for a higher limit of flood insurance coverage in these counties.
As expected, policyholders with higher levels of building coverage tend to have higher
levels of contents coverage, as well. On average over the entire state, there is approximately a 70
percent chance that a policyholder will buy the maximum limit of contents coverage if she has
bought the maximum limit of building coverage. Also as expected, the percentage of single-
family, residential policyholders at the limit at the county level in 2000 is positively correlated
with income measures from the 2000 Census, such as the median value of owner-occupied

25
housing and median income. We calculated that the correlation coefficient is approximately 0.6
for both measures; this is statistically different from zero at better than the 1 percent level. Both
the median value of owner-occupied housing and median income are significant predictors in
county-level regressions with the percentage of policies at the coverage limit as the dependent
variable (not reported; available from the authors).
Another important element to consider in making decisions about flood insurance
coverage is the level of losses policyholders can expect from a flood.16 About three-quarters of
the residential claims in our dataset between 2000 and 2006 included information on the assessed
value of the house. For this subsample, Figure 5 shows the amount of the claim paid divided by
the value of the structure.17 We see that most building claims payments were significantly less
than the value of the property.18 For just over 50 percent of the claims, the amount paid was no
more than 10 percent of the property value.
FIGURE 5. RESIDENTIAL CLAIMS IN FLORIDA BETWEEN 2000 AND 2006 DIVIDED BY VALUE OF
THE PROPERTY
16 We thank one of the referees for helpful suggestions on this point. 17 Approximately 12 percent of the observations had a claim payment of zero and a few were greater than the value of the property. These are not included in Figure 5. 18 Contents claims are not included in Figure 5 because the value of contents was not available.
26
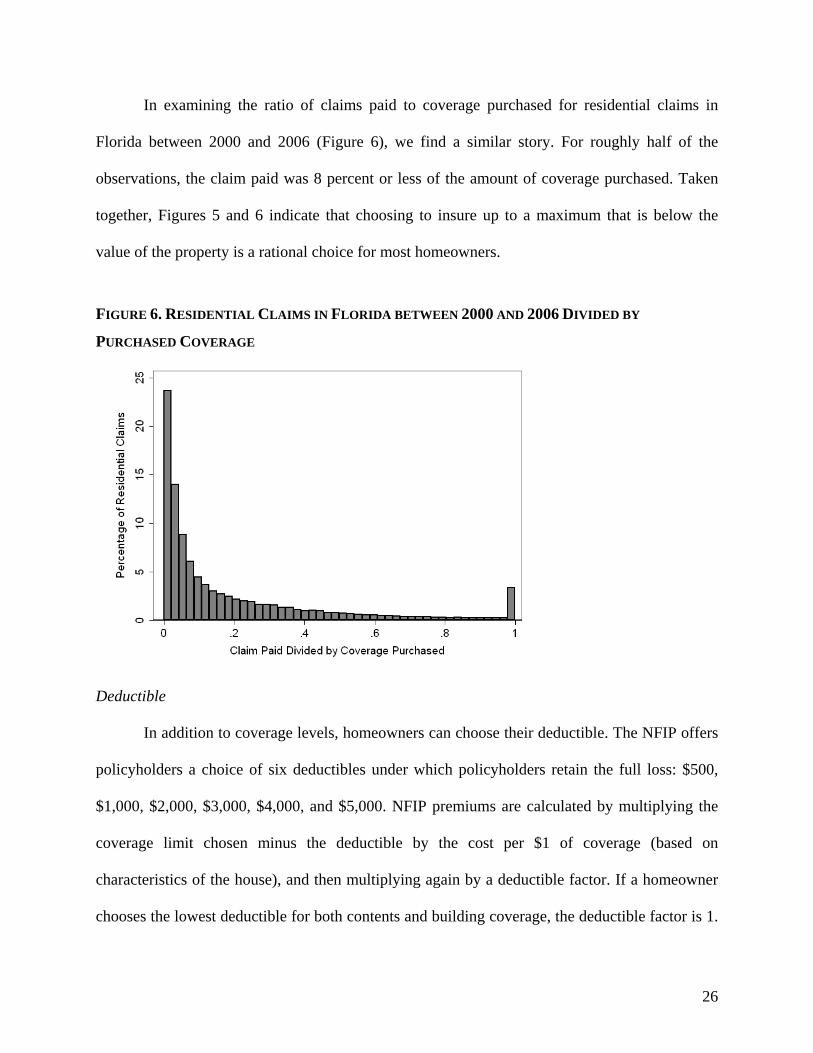
In examining the ratio of claims paid to coverage purchased for residential claims in
Florida between 2000 and 2006 (Figure 6), we find a similar story. For roughly half of the
observations, the claim paid was 8 percent or less of the amount of coverage purchased. Taken
together, Figures 5 and 6 indicate that choosing to insure up to a maximum that is below the
value of the property is a rational choice for most homeowners.
FIGURE 6. RESIDENTIAL CLAIMS IN FLORIDA BETWEEN 2000 AND 2006 DIVIDED BY
PURCHASED COVERAGE
Deductible
In addition to coverage levels, homeowners can choose their deductible. The NFIP offers
policyholders a choice of six deductibles under which policyholders retain the full loss: $500,
$1,000, $2,000, $3,000, $4,000, and $5,000. NFIP premiums are calculated by multiplying the
coverage limit chosen minus the deductible by the cost per $1 of coverage (based on
characteristics of the house), and then multiplying again by a deductible factor. If a homeowner
chooses the lowest deductible for both contents and building coverage, the deductible factor is 1.

27
Choosing a $1,000 deductible for both gives a deductible factor of 0.96. Choosing a $5,000
deductible for both gives a deductible factor of 0.74. So choosing the highest deductible reduces
costs of NFIP insurance by about 25 percent. Out of all claims filed in Florida through August
31, 2006, a little more than half of the claims paid were greater than the highest deductible of
$5,000.
Many studies on insurance choice have found that individuals prefer low-deductible
policies, even when these are financially unappealing because of the higher prices charged to
cover the cost of processing small claims and to combat adverse selection. This preference has
been found for automobile insurance and homeowners policies (Eldred, 1980; Cutler and
Zeckhauser, 2004; Sydnor, 2006). The samples in these studies were relatively modest, however.
Here, we are able to look at deductible choices based on a much larger sample than has been
studied before in the literature. We find that, of the more than 1 million flood insurance policies-
in-force in 2005, 98.3 percent of customers chose a deductible lower than the maximum one
available. Almost 80 percent of policyholders chose the lowest possible building deductible,
$500, and around 18 percent chose the second-lowest deductible available, $1000. Overall, these
percentages were largely constant for the other 6 million policies we analyzed over the 2000–
2005. For contents coverage, the deductible choices were similar, with about 83 percent of
single-family policies having a deductible of $500 in 2005 and 15 percent choosing $1,000.
An interesting difference becomes apparent if one examines the deductible choice by
flood zone. Homeowners inside SFHAs (100-year floodplains) did not choose the lowest
deductible as often as those outside SFHAs and were also more likely to choose the highest
deductible offered (see Figure 7). One explanation for this finding is that more policyholders

28
inside SFHAs are being forced to insure by their lender due to the mandatory purchase
requirement and are thus simply trying to minimize costs by choosing a higher deductible.
FIGURE 7. CHOICE OF DEDUCTIBLE BY FLOOD ZONE
Still, overall, most homeowners prefer low deductibles, consistent with the findings of
previous studies. Several factors might explain the choice of a low deductible, and unfortunately,
in the absence of interviews of buyers of flood coverage, we are unable to tease apart these
competing explanations. First, consumers might want to cover as much potential damage as
possible (risk aversion). They do not act rationally by evaluating expected losses, but rather
assess risk in a binary way: “I suffer a loss or I don’t; but if I do, I want to be sure my investment
in insurance protection gets me as much as possible back.” Second, some homeowners might not
be aware that higher deductibles are offered. Third, for some customers who are forced to buy
flood insurance by lenders, a low deductible means that the insurer will make payments to
customers more often. Even though such payments may not be a valid indication of a company's
reliability, they may at least increase confidence in the company’s promise of protection against
unlikely large losses. Small claims might help make the payment of required insurance more
tangible. Fourth, some individuals may see insurance as an investment, rather than a risk-
29
spreading tool and want to collect something back from their policy. The lowest possible
deductible will make them more likely to collect as much as possible (Kunreuther, 1978).
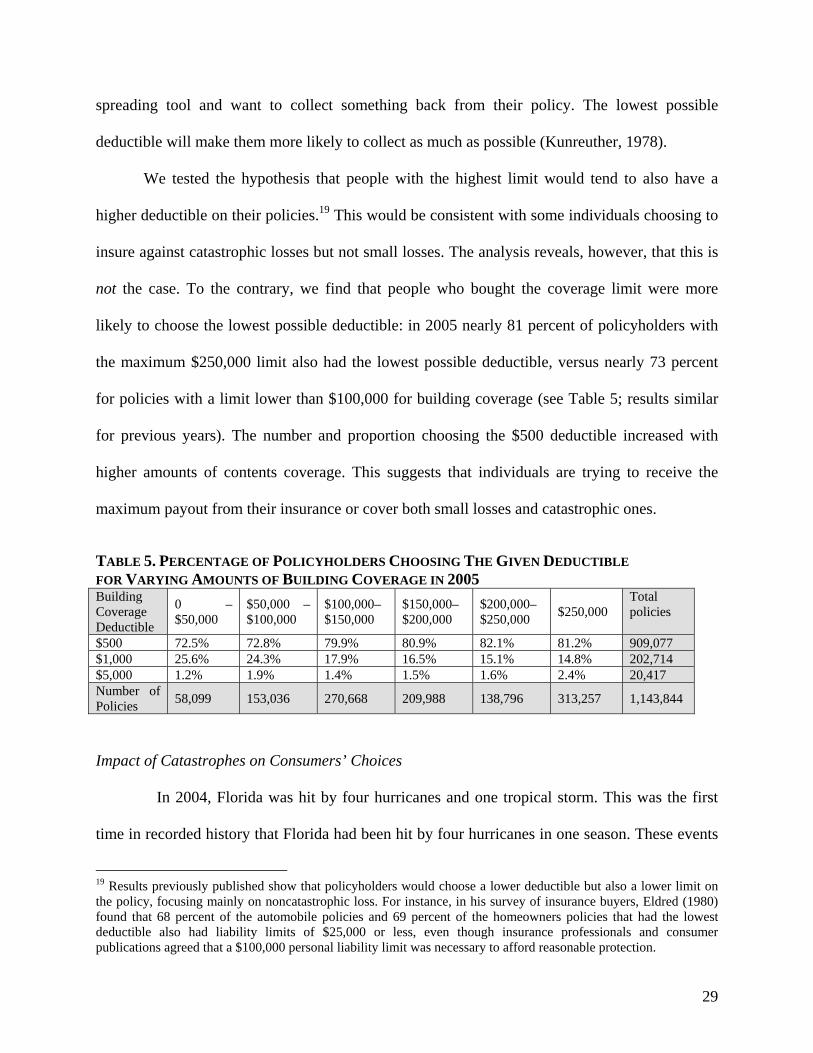
We tested the hypothesis that people with the highest limit would tend to also have a
higher deductible on their policies.19 This would be consistent with some individuals choosing to
insure against catastrophic losses but not small losses. The analysis reveals, however, that this is
not the case. To the contrary, we find that people who bought the coverage limit were more
likely to choose the lowest possible deductible: in 2005 nearly 81 percent of policyholders with
the maximum $250,000 limit also had the lowest possible deductible, versus nearly 73 percent
for policies with a limit lower than $100,000 for building coverage (see Table 5; results similar
for previous years). The number and proportion choosing the $500 deductible increased with
higher amounts of contents coverage. This suggests that individuals are trying to receive the
maximum payout from their insurance or cover both small losses and catastrophic ones.
TABLE 5. PERCENTAGE OF POLICYHOLDERS CHOOSING THE GIVEN DEDUCTIBLE FOR VARYING AMOUNTS OF BUILDING COVERAGE IN 2005 Building Coverage Deductible
0 – $50,000
$50,000 – $100,000
$100,000– $150,000
$150,000– $200,000
$200,000– $250,000
$250,000 Total policies
$500 72.5% 72.8% 79.9% 80.9% 82.1% 81.2% 909,077 $1,000 25.6% 24.3% 17.9% 16.5% 15.1% 14.8% 202,714 $5,000 1.2% 1.9% 1.4% 1.5% 1.6% 2.4% 20,417 Number of Policies
58,099 153,036 270,668 209,988 138,796 313,257 1,143,844
Impact of Catastrophes on Consumers’ Choices
In 2004, Florida was hit by four hurricanes and one tropical storm. This was the first
time in recorded history that Florida had been hit by four hurricanes in one season. These events
19 Results previously published show that policyholders would choose a lower deductible but also a lower limit on the policy, focusing mainly on noncatastrophic loss. For instance, in his survey of insurance buyers, Eldred (1980) found that 68 percent of the automobile policies and 69 percent of the homeowners policies that had the lowest deductible also had liability limits of $25,000 or less, even though insurance professionals and consumer publications agreed that a $100,000 personal liability limit was necessary to afford reasonable protection.
30
caused billions of dollars in damages, the evacuation of over 9 million people, and many
fatalities. We were interested in whether this exceptional year led homeowners to alter their
flood insurance purchase decisions. We predicted that insurance take-up rates would increase
after these storms and that perhaps coverage levels would rise, as well. The NFIP does not react
to any specific local episode by increasing its rates; rather, it sets its rates at a national level, as
discussed in the next section. As a result, the premiums of NFIP flood policies remained virtually
the same in Florida before and after this series of storms. Any changes we observe are thus due
to a reaction to these events and not to a change in the price formula of insurance.
Policies-in-force increased in the state of Florida every year between 2000 and 2004,
but not by more than a couple of percentage points each year. Between 2004 and 2005, however,
the number of policies-in-force jumped 6 percent. This is suggestive evidence that the storms
encourage more property owners to purchase flood insurance.
It also appears that after the storms more individuals chose the lowest possible building
deductible of $500. Considering only single-family, residential policies, for those homeowners
with coverage less than or equal to $50,000, the percentage in the state overall choosing the
lowest deductible grew by up to a few percentage points consistently each year between 2000
and 2005. Looking only at Santa Rosa and Escambia Counties, however, where damage from the
2004 storms was severe, the proportion of policyholders choosing the lowest deductible
increased much more between 2004 and 2005 than between any other two years from 2000 to
2004. The percentage with the lowest deductible jumped between 2004 and 2005 by close to 14
percent in Santa Rosa and roughly 7 percent in Escambia. This same phenomenon was observed
among those with the highest possible coverage of $250,000.

31
After the storms, it also appears that single-family, residential policyholders purchased
a higher limit on their coverage. The percentage of policyholders in the state with coverage less
than or equal to $150,000 dropped every year between 2000 and 2004, but never by more than
5 percent per year. Between 2004 and 2005, though, the number fell by 9 percent. At the same
time, the percentage choosing the highest possible building coverage of $250,000 was growing
each year. Between 2000 and 2004, the growth was never more than 3 percent per year. Between
2004 and 2005, it was double that amount at about 6 percent. Mean building coverage in 2004
was $152,290 for single-family, residential homes and was $164,835 in 2005.
Several factors might explain these changes: people living in devastated areas and who
had coverage might have wished post-storm that they had purchased the largest possible
coverage before being flooded (regret); the floods were a vivid experience, not only for those
affected but also their neighbors and families, and people, therefore, revised their belief after the
storms to think flooding was more likely; or the decision to buy more insurance also became
more appealing because it was viewed as a sound financial investment.
3.3. Where and when are claims paid?
In this section, we investigate the particular events driving claims, how claims vary
across counties, and the determinants of the magnitude of claims paid. Figure 8 provides an
overview of the total amount of claims paid by year in Florida from 1978 to 2005 for all types of
policies—commercial and residential. All claims are in constant year 2000 dollars. The high
level of claims from the unusual 2004 season is readily apparent.

32
FIGURE 8. NFIP CLAIMS PAID IN FLORIDA BY YEAR
As discussed above, the NFIP does not cover wind damage from hurricanes (this
coverage is provided by private insurers through homeowners policies or through state insurance
pools), but major hurricanes in coastal states typically also induce significant flood losses from
storm surge pushing water inland, or from flooding induced by torrential rains as hurricanes
move inland. For these reasons, hurricanes are responsible for the majority of NFIP claims in
Florida. For example, in 2004, 15 percent of NFIP claims in Florida were attributable to
Hurricane Charlie, 17 percent to Hurricane Frances, 36 percent to Hurricane Ivan, and 18 percent
to Hurricane Jeanne—a total of 86 percent of flood claims. In 2005, more than 50 percent of all
claims payments were associated with Hurricane Wilma and just under a quarter were associated
with Hurricane Katrina. Another 13 percent of claims were due to Hurricane Dennis—a total of
88 percent of the claims for that year.
Mean claim payments in Florida between 2000 and 2005 were about $3,000 higher for V
flood zones—floodplains associated with wave action—than for A flood zones. This suggests
that storm surge or other coastal flooding associated with wave action inflicts higher levels of

33
damage than inland flooding from heavy rain. This is consistent with the higher NFIP premiums
charged in V zones. Coverage levels, however, are not much different across the zones, although
we are unable to control for all factors that influence coverage levels to make an accurate
determination.
We also examined which counties generated the highest amount of flood insurance
claims between 2000 and 2005. Rather than looking at the total value of reimbursements
(a county with many more policies will receive more payments, all else being equal), we
examined the average insurance claim per policy in each county. For certain counties, this figure
is quite high indeed: $44,017 for Santa Rosa County, $34,954 for Escambia, and $10,259 for
Monroe County. The other eight counties in the top 10 are as follows: Wakulla ($8,868),
Okaloosa ($7,366), Franklin ($5,481), Baker ($3,499), Gilchrist ($3,083), De Soto ($3,035), and
Walton ($2,640).20 Santa Rosa and Escambia counties, located in the far northwest of Florida
(see Figure 1), both suffered severe losses from the 2004 hurricane season. Flood claims for
Santa Rosa were about $350 million, or about 30 percent of the total flood coverage in the
county; Escambia claims were $260 million, or 25 percent of its entire coverage. This came as a
surprise since only about 35 percent (Santa Rosa) and 40 percent (Escambia) of flood policies
are located in a 100-year floodplain in these two counties. This raises the question of what
determines the magnitude of NFIP claims, which we turn to in the next section.
Determinants of Claims Payments
The current debate about the future of the NFIP is mainly focused on how to make the
program more sustainable over the long term so that taxpayers are not held financially
20 Miami–Dade was ranked 23rd with an average of $929 in claims per policy over this period of time; Palm Beach was 59th with $148.

34
responsible for those living in high-risk areas. To shed light on this debate and make concrete
recommendations as to how the operation of the program can be improved (see section 4), we
used the data on single-family NFIP claims between 2000 and 2005 to uncover the key drivers of
claims payments in Florida.
In this analysis, we consider two dependent variables: the magnitude of a claim divided
by the amount of coverage purchased, and the magnitude of a claim divided by the recorded
property value.21 Our individual variables are somewhat limited by the data available, but we
were able to examine several factors considered relevant including location, mitigation, and
community policies. We look at the influence of the structural characteristics of a house that
could reduce damages, such as having more stories, having a basement, and being elevated, as
well as the impact of riskier locations—whether the home is located in a 100-year floodplain.
Finally, we assessed the impact of community flood mitigation measures by including a variable
for the CRS class of the community in which the property was located. Information on current
CRS class for each community in Florida is on the FEMA website and this was merged into our
claims data. CRS classes range from 1 to 9 (communities not participating are in class 10); each
class carries with it a 5 percent discount in premiums with class 1 receiving the maximum
reduction (i.e., a 45 percent discount) and class 9 receiving only a 5 percent discount.
Communities can improve their class ranking by adopting a range of policies that reduce flood
losses, improve awareness of flood risk, and/or facilitate accurate insurance ratings.
Unfortunately, data were missing for one or more variables for some of the observations,
21 As stated earlier, the value of the home was only available for about 75% of claims.
35
reducing the sample size somewhat. Still, after cleaning the data,22 more than 40,000
observations remained. Summary information on the variables is presented in Table 6.
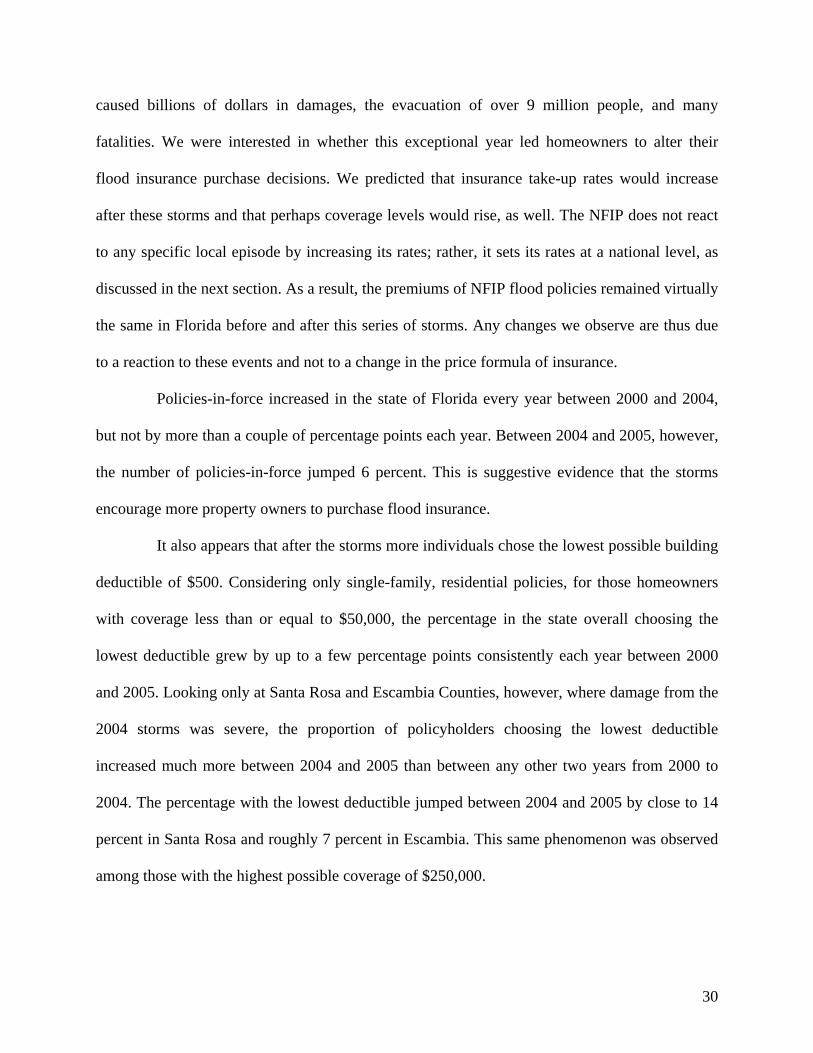
TABLE 6. SUMMARY OF DETERMINANTS OF CLAIMS DATA
Variable Mean Std. Dev. Min Max
Claims/property value 0.218 0.268 ~0 1
Claims/coverage 0.196 0.256 ~0 1
CRS class 7.01 1.63 523 10
More than 1 floor 0.273 0.446 0 1
Building elevated 0.218 0.413 0 1
Basement 0.075 0.264 0 1
SFHA 0.856 0.351 0 1
Simple ordinary least squares regressions were run on these data. Fixed effects for year,
county, and catastrophe number (unique identifying numbers given to named catastrophes, such
as hurricanes) were included. Although this should control for many potential influences on
claims, the results should be interpreted with a degree of caution because of potential omitted
variable bias. Results are presented in Table 7, with robust Huber–White standard errors in
parentheses. Column I shows the results with the natural log of claims over property value as the
dependent variable, and column II gives the results of the natural log of claims over coverage as
the dependent variable.24
22 For many claims, the payment was recorded as zero. These claims could have been closed without payment or the information was missing; they were not included in the regressions. Also, 25 observations had claims larger than coverage levels; these were dropped. Finally, just under 2 percent of claims had claim amounts entered that were larger than the value of the property. For these, the value of claims over coverage was set equal to one. 23 Although in theory communities could have a lower CRS class, it appears that no community in Florida has achieved a CRS rating better than 5. 24 We appreciate insightful suggestions on this regression by an anonymous referee.
36
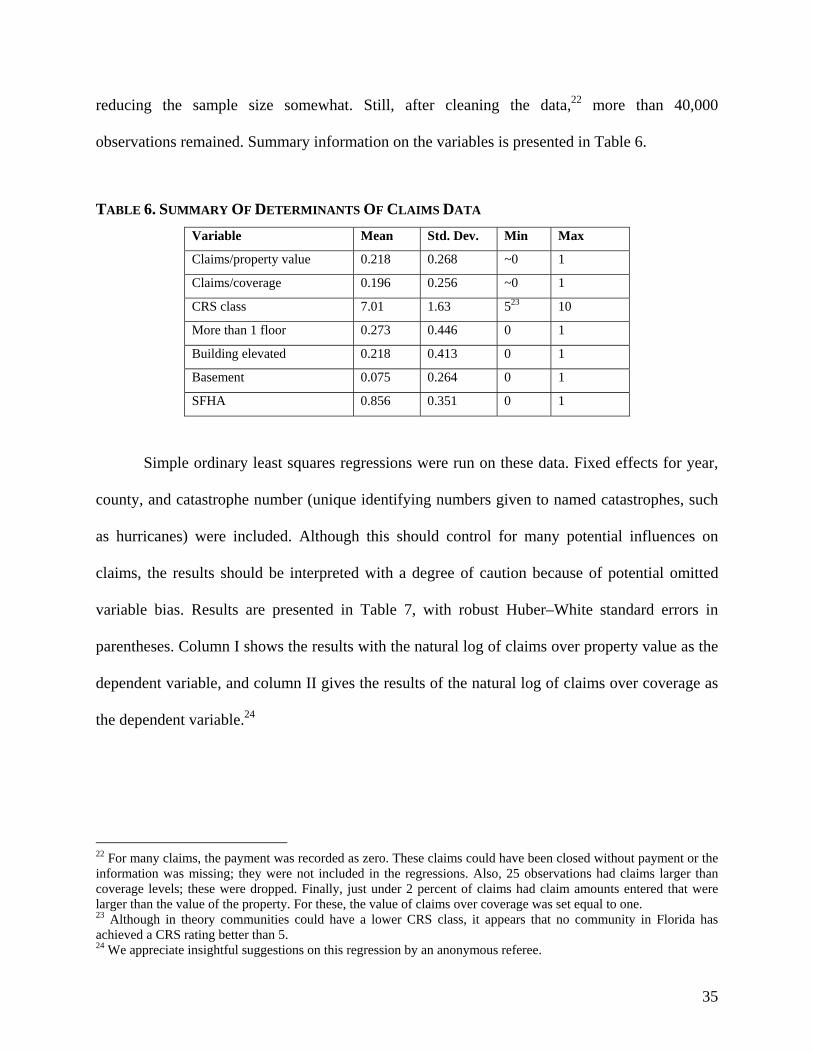
TABLE 7. REGRESSION RESULTS
Expected sign I ln(Claims/property value)
II ln(Claims/coverage)
Variable Coefficient Coefficient CRS class + 0.1614***
(0.0097) 0.1426*** (0.0067)
More than 1 floor – -0.5676*** (0.0227)
-0.5498*** (0.0185)
Building elevated – -0.5434*** (0.0234)
-0.6837*** (0.0219)
Basement +/– -0.0784** (0.0356)
-0.0222 (0.0340)
SFHA + 0.1985*** (0.0293)
0.1832*** (0.0219)
FE: Year, catastrophe number, county
Y Y
R-squared 0.1567 0.1828 N 42,573 42,573 Robust standard errors are given in parentheses. Coefficients significant at the 10 percent level are marked with *, those significant at the 5 percent level are marked with **, and those significant at the 1 percent level are designated by ***.
All signs are as predicted. The most striking result is the highly significant coefficient on
the CRS class variable. As a community adopts mitigating measures, it moves up in the CRS
ranking and achieves a lower CRS class (so, a higher CRS class number implies less mitigation).
Our results suggest that claims as a percentage of value or coverage increase by around 15
percent for a one-level increase in CRS class. More intuitively, mitigation pays: as communities
adopt mitigating activities, claims decrease. This result is important because we have not been
able to find such local evidence of CRS effectiveness in the literature.
Other coefficients are also as predicted. Homes with more floors have lower claims,
probably because damage does not affect the entire structure. Claims are much higher in the
riskiest areas—100-year floodplains (or SFHAs)—by just under 20 percent, whether as a
percentage of value or of coverage. Claims are also lower for buildings with basements,
potentially because in many cases, basements alone flood, leading homeowners to file small
claims (there are limitations on what the NFIP will cover in basements). When a building is

37
elevated, claims as a percentage of home value fall by almost 55 percent and claims as a
percentage of coverage fall by just under 70 percent; this is, by far, the most important driver of
claim reduction and shows, again, that proper risk reduction measures can substantially reduce
damages.
In our dataset, each claim includes a number indicating the catastrophe that caused the
loss. As already stated, fixed effects for these events were included in the regression. Although
not reported individually in Table 7, Hurricanes Ivan, Frances, and Charley all were associated
with highly significant increases in claims in both specifications, as were tropical storms Allison
and Gabrielle. The only catastrophe that led to statistically significant lower claims was October
flooding in 2001. This would suggest that hurricane-related water damage in Florida has been
more severe than non-hurricane flooding.
3.4. How are prices determined and how much does NFIP insurance cost in Florida?
The NFIP’s goals with regard to setting prices differ from those of a private insurance
company because the NFIP does not have to seek a profit, nor must its prices reflect the cost of
capital. With its pricing strategy, the NFIP not only seeks financial soundness, but also aims to
support floodplain management and encourage widespread adoption of flood insurance with its
pricing strategy (Hayes et al., 2007). As discussed above, certain properties are offered
subsidized rates, whereas others are charged the full-risk premium. Because just under a quarter
of all policies are subsidized, the entire program cannot be actuarially sound. The goal of the
NFIP regarding its pricing is thus not fiscal solvency, but the collection of enough premiums to
cover the operating expenses and losses associated with the historic average loss year (Hayes et
al., 2007).
38
This was more or less maintained until 2005; over the life of the program, losses resulting
from Hurricane Katrina were truly exceptional.25 FEMA has decided currently to give a
1 percent weight to the 2005 claims when determining the historic average loss year, while
seeking advice on an appropriate weighting going forward (Hayes et al., 2007). The NFIP has
borrowing authority from the U.S. Department of the Treasury, and at the end of 2007, it had
borrowed $17 billion, largely as a result of the 2004 and 2005 hurricane seasons. Current
revenue is unlikely to be sufficient to cover its operating expenses and claims as well as interest
and principal payments to the Treasury (GAO 2008a). Some determination will have to be made
regarding how the NFIP will repay these costs or whether the federal government will assume
the costs of catastrophe years.
“Actuarial” premiums set by FEMA are based first on the determination of the flood risk
zones. Rates are then set for each flood zone for the nation as a whole; rates for similar flood
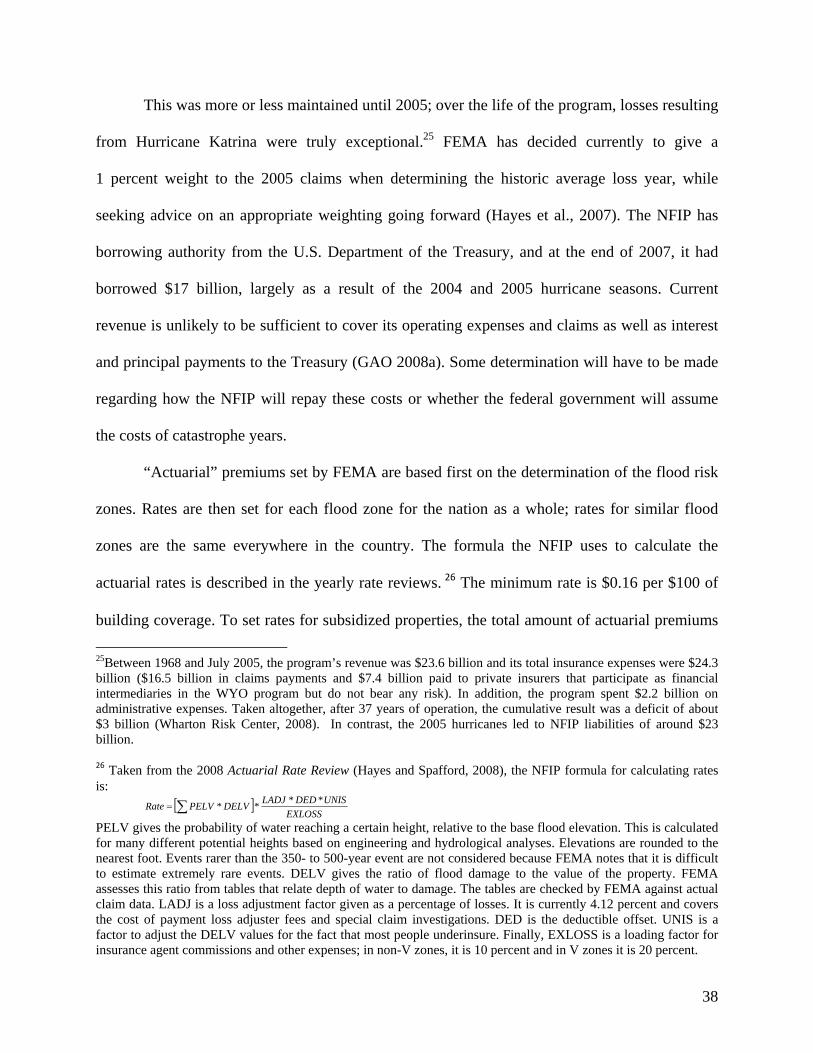
zones are the same everywhere in the country. The formula the NFIP uses to calculate the
actuarial rates is described in the yearly rate reviews. 26 The minimum rate is $0.16 per $100 of
building coverage. To set rates for subsidized properties, the total amount of actuarial premiums
25Between 1968 and July 2005, the program’s revenue was $23.6 billion and its total insurance expenses were $24.3 billion ($16.5 billion in claims payments and $7.4 billion paid to private insurers that participate as financial intermediaries in the WYO program but do not bear any risk). In addition, the program spent $2.2 billion on administrative expenses. Taken altogether, after 37 years of operation, the cumulative result was a deficit of about $3 billion (Wharton Risk Center, 2008). In contrast, the 2005 hurricanes led to NFIP liabilities of around $23 billion. 26 Taken from the 2008 Actuarial Rate Review (Hayes and Spafford, 2008), the NFIP formula for calculating rates is:
EXLOSS
UNISDEDLADJDELVPELVRate
****
PELV gives the probability of water reaching a certain height, relative to the base flood elevation. This is calculated for many different potential heights based on engineering and hydrological analyses. Elevations are rounded to the nearest foot. Events rarer than the 350- to 500-year event are not considered because FEMA notes that it is difficult to estimate extremely rare events. DELV gives the ratio of flood damage to the value of the property. FEMA assesses this ratio from tables that relate depth of water to damage. The tables are checked by FEMA against actual claim data. LADJ is a loss adjustment factor given as a percentage of losses. It is currently 4.12 percent and covers the cost of payment loss adjuster fees and special claim investigations. DED is the deductible offset. UNIS is a factor to adjust the DELV values for the fact that most people underinsure. Finally, EXLOSS is a loading factor for insurance agent commissions and other expenses; in non-V zones, it is 10 percent and in V zones it is 20 percent.

39
the NFIP expects to collect is subtracted from the historical average loss year to determine a
target amount of revenue that subsidized properties must generate. Rates also vary by certain
characteristics of the house, such as its height above base flood elevation. NFIP rates are revised
once a year in May. By law, any yearly increase in premiums cannot exceed 10 percent overall.
This pricing strategy clearly leads to important cross-subsidizations in the program. Rates
are not risk-based at the local level, so prices will be “too high” in some areas and “too low” in
others. The GAO notes this problem that rates do not reflect local topographical conditions and
finds that a look at historical claim and premium data suggests that NFIP rates are not always
reflections of the risk (GAO 2008a). Without a detailed analysis of expected losses in various
locations, however, it is impossible to say if and how much the prices of NFIP policies may
deviate from true risk-based rates. The GAO has further criticized some aspects of the NFIP
pricing strategy. Some of the data used are outdated, such as estimates of flood probabilities that
are from the 1980s, and some data are inaccurate, such as damage estimates that do not reflect
the full amount of NFIP claim experience (GAO 2008a).
The NFIP’s pricing strategy of basing rates on a historical average loss year does not
leave room for anticipation of changes in future conditions. With the long delay in updating
maps (as of April 2008, close to two-thirds of the maps were more than 10 years old [GAO
2008a]), even without climate change, risk designations are often outdated because of changes in
development that in some places have dramatically altered the risk. This leads to rates that do not
reflect risk, potentially sending misleading signals to property owners.
The 2008 Rate Review gives the average premium for different flood zones. The actuarial
rates (nonsubsidized properties) are shown in Table 8. It is clear from the table that, although the

40
V zones along the coast represent a very small percentage of business, the risks of flood damage
in these areas, and thus the rates for these zones, are much higher.
TABLE 8: NFIP ACTUARIAL AVERAGE PREMIUMS
Zone Percentage of business Average annual premium as of May 2008
(US$)
AE,A,AO,AH,AOB,AHB 39.6% 429.92
POST-81 V,VE 0.9% 2,270.27
B,C,X 37.3% 394.34
Source: Hayes and Spafford (2008).
Since rates are set by zone for the entire country, variations in the average premium
across geographic areas reflect differences in the percentage of homes located in different flood
zones, the structure of the home (basement, elevation, etc.), or the nature of the policy (selected
deductible and limit). When looking at the average premium paid per $1,000 of coverage in
Florida in 2005, the cost ranges from $1.30 in Flagler County to $7.50 in Dixie County, with a
mean of $2.79 and a median of $2.50. Interestingly, the counties in which the cost of insurance
was the most expensive are not necessarily those with the highest proportion of policies in
SFHAs: more than 50 percent of policies in Palm Beach, Broward, and Santa Rosa Counties
were in these high-risk zones, but these are among the counties with the lowest average cost of
flood insurance. Variations in average cost must therefore be due to differences in the types of
homes insured and the coverage and deductible chosen by homeowners.
In looking at the change in the average premium per $1,000 of coverage between 2000
and 2005, we find that not only did this not increase, but it significantly decreased in all but two
of the 67 counties in Florida. Surprisingly, the decline in cost is even more severe when one
considers Santa Rosa and Escambia counties. As we analyze above, these two counties suffered
the most damage from the 2004 hurricanes. Further, these two counties also saw a significant

41
increase in the proportion of flood policies located in high-risk areas (data not reported here).
Nevertheless, the average cost of flood insurance in Santa Rosa decreased from $2.27 per $1,000
of flood coverage in 2000 to $1.60 in 2005 (i.e., a 29 percent decrease); in Escambia County, the
cost decreased from $2.85 per $1,000 of flood coverage in 2000 to $1.91 in 2005 (a 33 percent
decrease). We know from the NFIP rate reviews that premiums for many of the zones increased
somewhat—rather than decreased—over this time period. So what is driving the drop in average
prices?
Although this decline in average cost per $1,000 might seem counterintuitive, there are
several explanations. First, more single-family homeowners outside of floodplains in these two
counties purchased policies between 2000 and 2005 (possibly because, regardless of whether you
live in a 100-year floodplain, a flood close to you is a vivid reminder of your possible exposure),
and these are the lowest-cost policies. In Escambia, the percentage of policies outside of 100-
year floodplains grew from 36 percent in 2000 to 60.2 percent in 2005. In Santa Rosa, the
percentage grew from 46.8 percent to 65.2 percent. As a result, the average cost per $1,000 of
coverage throughout each of these counties decreased. Second, there was a relative decline in the
proportion of policies in the most expensive V zones. For Escambia, the percentage of policies in
V zones dropped from 6.2 percent in 2000 to 3.1 percent in 2005. In Santa Rosa, the percentage
of policies in V zones fell from 4.3 percent in 2000 to 2.7 percent in 2005. This also has driven
down the average cost in each county. Finally—and this had a stronger effect on lowering the
average insurance cost—homeowners in these counties significantly increased their coverage
levels between 2000 and 2005. The pricing formula described above is not linear in dollars of
coverage because the probability of suffering the first $X of loss is higher than the probability of
suffering $2X of loss. In Escambia, the mean building coverage for single-family, residential
42
policies increased from $130,822 in 2000 to $171,233 in 2005—a large 31 percent increase. In
Santa Rosa, it increased from $137,967 to $186,496—an increase of 35 percent. Therefore,
although individuals are more protected and might be paying more in absolute terms, the average
cost per $1,000 of coverage decreased significantly after the 2004 floods in these two counties.
4. Conclusion and Possible Improvements to the NFIP
This paper has provided an overview of both the functioning of the NFIP at a national
level and a close look at policies and claims in the state of Florida, which has the largest share of
NFIP policies and coverage-in-force. We hope that these results will contribute to a better
microeconomic understanding of the market for flood insurance in the United States. This is an
important issue because flood losses have been accelerating over the past 15 years, largely due to
more and more people locating in high-risk areas. The NFIP has also seen a significant change in
the scope of its operation over these past 15 years. From 1992 to 2007, it has grown from
2.5 million policies to more than 5.5 million, from $800 million in premiums collected from
policyholders to $2.6 billion, and from covering $237 billion in value at risk to more than
$1 trillion—increases of 120, 225, and 320 percent, respectively.
Some of our findings are in accordance with well-documented expectations on
homeowners’ decisionmaking regarding insurance purchasing and the functioning of the NFIP.
Other findings, however, revealed some common misconceptions. The extreme concentration of
the NFIP market in a few states is somewhat surprising because one may expect flood risk to be
spread more broadly across the country. It may be one more indication of the trend toward
increased capital and people in coastal areas. The NFIP is also concentrated within Florida such
that the highest concentration of coverage and policies-in-force is on the coasts. Since this is the
43
area of highest hurricane risk, the main flooding threat in the state, this is understandable. With
the high concentration of the NFIP portfolio along the Gulf coast, the NFIP has become
somewhat of a hurricane insurance program, although it does not cover wind damage.
The massive debt the NFIP now faces from the Hurricane Katrina claims, coupled with
the pricing strategy discussed here, makes it evident that the NFIP is not designed to be self-
sufficient financially in the aftermath of truly catastrophic losses. This issue requires serious
consideration as the NFIP comes up for renewal in the autumn of 2009. To limit taxpayer
liability for damages incurred by those living in the riskiest areas, several changes could be
implemented. First, prices could be modified to reflect the most recent information about
exposure, which would probably lead to increases in insurance premiums collected every year by
the program. Second, FEMA could partner with the private sector or draw on the financial
markets to access additional capital to address truly catastrophic flooding; this could be done, for
example, through the issuance of pre- or postevent bonds. Finally, because more than a third of
every dollar paid by an NFIP policyholder goes to the administrative costs of private insurers
that do not bear any risk, it would certainly be important for the GAO to analyze whether the
level of this payment is still justified 40 years after the program’s inception.
Another important way to make the NFIP more effective would be to focus more heavily
on risk reduction. Our analysis of claims in Florida clearly indicates that mitigation works.
Claims are much lower both for elevated homes and, perhaps more importantly from a policy
perspective, for communities which are taking part in the NFIP’s CRS. The reductions in
premiums seem to be roughly warranted as communities that adopt mitigating measures do have
lower claims, all else being equal. To further lower losses, more effort could be put into
encouraging communities to join this program and to accelerate through the levels. One might

44
also consider household-level premium reductions for property owners who flood-proof their
homes or businesses.
Our analysis also provides some evidence that people drop coverage quickly. A more
radical change to address this problem would be for FEMA to start offering multiyear flood
insurance contracts rather than the current one-year contracts. Indeed, since the NFIP is managed
at a federal level, nothing precludes FEMA from issuing 5, 10 or even 20-year flood policies tied
to the property (rather than to the individual) that would go hand-in-hand with the mortgage; this
could also make investment in mitigation more attractive over time. For instance, if long-term
flood insurance policies are in place (rates could be reviewed every 5 or 10 years), FEMA could
offer 20-year risk reduction loans to its policyholders to incentivize them to reduce their
exposure to flood. If policyholders can benefit from an annual rebate on their flood insurance
that is greater than the annual loan payment, this would be a win–win situation for everyone27.
Finally, in discussions over reforms to the NFIP, the issue of coverage limits is often
raised. Although some homeowners in Florida might desire higher coverage, the current limit is
not binding for the majority of homeowners. It has become more binding over time, however,
suggesting possible demand for an increased limit. The response to the 2004 hurricane season
also suggests that homeowners may desire more coverage and that this demand will become
more pronounced if Florida has another devastating hurricane season in the coming years. Excess
coverage is available through the private market, however, and to the extent that NFIP rates are
not risk-based, there may be equity concerns in continuing to offer coverage to the wealthiest
residents. Instead of or in addition to offering more coverage, the NFIP could better connect
homeowners with private insurers offering higher levels of flood coverage.
27 For more on the possibility of long-term insurance contracts, see: Jaffee et al., 2008; Kunreuther and Michel-Kerjan, 2009.
45
REFERENCES
Anderson, D. R., 1974, The National Flood Insurance Program: Problems and Potential, The Journal of
Risk and Insurance, 41(4): 579–599.
Best’s Review, 2006, High Water Mark: Privatizing Flood, Best’s Review, July 1.
Browne, M. J., and R. E. Hoyt, 2000, The Demand for Flood Insurance: Empirical Evidence, Journal of
Risk and Uncertainty, 20(3): 291–306.
Center for Sustainable Communities, 2006, Pennypack Creek Watershed Study, Center for Sustainable
Communities, Temple University.
Congressional Budget Office (CBO), 2007, Value of Properties in the National Flood Insurance Program
(Washington, DC: Congressional Budget Office).
Criss, R. E., and E. L. Shock, 2001, Flood Enhancement through Flood Control, Geology, 29(10): 875–
878.
Cutler, D., and R. Zeckhauser, 2004, Extending the Theory to Meet the Practice of Insurance
(Washington, DC: The Brookings Institute).
Dixon, L., N. Clancy, S. A. Seabury, and A. Overton, 2006, The National Flood Insurance Program’s
Market Penetration Rate: Estimates and Policy Implications (Santa Monica, CA: RAND
Corporation).
Dixon, L., N. Clancy, B. Bender, and P. K. Ehrler, 2007, The Lender-Placed Flood Insurance Market for
Residential Properties (Santa Monica, CA: RAND Corporation).
Eldred, G. W., 1980, How Wisely Do Consumers Select Their Property and Liability Insurance
Coverages? Journal of Consumer Affairs, 14: 288–306.
Federal Emergency Management Agency (FEMA), 2002, National Flood Insurance Program: Program
Description (Washington, DC: Federal Emergency Management Agency, Federal Insurance and
Mitigation Administration).
Gerdes, V., 1963, Insuring against Flood Peril, The Journal of Insurance, 30(4): 547–553.
Government Accountability Office (GAO), 2006, Flood Insurance: Extent of Noncompliance with
Purchase Requirements Is Unknown (Washington, DC: U.S. Government Accountability Office).
Government Accountability Office (GAO), 2008a, Flood Insurance. FEMA’s Rate-Setting Process
Warrants Attention, GAO-09-12, October (Washington, DC: U.S. Government Accountability
Office).
Government Accountability Office (GAO), 2008b, Flood Insurance. Options for Addressing the
Financial Impact of Subsidized Premium Rates on the National Flood Insurance Program, GAO-
09-20, November (Washington, DC: U.S. Government Accountability Office).

46
Grossman, D. A., 1958, Flood Insurance: Can a Feasible Program Be Created? Land Economics, 34(4):
352–357.
Hartwig, Robert, and Claire Wilkinson, 2005, Public/Private Mechanisms Handling
Catastrophic Risk in the United States, October (New York, NY: Insurance Information
Institute).
Hayes, T. L., D. R. Spafford, and J. P. Boone, 2007, Actuarial Rate Review: In Support of the May 1,
2007 Rate and Rule Changes (Washington, DC: Federal Emergency Management Agency).
Hayes, T. L., and D. R. Spafford, 2008, Actuarial Rate Review: In Support of the May 1, 2008, Rate and
Rule Changes (Washington, DC: Federal Emergency Management Agency).
Jaffee, D., H. Kunreuther, and E. Michel-Kerjan, 2008, Long Term Insurance (LTI) for Addressing
Catastrophe Risk, NBER Working Papers, 14210 (Cambridge, MA: National Bureau of
Economic Research).
Kriesel, W., and C. Landry, 2004, Participation in the National Flood Insurance Program: An Empirical
Analysis for Coastal Properties, The Journal of Risk and Insurance, 71(3): 405–420.
Kunreuther, H. C., ed., 1978, Disaster Insurance Protection: Public Policy Lessons (New York, NY:
John Wiley and Sons).
Kunreuther, H. C., 1979, The Changing Societal Consequences of Risks from Natural Hazards, Annals of
the American Academy of Political and Social Science, 443: 104–116.
Kunreuther, H. C., and E. Michel-Kerjan, 2009, Market and Government Failure in Insuring and
Mitigating Natural Catastrophes: How Long-Term Contracts Can Help, in: J. Brown, ed., Private
Markets and Public Insurance Programs (Washington, DC: American Enterprise Institute).
Kunreuther, H. C., and E. Michel-Kerjan, 2007, Climate Change, Insurability of Large-Scale Risks and
the Emerging Liability Challenge, Penn Law Review, 155(6): 1795–1842.
Menzinger, I., and C. Brauner, 2002, Floods are Insurable! (Zurich, Switzerland: Swiss Reinsurance
Company).
Munich Re, 2008, Press release. Catastrophe figures for 2008 confirm that climate agreement is urgently
needed. December 29.
Overman, E. S., 1957, The Flood Peril and the Federal Flood Insurance Act of 1956, Annals of the
American Academy of Political and Social Science, 309(January): 98–106.
Pasterick, E. T., 1998, The National Flood Insurance Program, in: H. Kunreuther and R. J. Roth, Sr., eds.,
Paying the Price: The Status and Role of Insurance against Natural Disasters in the United
States (Washington, DC: Joseph Henry Press).
Perry, C. A., 2000, Significant Floods in the United States During the 20th Century—USGS Measures a
Century of Floods, USGS Fact Sheet 024–00 (Lawrence, KS: U.S. Geological Survey).

47
Power, F. B., and E. W. Shows, 1979, A Status Report on the National Flood Insurance Program. Mid
1978, The Journal of Risk and Insurance, 46(2): 61–76.
PricewaterhouseCoopers, 1999, Study of the Economic Effects of Charging Actuarially Based Premium
Rates for Pre-FIRM Structures (New York, NY: PricewaterhouseCoopers LLP).
Silverman, R., 2005, Insurers Introduce Flood Coverage Aimed at Costly Homes, The Wall Street
Journal, September 1.
Swiss Re, 2008a, Natural Catastrophes and Man-Made Disasters in 2007: High Losses in Europe, Sigma,
1.
Swiss Re, 2008b, “Preliminary Swiss Re sigma estimates that over 238 000 people were killed by
catastrophes in 2008, insured losses soar to $50 billion”, Media release. December 18.
Sydnor, J., 2006, Abundant Aversion to Moderate Risk: Evidence from Homeowners Insurance (mimeo),
University of California, Berkeley, CA.
Tobin, R., and C. Calfee, 2005, The National Flood Insurance Program’s Mandatory Purchase
Requirement: Policies, Processes, and Stakeholders (Washington, DC: American Institutes for
Research).
Wetmore, F., G. Bernstein, D. Conrad, L. Larson, D. Plasencia, R. Riggs, J. Monday, M. F. Robinson,
and M. Shapiro, 2006, An Evaluation of the National Flood Insurance Program: Final Report
(Washington, DC: American Institutes for Research).
Wharton Risk Center, 2008, Managing Large-Scale Risks in a New Era of Catastrophes: The Role of the
Private and Public Sectors in Insuring, Mitigating and Financing Recovery from Natural
Disasters in the United States, study undertaken under the direction of Howard Kunreuther and
Erwann Michel-Kerjan (Philadelphia, PA: The Wharton Risk Management and Decision
Processes Center); forthcoming as At War with the Weather, MIT Press, (2009).