Embed Size (px)
Citation preview
Comparison and reproducibility of two regions of reference for CBCT maxillary regional registration
Antonio Carlos de Oliveira Ruellas,[email protected] Associate Professor, Federal University of Rio de Janeiro, Rio de Janeiro, Brazil. CNPq Researcher. Post-doctoral fellow, School of Dentistry, University of Michigan, Ann Arbor, MI, USA. study design, data acquisition, data analysis/interpretation, statistical analysis, manuscript preparation, manuscript editing, manuscript revision/review, manuscript final version approval
Luis T. Huanca Ghislanzoni,[email protected] Department of Biomedical Sciences and Health, University of Milan, Italy. study concepts, literature research, data acquisition, manuscript preparation
Marcelo Regis Gomes,[email protected] DDS, Federal University of Bahia, Salvador, Bahia, Brazil. data acquisition
Carlotta Danesi,[email protected] DDS Student, University of Rome. Italy. data acquisition
Roberta Lione,[email protected] Department of Clinical Sciences and Translational Medicine, University of Rome "Tor Vergata", Italy. data acquisition
Tung Nguyen,[email protected] Assistant Professor, Department of Orthodontics, School of Dentistry, University of North Carolina, Chapel Hill, NC, USA. manuscript editing, manuscript revision/review
James A. McNamara Jr.,[email protected] Department of Orthodontics and Pediatric Dentistry, School of Dentistry, University of Michigan, Ann Arbor, MI, USA. manuscript editing, manuscript revision/review
Paola Cozza,[email protected] Department of Clinical Sciences and Translational Medicine, University of Rome "Tor Vergata", Italy. study concepts, data acquisition
Lorenzo Franchi, [email protected] Department of Surgery and Translational Medicine, University of Florence, Italy. Department of Orthodontics and Pediatric Dentistry, University of Michigan, USA. study
Publisher's Disclaimer: This is a PDF file of an unedited manuscript that has been accepted for publication. As a service to our customers we are providing this early version of the manuscript. The manuscript will undergo copyediting, typesetting, and review of the resulting proof before it is published in its final citable form. Please note that during the production process errors may be discovered which could affect the content, and all legal disclaimers that apply to the journal pertain.
HHS Public AccessAuthor manuscriptAm J Orthod Dentofacial Orthop. Author manuscript; available in PMC 2017 April 01.
Published in final edited form as:Am J Orthod Dentofacial Orthop. 2016 April ; 149(4): 533–542. doi:10.1016/j.ajodo.2015.09.026.
Author M
anuscriptA
uthor Manuscript
Author M
anuscriptA
uthor Manuscript
concepts , study design, statistical analysis, manuscript editing, manuscript revision/review. Supervisor
Lucia Helena Soares [email protected] Department of Orthodontics and Pediatric Dentistry, School of Dentistry, University of Michigan, Ann Arbor, MI, USA. study concepts, study design, data analysis/interpretation, manuscript editing, manuscript revision/review, manuscript final version approval, Main Supervisor
Abstract
Introduction—the aim of this study was to evaluate the differences between 2 regions of
maxillary voxel-based registration and to test the reproducibility of the registration.
Methods—3D models were built for before treatment (T1) and after treatment (T2) Cone Beam
CTs for 16 growing subjects. Landmarks were labeled in all T2 models of the maxilla, and voxel-
based registration was performed independently by two observers, at two different times, using
two different reference regions: 1) the Maxilla region (MAX) included the maxillary bone clipped
inferiorly at the dentoalveolar processes, superiorly at the plane passing through the right and left
orbitale points, laterally at the zygomatic processes through the orbitale point, and posteriorly at a
plane passing through the distal surface of the second molars. 2) the Palate and Infra-zygomatic
region (PIZ) had different posterior and anterior limits (at the plane passing through the distal of
the first molar and distal of the canines, respectively). The differences between the registration
regions were measured by comparing the distances between corresponding landmarks in the T2
registered models and comparing corresponding x,y,z coordinates from corresponding landmarks.
Statistical analysis of the differences between T2 surface models was performed by evaluating the
means and standard deviations of the distances between landmarks and by testing the agreement
between coordinates from corresponding landmarks (ICC and Bland-Altman method).
Results—The means of the differences between landmarks from PIZ to MAX 3D T2 surface
models for all of the regions of reference, times of registrations and observers combinations were
smaller than 0.5 mm. The ICC and the Bland-Altman plots indicated adequate concordance.
Conclusions—Both regions of regional maxillary registration (MAX and PIZ) showed similar
results and adequate intra- and inter-observer reproducibility.
Keywords
Cone Beam Computed Tomography; Maxilla; Superimposition; Reproducibility of Results
Introduction
Growth and development of the face has an important role in determining overall facial
pattern and the nature of the occlusion. Previous studies1-5 have shed light on the complex
mechanisms of maxillary and mandibular growth and remodeling but a better understanding
of the direction, amount and pattern of growth, as well response to treatment still is required.
A correct jaw relationship depends on adequate interactions among a series of basal and
dentoalveolar adaptations in the sagittal, vertical and transverse planes. Serial cephalometric
radiographs1,6,7 have been used for dynamic studies of these interactions in growing
Ruellas et al. Page 2
Am J Orthod Dentofacial Orthop. Author manuscript; available in PMC 2017 April 01.
Author M
anuscriptA
uthor Manuscript
Author M
anuscriptA
uthor Manuscript
children; in particular longitudinal implant studies have indicated stable areas of reference
for understanding regional changes during growth.6,8,9
Superimposition on these stable maxillary structures can be used to evaluate growth and
treatment changes in the maxillary dentoalveolar complex. Multiple registration regions and
superimposition methods have been proposed in the literature. The “structural method”
based on stable structures of the maxilla (such as the anterior surface and tip of the
zygomatic process or “key ridge”)9 was found to be almost equivalent to the implant
method.10 On the other hand, superimpositions along the palatal plane using the anterior
nasal spine as a reference were less reproducible in relation to the structural method.10 A
superimposition using the best fit of internal palatal structures has also been proposed by
McNamara.11 However, Björk’s methods of superimposition on metallic implants still
remain the gold standard for superimposition of the maxillary structures6,9. Currently,
however, there are ethical implications for implant placement for research purposes.
The advent of three-dimensional (3D) cone-beam computed tomography (CBCT) allowed
the observation of skeletal and dental changes that could not be attempted with standard 2D
radiographs. 3D registrations offer advantage over 2D including volume/regions of interest
for registration rather points or lines, lack of distortion of bilateral structures, and head
positioning errors. However, anatomical structures reported to be stable on lateral headfilm
may not be reliable for 3D analysis that also involves the transverse dimension.12
Cevidanes et al. validated a method for voxel-based superimposition of the cranial base to
assess post-treatment changes in growing13 and adult14 patients. Based on the cranial base
registrations, it is possible to quantify the skeletal displacements of both the maxilla and
mandible relative to the anterior cranial base used as a stable reference structure. Recently,
Schilling et al15 suggested a regional superimposition method to assess dental changes and
subtle bone remodeling within the mandible that considers the symphysis as a stable
reference structure. To date, no study in the literature described the 3D voxel-based regional
superimposition method for the maxilla.
The current study had two objectives: to evaluate the differences between 2 regions of
maxillary voxel-based registration and to test the intra- and inter-observer reproducibility of
these registrations.
Subjects and methods
This retrospective study was based on a sample of 16 growing subjects (from 9 to 13 years)
comprising of 8 subjects who were treated with rapid maxillary expansion (RME) for
crossbite correction and 8 subjects who were treated with the Herbst appliance for the
correction of Class II malocclusion. CBCT scans (0.4 mm voxel-size, 16x22 cm FOV) of all
subjects were already available at two time points with, at least, six months of interval
between them: before (T1) and after treatment (T2) taken using an iCat machine (Imaging
Sciences International, Hatfield, PA).
This study was approved by the University of Michigan Institutional Review Board
(HUM00095895).
Ruellas et al. Page 3
Am J Orthod Dentofacial Orthop. Author manuscript; available in PMC 2017 April 01.
Author M
anuscriptA
uthor Manuscript
Author M
anuscriptA
uthor Manuscript
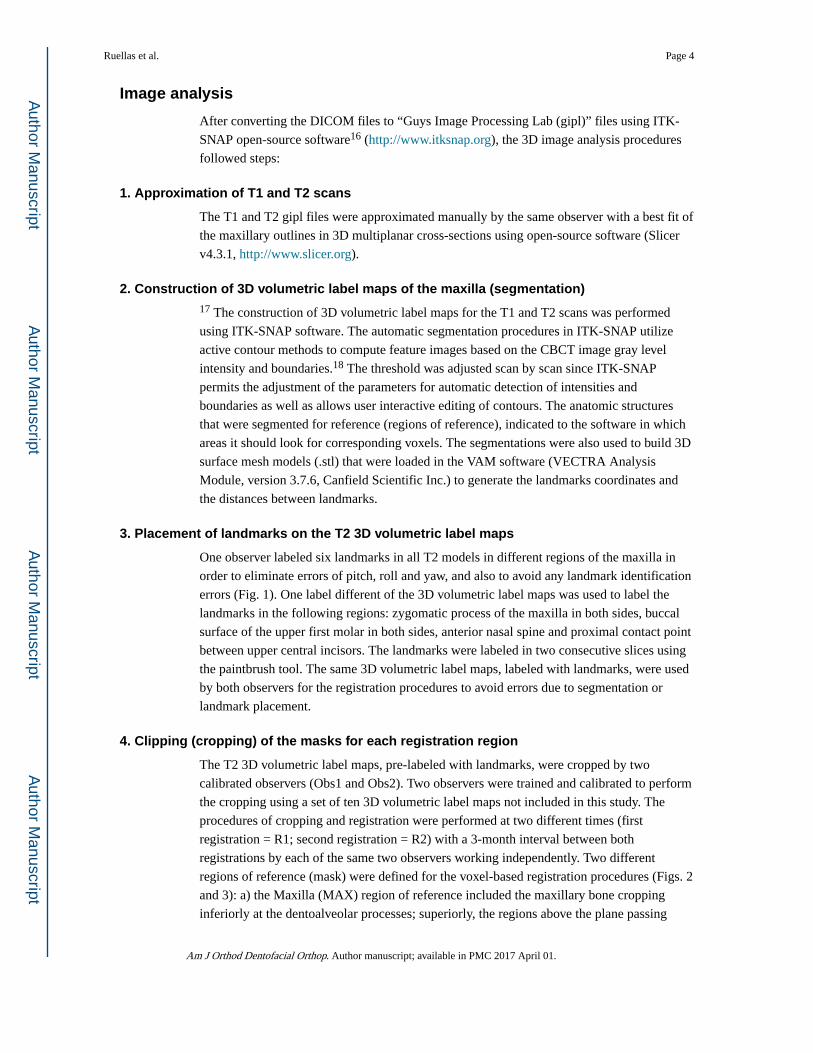
Image analysis
After converting the DICOM files to “Guys Image Processing Lab (gipl)” files using ITK-
SNAP open-source software16 (http://www.itksnap.org), the 3D image analysis procedures
followed steps:
1. Approximation of T1 and T2 scans
The T1 and T2 gipl files were approximated manually by the same observer with a best fit of
the maxillary outlines in 3D multiplanar cross-sections using open-source software (Slicer
v4.3.1, http://www.slicer.org).
2. Construction of 3D volumetric label maps of the maxilla (segmentation)17 The construction of 3D volumetric label maps for the T1 and T2 scans was performed
using ITK-SNAP software. The automatic segmentation procedures in ITK-SNAP utilize
active contour methods to compute feature images based on the CBCT image gray level
intensity and boundaries.18 The threshold was adjusted scan by scan since ITK-SNAP
permits the adjustment of the parameters for automatic detection of intensities and
boundaries as well as allows user interactive editing of contours. The anatomic structures
that were segmented for reference (regions of reference), indicated to the software in which
areas it should look for corresponding voxels. The segmentations were also used to build 3D
surface mesh models (.stl) that were loaded in the VAM software (VECTRA Analysis
Module, version 3.7.6, Canfield Scientific Inc.) to generate the landmarks coordinates and
the distances between landmarks.
3. Placement of landmarks on the T2 3D volumetric label maps
One observer labeled six landmarks in all T2 models in different regions of the maxilla in
order to eliminate errors of pitch, roll and yaw, and also to avoid any landmark identification
errors (Fig. 1). One label different of the 3D volumetric label maps was used to label the
landmarks in the following regions: zygomatic process of the maxilla in both sides, buccal
surface of the upper first molar in both sides, anterior nasal spine and proximal contact point
between upper central incisors. The landmarks were labeled in two consecutive slices using
the paintbrush tool. The same 3D volumetric label maps, labeled with landmarks, were used
by both observers for the registration procedures to avoid errors due to segmentation or
landmark placement.
4. Clipping (cropping) of the masks for each registration region
The T2 3D volumetric label maps, pre-labeled with landmarks, were cropped by two
calibrated observers (Obs1 and Obs2). Two observers were trained and calibrated to perform
the cropping using a set of ten 3D volumetric label maps not included in this study. The
procedures of cropping and registration were performed at two different times (first
registration = R1; second registration = R2) with a 3-month interval between both
registrations by each of the same two observers working independently. Two different
regions of reference (mask) were defined for the voxel-based registration procedures (Figs. 2
and 3): a) the Maxilla (MAX) region of reference included the maxillary bone cropping
inferiorly at the dentoalveolar processes; superiorly, the regions above the plane passing
Ruellas et al. Page 4
Am J Orthod Dentofacial Orthop. Author manuscript; available in PMC 2017 April 01.
Author M
anuscriptA
uthor Manuscript
Author M
anuscriptA
uthor Manuscript
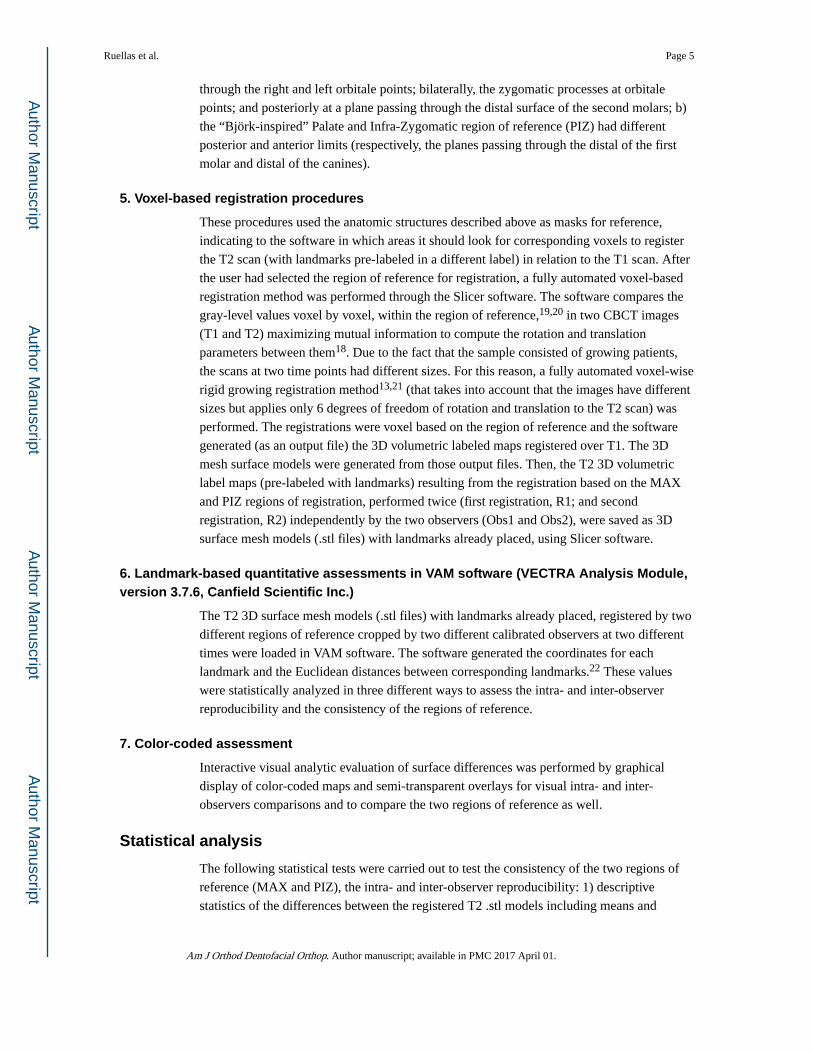
through the right and left orbitale points; bilaterally, the zygomatic processes at orbitale
points; and posteriorly at a plane passing through the distal surface of the second molars; b)
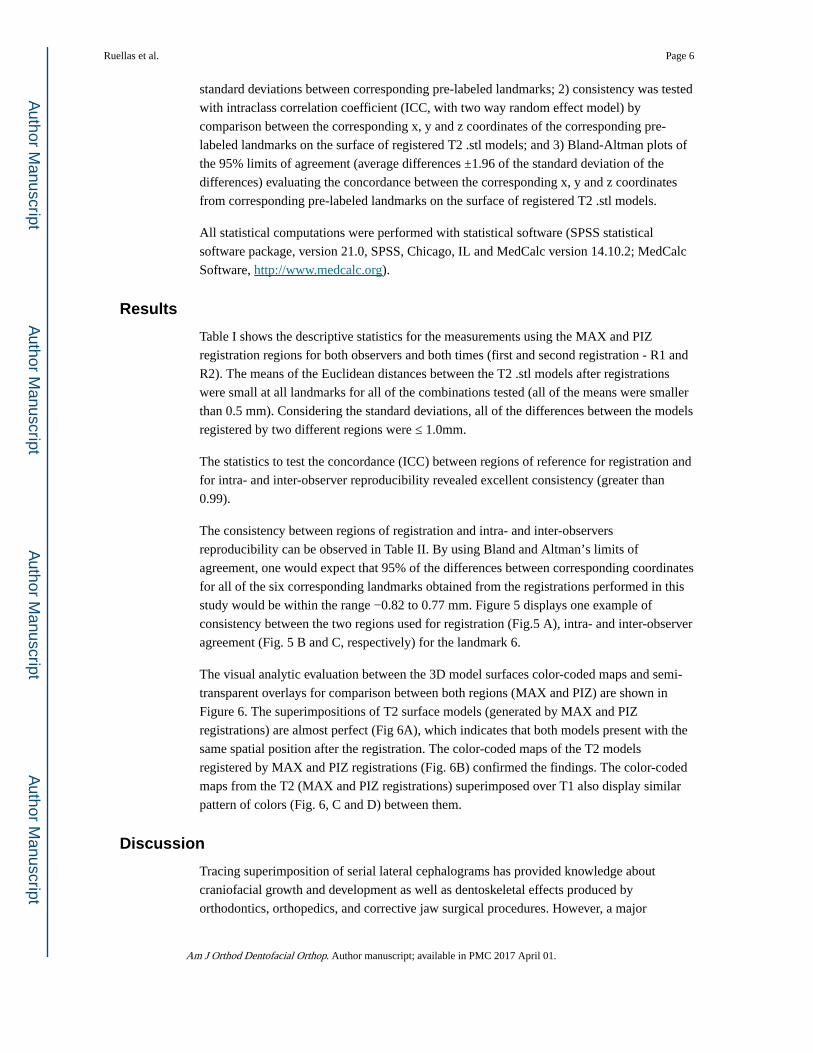
the “Björk-inspired” Palate and Infra-Zygomatic region of reference (PIZ) had different
posterior and anterior limits (respectively, the planes passing through the distal of the first
molar and distal of the canines).
5. Voxel-based registration procedures
These procedures used the anatomic structures described above as masks for reference,
indicating to the software in which areas it should look for corresponding voxels to register
the T2 scan (with landmarks pre-labeled in a different label) in relation to the T1 scan. After
the user had selected the region of reference for registration, a fully automated voxel-based
registration method was performed through the Slicer software. The software compares the
gray-level values voxel by voxel, within the region of reference,19,20 in two CBCT images
(T1 and T2) maximizing mutual information to compute the rotation and translation
parameters between them18. Due to the fact that the sample consisted of growing patients,
the scans at two time points had different sizes. For this reason, a fully automated voxel-wise
rigid growing registration method13,21 (that takes into account that the images have different
sizes but applies only 6 degrees of freedom of rotation and translation to the T2 scan) was
performed. The registrations were voxel based on the region of reference and the software
generated (as an output file) the 3D volumetric labeled maps registered over T1. The 3D
mesh surface models were generated from those output files. Then, the T2 3D volumetric
label maps (pre-labeled with landmarks) resulting from the registration based on the MAX
and PIZ regions of registration, performed twice (first registration, R1; and second
registration, R2) independently by the two observers (Obs1 and Obs2), were saved as 3D
surface mesh models (.stl files) with landmarks already placed, using Slicer software.
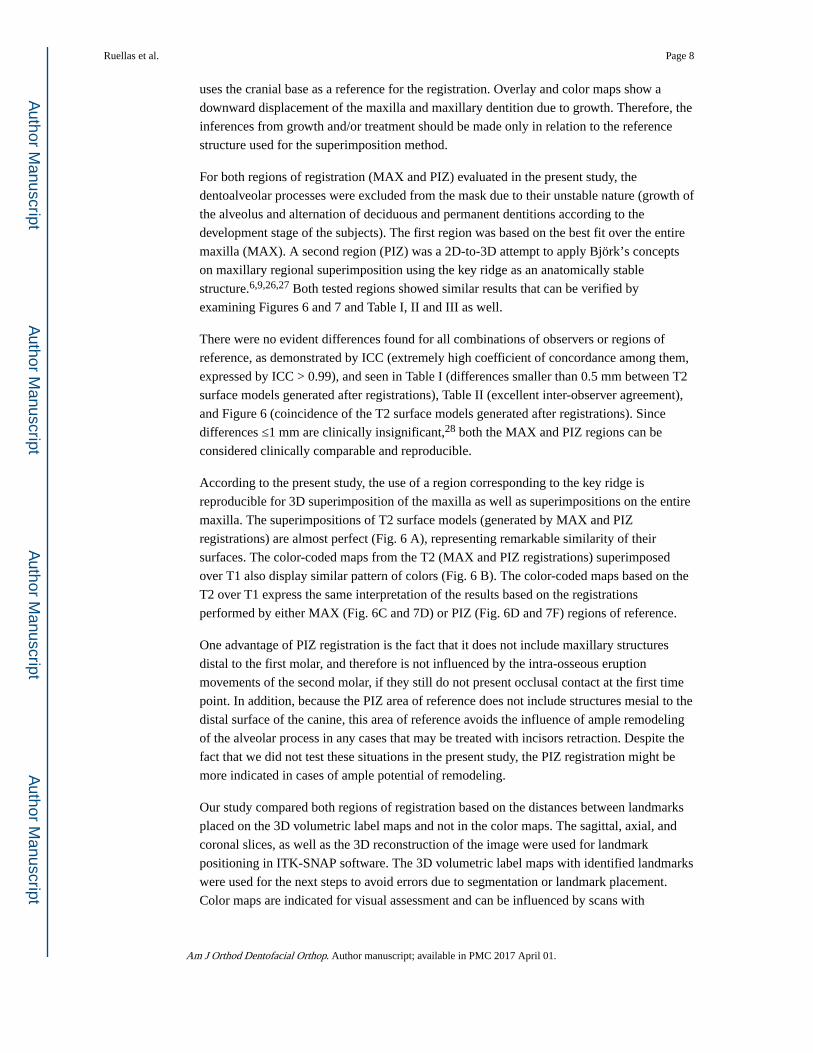
6. Landmark-based quantitative assessments in VAM software (VECTRA Analysis Module, version 3.7.6, Canfield Scientific Inc.)
The T2 3D surface mesh models (.stl files) with landmarks already placed, registered by two
different regions of reference cropped by two different calibrated observers at two different
times were loaded in VAM software. The software generated the coordinates for each
landmark and the Euclidean distances between corresponding landmarks.22 These values
were statistically analyzed in three different ways to assess the intra- and inter-observer
reproducibility and the consistency of the regions of reference.
7. Color-coded assessment
Interactive visual analytic evaluation of surface differences was performed by graphical
display of color-coded maps and semi-transparent overlays for visual intra- and inter-
observers comparisons and to compare the two regions of reference as well.
Statistical analysis
The following statistical tests were carried out to test the consistency of the two regions of
reference (MAX and PIZ), the intra- and inter-observer reproducibility: 1) descriptive
statistics of the differences between the registered T2 .stl models including means and
Ruellas et al. Page 5
Am J Orthod Dentofacial Orthop. Author manuscript; available in PMC 2017 April 01.
Author M
anuscriptA
uthor Manuscript
Author M
anuscriptA
uthor Manuscript
standard deviations between corresponding pre-labeled landmarks; 2) consistency was tested
with intraclass correlation coefficient (ICC, with two way random effect model) by
comparison between the corresponding x, y and z coordinates of the corresponding pre-
labeled landmarks on the surface of registered T2 .stl models; and 3) Bland-Altman plots of
the 95% limits of agreement (average differences ±1.96 of the standard deviation of the
differences) evaluating the concordance between the corresponding x, y and z coordinates
from corresponding pre-labeled landmarks on the surface of registered T2 .stl models.
All statistical computations were performed with statistical software (SPSS statistical
software package, version 21.0, SPSS, Chicago, IL and MedCalc version 14.10.2; MedCalc
Software, http://www.medcalc.org).
Results
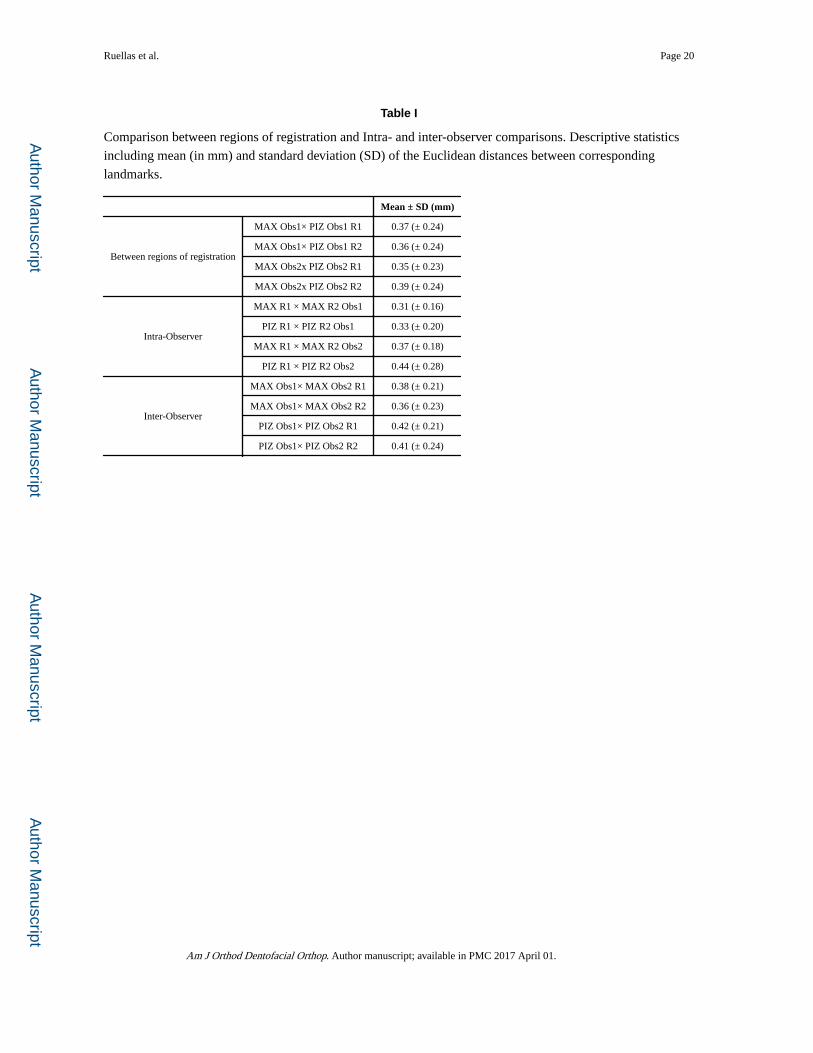
Table I shows the descriptive statistics for the measurements using the MAX and PIZ
registration regions for both observers and both times (first and second registration - R1 and
R2). The means of the Euclidean distances between the T2 .stl models after registrations
were small at all landmarks for all of the combinations tested (all of the means were smaller
than 0.5 mm). Considering the standard deviations, all of the differences between the models
registered by two different regions were ≤ 1.0mm.
The statistics to test the concordance (ICC) between regions of reference for registration and
for intra- and inter-observer reproducibility revealed excellent consistency (greater than
0.99).
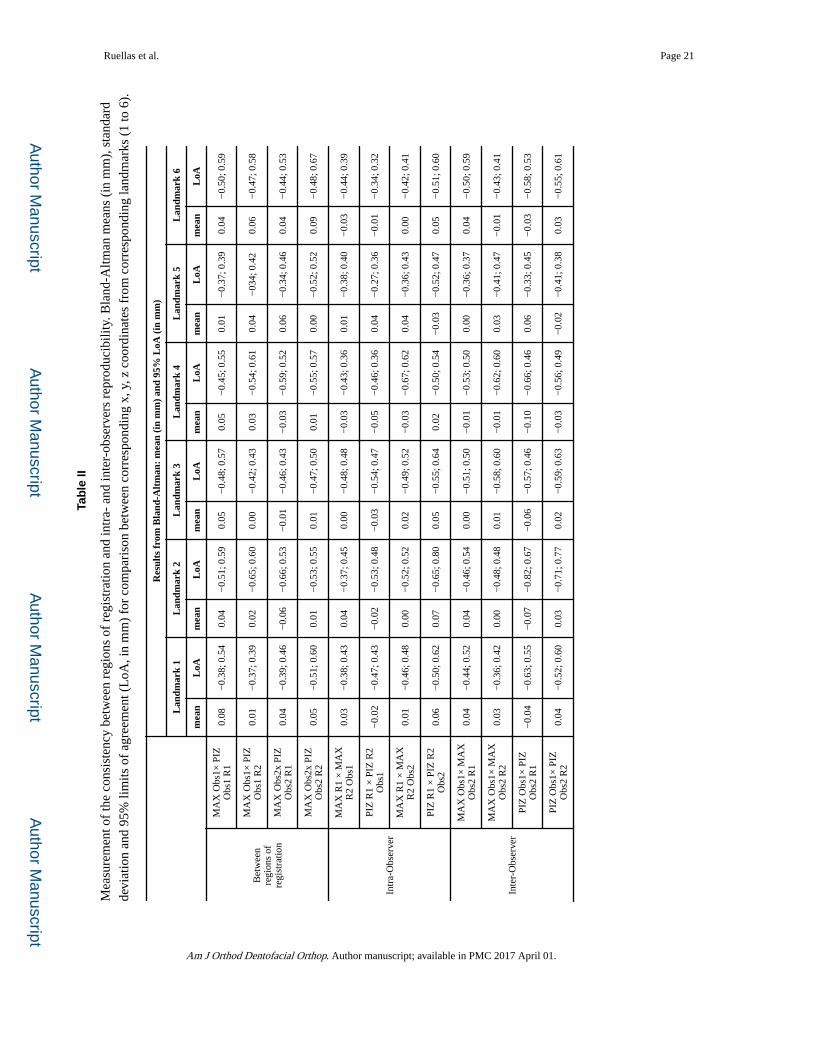
The consistency between regions of registration and intra- and inter-observers
reproducibility can be observed in Table II. By using Bland and Altman’s limits of
agreement, one would expect that 95% of the differences between corresponding coordinates
for all of the six corresponding landmarks obtained from the registrations performed in this
study would be within the range −0.82 to 0.77 mm. Figure 5 displays one example of
consistency between the two regions used for registration (Fig.5 A), intra- and inter-observer
agreement (Fig. 5 B and C, respectively) for the landmark 6.
The visual analytic evaluation between the 3D model surfaces color-coded maps and semi-
transparent overlays for comparison between both regions (MAX and PIZ) are shown in
Figure 6. The superimpositions of T2 surface models (generated by MAX and PIZ
registrations) are almost perfect (Fig 6A), which indicates that both models present with the
same spatial position after the registration. The color-coded maps of the T2 models
registered by MAX and PIZ registrations (Fig. 6B) confirmed the findings. The color-coded
maps from the T2 (MAX and PIZ registrations) superimposed over T1 also display similar
pattern of colors (Fig. 6, C and D) between them.
Discussion
Tracing superimposition of serial lateral cephalograms has provided knowledge about
craniofacial growth and development as well as dentoskeletal effects produced by
orthodontics, orthopedics, and corrective jaw surgical procedures. However, a major
Ruellas et al. Page 6
Am J Orthod Dentofacial Orthop. Author manuscript; available in PMC 2017 April 01.
Author M
anuscriptA
uthor Manuscript
Author M
anuscriptA
uthor Manuscript

disadvantage of using cephalometric tracings includes the fact that a 3D information is
compressed into 2D data and often localized to midline structures.
3D registration allows the clinician to evaluate structures that were previously obstructed on
lateral cephalograms as well as unilateral/asymmetric anatomic changes to growth or
treatment. Furthermore, three-dimensional registration provides more anatomic regions of
reference to improve the reliability of the registration. The resulting overlay offers the ability
of rotating the 3D surfaces and observing multiple 3D views in the space rather than one
sagittal view. Our findings, seen in lateral perspective view are similar to the information
provided by 2D cephalograms. However, other views (Fig. 6 and 7) clearly provide
clinicians and researchers a better interpretation of growth and treatment changes as well as
improved visualization.
Several methods6,9,10 of 2D maxillary superimposition have been described in the literature
such as those published by Björk.6,9 As metallic implant studies are unrepeatable in humans,
the translation of the 2D knowledge from cephalograms superimpositions into a 3D
environment is hampered. Studies using dry skulls could be an alternative but they also
present problems because they do not display the bone remodeling, eruption, growth and
results of treatment based on biological response. Future studies trying to find a gold
standard may be necessary to further validate regional bone displacements with treatment.
Promising animal studies on rat mandibles may be helpful to better understand 2D/3D
differences12 but the growth pattern in animal models may not be analogous to humans. Any
shift of an area used as reference can cause a misinterpretation in the amount and direction
of growth. In addition, tooth movement measurements can be distorted depending on the
superimposition method.1 This study incorporates two commonly used regions for 2D
maxillary registration into 3D maxillary registration. Similarly, a published study19
compared two regions of reference to test the accuracy and reproducibility of voxel based
superimposition of CBCT models on the anterior cranial base and the zygomatic arches.
Those authors19 also accepted a reference area from 2D evaluations as reliable to compare a
second option for registration.
Clinical implications that can be derived from 3D registrations depend on the structures
selected as reference for registration. Cranial base registration has been advocated in
different research on growth and follow-up evaluations16,23-25 but some regional
registrations still are controversial. Figure 7 displays findings of maxillary growth and
treatment changes seven months after RME using MAX (Fig. 7 A and D) and PIZ (Fig. 7 C
and F) regions as reference for the regional registrations and the cranial base registration
(Fig. 7 B and E). It demonstrates that differences in interpretation of facial changes can be
related to the region of reference used for registration, especially in growing patients.
The concept that the interpretation of the results is relative to the area of reference is an
important point for maxillary registration because the maxilla undergoes rotational and
translational changes during growth. It is possible to observe alveolar bone and dental
changes as well as small areas of remodeling when maxillary regional registration was
performed (Figs. 7 A, D and C, F). However, Figure 7 B and E displays the same patient but
Ruellas et al. Page 7
Am J Orthod Dentofacial Orthop. Author manuscript; available in PMC 2017 April 01.
Author M
anuscriptA
uthor Manuscript
Author M
anuscriptA
uthor Manuscript
uses the cranial base as a reference for the registration. Overlay and color maps show a
downward displacement of the maxilla and maxillary dentition due to growth. Therefore, the
inferences from growth and/or treatment should be made only in relation to the reference
structure used for the superimposition method.
For both regions of registration (MAX and PIZ) evaluated in the present study, the
dentoalveolar processes were excluded from the mask due to their unstable nature (growth of
the alveolus and alternation of deciduous and permanent dentitions according to the
development stage of the subjects). The first region was based on the best fit over the entire
maxilla (MAX). A second region (PIZ) was a 2D-to-3D attempt to apply Björk’s concepts
on maxillary regional superimposition using the key ridge as an anatomically stable
structure.6,9,26,27 Both tested regions showed similar results that can be verified by
examining Figures 6 and 7 and Table I, II and III as well.
There were no evident differences found for all combinations of observers or regions of
reference, as demonstrated by ICC (extremely high coefficient of concordance among them,
expressed by ICC > 0.99), and seen in Table I (differences smaller than 0.5 mm between T2
surface models generated after registrations), Table II (excellent inter-observer agreement),
and Figure 6 (coincidence of the T2 surface models generated after registrations). Since
differences ≤1 mm are clinically insignificant,28 both the MAX and PIZ regions can be
considered clinically comparable and reproducible.
According to the present study, the use of a region corresponding to the key ridge is
reproducible for 3D superimposition of the maxilla as well as superimpositions on the entire
maxilla. The superimpositions of T2 surface models (generated by MAX and PIZ
registrations) are almost perfect (Fig. 6 A), representing remarkable similarity of their
surfaces. The color-coded maps from the T2 (MAX and PIZ registrations) superimposed
over T1 also display similar pattern of colors (Fig. 6 B). The color-coded maps based on the
T2 over T1 express the same interpretation of the results based on the registrations
performed by either MAX (Fig. 6C and 7D) or PIZ (Fig. 6D and 7F) regions of reference.
One advantage of PIZ registration is the fact that it does not include maxillary structures
distal to the first molar, and therefore is not influenced by the intra-osseous eruption
movements of the second molar, if they still do not present occlusal contact at the first time
point. In addition, because the PIZ area of reference does not include structures mesial to the
distal surface of the canine, this area of reference avoids the influence of ample remodeling
of the alveolar process in any cases that may be treated with incisors retraction. Despite the
fact that we did not test these situations in the present study, the PIZ registration might be
more indicated in cases of ample potential of remodeling.
Our study compared both regions of registration based on the distances between landmarks
placed on the 3D volumetric label maps and not in the color maps. The sagittal, axial, and
coronal slices, as well as the 3D reconstruction of the image were used for landmark
positioning in ITK-SNAP software. The 3D volumetric label maps with identified landmarks
were used for the next steps to avoid errors due to segmentation or landmark placement.
Color maps are indicated for visual assessment and can be influenced by scans with
Ruellas et al. Page 8
Am J Orthod Dentofacial Orthop. Author manuscript; available in PMC 2017 April 01.
Author M
anuscriptA
uthor Manuscript
Author M
anuscriptA
uthor Manuscript
presence of motion artifacts, large number of metallic artifacts and presence of orthodontic
appliances.
The present study investigated voxel-based registration on 3D volumes because it has
advantages over surface or landmark based registration methods. Finding a reliable and
reproducible area for automatic registration can avoid observer-dependent errors such as
training and fatigue15 and reduce observer-dependent landmark identification errors.
Landmark-based registration methods use a limited number of landmarks as reference that is
susceptible to landmark identification errors. Surface-based registration can present errors
since regions with thin bone are most susceptible to errors in surface reconstruction30.
However, Almukhtar et al20 have found no statistical differences between voxel based and
surface based registration methods. Voxel based registration, however, showed more
consistency in the representation of the actual soft and hard tissue positions. Voxel–based
registration compares thousands of voxels including inner structures of the bone including
cancellous and cortical bony tissues13. This information used for registration suggests that
including both cortical and cancellous bone in the registration process would provide to the
software a broader region of reference for comparison between two time points. However, in
the present study we did not compare neither ‘surface’ to ‘voxel registration’, nor 'cortical
only' to 'cancellous plus cortical' voxel registration.
In summary, this study did not validate the two tested regions used for registration but the
region of reference (PIZ) based on Björk structures of reference for 2D superimpositions
seems to be applicable to 3D maxillary registration and it displayed similar results when
compared to a broader region of reference (MAX). It suggests that 3D interpretation of
changes occurring at the level of the maxillary tuberosity, orbital surface of the maxilla,
alveolar process, and teeth can be derived from 3D regional superimpositions. The overlay
of 3D models at two different time points can provide quantitative and qualitative
evaluations of transverse, vertical, and antero-posterior skeletal and dental changes in the
maxilla.
Conclusions
The two regions of regional maxillary registration (MAX and PIZ) showed similar results
and adequate intra- and inter-observer reproducibility for growing patients.
Acknowledgement
Supported by the National Institute of Dental & Craniofacial Research and the National Institute of Biomedical Imaging and Bioengineering of the National Institutes of Health (award number R01DE024450). The content is solely the responsibility of the authors and does not necessarily represent the official views of the National Institutes of Health.
References
1. Gu Y, McNamara JA. Cephalometric superimpositions. Angle Orthod. 2008; 78:967–976. [PubMed: 18947269]
2. Gans BJ, Sarnat BG. Sutural facial growth of the Macaca rhesus monkey: a gross and serial roentgenographic study by means of metallic implants. Am J Orthod. 1951; 37:827–841. [PubMed: 14885376]
Ruellas et al. Page 9
Am J Orthod Dentofacial Orthop. Author manuscript; available in PMC 2017 April 01.
Author M
anuscriptA
uthor Manuscript
Author M
anuscriptA
uthor Manuscript
3. Björk A, Skieller V. Normal and abnormal growth of the mandible. A synthesis of longitudinal cephalometric implant studies over a period of 25 years. Eur J Orthod. 1983; 5:1–46. [PubMed: 6572593]
4. Humphry. On the Growth of the Jaws. J Anat Physiol. 1878; 12:288–293.
5. Sarnat BG. Growth of bones as revealed by implant markers in animals. Am J Phys Anthropol. 1968; 29:255–285. [PubMed: 4973460]
6. Björk A. Sutural growth of the uper face studied by the implant method. Rep Congr Eur Orthod Soc. 1964; 40:49–65. [PubMed: 14318034]
7. Melsen B. Effects of cervical anchorage during and after treatment: an implant study. Am J Orthod. 1978; 73:526–540. [PubMed: 277067]
8. Sarnat BG. Some methods of assessing postnatal craniofaciodental growth: a retrospective of personal research. Cleft Palate Craniofac J. 1997; 34:159–172. [PubMed: 9138513]
9. Björk A, Skieller V. Growth of the maxilla in three dimensions as revealed radiographically by the implant method. Br J Orthod. 1977; 4:53–64. [PubMed: 273440]
10. Nielsen IL. Maxillary superimposition: a comparison of three methods for cephalometric evaluation of growth and treatment change. Am J Orthod Dentofacial Orthop. 1989; 95:422–431. [PubMed: 2718972]
11. McNamara JA. Influence of respiratory pattern on craniofacial growth. Angle Orthod. 1981; 51:269–300. [PubMed: 6947703]
12. Kim I, Oliveira ME, Duncan WJ, Cioffi I, Farella M. 3D assessment of mandibular growth based on image registration: a feasibility study in a rabbit model. Biomed Res Int. 2014; 2014:276128. [PubMed: 24527442]
13. Cevidanes LH, Heymann G, Cornelis MA, DeClerck HJ, Tulloch JF. Superimposition of 3-dimensional cone-beam computed tomography models of growing patients. Am J Orthod Dentofacial Orthop. 2009; 136:94–99. [PubMed: 19577154]
14. da Motta AT, de Assis Ribeiro Carvalho F, Oliveira AE, Cevidanes LH, de Oliveira Almeida MA. Superimposition of 3D cone-beam CT models in orthognathic surgery. Dental Press J Orthod. 2010; 15:39–41. [PubMed: 21814624]
15. Schilling J, Gomes LC, Benavides E, Nguyen T, Paniagua B, Styner M, et al. Regional 3D superimposition to assess temporomandibular joint condylar morphology. Dentomaxillofac Radiol. 2014; 43:20130273. [PubMed: 24170802]
16. Cevidanes LH, Styner M, Proffit WR. [Three-dimensional superimposition of the skull base for the longitudinal evaluation of the effects of growth and of treatment]. Orthod Fr. 2009; 80:347–357. [PubMed: 19954732]
17. Yushkevich PA, Piven J, Hazlett HC, Smith RG, Ho S, Gee JC, et al. User-guided 3D active contour segmentation of anatomical structures: significantly improved efficiency and reliability. Neuroimage. 2006; 31:1116–1128. [PubMed: 16545965]
18. Cevidanes L, Ruellas A, Jomier J, Nguyen T, Pieper S, Budin F, et al. Incorporating 3-dimensional models in online articles Am. J. Orthod. and Dentofac. Orthop. 2015; 147:S195–204.
19. Nada RM, Maal TJ, Breuning KH, Bergé SJ, Mostafa YA, Kuijpers-Jagtman AM. Accuracy and reproducibility of voxel based superimposition of cone beam computed tomography models on the anterior cranial base and the zygomatic arches. PLoS One. 2011; 6:e16520. [PubMed: 21347419]
20. Almukhtar A, Ju X, Khambay B, McDonald J, Ayoub A. Comparison of the accuracy of voxel based registration and surface based registration for 3D assessment of surgical change following orthognathic surgery. PLoS One. 2014; 9:e93402. [PubMed: 24695577]
21. Cevidanes LH, Motta A, Proffit WR, Ackerman JL, Styner M. Cranial base superimposition for 3-dimensional evaluation of soft-tissue changes. Am J Orthod Dentofacial Orthop. 2010; 137:S120–129. [PubMed: 20381752]
22. Khambay B, Ullah R. Current methods of assessing the accuracy of three-dimensional soft tissue facial predictions: technical and clinical considerations. Int J Oral Maxillofac Surg. 2015; 44:132–138. [PubMed: 25305699]
23. Motta AT, de Assis Ribeiro Carvalho F, Cevidanes LH, de Oliveira Almeida MA. Assessment of mandibular advancement surgery with 3D CBCT models superimposition. Dental Press J Orthod. 2010; 15:45e41–45e12.
Ruellas et al. Page 10
Am J Orthod Dentofacial Orthop. Author manuscript; available in PMC 2017 April 01.
Author M
anuscriptA
uthor Manuscript
Author M
anuscriptA
uthor Manuscript
24. De Clerck H, Nguyen T, de Paula LK, Cevidanes L. Three-dimensional assessment of mandibular and glenoid fossa changes after bone-anchored Class III intermaxillary traction. Am J Orthod Dentofacial Orthop. 2012; 142:25–31. [PubMed: 22748987]
25. LeCornu M, Cevidanes LH, Zhu H, Wu CD, Larson B, Nguyen T. Three-dimensional treatment outcomes in Class II patients treated with the Herbst appliance: a pilot study. Am J Orthod Dentofacial Orthop. 2013; 144:818–830. [PubMed: 24286905]
26. Björk A, Skieller V. Growth in width of the maxilla studied by the implant method. Scand J Plast Reconstr Surg. 1974; 8:26–33. [PubMed: 4450107]
27. Doppel DM, Damon WM, Joondeph DR, Little RM. An investigation of maxillary superimposition techniques using metallic implants. Am J Orthod Dentofacial Orthop. 1994; 105:161–168. [PubMed: 8311038]
28. Ghafari J, Engel FE, Laster LL. Cephalometric superimposition on the cranial base: a review and a comparison of four methods. Am J Orthod Dentofacial Orthop. 1987; 91:403–413. [PubMed: 3472459]
29. Chen G, Chen S, Zhang XY, Jiang RP, Liu Y, Shi FH, et al. Stable region for maxillary dental cast superimposition in adults, studied with the aid of stable miniscrews. Orthod Craniofac Res. 2011; 14:70–79. [PubMed: 21457456]
30. Periago DR, Scarfe WC, Moshiri M, Scheetz JP, Silveira AM, Farman AG. Linear accuracy and reliability of cone beam CT derived 3-dimensional images constructed using an orthodontic volumetric rendering program. Angle Orthod. 2008; 78:387–395. [PubMed: 18416632]
Ruellas et al. Page 11
Am J Orthod Dentofacial Orthop. Author manuscript; available in PMC 2017 April 01.
Author M
anuscriptA
uthor Manuscript
Author M
anuscriptA
uthor Manuscript
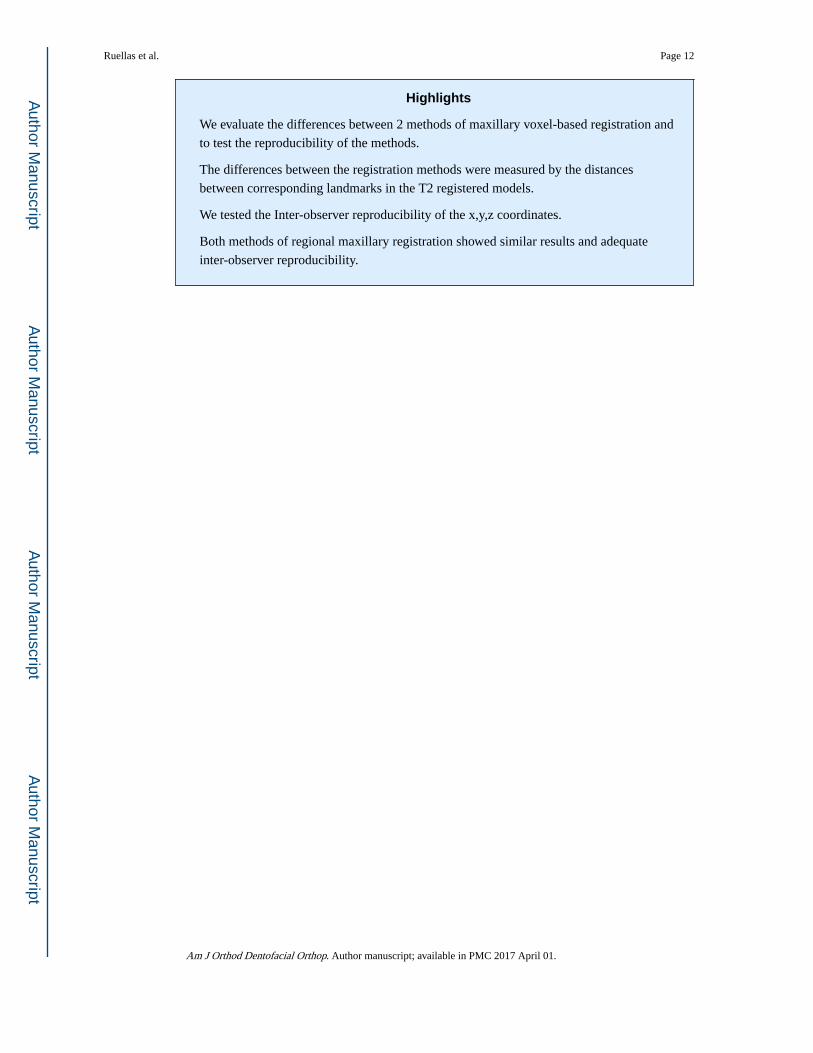
Highlights
We evaluate the differences between 2 methods of maxillary voxel-based registration and
to test the reproducibility of the methods.
The differences between the registration methods were measured by the distances
between corresponding landmarks in the T2 registered models.
We tested the Inter-observer reproducibility of the x,y,z coordinates.
Both methods of regional maxillary registration showed similar results and adequate
inter-observer reproducibility.
Ruellas et al. Page 12
Am J Orthod Dentofacial Orthop. Author manuscript; available in PMC 2017 April 01.
Author M
anuscriptA
uthor Manuscript
Author M
anuscriptA
uthor Manuscript
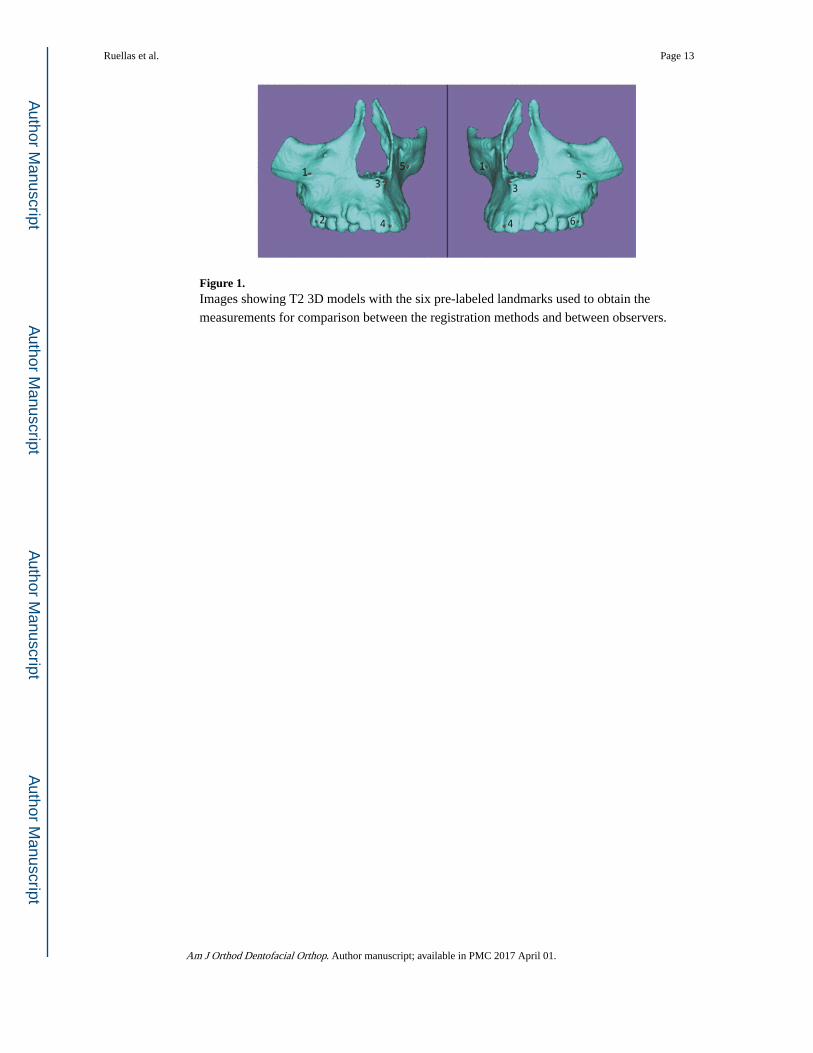
Figure 1. Images showing T2 3D models with the six pre-labeled landmarks used to obtain the
measurements for comparison between the registration methods and between observers.
Ruellas et al. Page 13
Am J Orthod Dentofacial Orthop. Author manuscript; available in PMC 2017 April 01.
Author M
anuscriptA
uthor Manuscript
Author M
anuscriptA
uthor Manuscript
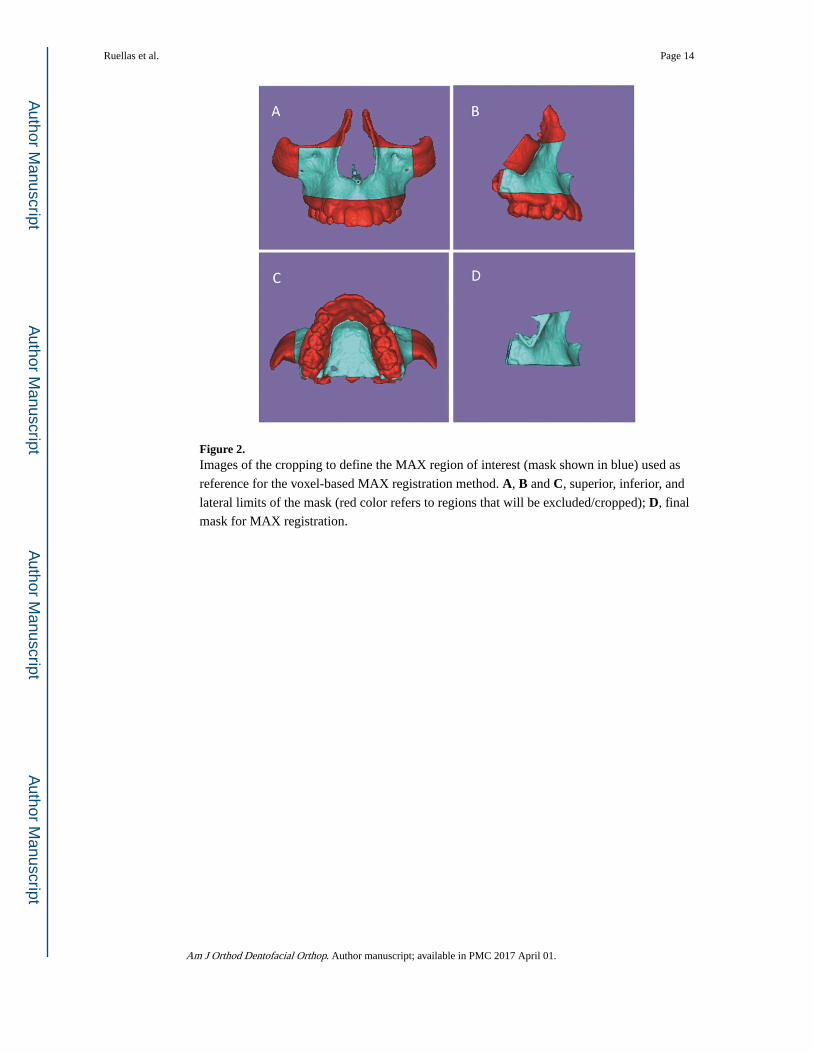
Figure 2. Images of the cropping to define the MAX region of interest (mask shown in blue) used as
reference for the voxel-based MAX registration method. A, B and C, superior, inferior, and
lateral limits of the mask (red color refers to regions that will be excluded/cropped); D, final
mask for MAX registration.
Ruellas et al. Page 14
Am J Orthod Dentofacial Orthop. Author manuscript; available in PMC 2017 April 01.
Author M
anuscriptA
uthor Manuscript
Author M
anuscriptA
uthor Manuscript
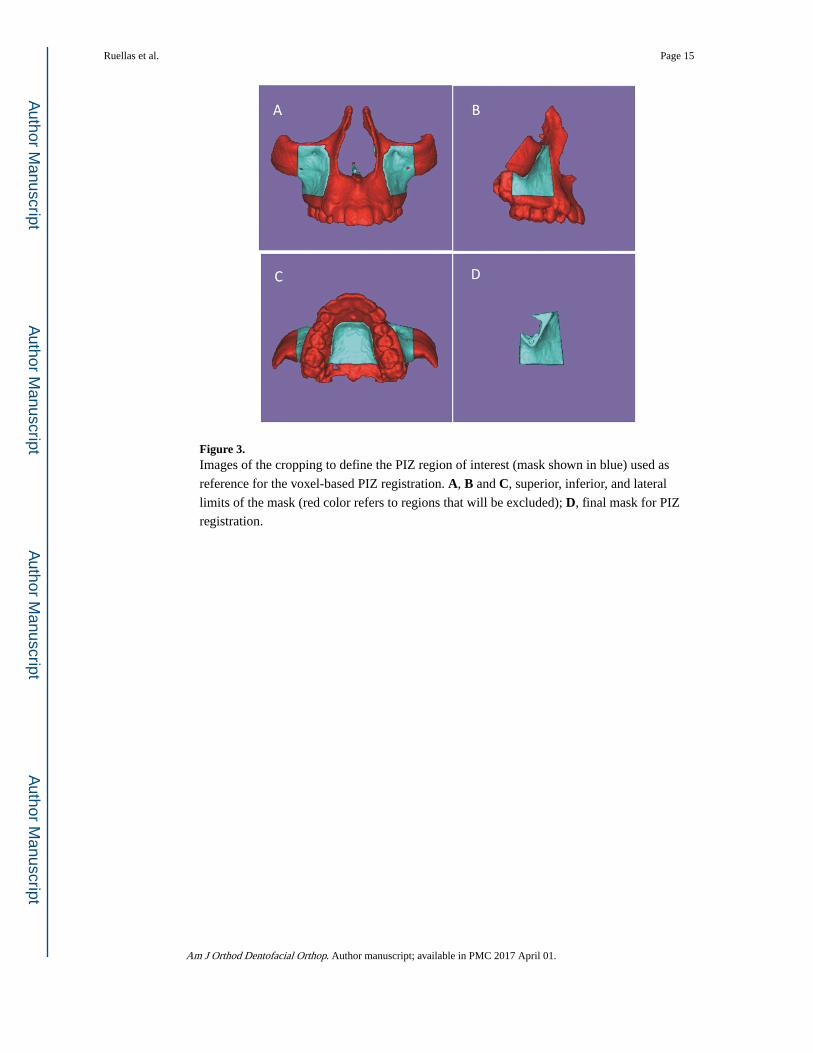
Figure 3. Images of the cropping to define the PIZ region of interest (mask shown in blue) used as
reference for the voxel-based PIZ registration. A, B and C, superior, inferior, and lateral
limits of the mask (red color refers to regions that will be excluded); D, final mask for PIZ
registration.
Ruellas et al. Page 15
Am J Orthod Dentofacial Orthop. Author manuscript; available in PMC 2017 April 01.
Author M
anuscriptA
uthor Manuscript
Author M
anuscriptA
uthor Manuscript
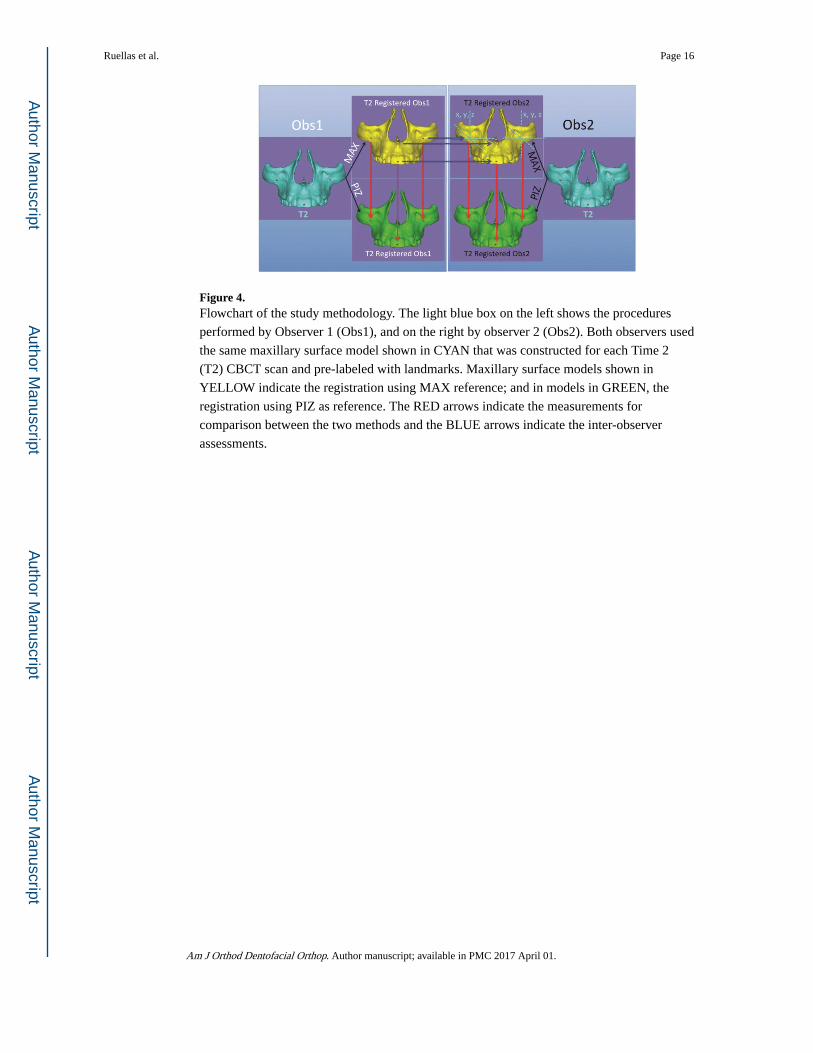
Figure 4. Flowchart of the study methodology. The light blue box on the left shows the procedures
performed by Observer 1 (Obs1), and on the right by observer 2 (Obs2). Both observers used
the same maxillary surface model shown in CYAN that was constructed for each Time 2
(T2) CBCT scan and pre-labeled with landmarks. Maxillary surface models shown in
YELLOW indicate the registration using MAX reference; and in models in GREEN, the
registration using PIZ as reference. The RED arrows indicate the measurements for
comparison between the two methods and the BLUE arrows indicate the inter-observer
assessments.
Ruellas et al. Page 16
Am J Orthod Dentofacial Orthop. Author manuscript; available in PMC 2017 April 01.
Author M
anuscriptA
uthor Manuscript
Author M
anuscriptA
uthor Manuscript
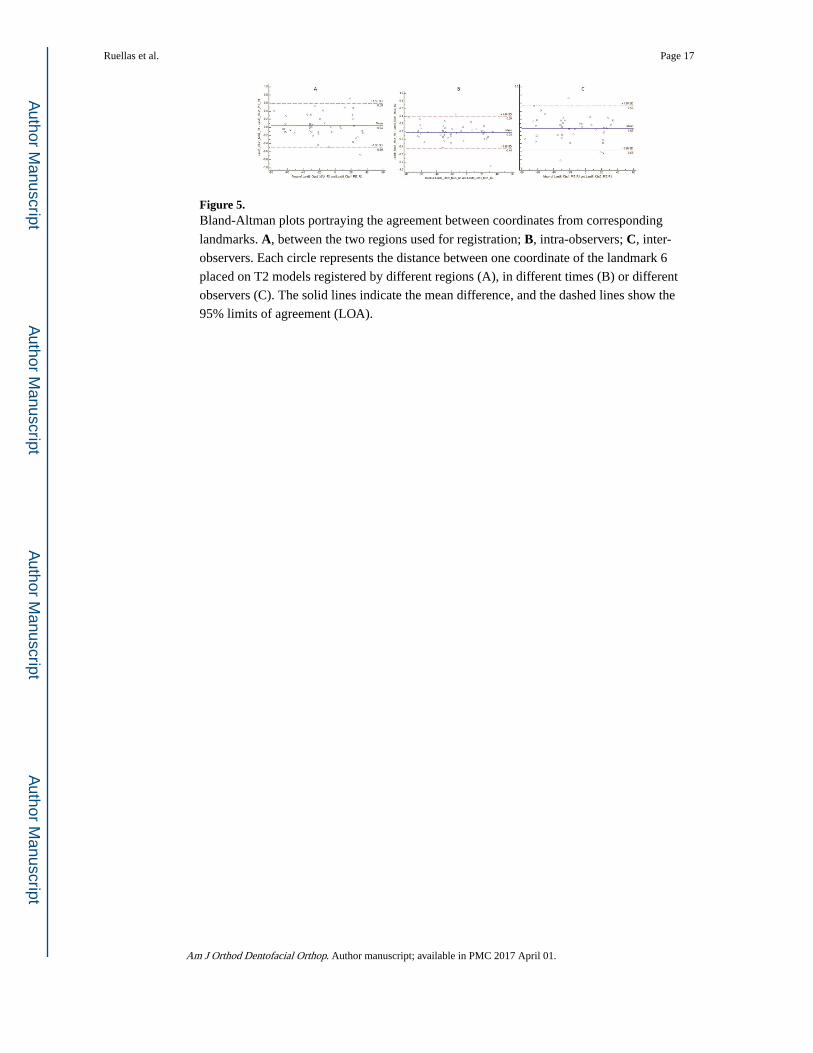
Figure 5. Bland-Altman plots portraying the agreement between coordinates from corresponding
landmarks. A, between the two regions used for registration; B, intra-observers; C, inter-
observers. Each circle represents the distance between one coordinate of the landmark 6
placed on T2 models registered by different regions (A), in different times (B) or different
observers (C). The solid lines indicate the mean difference, and the dashed lines show the
95% limits of agreement (LOA).
Ruellas et al. Page 17
Am J Orthod Dentofacial Orthop. Author manuscript; available in PMC 2017 April 01.
Author M
anuscriptA
uthor Manuscript
Author M
anuscriptA
uthor Manuscript
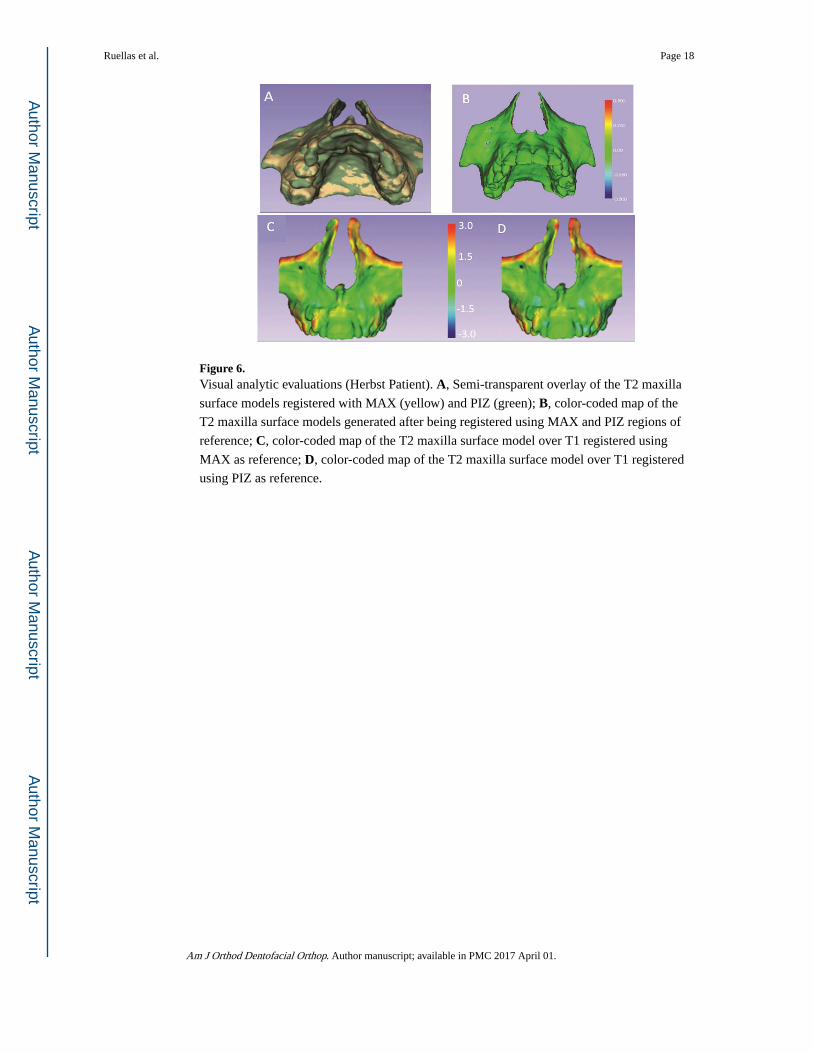
Figure 6. Visual analytic evaluations (Herbst Patient). A, Semi-transparent overlay of the T2 maxilla
surface models registered with MAX (yellow) and PIZ (green); B, color-coded map of the
T2 maxilla surface models generated after being registered using MAX and PIZ regions of
reference; C, color-coded map of the T2 maxilla surface model over T1 registered using
MAX as reference; D, color-coded map of the T2 maxilla surface model over T1 registered
using PIZ as reference.
Ruellas et al. Page 18
Am J Orthod Dentofacial Orthop. Author manuscript; available in PMC 2017 April 01.
Author M
anuscriptA
uthor Manuscript
Author M
anuscriptA
uthor Manuscript
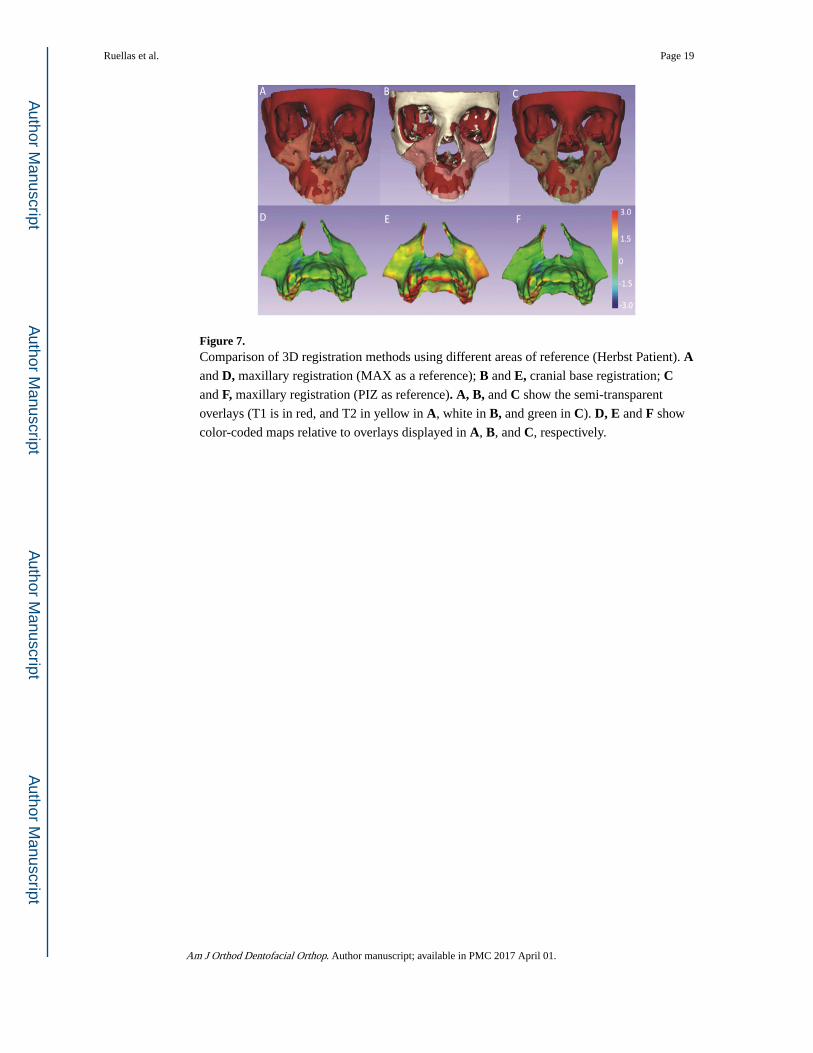
Figure 7. Comparison of 3D registration methods using different areas of reference (Herbst Patient). A and D, maxillary registration (MAX as a reference); B and E, cranial base registration; C and F, maxillary registration (PIZ as reference). A, B, and C show the semi-transparent
overlays (T1 is in red, and T2 in yellow in A, white in B, and green in C). D, E and F show
color-coded maps relative to overlays displayed in A, B, and C, respectively.
Ruellas et al. Page 19
Am J Orthod Dentofacial Orthop. Author manuscript; available in PMC 2017 April 01.
Author M
anuscriptA
uthor Manuscript
Author M
anuscriptA
uthor Manuscript
Author M
anuscriptA
uthor Manuscript
Author M
anuscriptA
uthor Manuscript
Ruellas et al. Page 20
Table I
Comparison between regions of registration and Intra- and inter-observer comparisons. Descriptive statistics
including mean (in mm) and standard deviation (SD) of the Euclidean distances between corresponding
landmarks.
Mean ± SD (mm)
Between regions of registration
MAX Obs1× PIZ Obs1 R1 0.37 (± 0.24)
MAX Obs1× PIZ Obs1 R2 0.36 (± 0.24)
MAX Obs2x PIZ Obs2 R1 0.35 (± 0.23)
MAX Obs2x PIZ Obs2 R2 0.39 (± 0.24)
Intra-Observer
MAX R1 × MAX R2 Obs1 0.31 (± 0.16)
PIZ R1 × PIZ R2 Obs1 0.33 (± 0.20)
MAX R1 × MAX R2 Obs2 0.37 (± 0.18)
PIZ R1 × PIZ R2 Obs2 0.44 (± 0.28)
Inter-Observer
MAX Obs1× MAX Obs2 R1 0.38 (± 0.21)
MAX Obs1× MAX Obs2 R2 0.36 (± 0.23)
PIZ Obs1× PIZ Obs2 R1 0.42 (± 0.21)
PIZ Obs1× PIZ Obs2 R2 0.41 (± 0.24)
Am J Orthod Dentofacial Orthop. Author manuscript; available in PMC 2017 April 01.
Author M
anuscriptA
uthor Manuscript
Author M
anuscriptA
uthor Manuscript
Ruellas et al. Page 21
Tab
le II
Mea
sure
men
t of
the
cons
iste
ncy
betw
een
regi
ons
of r
egis
trat
ion
and
intr
a- a
nd in
ter-
obse
rver
s re
prod
ucib
ility
. Bla
nd-A
ltman
mea
ns (
in m
m),
sta
ndar
d
devi
atio
n an
d 95
% li
mits
of
agre
emen
t (L
oA, i
n m
m)
for
com
pari
son
betw
een
corr
espo
ndin
g x,
y, z
coo
rdin
ates
fro
m c
orre
spon
ding
land
mar
ks (
1 to
6).
Res
ults
fro
m B
land
-Alt
man
: m
ean
(in
mm
) an
d 95
% L
oA (
in m
m)
Lan
dmar
k 1
Lan
dmar
k 2
Lan
dmar
k 3
Lan
dmar
k 4
Lan
dmar
k 5
Lan
dmar
k 6
mea
nL
oAm
ean
LoA
mea
nL
oAm
ean
LoA
mea
nL
oAm
ean
LoA
Bet
wee
nre
gion
s of
regi
stra
tion
MA
X O
bs1×
PIZ
Obs
1 R
10.
08−
0.38
; 0.5
40.
04−
0.51
; 0.5
90.
05−
0.48
; 0.5
70.
05−
0.45
; 0.5
50.
01−
0.37
; 0.3
90.
04−
0.50
; 0.5
9
MA
X O
bs1×
PIZ
Obs
1 R
20.
01−
0.37
; 0.3
90.
02−
0.65
; 0.6
00.
00−
0.42
; 0.4
30.
03−
0.54
; 0.6
10.
04−
034;
0.4
20.
06−
0.47
; 0.5
8
MA
X O
bs2x
PIZ
Obs
2 R
10.
04−
0.39
; 0.4
6−
0.06
−0.
66; 0
.53
−0.
01−
0.46
; 0.4
3−
0.03
−0.
59; 0
.52
0.06
−0.
34; 0
.46
0.04
−0.
44; 0
.53
MA
X O
bs2x
PIZ
Obs
2 R
20.
05−
0.51
; 0.6
00.
01−
0.53
; 0.5
50.
01−
0.47
; 0.5
00.
01−
0.55
; 0.5
70.
00−
0.52
; 0.5
20.
09−
0.48
; 0.6
7
Intr
a-O
bser
ver
MA
X R
1 ×
MA
XR
2 O
bs1
0.03
−0.
38; 0
.43
0.04
−0.
37; 0
.45
0.00
−0.
48; 0
.48
−0.
03−
0.43
; 0.3
60.
01−
0.38
; 0.4
0−
0.03
−0.
44; 0
.39
PIZ
R1
× P
IZ R
2O
bs1
−0.
02−
0.47
; 0.4
3−
0.02
−0.
53; 0
.48
−0.
03−
0.54
; 0.4
7−
0.05
−0.
46; 0
.36
0.04
−0.
27; 0
.36
−0.
01−
0.34
; 0.3
2
MA
X R
1 ×
MA
XR
2 O
bs2
0.01
−0.
46; 0
.48
0.00
−0.
52; 0
.52
0.02
−0.
49; 0
.52
−0.
03−
0.67
; 0.6
20.
04−
0.36
; 0.4
30.
00−
0.42
; 0.4
1
PIZ
R1
× P
IZ R
2O
bs2
0.06
−0.
50; 0
.62
0.07
−0.
65; 0
.80
0.05
−0.
55; 0
.64
0.02
−0.
50; 0
.54
−0.
03−
0.52
; 0.4
70.
05−
0.51
; 0.6
0
Inte
r-O
bser
ver
MA
X O
bs1×
MA
XO
bs2
R1
0.04
−0.
44; 0
.52
0.04
−0.
46; 0
.54
0.00
−0.
51; 0
.50
−0.
01−
0.53
; 0.5
00.
00−
0.36
; 0.3
70.
04−
0.50
; 0.5
9
MA
X O
bs1×
MA
XO
bs2
R2
0.03
−0.
36; 0
.42
0.00
−0.
48; 0
.48
0.01
−0.
58; 0
.60
−0.
01−
0.62
; 0.6
00.
03−
0.41
; 0.4
7−
0.01
−0.
43; 0
.41
PIZ
Obs
1× P
IZO
bs2
R1
−0.
04−
0.63
; 0.5
5−
0.07
−0.
82; 0
.67
−0.
06−
0.57
; 0.4
6−
0.10
−0.
66; 0
.46
0.06
−0.
33; 0
.45
−0.
03−
0.58
; 0.5
3
PIZ
Obs
1× P
IZO
bs2
R2
0.04
−0.
52; 0
.60
0.03
−0.
71; 0
.77
0.02
−0.
59; 0
.63
−0.
03−
0.56
; 0.4
9−
0.02
−0.
41; 0
.38
0.03
−0.
55; 0
.61
Am J Orthod Dentofacial Orthop. Author manuscript; available in PMC 2017 April 01.