Embed Size (px)
Citation preview

IEEE Tkantactioon6 on NucReah Science, Vot.NS-22, No.3, June 1975
COMPARISON OF STANDING WAVE ACCELERATORSOPERATING IN THE 2w/3 AND w/2 MODES
S.O. Schriber
Atomic Energy of Canada LimitedChalk River Nuclear Laboratories
Chalk River, Ontario, Canada
Summary
Calculations of fields in standing waveaccelerators operating in the 27/3 and w/2modes have been done using a set of RLC coup-led loop circuits to determine equilibriumcurrent solutions. These results have beencompared to experimental on-axis fieldmeasurements in an S-band acceleratingstructure. Tolerances of the two systems tofrequency and coupling-constant differencesare discussed as well as to operation slightlyoff-resonance. All results indicate that thew/2 mode is significantly less sensitive toconstruction and operational differences.
Introduction
Advantages in using the w/2-mode as astanding-wave acceleration mode for a coupled-cavity linear accelerator are stability of thecavity fields with respect to frequencydifferences iell-to-cell, cavity losses andbeam loading . The mode is stable becauseevery second cell has minimal excitation.Other modes have been proposed and used forstanding-'wa e linacs, in particular the27T/3-mode ' . Again, this mode is stablebecause every third cell has minimal
4excitation
A linear accelerator employing on-axiscouplers would favor operation in the 2X/3-mode (triperiodic) over the w/2-mode (bi-periodic) if the only criterion was thenumber of on-axis couplers - the number ofcouplers is halved. The 2w/3-mode systemcould also have a 2.5% higher effective shuntimpedance if pancake couplers were used.However, a comparison of the relative stabil-ities of the two modes is necessary to deter-mine which is best for a particular applic-ation. This paper reports calculations andmeasurements which show why the v/2-modeshould be the preferred mode when stabilityrequirements override advantages of fewercoupling cells.
Calculations
A set of coupled rf resonators has beenrepresented by a coupled-loop equivalent cir-cuit consisting of R,L,C elements aspreviously described6. A similar model wasused here except that one loop included anrf voltage generator to drive the system.Relative axial electric field amplitudes forthe physical system were represented by theloop-current solutions of the coupledequations. Computer solutions of the complexequations, as a function of rf frequency atconstant drive voltage, gave complex loop-
current values with associated loop phasesrelative to the rf generator at 00. Theresonance criterion for the appropriatemode was that there be a maximum in the driveloop current amplitude. The computer programcould consider different frequencies andquality factors for each loop of theequivalent circuit. Also, each couplingconstant (rf coupling between cells wasrepresented by the mutual inductance betweenloops) could be made different. Thus sol-utions of the equations could be made torepresent a given physical system if thecorresponding values for each cell (of thesystem) were known.
Experimental System
The singly periodic (all cells identical)23 cell system used for experimentalmeasurements of relative axial electric fieldamplitudes had the following mean parameters;
f (individual resonant frequency) - 2988.52MHz
Q (individual cell quality factor) - 7500k (first neighbour coupling
constant) - 3.15%
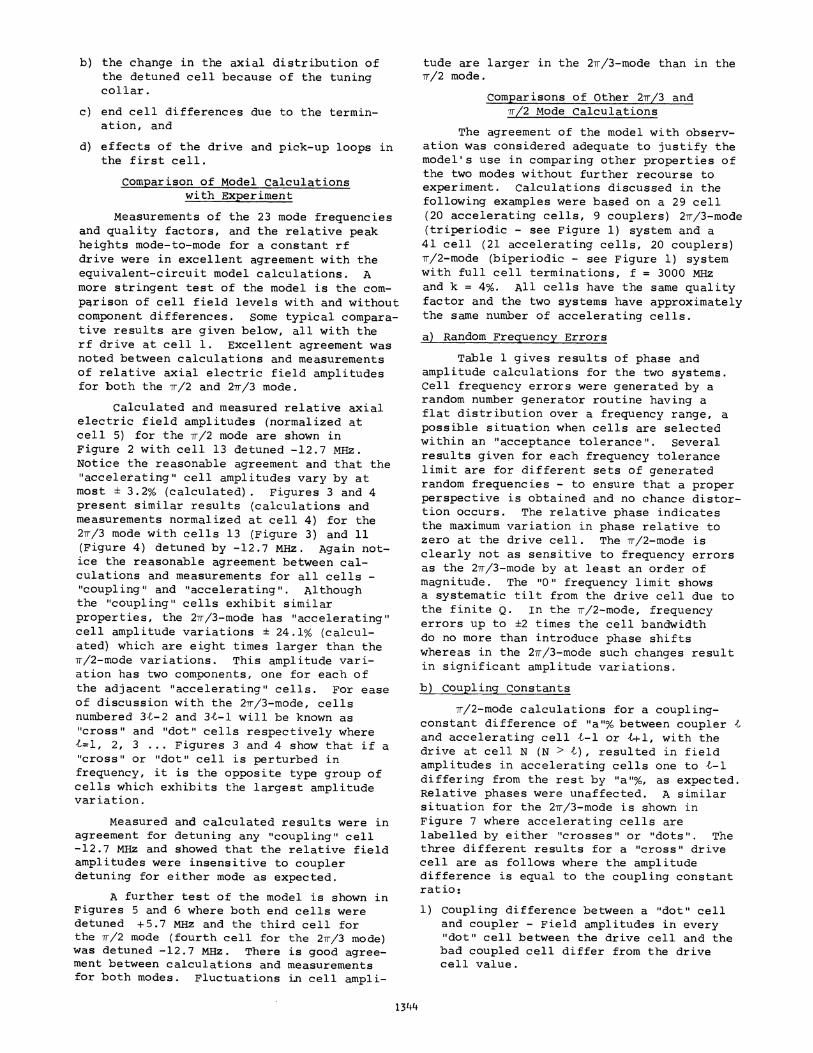
The system shown schematically inFigure 1 employed off-axis coupling slots andLALA7-shaped half cavities. Successive seg-ments were oriented 900 to each other toeliminate second neighbour couplings. Indiv-idual cell frequencies were within an 0.5 MHzband. Cell frequency changes were made byadjusting a small copper collar inserted inthe segment beam hole. Collar movement intothe cavity field volume lowered the cellfrequency. Individual cell frequencies weremeasured prior to assembly for on-axis fieldmeasurements. The component segments wereclamped in a horizontal press resulting incoupled mode quality factors of 7500.
Standard bead pull techniques were usedto determine on-axis electric field ampli-tudes. The resonant frequency of the chosenmode as a function of the axial position ofa 2 mm dielectric bead was plotted on anx-y recorder. Resonance was maintained by anautomatic frequency control (AFC) circuitemploying phase sensitive detectors and anfm-modulated rf signal generator. Rf driveto the coupled system and rf pick-up for thefeedback AFC circuit were by magnetic loopsin the first cell. Analysis of the resultsconsidered;
a) the possibility of field amplitude errorsdue to the bead being off-axis in thecells - found to be negligible.
1343
b) the change in the axial distribution ofthe detuned cell because of the tuningcollar.
c) end cell differences due to the termin-ation, and
d) effects of the drive and pick-up loops inthe first cell.
Comparison of Model Calculationswith Experiment
Measurements of the 23 mode frequenciesand quality factors, and the relative peakheights mode-to-mode for a constant rfdrive were in excellent agreement with theequivalent-circuit model calculations. Amore stringent test of the model is the com-parison of cell field levels with and withoutcomponent differences. Some typical compara-tive results are given below, all with therf drive at cell 1. Excellent agreement wasnoted between calculations and measurementsof relative axial electric field amplitudesfor both the w/2 and 2w/3 mode.
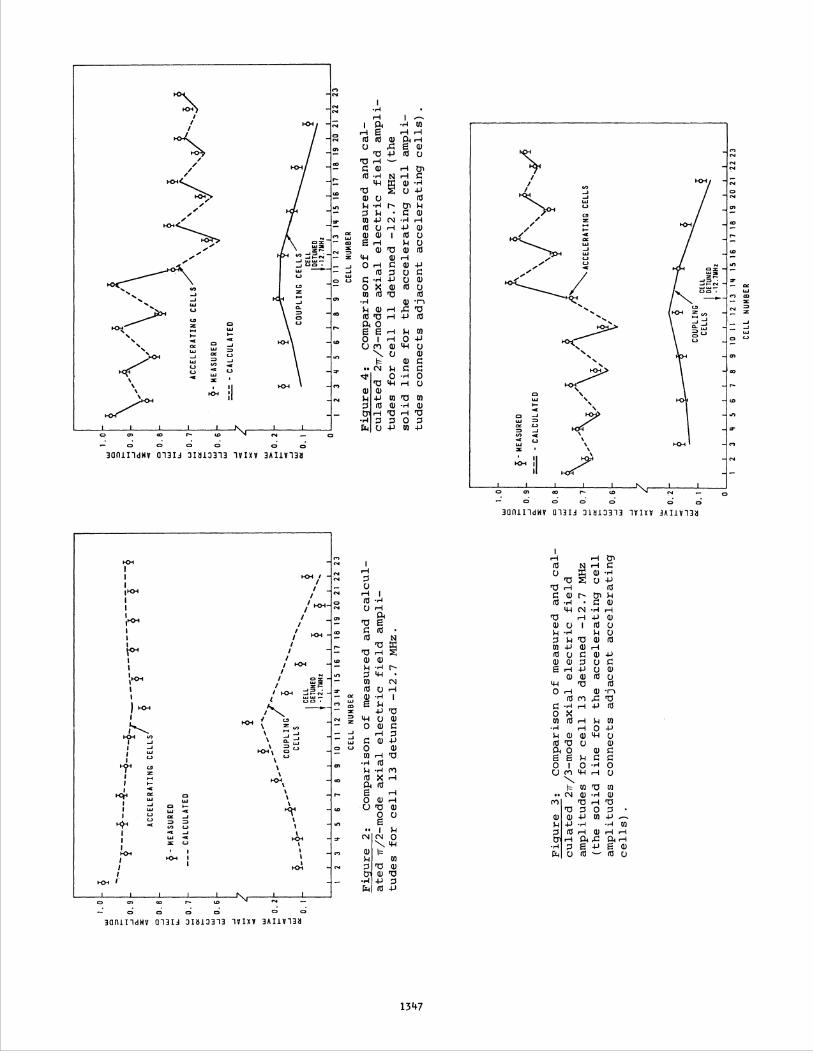
Calculated and measured relative axialelectric field amplitudes (normalized atcell 5) for the w/2 mode are shown inFigure 2 with cell 13 detuned -12.7 MHz.Notice the reasonable agreement and that the"accelerating" cell amplitudes vary by atmost ± 3.2% (calculated). Figures 3 and 4present similar results (calculations andmeasurements normalized at cell 4) for the2wm/3 mode with cells 13 (Figure 3) and 11(Figure 4) detuned by -12.7 MHz. Again not-ice the reasonable agreement between cal-culations and measurements for all cells -"coupling"! and "accelerating". Althoughthe "coupling" cells exhibit similarproperties, the 2w/3-mode has "accelerating"cell amplitude variations ± 24.1% (calcul-ated) which are eight times larger than thew/2-mode variations. This amplitude vari-ation has two components, one for each ofthe adjacent "accelerating" cells. For easeof discussion with the 2X/3-mode, cellsnumbered 34-2 and 3V-1 will be known as"cross" and "dot" cells respectively whereZ=l, 2, 3 ... Figures 3 and 4 show that if a"cross" or "dot" cell is perturbed infrequency, it is the opposite type group ofcells which exhibits the largest amplitudevariation.
Measured and calculated results were inagreement for detuning any "coupling" cell-12.7 MHz and showed that the relative fieldamplitudes were insensitive to couplerdetuning for either mode as expected.
A further test of the model is shown inFigures 5 and 6 where both end cells weredetuned +5.7 MHz and the third cell forthe w/2 mode (fourth cell for the 2w/3 mode)was detuned -12.7 MHz. There is good agree-ment between calculations and measurementsfor both modes. Fluctuations in cell ampli-
tude are larger in the 2w/3-mode than in thev/2 mode.
Comparisons of Other 2w/3 andw/2 Mode Calculations
The agreement of the model with observ-ation was considered adequate to justify themodel's use in comparing other properties ofthe two modes without further recourse toexperiment. Calculations discussed in thefollowing examples were based on a 29 cell(20 accelerating cells, 9 couplers) 2X/3-mode(triperiodic - see Figure 1) system and a41 cell (21 accelerating cells, 20 couplers)Tr/2-mode (biperiodic - see Figure 1) systemwith full cell terminations, f = 3000 MHzand k = 4%. All cells have the same qualityfactor and the two systems have approximatelythe same number of accelerating cells.
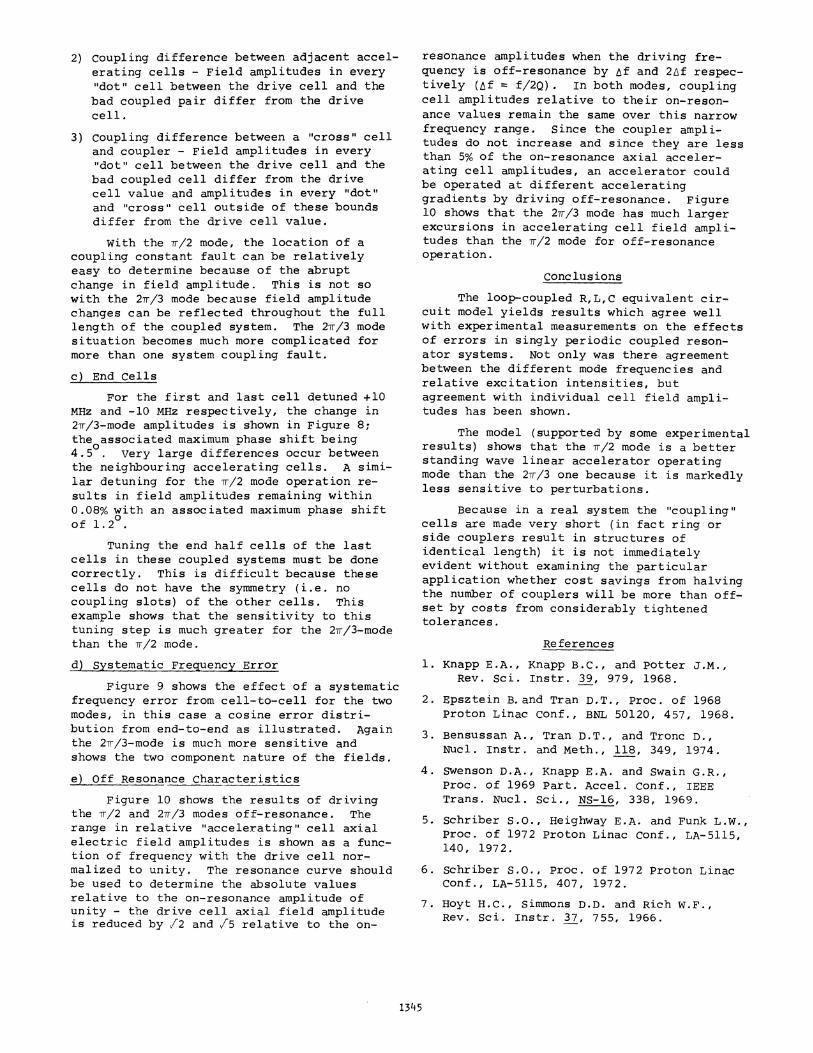
a) Random Frequency Errors
Table 1 gives results of phase andamplitude calculations for the two systems.Cell frequency errors were generated by arandom number generator routine having aflat distribution over a frequency range, apossible situation when cells are selectedwithin an "acceptance tolerance". Severalresults given for each frequency tolerancelimit are for different sets of generatedrandom frequencies - to ensure that a properperspective is obtained and no chance distor-tion occurs. The relative phase indicatesthe maximum variation in phase relative tozero at the drive cell. The w/2-mode isclearly not as sensitive to frequency errorsas the 2'r/3-mode by at least an order ofmagnitude. The "0" frequency limit showsa systematic tilt from the drive cell due tothe finite Q. In the w/2-mode, frequencyerrors up to ±2 times the cell bandwidthdo no more than introduce phase shiftswhereas in the 2w/3-mode such changes resultin significant amplitude variations.
b) Coupling Constants
7/2-mode calculations for a coupling-constant difference of "a"% between coupler tand accelerating cell t-1 or t±l, with thedrive at cell N (N > t), re,sulted in fieldamplitudes in accelerating cells one to t-Idiffering from the rest by "a"%, as expected.Relative phases were unaffected. A similarsituation for the 2wr/3-mode is shown inFigure 7 where accelerating cells arelabelled by either 'crosses" or "dots". Thethree different results for a "cross" drivecell are as follows where the amplitudedifference is equal to the coupling constantratio:
1) Coupling difference between a "dot" celland coupler - Field amplitudes in every"dot" cell between the drive cell and thebad coupled cell differ from the drivecell value.
1344
2) coupling difference between adjacent accel-erating cells - Field amplitudes in every"dot" cell between the drive cell and thebad coupled pair differ from the drivecell.
3) coupling difference between a "cross" celland coupler - Field amplitudes in every"dot" cell between the drive cell and thebad coupled cell differ from the drivecell value and amplitudes in every "dot"and "cross" cell outside of these boundsdiffer from the drive cell value.
With the r/2 mode, the location of acoupling constant fault can be relativelyeasy to determine because of the abruptchange in field amplitude. This is not sowith the 27/3 mode because field amplitudechanges can be reflected throughout the fulllength of the coupled system. The 27/3 modesituation becomes much more complicated formore than one system coupling fault.
c) End Cells
For the first and last cell detuned +10MHz and -10 MHz respectively, the change in2w/3-mode amplitudes is shown in Figure 8;the0associated maximum phase shift being4.5 Very large differences occur betweenthe neighbouring accelerating cells. A simi-lar detuning for the 7r/2 mode operation re-sults in field amplitudes remaining within0.08% with an associated maximum phase shiftof 1.20.
Tuning the end half cells of the lastcells in these coupled systems must be donecorrectly. This is difficult because thesecells do not have the symmetry (i.e. nocoupling slots) of the other cells. Thisexample shows that the sensitivity to thistuning step is much greater for the 2w/3-modethan the 7r/2 mode.
d) Systematic Frequency Error
Figure 9 shows the effect of a systematicfrequency error from cell-to-cell for the twomodes, in this case a cosine error distri-bution from end-to-end as illustrated. Againthe 2w/3-mode is much more sensitive andshows the two component nature of the fields.
e) Off Resonance Characteristics
Figure 10 shows the results of drivingthe w/2 and 27/3 modes off-resonance. Therange in relative 'accelerating" cell axialelectric field amplitudes is shown as a func-tion of frequency with the drive cell nor-malized to unity. The resonance curve shouldbe used to determine the absolute valuesrelative to the on-resonance amplitude ofunity - the drive cell axial field amplitudeis reduced by /2 and /5 relative to the on-
resonance amplitudes when the driving fre-quency is off-resonance by Af and 2Af respec-tively (Lf = f/2Q). In both modes, couplingcell amplitudes relative to their on-reson-ance values remain the same over this narrowfrequency range. Since the coupler ampli-tudes do not increase and since they are lessthan 5% of the on-resonance axial acceler-ating cell amplitudes, an accelerator couldbe operated at different acceleratinggradients by driving off-resonance. Figure10 shows that the 27/3 mode has much largerexcursions in accelerating cell field ampli-tudes than the w/2 mode for off-resonanceoperation.
Conclusions
The loop-coupled R,L,C equivalent cir-cuit model yields results which agree wellwith experimental measurements on the effectsof errors in singly periodic coupled reson-ator systems. Not only was there agreementbetween the different mode frequencies andrelative excitation intensities, butagreement with individual cell field ampli-tudes has been shown.
The model (supported by some experimentalresults) shows that the w/2 mode is a betterstanding wave linear accelerator operatingmode than the 27/3 one because it is markedlyless sensitive to perturbations.
Because in a real system the "coupling"cells are made very short (in fact ring orside couplers result in structures ofidentical length) it is not immediatelyevident without examining the particularapplication whether cost savings from halvingthe number of couplers will be more than off-set by costs from considerably tightenedtolerances.
References
1. Knapp E.A., Knapp B.C., and Potter J.M.,Rev. Sci. Instr. 39, 979, 1968.
2. Epsztein B.and Tran D.T., Proc. of 1968Proton Linac Conf., BNL 50120, 457, 1968.
3. Bensussan A., Tran D.T., and Tronc D.,Nucl. Instr. and Meth., 118, 349, 1974.
4. Swenson D.A., Knapp E.A. and Swain G.R.,Proc. of 1969 Part. Accel. Conf., IEEETrans. Nucl. Sci., NS-16, 338, 1969.
5. Schriber S.0., Heighway E.A. and Funk L.W.,Proc. of 1972 Proton Linac Conf., LA-5115,140, 1972.
6. Schriber S.0., Proc. of 1972 Proton Linacconf., LA-5115, 407, 1972.
7. Hoyt H.C., Simmons D.D. and Rich W.F.,Rev. Sci. Instr. 37, 755, 1966.
1345
Tl 1 et Fehs Vaiain o w/2 and -2/ M
BEAM APERTURE
MACHINED
- - SSEGMENT
\COUPLING SLOT
SINGLYPERIODICARRANGEMENT
B IP ERIODI CARRANGEMENT
TRIPERIODICARRANGEMENT
Figure 1: Schematic sectional arrangement of
single periodic, biperiodic and triperiodicsystems with a cross-sectional view of a
component segment.
1346
Frequency w/2 MODE |27r/3 MODE
Quality Tolerance Relative Field Phase Relative PhaseFactor Limits Amplitudes Relative to the Field Relative to the
Drive Cell Amplitudes Drive Cell
11,000 0 kHz 0.08% 00 0.09% 4.10
11,000 i 500 kHz 0.08% 0.060 4.8% 400.07% 0.16° 4.0% 400.09% 0.100 3.4% 400.06% 0.04 3.4% 40
3.6% 403.8% 40
5,500 0 kHz 0.3% 00 0.35% 8.10
5,500 + 500 kHz 0.3% 0.130 4.8% 8.000.29% 0.340 4.1% 8.000.32% 0.220 4.4% 8.100.3% 0.090 3.4% 8.10
3.4% 8.205.9% 8.10
Table 1: Relative Field and Phase Variation for 7T/2 and 2vr/3 Modes
_
ACCELERATING
CELLS
-MEASURED
CALC
ULAT
ED
COUP
LING
CELLS
CELL
CETU
NED
-12.
7MHz
12
12
34
56
78
910
1112
1314
1516
1718
1920
2122
23
CELL
NUMBER
Figure
2:Comparison
of
measured
and
calcul-
ated
'm/2-mode
axial
electric
field
ampl
i-tudes
for
cell
13detuned
-12.7
MHz.
Figure
3:Comparison
of
measured
and
cal-
culated
2v/3-mode
axia
lel
ectr
icfield
amplitudes
for
cell
13detuned
-12.7
MHz
(the
solid
line
for
the
accelerating
cell
amplitudes
connects
adja
cent
accelerating
cells).
I1.O
_.9
°30.
8
u0.7-
cx
iLO.
J 0.1C
>C
ACCELERATING
CELL
S-'
§-MEASURED
-CALCULATED
CLI
NGCE
ILL CELL
DETU
NED
1-12.7
MHz'I-
''.
!1
23
45
67
89
1011
1213
1Y15
1617
1819
2021
2223
CELL
NUMB
ER
Figu
re4:
Comp
aris
onof
measured
and
cal-
culated
2w/3
-mod
eaxial
elec
tric
fiel
dam
pli-
tudes
for
cell
11detuned
-12.
7MHz
(the
soli
dline
for
the
acce
lera
ting
cell
ampli-
tudes
connects
adjacent
accelerating
cells).
1.0
CL :D: °
0.8
110.
7
-0.6
X
0.2
.0
o
COUP
LING
CELL
SCCE
LL\
-12.7MHz
I1-I
IIII
I1
23
45
67
89
1011
1213
1415
1617
1819
2021
2223
CELL
NUMBER
_ F
1.0
0.
n iO.
9 .2
_,0.
8
LJ ,_0.
7
UJ
-i0.
6
fME
ASUR
EDI\
,,-
CALCULATED
\ERI
L
.1J
ACCELERATING
CELLS
7
7
v.I.,
k

'°.
0i
i§
§i
<ACCELERATING
CELL
SC3~~~~~~~~~~~~~~~~~~EL
~0.a
L...2
-ME
ASUR
ED
CALCULATED
0.3
I'°*30
4COUPLING,
4-e0.2
/CELLS
Ca
0.1
CELL
CELL
-CELL
SETUNE
DETU
NED
DETU
NED
i*5.7M
Hz-12.7kHz
-5.1MHz
0_
11
1I
.I
12
34
56
78
910
1112
1314
1516
1718
1920
2122
23
CELL
NUMB
ER
Figure
5:Co
mpar
ison
of
measured
and
cal-
cula
ted
Tr/2
-mod
eaxial
electric
field
ampl
itud
esfor
cell
3detuned
-12.7
MHz
and
the
end
cells
detuned+5.7
MHz.
00
12
34
56
78
910
1112
1314
1516
1718
1920
2122
2324
2526
2728
29
CASE
ERROR
,
CASE
COUPL4IG
DRIVE:
f
Ii
t2AE'
ERRO
R IER
R
3**
**
ERRO
R**
tr5
t~~~
~~~~
~rDRIV
ECASE'
COUPLINGI
3''ERROR'
l~i
j
rfDR
IVE
*AMPLITUPE
DIFFERS
FROM
rfDR
IVE
CELL
AMPLITUDE
BYCO
UPLI
NGCONSTANT
RATI
OAT
ERROR
LOCATION
Figure
7:Three
cases
of
2T/3-mode
field
ampl
itud
eswith
coupling-constant
errors
between
cell
s5
and
6,cells
4and
5and
cells
6and
7.lxx
and
"o"f
(cro
ssan
ddot)
cell
sare
accelerating
cells
asidentified
inthe
text,
unlabelled
cells
are
couplers.
-1COUPLING
/1_
CELLS
§__
CELL
CELL
DETU
NED
DETUNED
+5.7MHz
I-12.7
MHzI'
II
I
12
34
56
78
910
1112
1314
1516
1718
1920
2122
23
CELL
NUMBER
Figure
6:Comparison
of
measured
and
cal-
culated
2w/3-mode
axial
electric
field
amplitudes
for
cell
4detuned
-12.7
MHz
and
the
end
cells
detuned+5.7
MHz
(the
solid
line
for
the
accelerating
cell
amplitudes
connects
adjacent
accelerating
cells).

*lRMHz ERROR IN FIRST CELL21T,3MODE SYSTEM -1OMHz ERROR IN LAST CELL 1. 003
1 2 3 4 5 6 7 8 9 11. 40 _ 10 -
O0®O®@0 (E o ------- o1. 38 - 1.002 - 1. 08
1.36 2 1.061 34 0 1 001I U 1 0
1,16 p1l 1ll 1l;:lill | > laslil@"-J.I'. 1.0
132 1. 02-1. 30- 1 1. 00. L)
1. 00 2
1.28- | I II . 0. 98CD 12 'I 1Ij I 112 6g0.999 0. 96
U-1.24- I I 11 CELL 1Ts2S f t 0. 94o
| I ~ ; 0*h11velnralzdt nt.00
lu 1 .22 iI-I 29 CELL 211T/3 SYSTEM
0I.98 Ill! ' l( ll' i ll;,,
~ 1.1 2 Ij 6 8 10 122f -or RESONANCE 18 220 22t -At RESONANCE At 230
~1.10 ii I ORIVE CEL NUME fO 2x MOOMOE2E/ MD
Fiur I: Caclae II/d Figure 10eaneolrltieaiacleti106c fil amltue fo fiel varition celt-leortel/ n
1.4 tII6 2/moeasafntnofI frequencywithI
1.02ne +1 MHz the driv cell noralze toeunity
I0.12-2
'1 6 8 lOt 12 14 16 18 20 22 24 26 28ONNCE 30aff -f ESOANC 6f 26
- 10 MHz.
1. 1it , .21212 52223 242526272829 2 23/3CELLUSER1.17 _ ifiel d v 2W/3a 29 CELLS (DRIVE CELL-cl)
1.04 -~ ~ ~ 1161'1
a 1 X Al I i / t 1/ t /Ii 1
rz~~ ~ ~ ~ ~ ~ 2/ moe as a/\fucto of frqec withf|{ $t11/2S
1.00~~~~~~.1 t j I
0 1. 0 / I2''6 8 0 1121 16 20222426 28 131 EINI EN
10 \/n _ I i /l 2/1I
ORIVE CEL NUBRFO TI3MD
1.6-1EELL(RVLCL-I
1.018 123H567 891 1-,- 122 32 52 72 9 2T/ ELNME
CELL NUMBER
Figure 9: Calculated 2w/3-mode axial elec-tric field amplitude for a systematicfrequency error represented by a cosinedistribution of 1 MHz amplitude (couplingcells for the 2T/3-mode are signified by C).
1349
![[ω(t+T)+ϕ0]−[ω 2π 2π ω ϕ - elib.bsu.byelib.bsu.by/bitstream/123456789/7561/23/Лекции... · Очевидно, что максимальное отклонение точки](https://img.pdfslide.tips/doc/110x75/5b9eec7309d3f2e02c8c6833/tt0-2-2-elibbsu-.jpg)