Embed Size (px)
Citation preview
07 JSR Corporation Annual Report 2017
CONSOLIDATED BALANCE SHEETSJSR Corporation and Consolidated SubsidiariesAs at March 31, 2016 and 2017
Millions of yen
Thousands ofU.S. dollars
(Note 1)
ASSETS 2016 2017 2017
Current assets:
Cash and deposits (Notes 3, 5 and 7) ¥ 52,081 ¥ 98,933 $ 881,835
Notes and accounts receivable—trade, net (Notes 4, 5 and 7) 77,878 90,695 808,401
Short-term investment securities (Notes 3, 5 and 6) 60,010 42,000 374,365
Inventories (Note 7) 77,458 81,918 730,169
Other (Notes 3, 7 and 9) 33,104 34,667 308,998
Total current assets 300,532 348,212 3,103,768
Non-current assets:
Property, plant and equipment:
Buildings and structures, net (Note 7) 34,810 33,903 302,193
Machinery, equipment and vehicles, net (Note 7) 37,058 53,507 476,931
Land (Note 7) 17,136 15,734 140,245
Construction in progress 17,944 18,804 167,610
Other, net (Note 7) 5,746 8,212 73,198
Total property, plant and equipment 112,694 130,160 1,160,176
Intangible assets
Goodwill 9,788 8,817 78,591
Other (Note 7) 6,875 8,369 74,594
Total intangible assets 16,663 17,186 153,186
Investments and other assets
Investment securities (Notes 5 and 6) 67,878 61,684 549,820
Net defined benefit asset (Note 8) — 373 3,324
Other, net (Notes 4, 5, 7 and 9) 18,592 18,401 164,020
Total investments and other assets 86,470 80,459 717,164
Total non-current assets 215,827 227,805 2,030,526
Total assets ¥ 516,360 ¥ 576,016 $ 5,134,294
See accompanying notes.
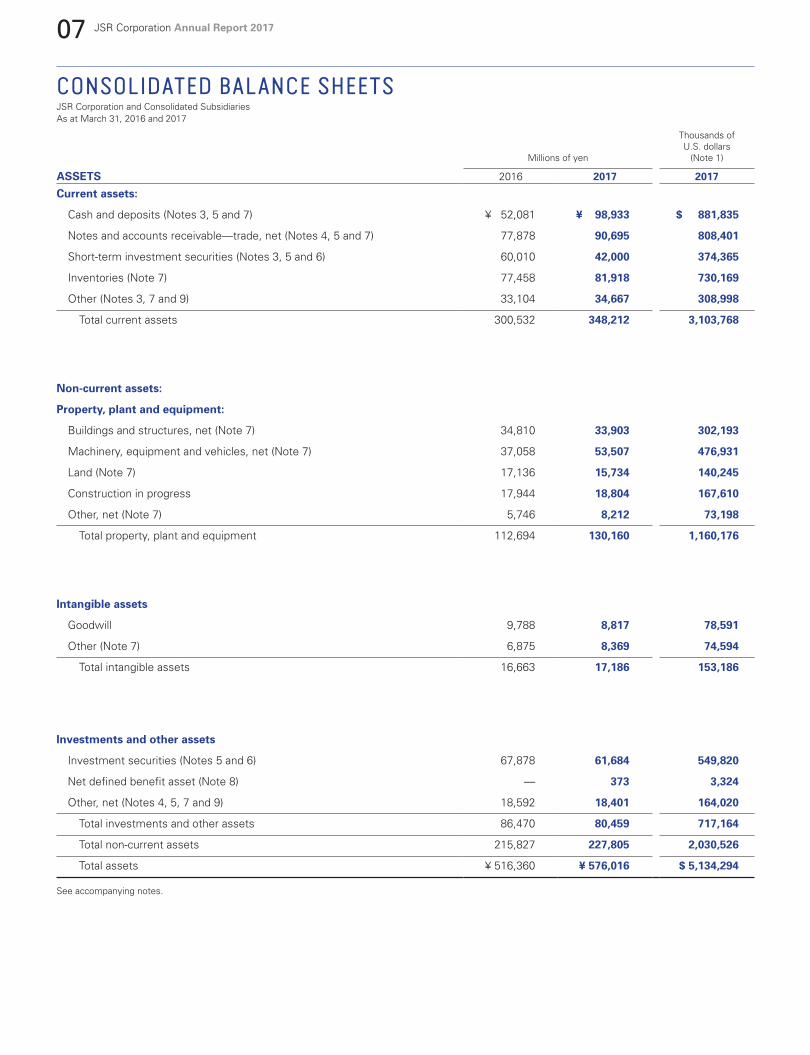
08 JSR Corporation Annual Report 2017
Millions of yen
Thousands ofU.S. dollars
(Note 1)
LIABILITIES AND NET ASSETS 2016 2017 2017
Current liabilities:
Notes and accounts payable—trade (Note 5) ¥ 53,836 ¥ 75,026 $ 668,743
Short-term loans payable (Notes 5 and 7) 20,840 23,740 211,609
Income taxes payable 1,916 8,360 74,513
Other (Note 9) 32,730 32,536 290,011
Total current liabilities 109,322 139,663 1,244,877
Non-current liabilities:
Long-term loans payable (Notes 5 and 7) 22,249 38,381 342,107
Net defined benefit liability (Note 8) 15,180 13,904 123,932
Other (Note 9) 7,254 7,354 65,553
Total non-current liabilities 44,684 59,639 531,592
Total liabilities 154,006 199,302 1,776,468
Contingent liabilities (Note 19)
Net assets (Note 12)
Shareholders‘ equity
Common stock:
Authorized —696,061,000 shares
Issued —226,074,545 shares in 2016 and 2017 23,320 23,320 207,863
Capital surplus (Note 18) 25,179 17,469 155,708
Retained earnings 281,878 300,547 2,678,907
Treasury stock
488,223 shares in 2016 and 3,560,532 shares in 2017 (957) (5,396) (48,096)
Accumulated other comprehensive income
Unrealized gains on securities, net of taxes 15,231 17,311 154,299
Foreign currency translation adjustment 9,307 7,231 64,451
Remeasurements of defined benefit plans (Note 8) (815) 913 8,136
Subscription rights to shares (Note 13) 930 912 8,126
Non-controlling interests 8,279 14,409 128,433
Total net assets 362,354 376,715 3,357,826
Total liabilities and net assets ¥ 516,360 ¥ 576,016 $ 5,134,294
See accompanying notes.
09 JSR Corporation Annual Report 2017
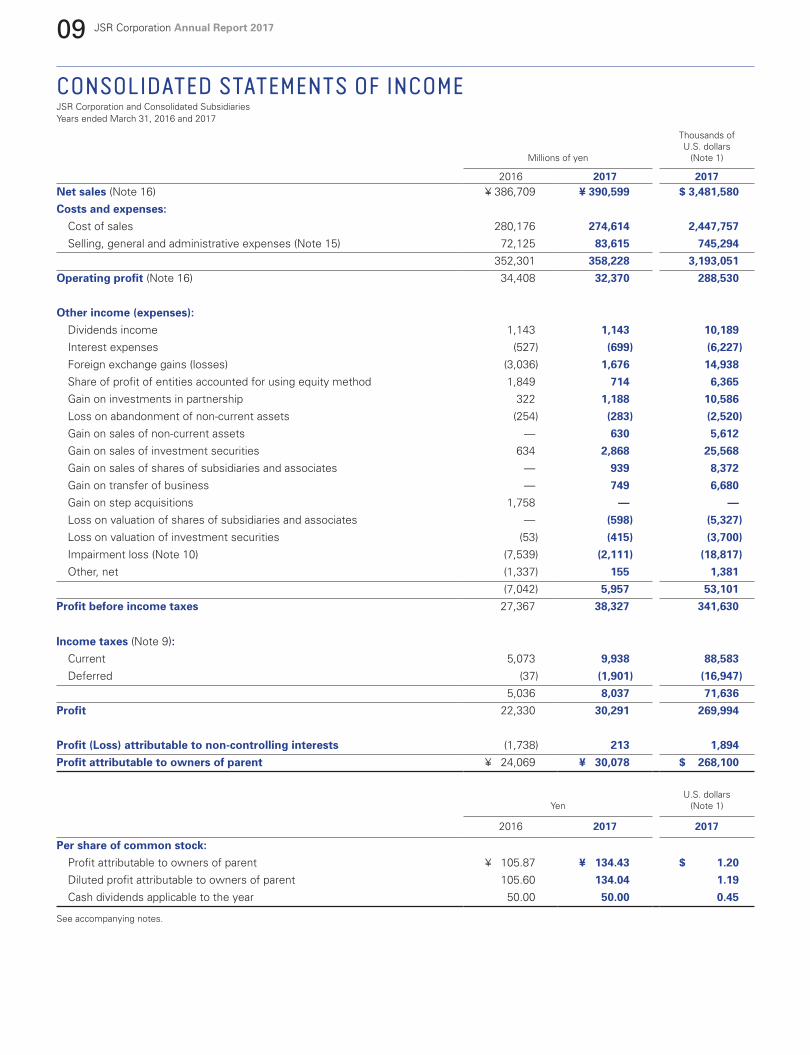
CONSOLIDATED STATEMENTS OF INCOMEJSR Corporation and Consolidated SubsidiariesYears ended March 31, 2016 and 2017
Millions of yen
Thousands ofU.S. dollars
(Note 1)
2016 2017 2017Net sales (Note 16) ¥ 386,709 ¥ 390,599 $ 3,481,580
Costs and expenses:
Cost of sales 280,176 274,614 2,447,757
Selling, general and administrative expenses (Note 15) 72,125 83,615 745,294
352,301 358,228 3,193,051
Operating profit (Note 16) 34,408 32,370 288,530
Other income (expenses):
Dividends income 1,143 1,143 10,189
Interest expenses (527) (699) (6,227)
Foreign exchange gains (losses) (3,036) 1,676 14,938
Share of profit of entities accounted for using equity method 1,849 714 6,365
Gain on investments in partnership 322 1,188 10,586
Loss on abandonment of non-current assets (254) (283) (2,520)
Gain on sales of non-current assets — 630 5,612
Gain on sales of investment securities 634 2,868 25,568
Gain on sales of shares of subsidiaries and associates — 939 8,372
Gain on transfer of business — 749 6,680
Gain on step acquisitions 1,758 — —
Loss on valuation of shares of subsidiaries and associates — (598) (5,327)
Loss on valuation of investment securities (53) (415) (3,700)
Impairment loss (Note 10) (7,539) (2,111) (18,817)
Other, net (1,337) 155 1,381
(7,042) 5,957 53,101
Profit before income taxes 27,367 38,327 341,630
Income taxes (Note 9):Current 5,073 9,938 88,583
Deferred (37) (1,901) (16,947)
5,036 8,037 71,636
Profit 22,330 30,291 269,994
Profit (Loss) attributable to non-controlling interests (1,738) 213 1,894
Profit attributable to owners of parent ¥ 24,069 ¥ 30,078 $ 268,100
YenU.S. dollars
(Note 1)
2016 2017 2017
Per share of common stock:
Profit attributable to owners of parent ¥ 105.87 ¥ 134.43 $ 1.20
Diluted profit attributable to owners of parent 105.60 134.04 1.19
Cash dividends applicable to the year 50.00 50.00 0.45
See accompanying notes.
10 JSR Corporation Annual Report 2017
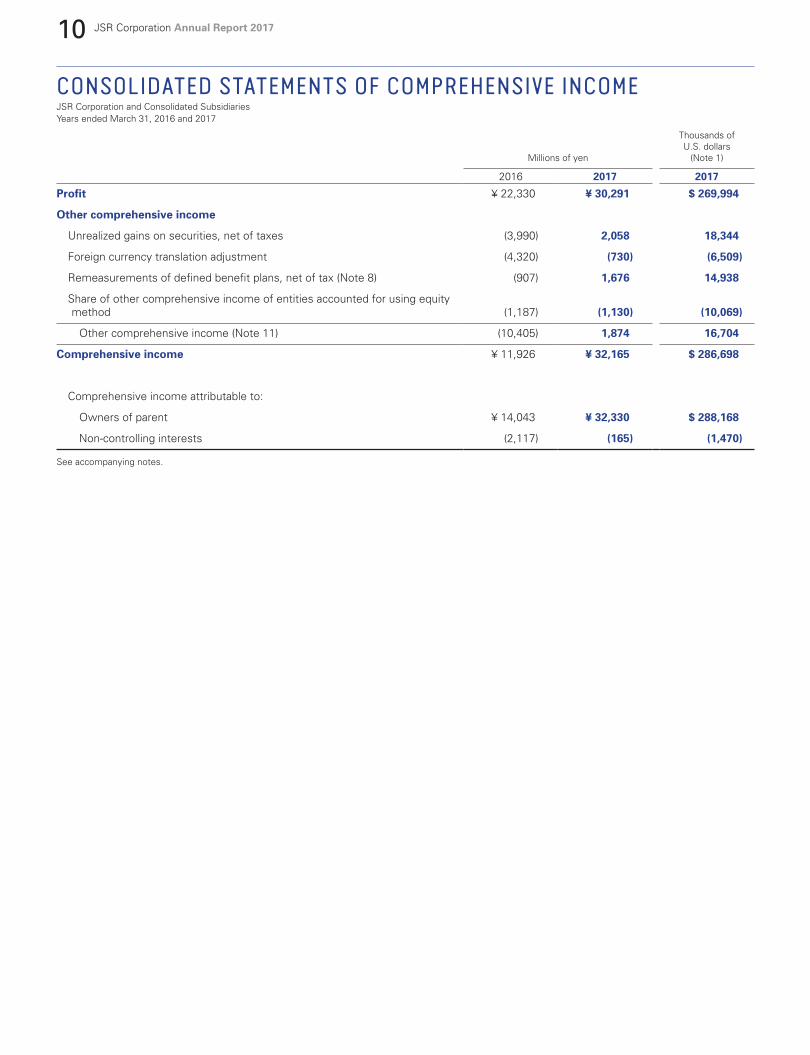
CONSOLIDATED STATEMENTS OF COMPREHENSIVE INCOMEJSR Corporation and Consolidated SubsidiariesYears ended March 31, 2016 and 2017
Millions of yen
Thousands ofU.S. dollars
(Note 1)
2016 2017 2017
Profit ¥ 22,330 ¥ 30,291 $ 269,994
Other comprehensive income
Unrealized gains on securities, net of taxes (3,990) 2,058 18,344
Foreign currency translation adjustment (4,320) (730) (6,509)
Remeasurements of defined benefit plans, net of tax (Note 8) (907) 1,676 14,938
Share of other comprehensive income of entities accounted for using equity method (1,187) (1,130) (10,069)
Other comprehensive income (Note 11) (10,405) 1,874 16,704
Comprehensive income ¥ 11,926 ¥ 32,165 $ 286,698
Comprehensive income attributable to:
Owners of parent ¥ 14,043 ¥ 32,330 $ 288,168
Non-controlling interests (2,117) (165) (1,470)
See accompanying notes.
11 JSR Corporation Annual Report 2017
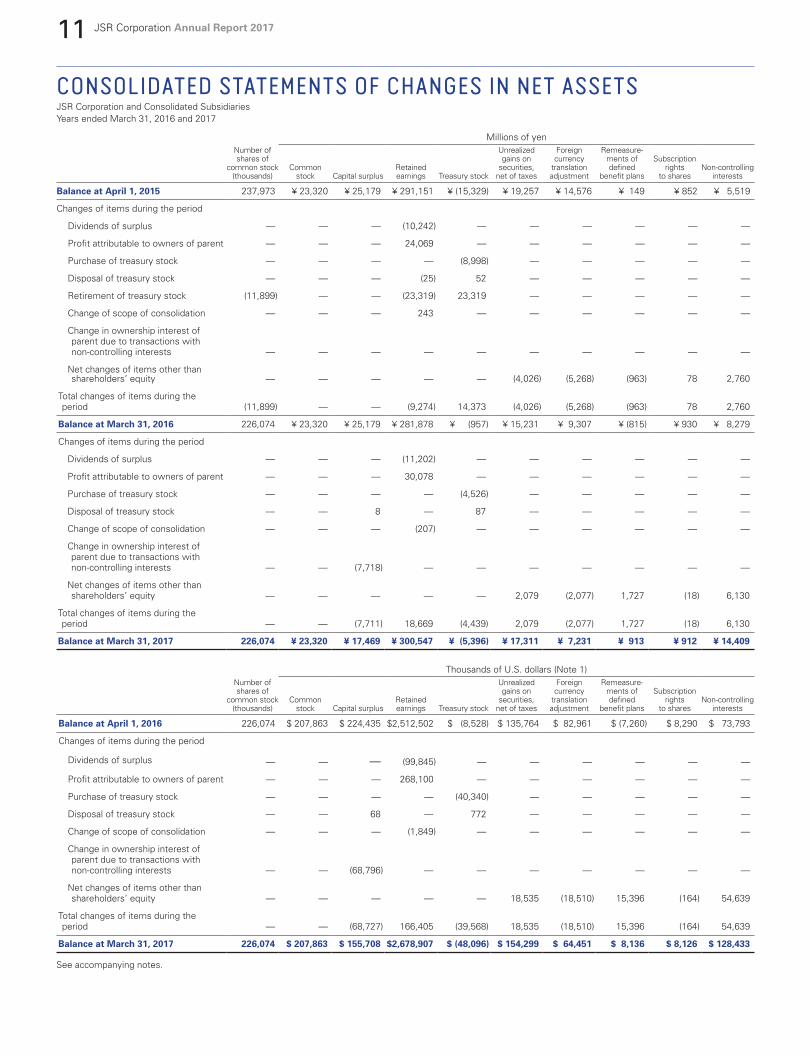
CONSOLIDATED STATEMENTS OF CHANGES IN NET ASSETSJSR Corporation and Consolidated SubsidiariesYears ended March 31, 2016 and 2017
Millions of yenNumber of shares of
common stock (thousands)
Common stock Capital surplus
Retained earnings Treasury stock
Unrealized gains on
securities,net of taxes
Foreigncurrency
translation adjustment
Remeasure-ments of defined
benefit plans
Subscription rights
to sharesNon-controlling
interests
Balance at April 1, 2015 237,973 ¥ 23,320 ¥ 25,179 ¥ 291,151 ¥ (15,329) ¥ 19,257 ¥ 14,576 ¥ 149 ¥ 852 ¥ 5,519
Changes of items during the period
Dividends of surplus — — — (10,242) — — — — — —
Profit attributable to owners of parent — — — 24,069 — — — — — —
Purchase of treasury stock — — — — (8,998) — — — — —
Disposal of treasury stock — — — (25) 52 — — — — —
Retirement of treasury stock (11,899) — — (23,319) 23,319 — — — — —
Change of scope of consolidation — — — 243 — — — — — —
Change in ownership interest of parent due to transactions with non-controlling interests — — — — — — — — — —
Net changes of items other than shareholders’ equity — — — — — (4,026) (5,268) (963) 78 2,760
Total changes of items during the period (11,899) — — (9,274) 14,373 (4,026) (5,268) (963) 78 2,760
Balance at March 31, 2016 226,074 ¥ 23,320 ¥ 25,179 ¥ 281,878 ¥ (957) ¥ 15,231 ¥ 9,307 ¥ (815) ¥ 930 ¥ 8,279
Changes of items during the period
Dividends of surplus — — — (11,202) — — — — — —
Profit attributable to owners of parent — — — 30,078 — — — — — —
Purchase of treasury stock — — — — (4,526) — — — — —
Disposal of treasury stock — — 8 — 87 — — — — —
Change of scope of consolidation — — — (207) — — — — — —
Change in ownership interest of parent due to transactions with non-controlling interests — — (7,718) — — — — — — —
Net changes of items other than shareholders’ equity — — — — — 2,079 (2,077) 1,727 (18) 6,130
Total changes of items during the period — — (7,711) 18,669 (4,439) 2,079 (2,077) 1,727 (18) 6,130
Balance at March 31, 2017 226,074 ¥ 23,320 ¥ 17,469 ¥ 300,547 ¥ (5,396) ¥ 17,311 ¥ 7,231 ¥ 913 ¥ 912 ¥ 14,409
Thousands of U.S. dollars (Note 1)Number of shares of
common stock (thousands)
Common stock Capital surplus
Retained earnings Treasury stock
Unrealized gains on
securities,net of taxes
Foreigncurrency
translation adjustment
Remeasure-ments of defined
benefit plans
Subscription rights
to sharesNon-controlling
interests
Balance at April 1, 2016 226,074 $ 207,863 $ 224,435 $2,512,502 $ (8,528) $ 135,764 $ 82,961 $ (7,260) $ 8,290 $ 73,793
Changes of items during the period
Dividends of surplus — — — (99,845) — — — — — —
Profit attributable to owners of parent — — — 268,100 — — — — — —
Purchase of treasury stock — — — — (40,340) — — — — —
Disposal of treasury stock — — 68 — 772 — — — — —
Change of scope of consolidation — — — (1,849) — — — — — —
Change in ownership interest of parent due to transactions with non-controlling interests — — (68,796) — — — — — — —
Net changes of items other than shareholders’ equity — — — — — 18,535 (18,510) 15,396 (164) 54,639
Total changes of items during the period — — (68,727) 166,405 (39,568) 18,535 (18,510) 15,396 (164) 54,639
Balance at March 31, 2017 226,074 $ 207,863 $ 155,708 $2,678,907 $ (48,096) $ 154,299 $ 64,451 $ 8,136 $ 8,126 $ 128,433
See accompanying notes.
12 JSR Corporation Annual Report 2017
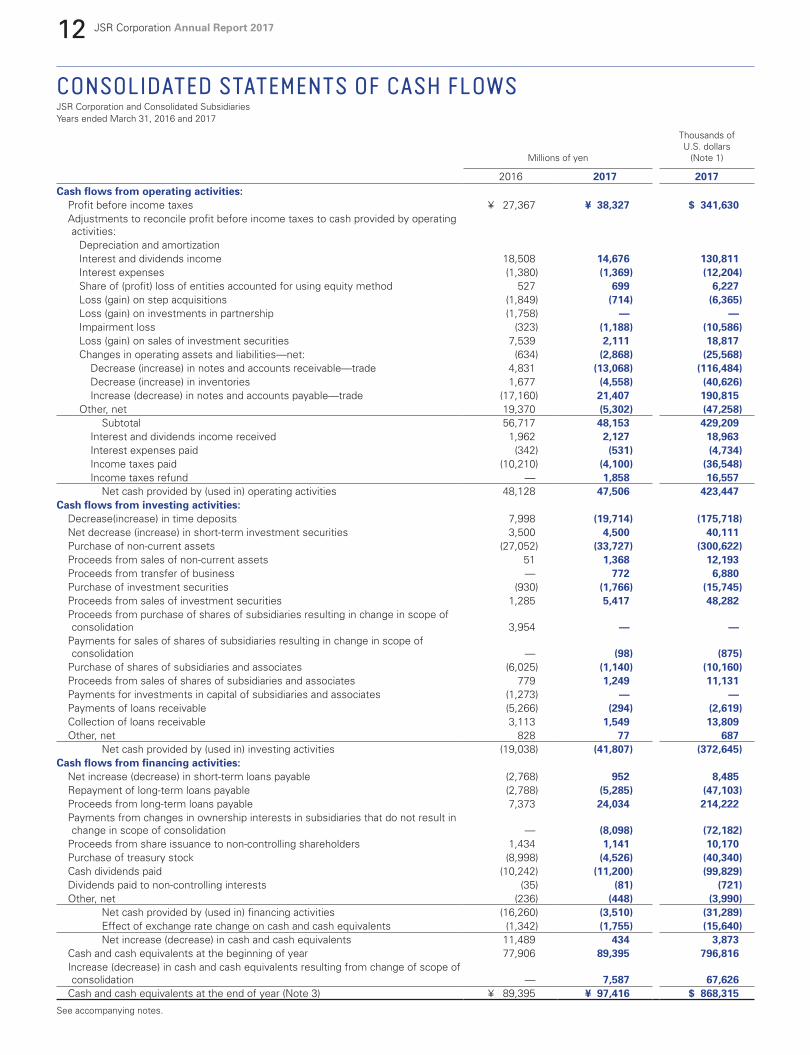
CONSOLIDATED STATEMENTS OF CASH FLOWSJSR Corporation and Consolidated SubsidiariesYears ended March 31, 2016 and 2017
Millions of yen
Thousands ofU.S. dollars
(Note 1)
2016 2017 2017Cash flows from operating activities:
Profit before income taxes ¥ 27,367 ¥ 38,327 $ 341,630 Adjustments to reconcile profit before income taxes to cash provided by operating activities:
Depreciation and amortizationInterest and dividends income 18,508 14,676 130,811 Interest expenses (1,380) (1,369) (12,204)Share of (profit) loss of entities accounted for using equity method 527 699 6,227 Loss (gain) on step acquisitions (1,849) (714) (6,365)Loss (gain) on investments in partnership (1,758) — — Impairment loss (323) (1,188) (10,586)Loss (gain) on sales of investment securities 7,539 2,111 18,817 Changes in operating assets and liabilities—net: (634) (2,868) (25,568)
Decrease (increase) in notes and accounts receivable—trade 4,831 (13,068) (116,484)Decrease (increase) in inventories 1,677 (4,558) (40,626)Increase (decrease) in notes and accounts payable—trade (17,160) 21,407 190,815
Other, net 19,370 (5,302) (47,258)Subtotal 56,717 48,153 429,209
Interest and dividends income received 1,962 2,127 18,963 Interest expenses paid (342) (531) (4,734)Income taxes paid (10,210) (4,100) (36,548)Income taxes refund — 1,858 16,557
Net cash provided by (used in) operating activities 48,128 47,506 423,447 Cash flows from investing activities:
Decrease(increase) in time deposits 7,998 (19,714) (175,718)Net decrease (increase) in short-term investment securities 3,500 4,500 40,111 Purchase of non-current assets (27,052) (33,727) (300,622)Proceeds from sales of non-current assets 51 1,368 12,193 Proceeds from transfer of business — 772 6,880 Purchase of investment securities (930) (1,766) (15,745)Proceeds from sales of investment securities 1,285 5,417 48,282 Proceeds from purchase of shares of subsidiaries resulting in change in scope of consolidation 3,954 — —
Payments for sales of shares of subsidiaries resulting in change in scope of consolidation — (98) (875)
Purchase of shares of subsidiaries and associates (6,025) (1,140) (10,160)Proceeds from sales of shares of subsidiaries and associates 779 1,249 11,131 Payments for investments in capital of subsidiaries and associates (1,273) — — Payments of loans receivable (5,266) (294) (2,619)Collection of loans receivable 3,113 1,549 13,809 Other, net 828 77 687
Net cash provided by (used in) investing activities (19,038) (41,807) (372,645)Cash flows from financing activities:
Net increase (decrease) in short-term loans payable (2,768) 952 8,485 Repayment of long-term loans payable (2,788) (5,285) (47,103)Proceeds from long-term loans payable 7,373 24,034 214,222 Payments from changes in ownership interests in subsidiaries that do not result in change in scope of consolidation — (8,098) (72,182)
Proceeds from share issuance to non-controlling shareholders 1,434 1,141 10,170 Purchase of treasury stock (8,998) (4,526) (40,340)Cash dividends paid (10,242) (11,200) (99,829)Dividends paid to non-controlling interests (35) (81) (721)Other, net (236) (448) (3,990)
Net cash provided by (used in) financing activities (16,260) (3,510) (31,289)Effect of exchange rate change on cash and cash equivalents (1,342) (1,755) (15,640)Net increase (decrease) in cash and cash equivalents 11,489 434 3,873
Cash and cash equivalents at the beginning of year 77,906 89,395 796,816 Increase (decrease) in cash and cash equivalents resulting from change of scope of consolidation — 7,587 67,626
Cash and cash equivalents at the end of year (Note 3) ¥ 89,395 ¥ 97,416 $ 868,315
See accompanying notes.
13 JSR Corporation Annual Report 2017
NOTES TO REGARDING CONSOLIDATED FINANCIAL STATEMENTSJSR Corporation and Consolidated SubsidiariesYears ended March 31, 2016 and 2017
1. Basis of Consolidated Financial Statements
2. Summary of Significant Accounting Policies
The consolidated financial statements of JSR Corporation (herein-after called “the Company”) and its consolidated subsidiaries have been prepared in accordance with the provisions set forth in the Japanese Financial Instruments and Exchange Law and its related accounting regulations, and in conformity with accounting prin-ciples generally accepted in Japan (Japanese GAAP), which are different in certain respects as to application and disclosure require-ments of International Financial Reporting Standards. The accounts of the Company’s overseas subsidiaries and asso-ciates are based on their accounting records maintained in con-formity with generally accepted accounting principles prevailing in the respective countries of domicile and make necessary amend-ments for consolidated financial statements required by Practical Issues Task Force No.18 issued by ASBJ. The consolidated finan-cial statements have been restructured and translated into English
(with some expanded descriptions) from the consolidated financial statements of the Company prepared in accordance with Japanese GAAP and filed with the appropriate Local Finance Bureau of the Ministry of Finance as required by the Japanese Financial Instruments and Exchange Law. Some supplementary information included in the statutory Japanese language consolidated financial statements, but not required for fair presentation, is not presented in the consolidated financial statements. The translation of the amounts in Japanese yen into U.S. dollars are included solely for the convenience of readers outside Japan, using the prevailing exchange rate on March 31, 2017, which was ¥112.19 to U.S. $1.00. The amounts translated should not be con-strued as representations that the amounts in Japanese yen have been, could have been, or could in the future be, converted into U.S. dollars at this or any other rate of exchange.
(a) Consolidation—The consolidated financial statements include the accounts of the Company and its significant subsidiaries (43 subsidiaries in 2016 and 2017). All significant inter-company accounts and transactions have been eliminated in consolidation. Effective from the current fiscal year, JSR MOL Synthetic Rubber Ltd., PT.ELASTOMIX INDONESIA, and Techno Europe N.V., were included in the scope of consolidation due to increase of their mate-riality. JSR Optech Tsukuba Co., Ltd. was excluded from the scope of consolidation due to transfer of all shares to an external entity.(b) Equity method—Investments in associates (all of those 20% to 50% owned and some of those 15% to 20% owned) were accounted for by the equity method (13 associates in 2016 and 12 in 2017). Unconsolidated subsidiaries and the other associates to which the equity method is not applied are stated at cost since their profit attributable to owners of parent and retained earnings in the aggregate are not material compared to consolidated profit attributable to owners of parent and retained earnings, respectively.(c) Cash and cash equivalents—In preparing the consolidated statement of cash flows, cash on hand, readily available depos-its and short-term highly liquid investments with maturities not exceeding three months at the time of purchase are considered to be cash and cash equivalents.(d) Short-term securities and investment securities—The Company and its consolidated subsidiaries (referred to as “the Group”) had no trading securities or held-to-maturity debt securi-ties. Equity securities issued by subsidiaries and associates, which are not consolidated or accounted for using the equity method, are stated at moving-average cost. Available-for-sale securities with available fair market values are stated at fair market value and unrealized gains and losses on these securities are presented, net of applicable income taxes, as a
separate component of net assets via the consolidated statements of comprehensive income. Realized gains and losses on sale of such securities are com-puted using moving-average cost. Available-for-sale securities with no available fair market values are stated at moving-average cost or amortized cost.(e) Inventories—Inventories are stated at cost, which is deter-mined mainly based on the gross average method (for the value stated on the balance sheet, book value is written down to reflect the lower profitability).(f) Property, plant and equipment—Property, plant and equip-ment are stated at cost. The straight-line method is used for depreciation.(g) Intangible assets—Goodwill is amortized by the straight-line method over the estimated useful lives up to twenty years. Software for its own use is amortized over the estimated useful life (five years) using the straight-line method.(h) Leased assets—Assets of finance leases are depreciated over the lease term using the straight-line method that residual value is zero.(i) Allowance for doubtful accounts—Allowance for doubtful accounts is provided in amounts sufficient to cover possible losses on collection. Allowance for doubtful accounts consists of the esti-mated unrecoverable amount with respect to specific items, and the amount calculated using the actual percentage of losses in the past with respect to other items.(j) Net defined benefit asset/liability—Employees of the Group are entitled, under most circumstances, to lump-sum severance payments or pension payments upon reaching the mandatory retirement age, or earlier in the case of voluntary or involuntary ter-mination, based on the compensation at the time of severance and years of service. Net defined benefit asset/liability is presented by deducting
14 JSR Corporation Annual Report 2017
the amount of plan assets from that of retirement benefits obliga-tions based on the projected benefits obligations and plan assets deemed to have accrued at the end of the current fiscal year. The benefit formula basis is applied as the method for attribut-ing expected retirement benefit to the relevant periods ending at the end of the current fiscal year. Actuarial gains or losses are recognized as expense in lump sum during the following period. Unrecognized actuarial gains or losses are, after tax effect adjust-ment, recorded as remeasurements of defined benefit plans under accumulated other comprehensive income in the net assets section.(k) Provision for environmental measures—A provision for envi-ronmental measures is provided based on estimated costs for the disposal of polychlorinated biphenyl (PCB) as mandated by the Law Concerning Special Measures Against PCB Waste.(l) Income taxes—The Group provides for income taxes applica-ble to all items included in the consolidated statement of income regardless of when such taxes are payable. Income taxes based on temporary differences between tax and financial reporting pur-poses are reflected as deferred income taxes in the consolidated financial statements using the asset and liability method.
(i) Application of consolidated corporate-tax return systemThe consolidated corporate-tax return system is applied.
(m) Derivative and hedging activities—The Group uses deriv-ative financial instruments to manage their exposures to fluctu-ations in foreign exchange and interest rates. Foreign exchange forward contracts and interest rate swaps are utilized by the Group to reduce foreign currency exchange and interest rate risks. The Group does not enter into derivatives for trading purposes or speculative purposes. Derivative financial instruments and foreign currency transactions are classified and accounted for as follows:
(i) All derivatives are recognized as either assets or liabilities and measured at fair value, and gains or losses on these derivative transactions are recognized in the consolidated statement of income.
(ii) The interest rate swaps that qualify for hedge account-ing and meet specific matching criteria are not remeasured at market value, but the differential paid or received under the swap agreements is recognized and included in interest expense or income as incurred.
(n) Foreign currency transactions—The Group translates assets and liabilities denominated in foreign currencies into Japanese yen at exchange rates prevailing at the balance sheet dates. Resulting exchange gains or losses are credited or charged to income as incurred.(o) Translation of foreign currency financial statements—Financial statements of overseas subsidiaries are translated into Japanese yen using the respective year-end rate for assets and liabilities, the average rate for revenues and expenses, and the historical rates for shareholders’ equity accounts. Foreign currency translation adjust-ments are contained in accumulated other comprehensive income and non-controlling interests.
(p) Change in accounting policy which is difficult to distinguish from change in accounting estimate(i) Change in the depreciation method of property, plant and
equipmentEffective from the current fiscal year, the Company and some of its consolidated subsidiaries has altered the method of depreciation for property, plant and equipment from the declining balancing method to the straight-line method although they had traditionally adopted the declining bal-ance method for property, plant and equipment excluding lease assets with the exception of adopting the straight-line method for buildings (other than the equipment attached thereto) acquired on or after April 1, 1998. The Company has been actively pursuing global expan-sion of its business in accordance with its Mid-Term Business Plan. From the current fiscal year onward, it has and will accelerate overseas investments for establishment of over-seas sales and production sites in order to expand overseas production capacity. The Company came to the conclusion, upon changes in the resource allocation and after review-ing the method for depreciation of the JSR Group, that it was appropriate to uniformly adopt the straight-line method for depreciation of the Group’s property, plant and equipment due to the following reasons; the straight-line method would more appropriately reflect economic reality of depreciating the property, plant and equipment of the JSR Group which were constructed after establishment of sound technolo-gies and development of the products and which therefore had generally long stable usable life; adoption of the straight-line method would further contribute globalization of the JSR Group as this would enable the Company to compare cost structures among the Group and subsequently to determine an appropriate allocation of resources as well as to make it easier to analyze business performances of multi-national companies operating globally. As a result of this change, depreciation expense on the straight-line basis incurred in the current fiscal year decreased by ¥3,273 million ($29,172 thousand) which brought the increase of the same amount on the Group’s consolidated operating profit, ordinary profit and profit before income taxes, compared to what they otherwise would have been had the traditional depreciation method been used.
(q) Amounts per share of common stock—The computation of profit attributable to owners of parent per share of common stock is based on the average number of shares outstanding during each fiscal year. Treasury stock has been excluded in the calculation of amounts per share of common stock. Cash dividends per share represent actual amounts applicable to the respective years.(r) Reclassifications—Certain prior year amounts have been reclassified and restated to conform to the current year presen-tation. These reclassifications and restatements had no effect on
15 JSR Corporation Annual Report 2017
previously reported results of operations or retained earnings.(s) Additional notes
(i) Application of “Revised Implementation Guidance on Recoverability of Deferred Tax Assets”The Group applies “Revised Implementation Guidance on Recoverability of Deferred Tax Assets” (Implementation Guidance on Accounting Standards, No.26 issued on March 28, 2016) as from the current fiscal year.
(ii) Change on treatment of research and development expensesEffective from the current fiscal year, the Company and some of its consolidated subsidiaries post all research and devel-opment expenses as general and administrative expenses upon reorganization of research laboratories, which enhances more fundamental and extensive R&D activities of the Group with innovative communication and collaboration. In the past, however, R&D expenses related to product development had been classified as costs of manufacturing since R&D for product development often involved improvement of existing products and were viewed as a part of manufacturing activ-ities, while those related to fundamental research had been classified as administrative expenses. Research and development expenses which were
included in costs of manufacturing in the previous fiscal year were ¥9,074 million ($80,876 thousand).
(iii) Shareholders agreement for integration of ABS resin businessOn March 30, 2017, Ube Industries, Ltd. (“Ube”), JSR Corporation (“JSR”), and Mitsubishi Rayon Co., Ltd. (“MRC”) signed a shareholders agreement to integrate the ABS resin business of Techno Polymer Co., Ltd., a wholly-owned sub-sidiary of JSR, and UMG ABS, Ltd. (“UMG ABS), a 50/50 joint venture between Ube and MRC, and to jointly operate the integrated new company scheduled to be effective on October 1, 2017. The integration will take the form of an absorption-type split, with UMG ABS as the absorbed company and Techno Polymer as the successor company. Upon com-pleting the absorption-type split, Techno Polymer will allo-cate common shares to UMG ABS so that, on the day that the absorption-type split takes effect, JSR will own 51% and UMG ABS will own 49% of the issued shares of the new company. This absorption-type split becomes effective only after all procedures regulated by competition laws and other related laws of countries concerned have completed.
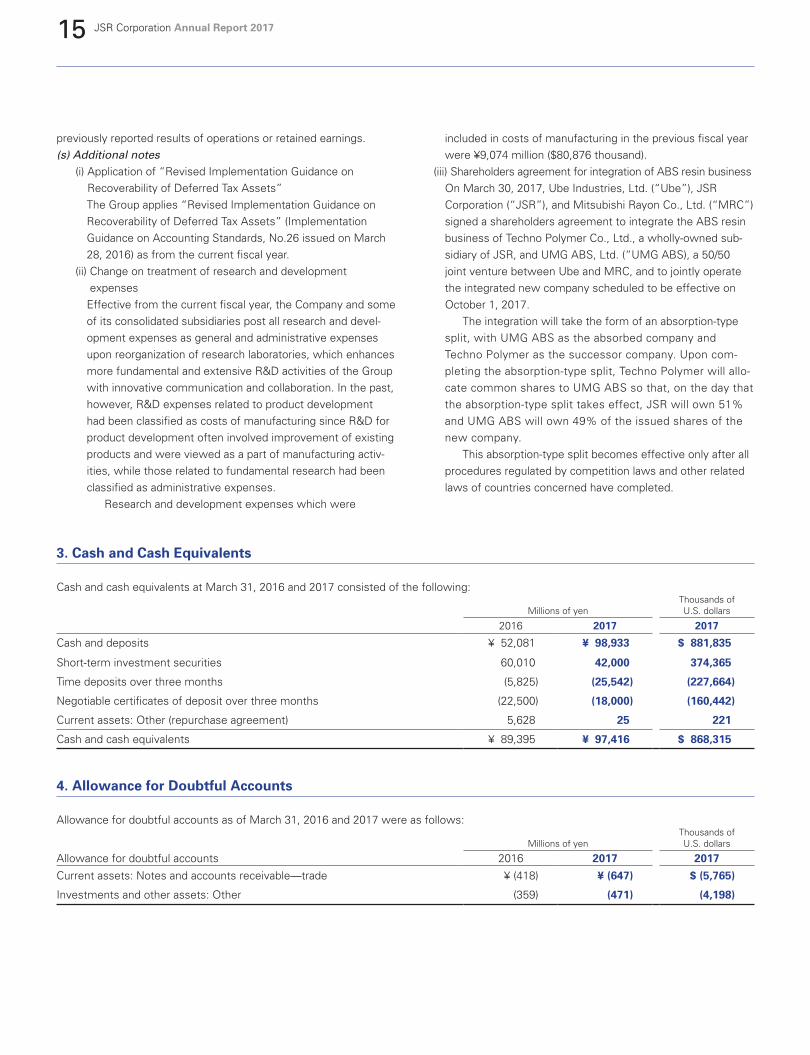
3. Cash and Cash Equivalents
Cash and cash equivalents at March 31, 2016 and 2017 consisted of the following:
Millions of yenThousands ofU.S. dollars
2016 2017 2017
Cash and deposits ¥ 52,081 ¥ 98,933 $ 881,835
Short-term investment securities 60,010 42,000 374,365
Time deposits over three months (5,825) (25,542) (227,664)
Negotiable certificates of deposit over three months (22,500) (18,000) (160,442)
Current assets: Other (repurchase agreement) 5,628 25 221
Cash and cash equivalents ¥ 89,395 ¥ 97,416 $ 868,315
4. Allowance for Doubtful Accounts
Allowance for doubtful accounts as of March 31, 2016 and 2017 were as follows:
Millions of yenThousands ofU.S. dollars
Allowance for doubtful accounts 2016 2017 2017
Current assets: Notes and accounts receivable—trade ¥ (418) ¥ (647) $ (5,765)
Investments and other assets: Other (359) (471) (4,198)
16 JSR Corporation Annual Report 2017
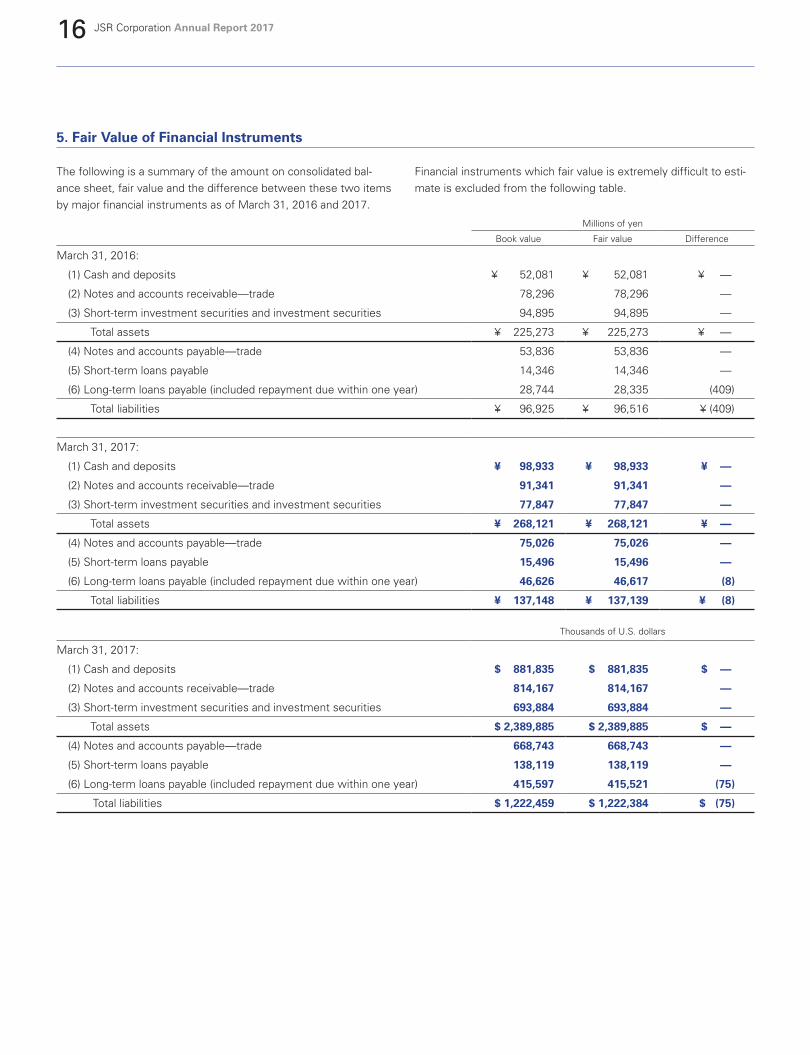
5. Fair Value of Financial Instruments
The following is a summary of the amount on consolidated bal-ance sheet, fair value and the difference between these two items by major financial instruments as of March 31, 2016 and 2017.
Financial instruments which fair value is extremely difficult to esti-mate is excluded from the following table.
Millions of yen
Book value Fair value Difference
March 31, 2016:
(1) Cash and deposits ¥ 52,081 ¥ 52,081 ¥ —
(2) Notes and accounts receivable—trade 78,296 78,296 —
(3) Short-term investment securities and investment securities 94,895 94,895 —
Total assets ¥ 225,273 ¥ 225,273 ¥ —
(4) Notes and accounts payable—trade 53,836 53,836 —
(5) Short-term loans payable 14,346 14,346 —
(6) Long-term loans payable (included repayment due within one year) 28,744 28,335 (409)
Total liabilities ¥ 96,925 ¥ 96,516 ¥ (409)
March 31, 2017:
(1) Cash and deposits ¥ 98,933 ¥ 98,933 ¥ —
(2) Notes and accounts receivable—trade 91,341 91,341 —
(3) Short-term investment securities and investment securities 77,847 77,847 —
Total assets ¥ 268,121 ¥ 268,121 ¥ —
(4) Notes and accounts payable—trade 75,026 75,026 —
(5) Short-term loans payable 15,496 15,496 —
(6) Long-term loans payable (included repayment due within one year) 46,626 46,617 (8)
Total liabilities ¥ 137,148 ¥ 137,139 ¥ (8)
Thousands of U.S. dollars
March 31, 2017:
(1) Cash and deposits $ 881,835 $ 881,835 $ —
(2) Notes and accounts receivable—trade 814,167 814,167 —
(3) Short-term investment securities and investment securities 693,884 693,884 —
Total assets $ 2,389,885 $ 2,389,885 $ —
(4) Notes and accounts payable—trade 668,743 668,743 —
(5) Short-term loans payable 138,119 138,119 —
(6) Long-term loans payable (included repayment due within one year) 415,597 415,521 (75)
Total liabilities $ 1,222,459 $ 1,222,384 $ (75)
17 JSR Corporation Annual Report 2017
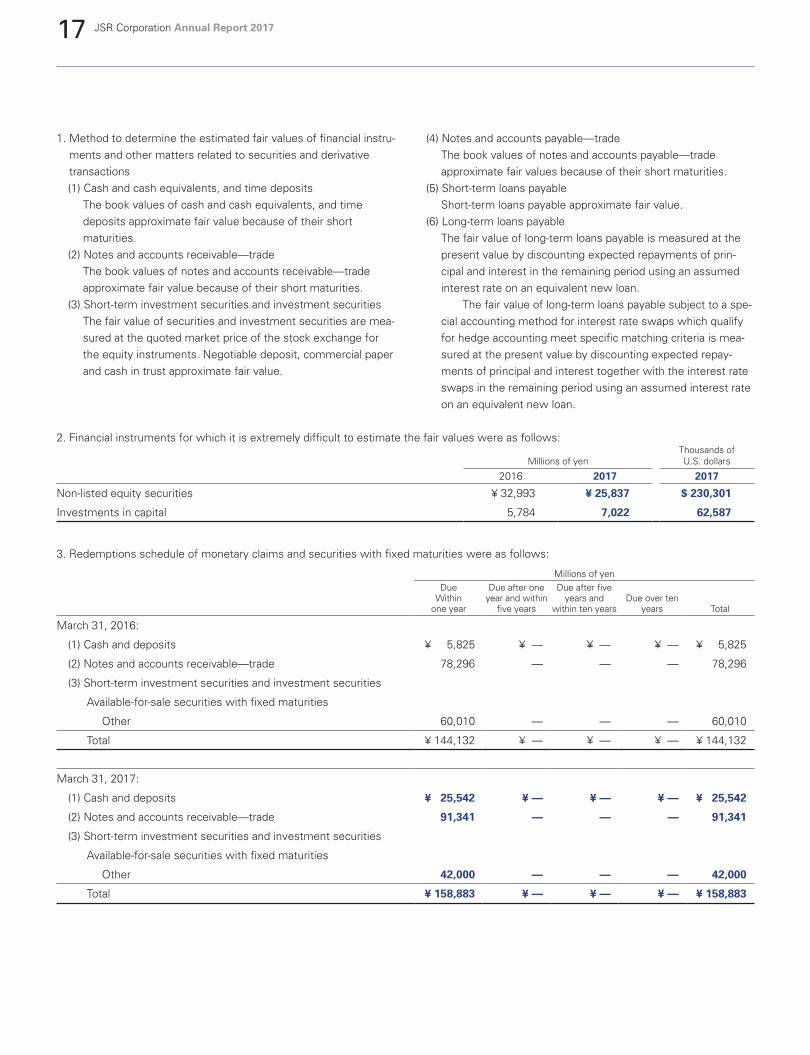
1. Method to determine the estimated fair values of financial instru-ments and other matters related to securities and derivative transactions(1) Cash and cash equivalents, and time deposits
The book values of cash and cash equivalents, and time deposits approximate fair value because of their short maturities.
(2) Notes and accounts receivable—tradeThe book values of notes and accounts receivable—trade approximate fair value because of their short maturities.
(3) Short-term investment securities and investment securitiesThe fair value of securities and investment securities are mea-sured at the quoted market price of the stock exchange for the equity instruments. Negotiable deposit, commercial paper and cash in trust approximate fair value.
(4) Notes and accounts payable—tradeThe book values of notes and accounts payable—trade approximate fair values because of their short maturities.
(5) Short-term loans payableShort-term loans payable approximate fair value.
(6) Long-term loans payableThe fair value of long-term loans payable is measured at the present value by discounting expected repayments of prin-cipal and interest in the remaining period using an assumed interest rate on an equivalent new loan. The fair value of long-term loans payable subject to a spe-cial accounting method for interest rate swaps which qualify for hedge accounting meet specific matching criteria is mea-sured at the present value by discounting expected repay-ments of principal and interest together with the interest rate swaps in the remaining period using an assumed interest rate on an equivalent new loan.
2. Financial instruments for which it is extremely difficult to estimate the fair values were as follows:
Millions of yenThousands ofU.S. dollars
2016 2017 2017
Non-listed equity securities ¥ 32,993 ¥ 25,837 $ 230,301
Investments in capital 5,784 7,022 62,587
3. Redemptions schedule of monetary claims and securities with fixed maturities were as follows:
Millions of yenDue
Withinone year
Due after one year and within
five years
Due after five years and
within ten yearsDue over ten
years Total
March 31, 2016:
(1) Cash and deposits ¥ 5,825 ¥ — ¥ — ¥ — ¥ 5,825
(2) Notes and accounts receivable—trade 78,296 — — — 78,296
(3) Short-term investment securities and investment securities
Available-for-sale securities with fixed maturities
Other 60,010 — — — 60,010
Total ¥ 144,132 ¥ — ¥ — ¥ — ¥ 144,132
March 31, 2017:
(1) Cash and deposits ¥ 25,542 ¥ — ¥ — ¥ — ¥ 25,542
(2) Notes and accounts receivable—trade 91,341 — — — 91,341
(3) Short-term investment securities and investment securities
Available-for-sale securities with fixed maturities
Other 42,000 — — — 42,000
Total ¥ 158,883 ¥ — ¥ — ¥ — ¥ 158,883
18 JSR Corporation Annual Report 2017
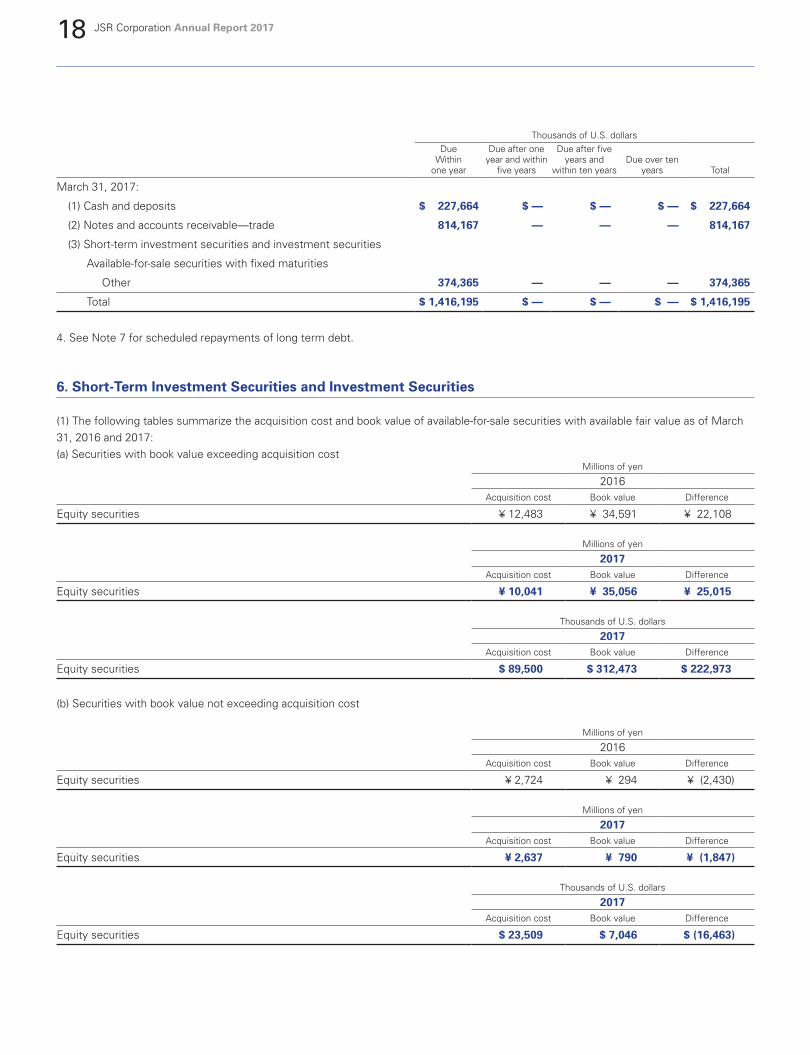
Thousands of U.S. dollarsDue
Withinone year
Due after one year and within
five years
Due after five years and
within ten yearsDue over ten
years Total
March 31, 2017:
(1) Cash and deposits $ 227,664 $ — $ — $ — $ 227,664
(2) Notes and accounts receivable—trade 814,167 — — — 814,167
(3) Short-term investment securities and investment securities
Available-for-sale securities with fixed maturities
Other 374,365 — — — 374,365
Total $ 1,416,195 $ — $ — $ — $ 1,416,195
6. Short-Term Investment Securities and Investment Securities
(1) The following tables summarize the acquisition cost and book value of available-for-sale securities with available fair value as of March 31, 2016 and 2017:(a) Securities with book value exceeding acquisition cost
Millions of yen
2016Acquisition cost Book value Difference
Equity securities ¥ 12,483 ¥ 34,591 ¥ 22,108
Millions of yen
2017Acquisition cost Book value Difference
Equity securities ¥ 10,041 ¥ 35,056 ¥ 25,015
Thousands of U.S. dollars
2017Acquisition cost Book value Difference
Equity securities $ 89,500 $ 312,473 $ 222,973
(b) Securities with book value not exceeding acquisition cost
Millions of yen
2016Acquisition cost Book value Difference
Equity securities ¥ 2,724 ¥ 294 ¥ (2,430)
Millions of yen
2017Acquisition cost Book value Difference
Equity securities ¥ 2,637 ¥ 790 ¥ (1,847)
Thousands of U.S. dollars
2017Acquisition cost Book value Difference
Equity securities $ 23,509 $ 7,046 $ (16,463)
4. See Note 7 for scheduled repayments of long term debt.
19 JSR Corporation Annual Report 2017
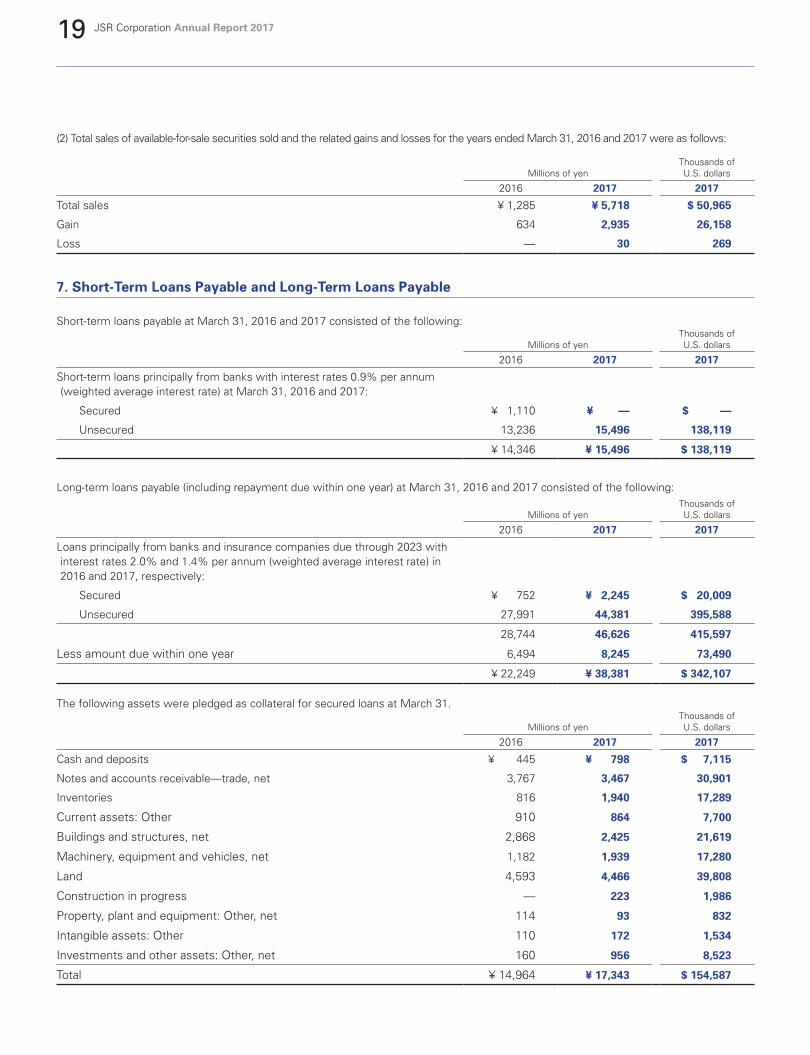
(2) Total sales of available-for-sale securities sold and the related gains and losses for the years ended March 31, 2016 and 2017 were as follows:
Millions of yenThousands ofU.S. dollars
2016 2017 2017
Total sales ¥ 1,285 ¥ 5,718 $ 50,965
Gain 634 2,935 26,158
Loss — 30 269
7. Short-Term Loans Payable and Long-Term Loans Payable
Short-term loans payable at March 31, 2016 and 2017 consisted of the following:
Millions of yenThousands ofU.S. dollars
2016 2017 2017
Short-term loans principally from banks with interest rates 0.9% per annum (weighted average interest rate) at March 31, 2016 and 2017:
Secured ¥ 1,110 ¥ — $ —
Unsecured 13,236 15,496 138,119
¥ 14,346 ¥ 15,496 $ 138,119
Long-term loans payable (including repayment due within one year) at March 31, 2016 and 2017 consisted of the following:
Millions of yenThousands ofU.S. dollars
2016 2017 2017
Loans principally from banks and insurance companies due through 2023 with interest rates 2.0% and 1.4% per annum (weighted average interest rate) in 2016 and 2017, respectively:
Secured ¥ 752 ¥ 2,245 $ 20,009
Unsecured 27,991 44,381 395,588
28,744 46,626 415,597
Less amount due within one year 6,494 8,245 73,490
¥ 22,249 ¥ 38,381 $ 342,107
The following assets were pledged as collateral for secured loans at March 31.
Millions of yenThousands ofU.S. dollars
2016 2017 2017
Cash and deposits ¥ 445 ¥ 798 $ 7,115
Notes and accounts receivable—trade, net 3,767 3,467 30,901
Inventories 816 1,940 17,289
Current assets: Other 910 864 7,700
Buildings and structures, net 2,868 2,425 21,619
Machinery, equipment and vehicles, net 1,182 1,939 17,280
Land 4,593 4,466 39,808
Construction in progress — 223 1,986
Property, plant and equipment: Other, net 114 93 832
Intangible assets: Other 110 172 1,534
Investments and other assets: Other, net 160 956 8,523
Total ¥ 14,964 ¥ 17,343 $ 154,587
20 JSR Corporation Annual Report 2017
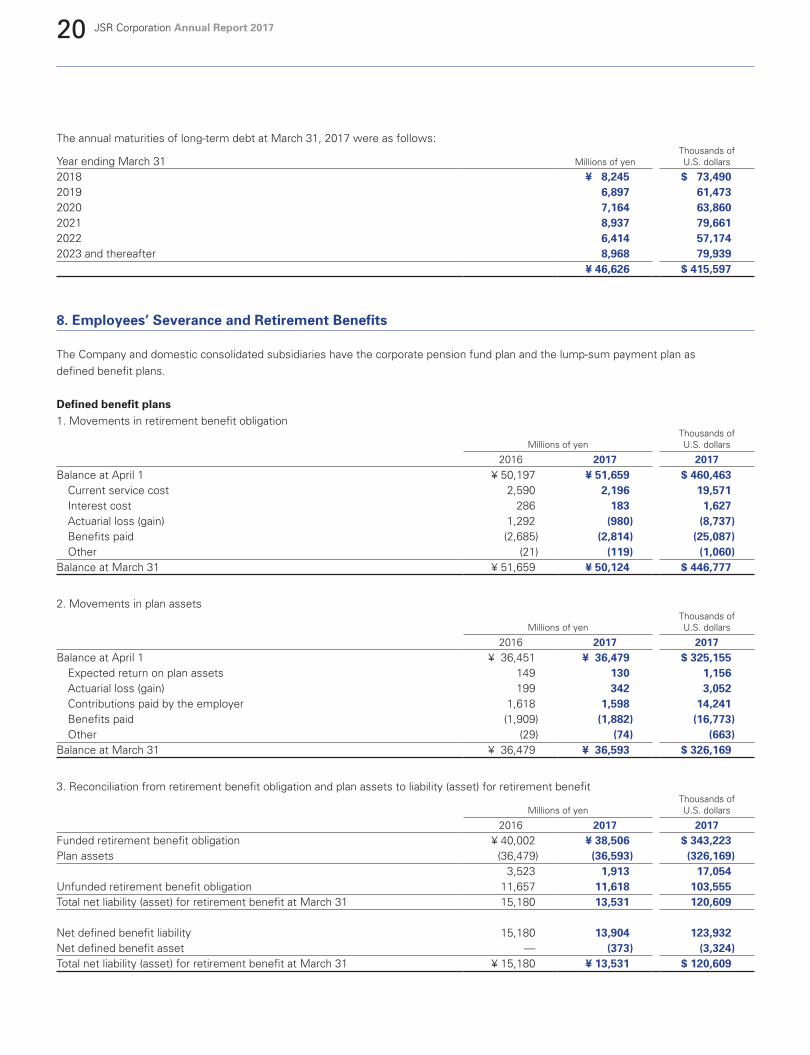
The annual maturities of long-term debt at March 31, 2017 were as follows:
Year ending March 31 Millions of yenThousands ofU.S. dollars
2018 ¥ 8,245 $ 73,4902019 6,897 61,4732020 7,164 63,8602021 8,937 79,6612022 6,414 57,1742023 and thereafter 8,968 79,939
¥ 46,626 $ 415,597
8. Employees’ Severance and Retirement Benefits
The Company and domestic consolidated subsidiaries have the corporate pension fund plan and the lump-sum payment plan asdefined benefit plans.
Defined benefit plans1. Movements in retirement benefit obligation
Millions of yenThousands ofU.S. dollars
2016 2017 2017Balance at April 1 ¥ 50,197 ¥ 51,659 $ 460,463
Current service cost 2,590 2,196 19,571Interest cost 286 183 1,627Actuarial loss (gain) 1,292 (980) (8,737)Benefits paid (2,685) (2,814) (25,087)Other (21) (119) (1,060)
Balance at March 31 ¥ 51,659 ¥ 50,124 $ 446,777
2. Movements in plan assets
Millions of yenThousands ofU.S. dollars
2016 2017 2017Balance at April 1 ¥ 36,451 ¥ 36,479 $ 325,155
Expected return on plan assets 149 130 1,156Actuarial loss (gain) 199 342 3,052Contributions paid by the employer 1,618 1,598 14,241Benefits paid (1,909) (1,882) (16,773)Other (29) (74) (663)
Balance at March 31 ¥ 36,479 ¥ 36,593 $ 326,169
3. Reconciliation from retirement benefit obligation and plan assets to liability (asset) for retirement benefit
Millions of yenThousands ofU.S. dollars
2016 2017 2017Funded retirement benefit obligation ¥ 40,002 ¥ 38,506 $ 343,223Plan assets (36,479) (36,593) (326,169)
3,523 1,913 17,054Unfunded retirement benefit obligation 11,657 11,618 103,555Total net liability (asset) for retirement benefit at March 31 15,180 13,531 120,609
Net defined benefit liability 15,180 13,904 123,932Net defined benefit asset — (373) (3,324)Total net liability (asset) for retirement benefit at March 31 ¥ 15,180 ¥ 13,531 $ 120,609
21 JSR Corporation Annual Report 2017
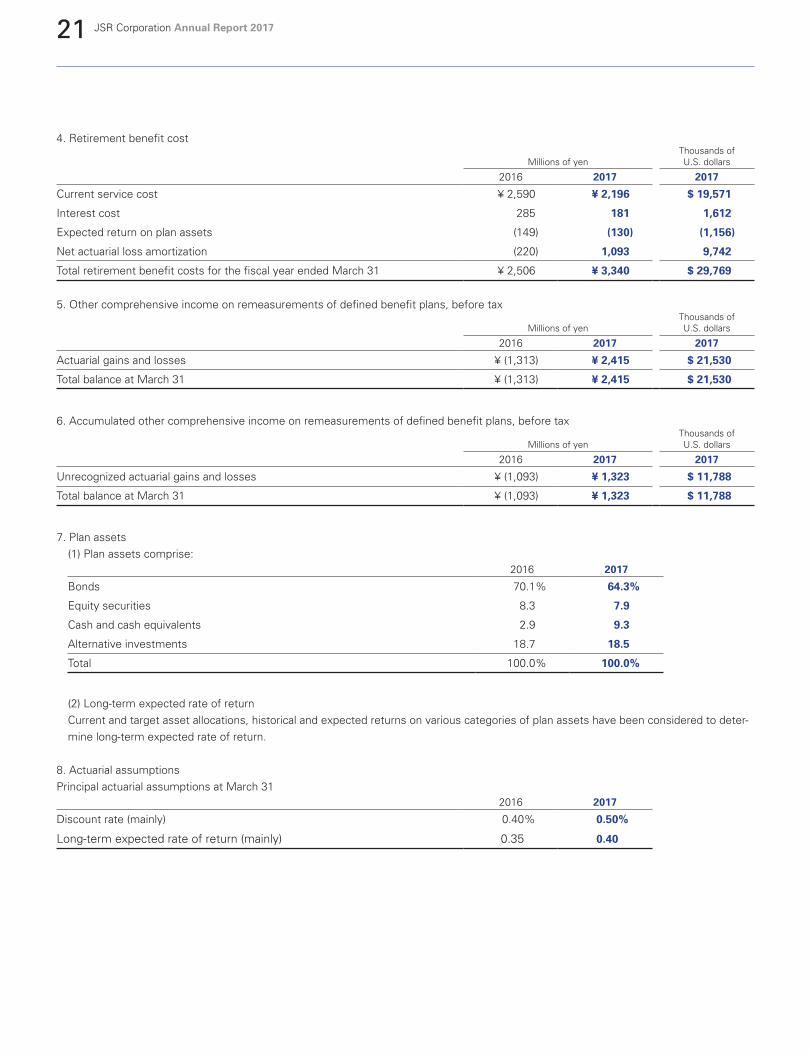
4. Retirement benefit cost
Millions of yenThousands ofU.S. dollars
2016 2017 2017
Current service cost ¥ 2,590 ¥ 2,196 $ 19,571
Interest cost 285 181 1,612
Expected return on plan assets (149) (130) (1,156)
Net actuarial loss amortization (220) 1,093 9,742
Total retirement benefit costs for the fiscal year ended March 31 ¥ 2,506 ¥ 3,340 $ 29,769
5. Other comprehensive income on remeasurements of defined benefit plans, before tax
Millions of yenThousands ofU.S. dollars
2016 2017 2017
Actuarial gains and losses ¥ (1,313) ¥ 2,415 $ 21,530
Total balance at March 31 ¥ (1,313) ¥ 2,415 $ 21,530
6. Accumulated other comprehensive income on remeasurements of defined benefit plans, before tax
Millions of yenThousands ofU.S. dollars
2016 2017 2017
Unrecognized actuarial gains and losses ¥ (1,093) ¥ 1,323 $ 11,788
Total balance at March 31 ¥ (1,093) ¥ 1,323 $ 11,788
7. Plan assets(1) Plan assets comprise:
2016 2017
Bonds 70.1% 64.3%
Equity securities 8.3 7.9
Cash and cash equivalents 2.9 9.3
Alternative investments 18.7 18.5
Total 100.0% 100.0%
(2) Long-term expected rate of returnCurrent and target asset allocations, historical and expected returns on various categories of plan assets have been considered to deter-mine long-term expected rate of return.
8. Actuarial assumptionsPrincipal actuarial assumptions at March 31
2016 2017
Discount rate (mainly) 0.40% 0.50%
Long-term expected rate of return (mainly) 0.35 0.40
22 JSR Corporation Annual Report 2017
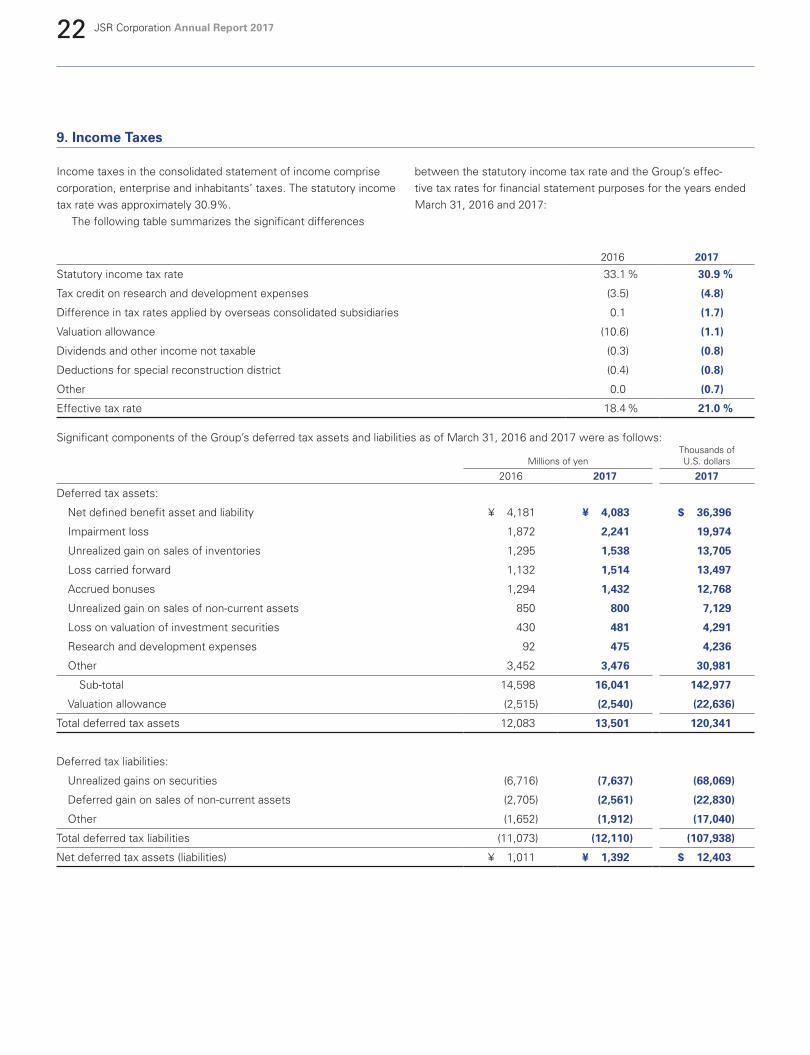
9. Income Taxes
Income taxes in the consolidated statement of income comprise corporation, enterprise and inhabitants’ taxes. The statutory income tax rate was approximately 30.9%. The following table summarizes the significant differences
between the statutory income tax rate and the Group’s effec-tive tax rates for financial statement purposes for the years ended March 31, 2016 and 2017:
2016 2017
Statutory income tax rate 33.1 % 30.9 %
Tax credit on research and development expenses (3.5) (4.8)
Difference in tax rates applied by overseas consolidated subsidiaries 0.1 (1.7)
Valuation allowance (10.6) (1.1)
Dividends and other income not taxable (0.3) (0.8)
Deductions for special reconstruction district (0.4) (0.8)
Other 0.0 (0.7)
Effective tax rate 18.4 % 21.0 %
Significant components of the Group’s deferred tax assets and liabilities as of March 31, 2016 and 2017 were as follows:
Millions of yenThousands ofU.S. dollars
2016 2017 2017
Deferred tax assets:
Net defined benefit asset and liability ¥ 4,181 ¥ 4,083 $ 36,396
Impairment loss 1,872 2,241 19,974
Unrealized gain on sales of inventories 1,295 1,538 13,705
Loss carried forward 1,132 1,514 13,497
Accrued bonuses 1,294 1,432 12,768
Unrealized gain on sales of non-current assets 850 800 7,129
Loss on valuation of investment securities 430 481 4,291
Research and development expenses 92 475 4,236
Other 3,452 3,476 30,981
Sub-total 14,598 16,041 142,977
Valuation allowance (2,515) (2,540) (22,636)
Total deferred tax assets 12,083 13,501 120,341
Deferred tax liabilities:
Unrealized gains on securities (6,716) (7,637) (68,069)
Deferred gain on sales of non-current assets (2,705) (2,561) (22,830)
Other (1,652) (1,912) (17,040)
Total deferred tax liabilities (11,073) (12,110) (107,938)
Net deferred tax assets (liabilities) ¥ 1,011 ¥ 1,392 $ 12,403
23 JSR Corporation Annual Report 2017
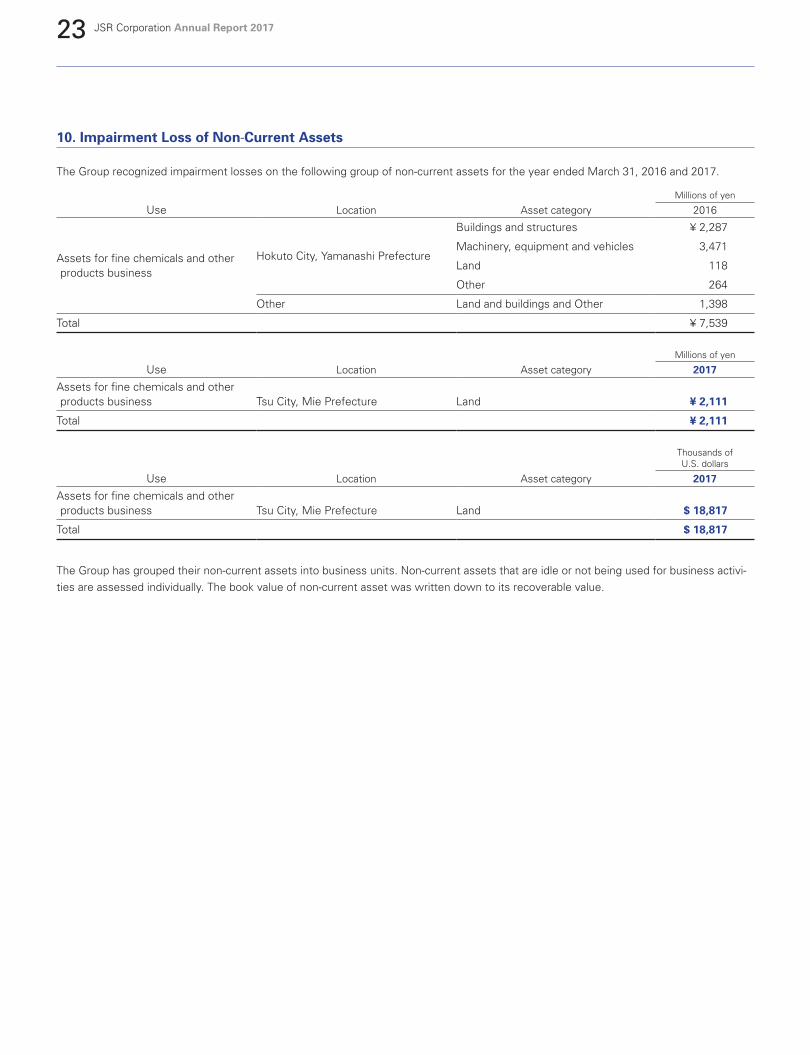
10. Impairment Loss of Non-Current Assets
The Group recognized impairment losses on the following group of non-current assets for the year ended March 31, 2016 and 2017.
Millions of yen
Use Location Asset category 2016
Assets for fine chemicals and other products business
Hokuto City, Yamanashi Prefecture
Buildings and structures ¥ 2,287
Machinery, equipment and vehicles 3,471
Land 118
Other 264
Other Land and buildings and Other 1,398
Total ¥ 7,539
Millions of yen
Use Location Asset category 2017
Assets for fine chemicals and other products business Tsu City, Mie Prefecture Land ¥ 2,111
Total ¥ 2,111
Thousands of U.S. dollars
Use Location Asset category 2017
Assets for fine chemicals and other products business Tsu City, Mie Prefecture Land $ 18,817
Total $ 18,817
The Group has grouped their non-current assets into business units. Non-current assets that are idle or not being used for business activi-ties are assessed individually. The book value of non-current asset was written down to its recoverable value.

24 JSR Corporation Annual Report 2017
11. Comprehensive Income
Amounts reclassified to profit in the current period that were recognized in other comprehensive income in the current or previous periods and tax effects for each component of other comprehensive income were as follows;
Millions of yenThousands ofU.S. dollars
2016 2017 2017
Unrealized gains on securities:Occurrence amount ¥ (6,451) ¥ 5,473 $ 48,787Recycling (581) (2,490) (22,195)Before tax effect (7,032) 2,983 26,592Tax effect 3,042 (925) (8,248)Unrealized gains on securities, net of tax ¥ (3,990) ¥ 2,058 $ 18,344
Foreign currency translation adjustmentsOccurrence amount ¥ (4,320) ¥ (730) $ (6,509)Foreign currency translation adjustments ¥ (4,320) ¥ (730) $ (6,509)
Remeasurements of defined benefit plans:Occurrence amount ¥ (1,093) ¥ 1,323 $ 11,788Recycling (220) 1,093 9,742Before tax effect (1,313) 2,415 21,530Tax effect 406 (740) (6,592)Remeasurements of defined benefit plans, net of tax ¥ (907) ¥ 1,676 $ 14,938
Share of other comprehensive income of associates accounted for using equity method
Occurrence amount ¥ (1,187) ¥ (1,130) $ (10,069)Share of other comprehensive income of associates accounted for using equity method ¥ (1,187) ¥ (1,130) $ (10,069)
Total other comprehensive income before tax ¥ (13,852) ¥ 3,539 $ 31,544Tax effect ¥ 3,448 ¥ (1,665) $ (14,840)Other comprehensive income, net of tax ¥ (10,404) ¥ 1,874 $ 16,704
12. Net Assets
Under the Japanese laws and regulations, the entire amount paid for new shares is required to be designated as common stock. However, a company may, by a resolution of the Board of Directors, designate an amount not exceeding one-half of the price of the new shares as additional paid-in capital, which is included in capital surplus. Under the Japanese Corporate Law (hereinafter called “the Law”), in the case where a dividend distribution of surplus is made, the smaller of an amount equal to 10% of the dividends or the excess, if any, of 25% of common stock over the total of addi-tional paid-in capital and legal earnings reserve must be set aside as additional paid-in capital or legal earnings reserve. Legal earn-ings reserve is included in retained earnings in the consolidated
balance sheet. Additional paid-in capital and all legal earnings reserve may be transferred to other capital surplus and retained earnings, respec-tively, which are potentially available for dividends. The maximum amount that the Company can distribute as dividends is calcu-lated based on the non-consolidated financial statements of the Company in accordance with the Japanese laws and regulations. At the annual shareholders meeting held on June 16, 2017, the shareholders resolved cash dividends amounting to ¥5,562 million ($49,584 thousand). Such appropriations have not been accrued in the consolidated financial statements as of March 31, 2017. Such appropriations are recognized in the period in which they are resolved.
25 JSR Corporation Annual Report 2017
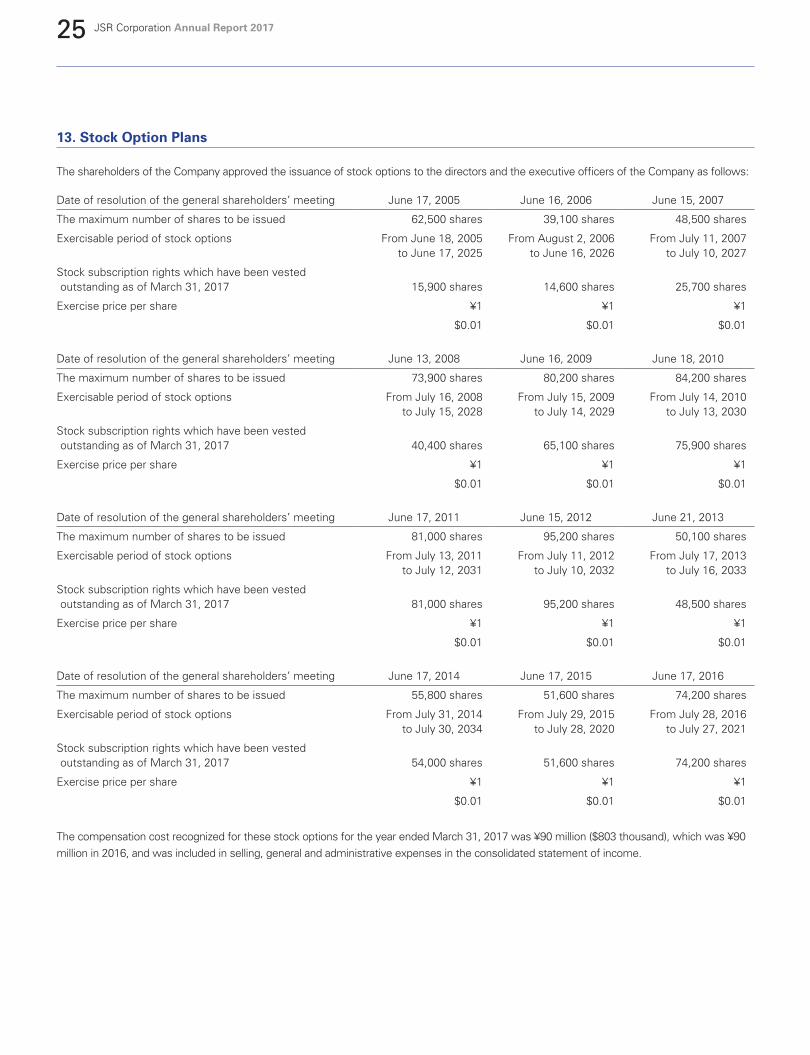
13. Stock Option Plans
The shareholders of the Company approved the issuance of stock options to the directors and the executive officers of the Company as follows:
Date of resolution of the general shareholders’ meeting June 17, 2005 June 16, 2006 June 15, 2007
The maximum number of shares to be issued 62,500 shares 39,100 shares 48,500 shares
Exercisable period of stock options From June 18, 2005to June 17, 2025
From August 2, 2006to June 16, 2026
From July 11, 2007to July 10, 2027
Stock subscription rights which have been vested outstanding as of March 31, 2017 15,900 shares 14,600 shares 25,700 shares
Exercise price per share ¥1 ¥1 ¥1
$0.01 $0.01 $0.01
Date of resolution of the general shareholders’ meeting June 13, 2008 June 16, 2009 June 18, 2010
The maximum number of shares to be issued 73,900 shares 80,200 shares 84,200 shares
Exercisable period of stock options From July 16, 2008to July 15, 2028
From July 15, 2009to July 14, 2029
From July 14, 2010to July 13, 2030
Stock subscription rights which have been vested outstanding as of March 31, 2017 40,400 shares 65,100 shares 75,900 shares
Exercise price per share ¥1 ¥1 ¥1
$0.01 $0.01 $0.01
Date of resolution of the general shareholders’ meeting June 17, 2011 June 15, 2012 June 21, 2013
The maximum number of shares to be issued 81,000 shares 95,200 shares 50,100 shares
Exercisable period of stock options From July 13, 2011to July 12, 2031
From July 11, 2012to July 10, 2032
From July 17, 2013to July 16, 2033
Stock subscription rights which have been vested outstanding as of March 31, 2017 81,000 shares 95,200 shares 48,500 shares
Exercise price per share ¥1 ¥1 ¥1
$0.01 $0.01 $0.01
Date of resolution of the general shareholders’ meeting June 17, 2014 June 17, 2015 June 17, 2016
The maximum number of shares to be issued 55,800 shares 51,600 shares 74,200 shares
Exercisable period of stock options From July 31, 2014to July 30, 2034
From July 29, 2015to July 28, 2020
From July 28, 2016to July 27, 2021
Stock subscription rights which have been vested outstanding as of March 31, 2017 54,000 shares 51,600 shares 74,200 shares
Exercise price per share ¥1 ¥1 ¥1
$0.01 $0.01 $0.01
The compensation cost recognized for these stock options for the year ended March 31, 2017 was ¥90 million ($803 thousand), which was ¥90 million in 2016, and was included in selling, general and administrative expenses in the consolidated statement of income.
26 JSR Corporation Annual Report 2017
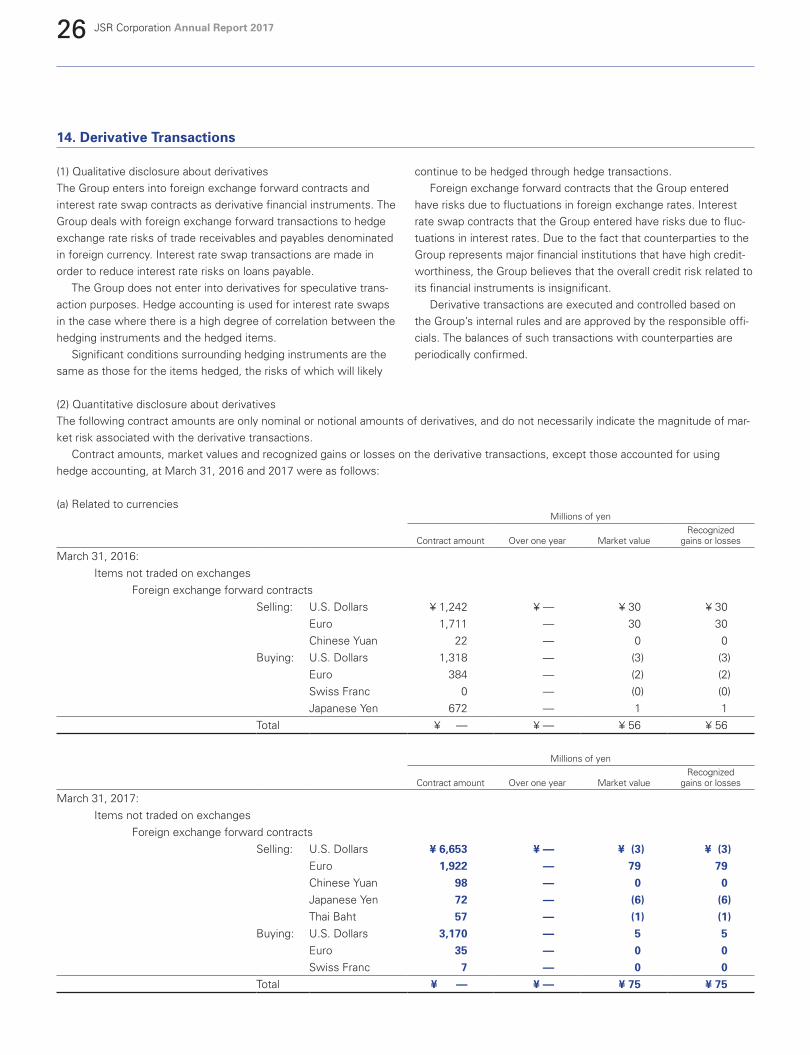
14. Derivative Transactions
(1) Qualitative disclosure about derivativesThe Group enters into foreign exchange forward contracts and interest rate swap contracts as derivative financial instruments. The Group deals with foreign exchange forward transactions to hedge exchange rate risks of trade receivables and payables denominated in foreign currency. Interest rate swap transactions are made in order to reduce interest rate risks on loans payable. The Group does not enter into derivatives for speculative trans-action purposes. Hedge accounting is used for interest rate swaps in the case where there is a high degree of correlation between the hedging instruments and the hedged items. Significant conditions surrounding hedging instruments are the same as those for the items hedged, the risks of which will likely
continue to be hedged through hedge transactions. Foreign exchange forward contracts that the Group entered have risks due to fluctuations in foreign exchange rates. Interest rate swap contracts that the Group entered have risks due to fluc-tuations in interest rates. Due to the fact that counterparties to the Group represents major financial institutions that have high credit-worthiness, the Group believes that the overall credit risk related to its financial instruments is insignificant. Derivative transactions are executed and controlled based on the Group’s internal rules and are approved by the responsible offi-cials. The balances of such transactions with counterparties are periodically confirmed.
(2) Quantitative disclosure about derivativesThe following contract amounts are only nominal or notional amounts of derivatives, and do not necessarily indicate the magnitude of mar-ket risk associated with the derivative transactions. Contract amounts, market values and recognized gains or losses on the derivative transactions, except those accounted for using hedge accounting, at March 31, 2016 and 2017 were as follows:
(a) Related to currenciesMillions of yen
Contract amount Over one year Market valueRecognized
gains or losses
March 31, 2016:Items not traded on exchanges
Foreign exchange forward contractsSelling: U.S. Dollars ¥ 1,242 ¥ — ¥ 30 ¥ 30
Euro 1,711 — 30 30Chinese Yuan 22 — 0 0
Buying: U.S. Dollars 1,318 — (3) (3)Euro 384 — (2) (2)Swiss Franc 0 — (0) (0)Japanese Yen 672 — 1 1
Total ¥ — ¥ — ¥ 56 ¥ 56
Millions of yen
Contract amount Over one year Market valueRecognized
gains or losses
March 31, 2017:Items not traded on exchanges
Foreign exchange forward contractsSelling: U.S. Dollars ¥ 6,653 ¥ — ¥ (3) ¥ (3)
Euro 1,922 — 79 79Chinese Yuan 98 — 0 0Japanese Yen 72 — (6) (6)Thai Baht 57 — (1) (1)
Buying: U.S. Dollars 3,170 — 5 5Euro 35 — 0 0Swiss Franc 7 — 0 0
Total ¥ — ¥ — ¥ 75 ¥ 75
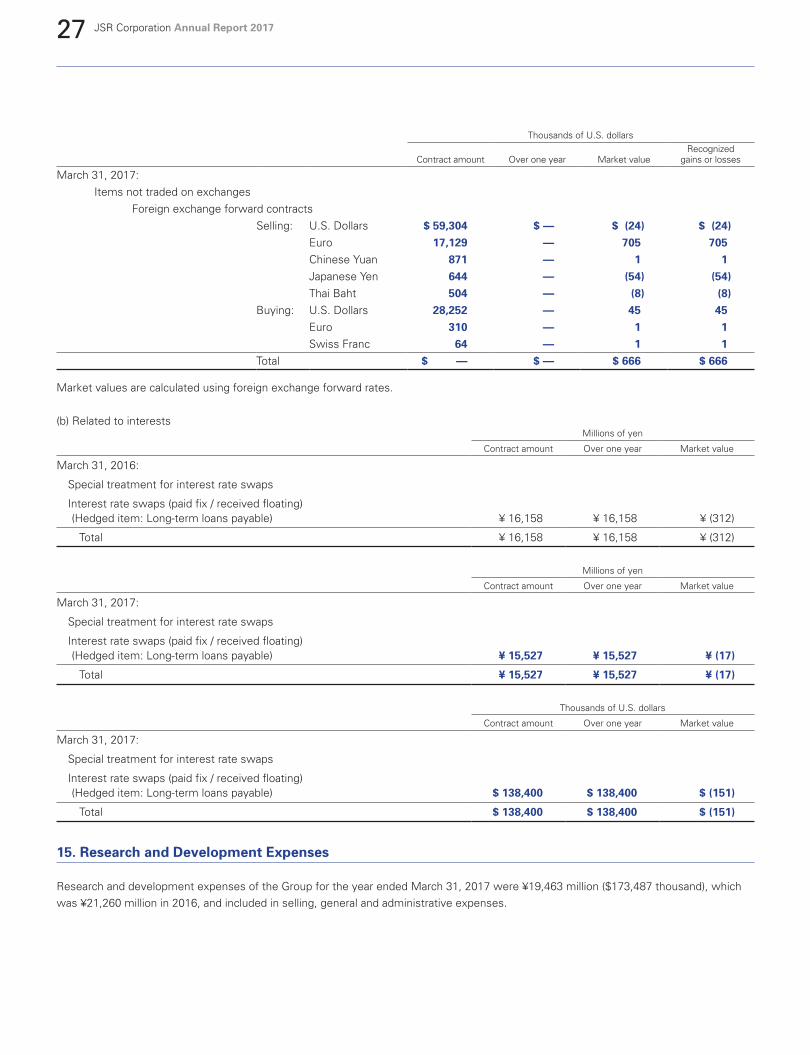
27 JSR Corporation Annual Report 2017
Thousands of U.S. dollars
Contract amount Over one year Market valueRecognized
gains or losses
March 31, 2017:Items not traded on exchanges
Foreign exchange forward contractsSelling: U.S. Dollars $ 59,304 $ — $ (24) $ (24)
Euro 17,129 — 705 705Chinese Yuan 871 — 1 1Japanese Yen 644 — (54) (54)Thai Baht 504 — (8) (8)
Buying: U.S. Dollars 28,252 — 45 45Euro 310 — 1 1Swiss Franc 64 — 1 1
Total $ — $ — $ 666 $ 666
Market values are calculated using foreign exchange forward rates.
(b) Related to interestsMillions of yen
Contract amount Over one year Market value
March 31, 2016:
Special treatment for interest rate swaps
Interest rate swaps (paid fix / received floating)(Hedged item: Long-term loans payable) ¥ 16,158 ¥ 16,158 ¥ (312)
Total ¥ 16,158 ¥ 16,158 ¥ (312)
Millions of yen
Contract amount Over one year Market value
March 31, 2017:
Special treatment for interest rate swaps
Interest rate swaps (paid fix / received floating)(Hedged item: Long-term loans payable) ¥ 15,527 ¥ 15,527 ¥ (17)
Total ¥ 15,527 ¥ 15,527 ¥ (17)
Thousands of U.S. dollars
Contract amount Over one year Market value
March 31, 2017:
Special treatment for interest rate swaps
Interest rate swaps (paid fix / received floating)(Hedged item: Long-term loans payable) $ 138,400 $ 138,400 $ (151)
Total $ 138,400 $ 138,400 $ (151)
15. Research and Development Expenses
Research and development expenses of the Group for the year ended March 31, 2017 were ¥19,463 million ($173,487 thousand), which was ¥21,260 million in 2016, and included in selling, general and administrative expenses.

28 JSR Corporation Annual Report 2017
16. Segment Information
The Group’s business segments are classified into the following three business segments: (1) Elastomers business, (2) Plastics business, and (3) Fine chemicals and other products business. The summary of net sales, costs and expenses, operating profit, identifiable assets, depreciation, impairment loss and capital expendi-tures by segment of business activities for the years ended March 31, 2016 and 2017 were as follows:
Millions of yen
Elastomers PlasticsFine chemicals and
other products Total Reconciliation Consolidated
For 2016:
Sales to external customers ¥ 179,253 ¥ 52,207 ¥ 155,250 ¥ 386,709 ¥ — ¥ 386,709
Inter-segment sales/transfers 3,734 — — 3,734 (3,734) —
Sales total 182,987 52,207 155,250 390,443 (3,734) 386,709
Operating profit ¥ 7,492 ¥ 5,114 ¥ 21,803 ¥ 34,408 ¥ — ¥ 34,408
Identifiable assets ¥ 221,029 ¥ 32,842 ¥ 156,413 ¥ 410,284 ¥ 106,076 ¥ 516,360
Depreciation and amortization 7,662 1,051 9,795 18,508 — 18,508
Impairment loss — — 7,539 7,539 — 7,539
Capital expenditures 15,278 837 8,161 24,276 — 24,276
Amortization of goodwill — 45 401 446 — 446
Goodwill — 585 9,204 9,788 — 9,788
Millions of yen
Elastomers PlasticsFine chemicals and
other products Total Reconciliation Consolidated
For 2017:
Sales to external customers ¥ 185,345 ¥ 46,035 ¥ 159,218 ¥ 390,599 ¥ — ¥ 390,599
Inter-segment sales/transfers 3,786 — — 3,786 (3,786) —
Sales total 189,131 46,035 159,218 394,384 (3,786) 390,599
Operating profit ¥ 8,340 ¥ 3,773 ¥ 20,257 ¥ 32,370 ¥ — ¥ 32,370
Identifiable assets ¥ 265,434 ¥ 33,644 ¥ 166,741 ¥ 465,819 ¥ 110,198 ¥ 576,016
Depreciation and amortization 6,401 669 7,606 14,676 — 14,676
Impairment loss — — 2,111 2,111 — 2,111
Capital expenditures 20,709 1,189 9,887 31,785 — 31,785
Amortization of goodwill — 45 520 565 — 565
Goodwill — 540 8,278 8,817 — 8,817
Thousands of U.S. dollars
Elastomers PlasticsFine chemicals and
other products Total Reconciliation Consolidated
For 2017:
Sales to external customers $ 1,652,066 $ 410,330 $ 1,419,185 $ 3,481,580 $ — $ 3,481,580
Inter-segment sales/transfers 33,742 — — 33,742 (33,742) —
Sales total 1,685,808 410,330 1,419,185 3,515,322 (33,742) 3,481,580
Operating profit $ 74,338 $ 33,628 $ 180,564 $ 288,530 $ — $ 288,530
Identifiable assets $ 2,365,930 $ 299,881 $ 1,486,240 $ 4,152,050 $ 982,244 $ 5,134,294
Depreciation and amortization 57,054 5,961 67,795 130,811 — 130,811
Impairment loss — — 18,817 18,817 — 18,817
Capital expenditures 184,590 10,600 88,125 283,315 — 283,315
Amortization of goodwill — 401 4,633 5,034 — 5,034
Goodwill — 4,810 73,782 78,591 — 78,591
Assets in reconciliation are related mainly to Cash, Short-term investment securities and Investment securities of the Company.
29 JSR Corporation Annual Report 2017
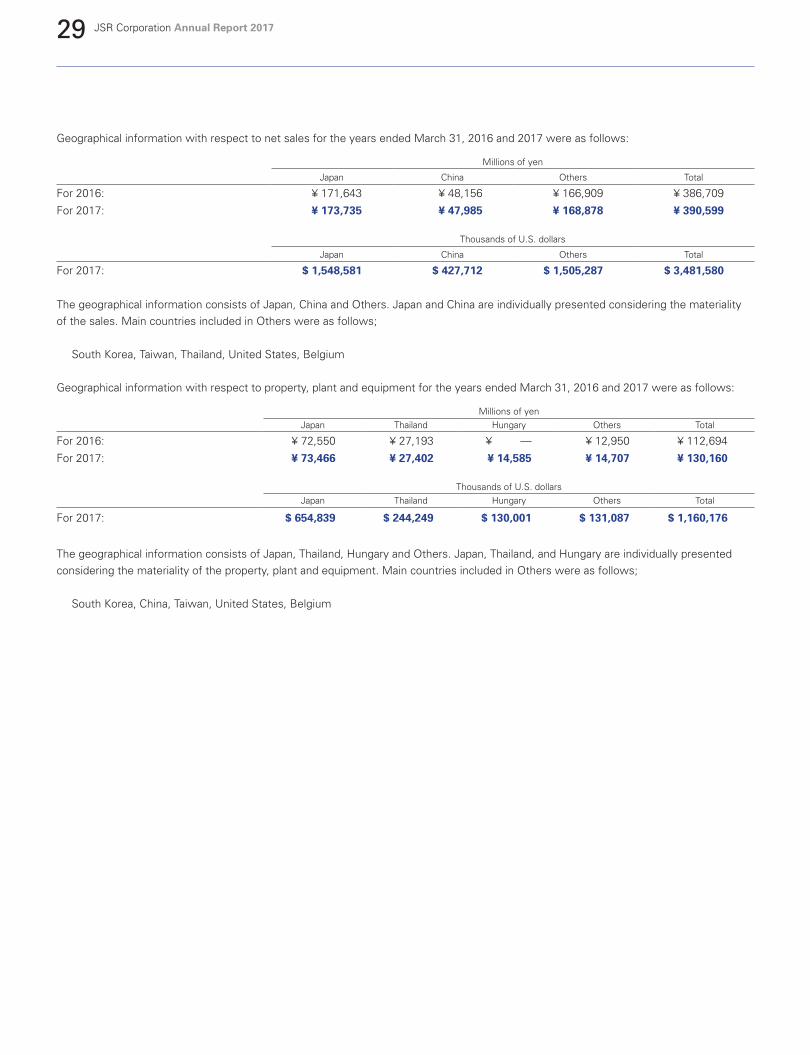
Geographical information with respect to net sales for the years ended March 31, 2016 and 2017 were as follows:
Millions of yen
Japan China Others Total
For 2016: ¥ 171,643 ¥ 48,156 ¥ 166,909 ¥ 386,709
For 2017: ¥ 173,735 ¥ 47,985 ¥ 168,878 ¥ 390,599
Thousands of U.S. dollars
Japan China Others Total
For 2017: $ 1,548,581 $ 427,712 $ 1,505,287 $ 3,481,580
The geographical information consists of Japan, China and Others. Japan and China are individually presented considering the materiality of the sales. Main countries included in Others were as follows;
South Korea, Taiwan, Thailand, United States, Belgium
Geographical information with respect to property, plant and equipment for the years ended March 31, 2016 and 2017 were as follows:
Millions of yenJapan Thailand Hungary Others Total
For 2016: ¥ 72,550 ¥ 27,193 ¥ — ¥ 12,950 ¥ 112,694
For 2017: ¥ 73,466 ¥ 27,402 ¥ 14,585 ¥ 14,707 ¥ 130,160
Thousands of U.S. dollarsJapan Thailand Hungary Others Total
For 2017: $ 654,839 $ 244,249 $ 130,001 $ 131,087 $ 1,160,176
The geographical information consists of Japan, Thailand, Hungary and Others. Japan, Thailand, and Hungary are individually presented considering the materiality of the property, plant and equipment. Main countries included in Others were as follows;
South Korea, China, Taiwan, United States, Belgium
30 JSR Corporation Annual Report 2017
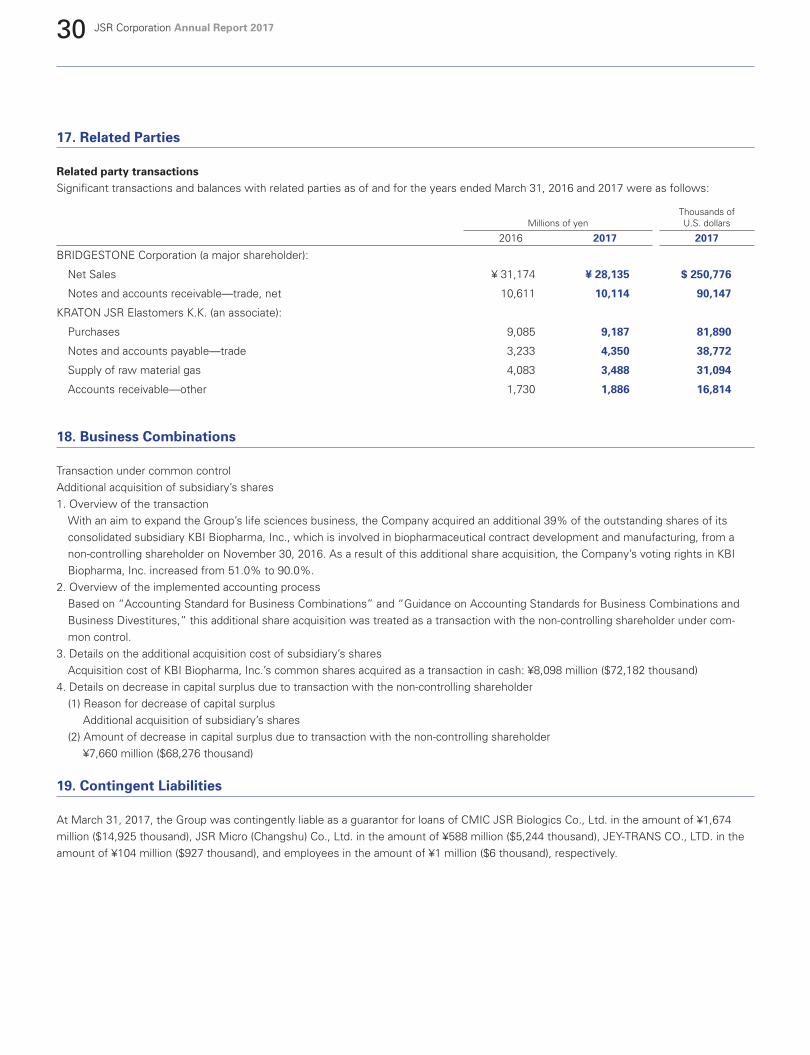
17. Related Parties
Related party transactionsSignificant transactions and balances with related parties as of and for the years ended March 31, 2016 and 2017 were as follows:
Millions of yenThousands ofU.S. dollars
2016 2017 2017
BRIDGESTONE Corporation (a major shareholder):
Net Sales ¥ 31,174 ¥ 28,135 $ 250,776
Notes and accounts receivable—trade, net 10,611 10,114 90,147
KRATON JSR Elastomers K.K. (an associate):
Purchases 9,085 9,187 81,890
Notes and accounts payable—trade 3,233 4,350 38,772
Supply of raw material gas 4,083 3,488 31,094
Accounts receivable—other 1,730 1,886 16,814
18. Business Combinations
Transaction under common controlAdditional acquisition of subsidiary’s shares1. Overview of the transaction
With an aim to expand the Group’s life sciences business, the Company acquired an additional 39% of the outstanding shares of its consolidated subsidiary KBI Biopharma, Inc., which is involved in biopharmaceutical contract development and manufacturing, from a non-controlling shareholder on November 30, 2016. As a result of this additional share acquisition, the Company’s voting rights in KBI Biopharma, Inc. increased from 51.0% to 90.0%.
2. Overview of the implemented accounting processBased on “Accounting Standard for Business Combinations” and “Guidance on Accounting Standards for Business Combinations and Business Divestitures,” this additional share acquisition was treated as a transaction with the non-controlling shareholder under com-mon control.
3. Details on the additional acquisition cost of subsidiary’s sharesAcquisition cost of KBI Biopharma, Inc.’s common shares acquired as a transaction in cash: ¥8,098 million ($72,182 thousand)
4. Details on decrease in capital surplus due to transaction with the non-controlling shareholder(1) Reason for decrease of capital surplus
Additional acquisition of subsidiary’s shares(2) Amount of decrease in capital surplus due to transaction with the non-controlling shareholder
¥7,660 million ($68,276 thousand)
19. Contingent Liabilities
At March 31, 2017, the Group was contingently liable as a guarantor for loans of CMIC JSR Biologics Co., Ltd. in the amount of ¥1,674 million ($14,925 thousand), JSR Micro (Changshu) Co., Ltd. in the amount of ¥588 million ($5,244 thousand), JEY-TRANS CO., LTD. in the amount of ¥104 million ($927 thousand), and employees in the amount of ¥1 million ($6 thousand), respectively.
31 JSR Corporation Annual Report 2017