Embed Size (px)
Citation preview

Financial Data
Consolidated FinanCial statements
1. Consolidated Balance Sheets 96
2. Consolidated Statements of Income and Consolidated Statements of Comprehensive Income (Loss) 98
3. Consolidated Statements of Changes in Net Assets 101
4. Consolidated Statements of Cash Flows 105
5. Notes to the Consolidated Financial Statements 107
nonConsolidated FinanCial statements
6. Nonconsolidated Balance Sheets 130
7. Nonconsolidated Statements of Income 132
8. Nonconsolidated Statements of Changes in Net Assets 134
9. Nonconsolidated Proposed Appropriations of Surplus 138
10. Notes to the Nonconsolidated Financial Statements 139
✳ All figures are rounded down to the nearest unit.
Independent Auditor’s Report 155
Chapter 5
Financial Data
95

CONSOLIDateD FINaNCIaL StateMeNtS1. Consolidated Balance sheetsNippon Life Insurance Company and its Consolidated Subsidiaries
Millions of YenMillions of U.S. Dollars
As of March 31 2014 2013 2012 2014
ASSETS:
Cash and deposits (Notes 3 and 4) ¥ 497,125 ¥ 551,338 ¥ 479,071 $ 4,830
Call loans (Note 3) 349,400 203,900 212,300 3,394
Receivables under securities borrowing transactions 159,856 150,709 211,928 1,553
Monetary receivables purchased (Notes 3 and 4) 570,632 756,320 883,070 5,544
Investments in securities (Notes 3, 4, 6, 14 and 15) 44,411,714 42,317,119 37,465,182 431,516
Loans (Notes 4, 16 and 17) 8,488,309 8,519,927 8,639,833 82,474
Tangible fixed assets (Notes 5, 7, 14 and 19): 1,728,486 1,685,475 1,770,412 16,794
Land 1,185,348 1,144,483 1,199,239 11,517
Buildings 474,732 485,268 523,635 4,612
Lease assets 2,566 3,037 3,353 24
Construction in progress 42,930 31,132 13,500 417
Other tangible fixed assets 22,907 21,553 30,683 222
Intangible fixed assets: 176,733 182,541 196,386 1,717
Software 84,169 90,319 105,885 817
Lease assets 17 18 0 0
Other intangible fixed assets 92,546 92,203 90,500 899
Reinsurance receivables 503 377 485 4
Other assets 686,945 779,670 822,252 6,674
Deferred tax assets (Note 20) 4,619 5,495 476,521 44
Customers’ liability for acceptances and guarantees 25,299 24,452 27,037 245
Allowance for doubtful accounts (9,386) (11,718) (17,569) (91)
Total assets ¥57,090,238 ¥55,165,611 ¥51,166,914 $554,704
The accompanying notes are an integral part of the consolidated financial statements.
9796

Millions of YenMillions of U.S. Dollars
As of March 31 2014 2013 2012 2014
LIABILITIES:
Policy reserves and other reserves:
Reserve for outstanding claims ¥ 204,408 ¥ 207,375 ¥ 208,643 $ 1,986
Policy reserves 47,517,202 46,162,817 44,449,394 461,690
Reserve for dividends to policyholders (Note 9) 1,070,852 1,105,093 1,120,336 10,404
Subtotal 48,792,463 47,475,286 45,778,374 474,081
Reinsurance payables 377 308 360 3
Corporate bonds (Notes 4 and 10) 157,040 157,040 — 1,525
Other liabilities 1,832,055 2,376,234 1,960,751 17,800
Accrued bonuses for directors and audit and supervisory board members 50 52 53 0
Accrued retirement benefits (Note 11) — 435,879 439,850 —
Net defined benefit liability (Note 11) 359,438 — — 3,492
Accrued retirement benefits for directors and audit and supervisory board members 4,508 4,472 4,681 43
Reserve for program points 12,609 9,564 7,238 122
Accrued losses from supporting closely related companies — — 397 —
Reserve for loss on disaster — — 739 —
Reserve for price fluctuations in investments in securities 623,312 427,529 333,710 6,056
Deferred tax liabilities (Note 20) 340,794 124,185 50 3,311
Deferred tax liabilities for land revaluation 128,236 129,132 142,498 1,245
Acceptances and guarantees 25,299 24,452 27,037 245
Total liabilities 52,276,186 51,164,139 48,695,744 507,930
NET ASSETS:
Foundation funds (Note 13) 250,000 300,000 300,000 2,429
Reserve for redemption of foundation funds (Note 13) 1,000,000 950,000 900,000 9,716
Reserve for revaluation 651 651 651 6
Consolidated surplus 477,329 424,922 379,311 4,637
Total foundation funds and others 1,727,980 1,675,573 1,579,962 16,789
Net unrealized gains on available-for-sale securities, net of tax 3,261,140 2,509,186 1,022,171 31,686
Deferred losses on derivatives under hedge accounting, net of tax (134,156) (74,128) (6,969) (1,303)
Land revaluation differences (85,561) (84,481) (67,515) (831)
Foreign currency translation adjustments 10,162 (37,957) (68,619) 98
Remeasurement of defined benefit plans (Note 11) 20,085 — — 195
Total accumulated other comprehensive income 3,071,671 2,312,619 879,066 29,845
Minority interests 14,399 13,278 12,141 139
Total net assets 4,814,051 4,001,471 2,471,169 46,774
Total liabilities and net assets ¥57,090,238 ¥55,165,611 ¥51,166,914 $554,704
The accompanying notes are an integral part of the consolidated financial statements.
Cover FeatureBusiness Perform
anceM
anagement of N
ippon Life Nippon Life’s Products and Services
Company Inform
ationFinancial Data
Operational Data
9796

2. Consolidated statements of income and Consolidated statements of Comprehensive income [Consolidated statements of income]
Nippon Life Insurance Company and its Consolidated Subsidiaries
Millions of YenMillions of U.S. Dollars
For the years ended March 31 2014 2013 2012 2014
ORDINARY INCOME:
Revenues from insurance and reinsurance ¥4,860,167 ¥5,366,675 ¥5,388,618 $47,222
Investment income:
Interest, dividends, and other income 1,298,823 1,221,619 1,203,934 12,619
Gain from assets held in trust, net 5 13 16 0
Gain on sales of securities 260,538 192,733 233,980 2,531
Gain on redemptions of securities 350 285 239 3
Foreign exchange gains, net 1,703 1,197 — 16
Reversal of allowance for doubtful accounts 2,620 5,388 5,083 25
Other investment income 638 9,052 3,422 6
Gain from separate accounts, net 122,626 144,611 18,640 1,191
Subtotal 1,687,307 1,574,902 1,465,316 16,394
Other ordinary income 281,760 259,759 313,987 2,737
Total ordinary income 6,829,236 7,201,337 7,167,921 66,354
ORDINARY EXPENSES:
Benefits and other payments:
Death and other claims 1,017,022 1,059,942 1,167,552 9,881
Annuity payments 857,662 686,205 649,373 8,333
Health and other benefits 797,618 845,503 819,003 7,749
Surrender benefits 839,852 834,495 1,011,204 8,160
Other refunds 292,927 207,332 252,933 2,846
Reinsurance premiums 1,487 1,432 1,506 14
Subtotal 3,806,572 3,634,912 3,901,575 36,985
Provision for policy reserves:
Provision for policy reserves 1,354,708 1,714,340 1,341,572 13,162
Provision for interest on reserve for dividends to policyholders (Note 9) 24,715 25,830 27,087 240
Subtotal 1,379,423 1,740,170 1,368,660 13,402
Investment expenses:
Interest expenses 8,138 5,130 3,190 79
Loss on sales of securities 57,804 73,090 154,165 561
Loss on valuation of securities 22,285 98,931 29,397 216
Loss on redemptions of securities 24,635 30,530 16,352 239
Loss on derivative financial instruments, net 39,218 178,477 159,834 381
Foreign exchange losses, net — — 6,292 —
Write-offs of loans 42 395 144 0
Depreciation of rental real estate and other assets 14,993 24,588 25,211 145
Other investment expenses 22,136 23,369 23,350 215
Subtotal 189,255 434,514 417,939 1,838
Operating expenses (Note 18) 583,082 584,854 590,197 5,665
Other ordinary expenses 347,662 404,651 401,707 3,377
Total ordinary expenses 6,305,995 6,799,103 6,680,080 61,270
Ordinary profit ¥ 523,240 ¥ 402,234 ¥ 487,841 $ 5,083
9998

Millions of YenMillions of U.S. Dollars
For the years ended March 31 2014 2013 2012 2014
Extraordinary gains:
Gain on disposals of fixed assets ¥ 2,926 ¥ 58,790 ¥ 72 $ 28
Reversal of reserve for price fluctuations in investments in securities — — 13,293 —
Reversal of reserve for loss on disaster — 326 335 —
Other extraordinary gains (Note 21) — 388 92 —
Subtotal 2,926 59,505 13,793 28
Extraordinary losses:
Loss on disposals of fixed assets 6,302 31,145 7,055 61
Impairment losses (Note 19) 4,728 17,602 13,903 45
Provision for reserve for price fluctuations in investments in securities 195,783 93,819 — 1,902
Loss on reduction entry of real estate 96 2,531 57 0
Contributions for assisting social public welfare 1,477 1,477 1,477 14
Loss on liquidation of subsidiaries and affiliates 2,726 — — 26
Subtotal 211,114 146,575 22,493 2,051
Surplus before income taxes and minority interests 315,051 315,164 479,141 3,061
Income taxes (Notes 12 and 20):
Current 144,657 91,617 32,521 1,405
Deferred (77,778) (25,471) 220,896 (755)
Total income taxes 66,878 66,146 253,417 649
Surplus before minority interests 248,173 249,018 225,723 2,411
Minority interests 1,020 1,080 819 9
Net surplus ¥ 247,152 ¥ 247,937 ¥ 224,903 $ 2,401
The accompanying notes are an integral part of the consolidated financial statements.
Cover FeatureBusiness Perform
anceM
anagement of N
ippon Life Nippon Life’s Products and Services
Company Inform
ationFinancial Data
Operational Data
9998

[Consolidated statements of Comprehensive income]Nippon Life Insurance Company and its Consolidated Subsidiaries
Millions of YenMillions of U.S. Dollars
For the years ended March 31 2014 2013 2012 2014
Surplus before minority interests ¥248,173 ¥ 249,018 ¥225,723 $2,411
Other comprehensive income (Note 22): 736,864 1,452,577 287,002 7,159
Net unrealized gains on available-for-sale securities, net of tax 748,792 1,487,069 276,778 7,275
Deferred losses on derivatives under hedge accounting, net of tax (60,027) (67,159) (13,802) (583)
Land revaluation differences — 1,952 25,450 —
Foreign currency translation adjustments 46,137 26,151 (2,671) 448
Share of other comprehensive income of associates accounted for under the equity method 1,961 4,563 1,246 19
Comprehensive income: 985,038 1,701,595 512,725 9,570
Comprehensive income attributable to the Parent Company 983,864 1,700,407 511,938 9,559
Comprehensive income attributable to minority interests ¥ 1,173 ¥ 1,188 ¥ 787 $ 11
The accompanying notes are an integral part of the consolidated financial statements.
101100

Millions of Yen
Foundation funds and others
For the year ended March 31, 2012Foundation funds
(Note 13)
Reserve for redemption of
foundation funds (Note 13)
Reserve for revaluation
Consolidated surplus
Total foundation funds and others
Beginning balance ¥250,000 ¥850,000 ¥651 ¥ 380,448 ¥1,481,099
Increase/decrease:
Issuance of foundation funds 100,000 100,000
Additions to reserve for dividends to policyholders (Note 9) (175,513) (175,513)
Additions to reserve for redemption of foundation funds 50,000 (50,000) —
Interest on foundation funds (3,508) (3,508)
Net surplus 224,903 224,903
Redemption of foundation funds (50,000) (50,000)
Reversal of land revaluation differences 2,981 2,981
Net change, excluding foundation funds and others
Net change 50,000 50,000 — (1,137) 98,862
Ending balance ¥300,000 ¥900,000 ¥651 ¥ 379,311 ¥1,579,962
Millions of Yen
Accumulated other comprehensive income
Minority interests
Total net assetsFor the year ended March 31, 2012
Net unrealized gains on available-for-sale securities, net of tax
Deferred losses on derivatives under
hedge accounting, net of tax
Land revaluation differences
Foreign currency translation
adjustments
Total accumulated other comprehensive
income
Beginning balance ¥ 745,362 ¥ 6,832 ¥(89,985) ¥(67,197) ¥595,012 ¥11,395 ¥2,087,507
Increase/decrease:
Issuance of foundation funds 100,000
Additions to reserve for dividends to policyholders (Note 9) (175,513)
Additions to reserve for redemption of foundation funds —
Interest on foundation funds (3,508)
Net surplus 224,903
Redemption of foundation funds (50,000)
Reversal of land revaluation differences 2,981
Net change, excluding foundation funds and others 276,808 (13,802) 22,469 (1,422) 284,053 746 284,799
Net change 276,808 (13,802) 22,469 (1,422) 284,053 746 383,662
Ending balance ¥1,022,171 ¥ (6,969) ¥(67,515) ¥(68,619) ¥879,066 ¥12,141 ¥2,471,169
3. Consolidated statements of Changes in net assetsNippon Life Insurance Company and its Consolidated Subsidiaries
Cover FeatureBusiness Perform
anceM
anagement of N
ippon Life Nippon Life’s Products and Services
Company Inform
ationFinancial Data
Operational Data
101100
Millions of Yen
Foundation funds and others
For the year ended March 31, 2013Foundation funds
(Note 13)
Reserve for redemption of
foundation funds (Note 13)
Reserve for revaluation
Consolidated surplus
Total foundation funds and others
Beginning balance ¥300,000 ¥900,000 ¥651 ¥ 379,311 ¥1,579,962
Increase/decrease:
Issuance of foundation funds 50,000 50,000
Additions to reserve for dividends to policyholders (Note 9) (167,313) (167,313)
Additions to reserve for redemption of foundation funds 50,000 (50,000) —
Interest on foundation funds (3,930) (3,930)
Net surplus 247,937 247,937
Redemption of foundation funds (50,000) (50,000)
Reversal of land revaluation differences 18,917 18,917
Net change, excluding foundation funds and others
Net change — 50,000 — 45,611 95,611
Ending balance ¥300,000 ¥950,000 ¥651 ¥ 424,922 ¥1,675,573
Millions of Yen
Accumulated other comprehensive income
Minority interests
Total net assetsFor the year ended March 31, 2013
Net unrealized gains on available-for-sale securities, net of tax
Deferred losses on derivatives under
hedge accounting, net of tax
Land revaluation differences
Foreign currency translation
adjustments
Total accumulated other comprehensive
income
Beginning balance ¥1,022,171 ¥ (6,969) ¥(67,515) ¥(68,619) ¥ 879,066 ¥12,141 ¥2,471,169
Increase/decrease:
Issuance of foundation funds 50,000
Additions to reserve for dividends to policyholders (Note 9) (167,313)
Additions to reserve for redemption of foundation funds —
Interest on foundation funds (3,930)
Net surplus 247,937
Redemption of foundation funds (50,000)
Reversal of land revaluation differences 18,917
Net change, excluding foundation funds and others 1,487,015 (67,159) (16,965) 30,661 1,433,552 1,137 1,434,690
Net change 1,487,015 (67,159) (16,965) 30,661 1,433,552 1,137 1,530,301
Ending balance ¥2,509,186 ¥(74,128) ¥(84,481) ¥(37,957) ¥2,312,619 ¥13,278 ¥4,001,471
103102

Millions of Yen
Foundation funds and others
For the year ended March 31, 2014Foundation funds
(Note 13)
Reserve for redemption of
foundation funds (Note 13)
Reserve for revaluation
Consolidated surplus
Total foundation funds and others
Beginning balance ¥300,000 ¥ 950,000 ¥651 ¥ 424,922 ¥1,675,573
Cumulative effect of change in accounting policies 24,705 24,705
Beginning balance after reflecting accounting policy changes 300,000 950,000 651 449,627 1,700,279
Increase/decrease:
Additions to reserve for dividends to policyholders (Note 9) (167,172) (167,172)
Additions to reserve for redemption of foundation funds 50,000 (50,000) —
Interest on foundation funds (3,585) (3,585)
Net surplus 247,152 247,152
Redemption of foundation funds (50,000) (50,000)
Reversal of land revaluation differences 1,080 1,080
Increase due to increase in number of associates accounted for under the equity method 225 225
Net change, excluding foundation funds and others
Net change (50,000) 50,000 — 27,701 27,701
Ending balance ¥250,000 ¥1,000,000 ¥651 ¥ 477,329 ¥1,727,980
Millions of Yen
For the year ended March 31, 2014
Accumulated other comprehensive income
Minority interests
Total net assets
Net unrealized gains on available-for-sale securities, net of tax
Deferred losses on derivatives under
hedge accounting, net of tax
Land revaluation differences
Foreign currency translation
adjustments
Remeasurement of defined
benefit plans (Note 11)
Total accumulated other comprehensive
income
Beginning balance ¥2,509,186 ¥ (74,128) ¥(84,481) ¥(37,957) ¥ — ¥2,312,619 ¥13,278 ¥4,001,471
Cumulative effect of change in accounting policies 24,705
Beginning balance after reflecting accounting policy changes 2,509,186 (74,128) (84,481) (37,957) — 2,312,619 13,278 4,026,177
Increase/decrease:
Additions to reserve for dividends to policyholders (Note 9) (167,172)
Additions to reserve for redemption of foundation funds —
Interest on foundation funds (3,585)
Net surplus 247,152
Redemption of foundation funds (50,000)
Reversal of land revaluation differences 1,080
Increase due to increase in number of associates accounted for under the equity method 225
Net change, excluding foundation funds and others 751,954 (60,027) (1,080) 48,120 20,085 759,052 1,120 760,172
Net change 751,954 (60,027) (1,080) 48,120 20,085 759,052 1,120 787,874
Ending balance ¥3,261,140 ¥(134,156) ¥(85,561) ¥ 10,162 ¥20,085 ¥3,071,671 ¥14,399 ¥4,814,051
Cover FeatureBusiness Perform
anceM
anagement of N
ippon Life Nippon Life’s Products and Services
Company Inform
ationFinancial Data
Operational Data
103102

Millions of U.S Dollars
Foundation funds and others
For the year ended March 31, 2014Foundation funds
(Note 13)
Reserve for redemption of
foundation funds (Note 13)
Reserve for revaluation
Consolidated surplus
Total foundation funds and others
Beginning balance $2,914 $9,230 $ 6 $ 4,128 $16,280
Cumulative effect of change in accounting policies 240 240
Beginning balance after reflecting accounting policy changes 2,914 9,230 6 4,368 16,520
Increase/decrease:
Additions to reserve for dividends to policyholders (Note 9) (1,624) (1,624)
Additions to reserve for redemption of foundation funds 485 (485) —
Interest on foundation funds (34) (34)
Net surplus 2,401 2,401
Redemption of foundation funds (485) (485)
Reversal of land revaluation differences 10 10
Increase due to increase in number of associates accounted for under the equity method 2 2
Net change, excluding foundation funds and others
Net change (485) 485 — 269 269
Ending balance $2,429 $9,716 $ 6 $ 4,637 $16,789
Millions of U.S Dollars
Accumulated other comprehensive income
Minority interests
Total net assetsFor the year ended March 31, 2014
Net unrealized gains on available-for-sale securities, net of tax
Deferred losses on derivatives under
hedge accounting, net of tax
Land revaluation differences
Foreign currency translation
adjustments
Remeasurement of defined
benefit plans (Note 11)
Total accumulated other comprehensive
income
Beginning balance $24,379 $ (720) $(820) $(368) $ — $22,470 $129 $38,879
Cumulative effect of change in accounting policies 240
Beginning balance after reflecting accounting policy changes 24,379 (720) (820) (368) — 22,470 129 39,119
Increase/decrease:
Additions to reserve for dividends to policyholders (Note 9) (1,624)
Additions to reserve for redemption of foundation funds —
Interest on foundation funds (34)
Net surplus 2,401
Redemption of foundation funds (485)
Reversal of land revaluation differences 10
Increase due to increase in number of associates accounted for under the equity method 2
Net change, excluding foundation funds and others 7,306 (583) (10) 467 195 7,375 10 7,386
Net change 7,306 (583) (10) 467 195 7,375 10 7,655
Ending balance $31,686 $(1,303) $(831) $ 98 $195 $29,845 $139 $46,774
The accompanying notes are an integral part of the consolidated financial statements.
105104

4. Consolidated statements of Cash FlowsNippon Life Insurance Company and its Consolidated Subsidiaries
Millions of YenMillions of U.S. Dollars
For the years ended March 31 2014 2013 2012 2014
I Cash flows from operating activities:
Surplus before income taxes and minority interests ¥ 315,051 ¥ 315,164 ¥ 479,141 $ 3,061
Depreciation of rental real estate and other assets 14,993 24,588 25,211 145
Depreciation 47,536 58,308 51,787 461
Impairment losses 4,728 17,602 13,903 45
Net decrease in reserve for outstanding claims (3,772) (1,597) (41,590) (36)
Net increase in policy reserves 1,354,061 1,713,267 1,341,233 13,156
Provision for interest on reserve for dividends to policyholders 24,715 25,830 27,087 240
Net decrease in allowance for doubtful accounts (2,680) (6,455) (5,403) (26)
Net decrease in accrued bonuses for directors and audit and supervisory board members (2) (0) (4) (0)
Net decrease in accrued retirement benefits — (3,971) (2,786) —
Net decrease in net defined benefit liability (11,806) — — (114)
Net increase (decrease) in accrued retirement benefits for directors and audit and supervisory board members 36 (209) (533) 0
Net increase (decrease) in reserve for price fluctuations in investments in securities 195,783 93,819 (13,293) 1,902
Interest, dividends, and other income (1,298,823) (1,221,619) (1,203,934) (12,619)
Net gains from assets held in trust — (13) (16) —
Net (gains) losses on investments in securities (156,181) 9,533 (34,304) (1,517)
Net losses on policy loans 163,453 177,164 198,623 1,588
Loss on derivative financial instruments, net 39,218 178,477 159,834 381
Interest expenses 8,138 5,130 3,190 79
Net foreign exchange (gains) losses (1,641) (1,214) 6,201 (15)
Net losses (gains) on tangible fixed assets 3,707 (26,504) 6,495 36
(Gains) losses on equity method investments (1,980) 977 585 (19)
Gain from separate accounts, net (122,626) (144,611) (18,640) (1,191)
Loss on liquidation of subsidiaries and affiliates 2,726 — — 26
Net (increase) decrease in reinsurance receivables (87) 126 (172) (0)
Net increase in other assets (excluding those related to investing activities and financial activities) (11,079) (35,907) (8,448) (107)
Net increase (decrease) in reinsurance payables 61 (55) 34 0
Net decrease in other liabilities (excluding those related to investing activities and financing activities) (26,479) (10,656) (6,331) (257)
Others, net (7,142) 8,901 (2,347) (69)
Subtotal 529,907 1,176,077 975,522 5,148
Interest, dividends, and other income received 1,301,927 1,236,283 1,212,575 12,649
Interest paid (8,146) (2,809) (3,308) (79)
Dividends to policyholders paid (194,119) (198,791) (202,602) (1,886)
Others, net 6,562 (36) 508 63
Income taxes (paid) refund (114,690) 9,211 (167,235) (1,114)
Net cash provided by operating activities ¥ 1,521,441 ¥ 2,219,934 ¥ 1,815,460 $ 14,782
Cover FeatureBusiness Perform
anceM
anagement of N
ippon Life Nippon Life’s Products and Services
Company Inform
ationFinancial Data
Operational Data
105104

Millions of YenMillions of U.S. Dollars
For the years ended March 31 2014 2013 2012 2014
II Cash flows from investing activities:
Net decrease (increase) in deposits ¥ 1,099 ¥ 1,999 ¥ (2,100) $ 10
Net (increase) decrease in receivables under securities borrowing transactions (9,146) 61,219 180,597 (88)
Purchases of monetary receivables purchased (22,300) (17,500) (8,000) (216)
Proceeds from sales and redemptions of monetary receivables purchased 103,904 96,487 84,009 1,009
Purchases of securities (8,881,679) (8,825,996) (12,567,926) (86,296)
Proceeds from sales and redemptions of securities 8,748,961 7,054,782 11,019,846 85,007
Disbursements for loans (1,369,346) (1,323,328) (1,515,105) (13,304)
Proceeds from collections of loans 1,280,328 1,294,163 1,351,797 12,440
Net (loss) income from the settlement of derivative financial instruments (805,208) (957,401) 11,103 (7,823)
Net (decrease) increase in cash received as collateral under securities lending transactions (409,330) 276,436 (361,667) (3,977)
Others, net (128) (2,936) (23,286) (1)
a Total of investment activities (1,362,845) (2,342,075) (1,830,732) (13,241)
[I + IIa] [158,595] [(122,140)] [(15,271)] [1,540]
Purchases of tangible fixed assets (101,879) (55,143) (55,966) (989)
Proceeds from sales of tangible fixed assets 28,804 114,330 3,075 279
Others, net (25,937) (22,517) (30,711) (252)
Net cash used in investing activities (1,461,858) (2,305,404) (1,914,335) (14,203)
III Cash flows from financing activities:
Proceeds from debt borrowing 216,289 265,313 219,500 2,101
Repayments of debt (214,367) (259,884) (212,112) (2,082)
Proceeds from issuance of corporate bonds — 157,040 — —
Proceeds from issuance of foundation funds — 50,000 100,000 —
Redemption of foundation funds (50,000) (50,000) (50,000) (485)
Interest on foundation funds (3,585) (3,930) (3,508) (34)
Others, net 25,802 26,345 19,573 250
Net cash (used in) provided by financing activities (25,861) 184,884 73,452 (251)
IV Effect of exchange rate changes on cash and cash equivalents 17,513 13,945 (4,085) 170
V Net increase (decrease) in cash and cash equivalents 51,234 113,360 (29,507) 497
VI Cash and cash equivalents at the beginning of the year 820,784 707,424 736,931 7,974
VII Cash and cash equivalents at the end of the year ¥ 872,018 ¥ 820,784 ¥ 707,424 $ 8,472
The accompanying notes are an integral part of the consolidated financial statements.
107106

5. notes to the Consolidated Financial statementsNippon Life Insurance Company and its Consolidated Subsidiaries
1. Basis of Presenting the Consolidated Financial statements
(1) accounting principles and presentation
The accompanying consolidated financial statements have been prepared
from the accounts and records maintained by NIPPON LIFE INSURANCE
COMPANY (“Nippon Life” or the “Company”) and its consolidated subsid-
iaries in accordance with the provisions set forth in the Insurance Business
Act and the related rules and regulations applicable to the mutual life insur-
ance industry, and in accordance with accounting principles generally
accepted in Japan, which are different in certain respects from the applica-
tion and disclosure requirements of International Financial Reporting
Standards. Certain accounting and reporting practices required to be fol-
lowed by the industry are regulated by the Financial Services Agency and the
related ministry by means of ministerial ordinances and guidance. The
accompanying consolidated financial statements of the Company and its
consolidated subsidiaries are in compliance with such requirements. The
information provided in the consolidated financial statements including the
notes to the consolidated financial statements is limited to that required by
Japanese laws and regulations. Amounts of less than one million yen and
one million U.S. dollars have been eliminated. As a result, totals may not add
up exactly.
(2) United states dollar amounts
Nippon Life prepares its consolidated financial statements in Japanese yen.
The U.S. dollar amounts included in the consolidated financial statements
and notes thereto represent the arithmetical results of translating Japanese
yen to U.S. dollars on the basis of ¥102.92=U.S.$1, the effective rate of
exchange at the balance sheet date of March 31, 2014. The inclusion of such
U.S. dollar amounts is solely for convenience and is not intended to imply
that Japanese yen amounts have been or could be readily converted, realized
or settled in U.S. dollars at ¥102.92=U.S.$1 or at any other rate.
2. summary of significant accounting Policies(1) Principles of consolidation
i) Consolidated subsidiaries
The consolidated financial statements include the accounts of Nippon
Life and its subsidiaries. Consolidated subsidiaries as of March 31, 2014,
2013 and 2012, are listed as follows:
Nissay Computer Co., Ltd. (Japan)
Nissay Asset Management Corporation (Japan)
Nissay Information Technology Co., Ltd. (Japan)
Nissay Capital Co., Ltd. (Japan)
Nissay Leasing Co., Ltd. (Japan)
Nissay Credit Guarantee Co., Ltd. (Japan)
Nippon Life Insurance Company of America (U.S.A.)
NLI Properties West, Inc. (U.S.A.) (up to the fiscal year ended March
31, 2013)
NLI Commercial Mortgage Fund, LLC (U.S.A.)
NLI Commercial Mortgage Fund II, LLC (U.S.A.)
The major subsidiaries excluded from consolidation are Nissay Card
Service Co., Ltd., Nissay Trading Corporation and Nissay Business Service
Co., Ltd.
From the fiscal year ended March 31, 2014, NLI Properties West, Inc.
has been removed from the scope of consolidation due to being dissolved.
The respective and aggregate effects of the companies which are
excluded from consolidation, based on total assets, revenues, net income
and surplus for the fiscal years ended March 31, 2014, 2013 and 2012,
are immaterial. This exclusion from consolidation does not prevent a
reasonable judgment of the consolidated financial position of Nippon
Life and its subsidiaries and the results of their operations.
ii) Affiliates
Affiliates accounted for under the equity method as of March 31, 2014,
2013 and 2012, are listed as follows:
The Master Trust Bank of Japan, Ltd. (Japan)
Corporate-Pension Business Service Co., Ltd. (Japan)
Nissay-Greatwall Life Insurance Co., Ltd. (China)
Reliance Life Insurance Company Limited (India)
Bangkok Life Assurance Public Company Limited (Thailand) (From the
fiscal year ended March 31, 2014)
Bangkok Life Assurance Public Company Limited has become more
important to the Company and has therefore been included as an affili-
ate accounted for under the equity method from the fiscal year ended
March 31, 2014.
From the fiscal year ended March 31, 2012, Reliance Life Insurance
Company Limited became an affiliate accounted for under the equity
method because of the Company’s acquisition of shares of said company.
The subsidiaries not consolidated, e.g., Nissay Card Service Co., Ltd.,
Nissay Trading Corporation and others, and affiliates other than those
listed above, e.g., Reliance Capital Asset Management Limited, are not
accounted for under the equity method. The respective and aggregate
effects of such companies on consolidated net income and surplus for the
fiscal year ended March 31, 2014, 2013 and 2012, are immaterial.
The number of consolidated subsidiaries and affiliates as of March
31, 2014, 2013 and 2012, was as follows:
2014 2013 2012
Consolidated subsidiaries 9 10 10
Subsidiaries not consolidated but accounted for under the equity method 0 0 0
Affiliates accounted for under the equity method 5 4 4
Cover FeatureBusiness Perform
anceM
anagement of N
ippon Life Nippon Life’s Products and Services
Company Inform
ationFinancial Data
Operational Data
107106

iii) The fiscal year end dates of consolidated subsidiaries and affiliates
The fiscal years of consolidated overseas subsidiaries and affiliates end
on December 31. The consolidated financial statements are prepared
using data as of the date of preparation and necessary adjustments are
made to reflect important transactions that occurred between the fiscal
year end date and the preparation date.
iv) Valuation of assets and liabilities of consolidated subsidiaries and affiliates
The Company applies the mark-to-market method.
v) Amortization of goodwill
Goodwill and the equivalent amount of goodwill from affiliates accounted
for under the equity method are amortized under the straight-line method
over 20 years.
However, for items that are immaterial, the total amount of goodwill
is expensed as incurred.
vi) All significant intercompany balances and transactions have been
eliminated in consolidation. All material unrealized profits/losses
included in assets/liabilities resulting from transactions within the
Group are eliminated.
(2) Cash and cash equivalents
Cash and cash equivalents, for the purpose of reporting consolidated cash
flows, are composed of cash in hand, deposits held at call with banks and all
highly liquid short-term investments with a maturity of three months or less
when purchased, which are readily convertible into cash and present insig-
nificant risk of change in value.
(3) securities and hedging activities
1) Securities of the Company (including items such as deposits and mone-
tary receivables purchased which are treated as securities based on the
“Accounting Standard for Financial Instruments” (The Accounting Stan-
dards Board of Japan (ASBJ) Statement No. 10) and securities within
assets held in trust) are valued as follows:
i) Trading securities are stated at market value on the balance sheet
date. The moving average method is used for calculating cost of sales.
ii) Held-to-maturity debt securities are valued using the moving average
method, net of accumulated amortization (straight-line).
iii) Policy-reserve-matching bonds are valued using the moving average
method, net of accumulated amortization (straight-line), in accor-
dance with the Industry Audit Committee Report No. 21, “Temporary
Treatment of Accounting and Auditing Concerning Policy-Reserve-
Matching Bonds in the Insurance Industry,” issued by the Japanese
Institute of Certified Public Accountants (JICPA).
iv) Investments in subsidiaries and affiliates that are not consolidated
nor accounted for by the equity method (stocks issued by subsidiaries
prescribed in Article 2, Paragraph 12 of the Insurance Business Act
excluding subsidiaries prescribed in Article 13-5-2, Paragraph 3 of the
Order for Enforcement of the Insurance Business Act and stocks
issued by affiliates prescribed in Article 13-5-2, Paragraph 4 of the
Order for Enforcement of the Insurance Business Act) are valued using
the moving average method.
v) Available-for-sale securities
a. Regarding securities with a market value, stocks (including foreign
stocks) are valued by using the average market value during the
period of one month before the balance sheet date (cost of sales
is calculated by using the moving average method). Other securi-
ties with a market value are valued by using the market value on
the balance sheet date (cost of sales is calculated by using the
moving average method).
b. Regarding securities of which the market value is extremely diffi-
cult to be determined, and public and corporate bonds (including
foreign bonds) for which the difference between the purchase
price and face value is due to an interest rate adjustment are
valued at cost using the moving average method, net of accumu-
lated amortization (straight-line). Other securities are valued at
cost using the moving average method.
2) Unrealized gains/losses, net of applicable taxes for available-for-sale
securities, are recorded in a separate component of net assets.
Hedge accounting of the Company is applied based on the following method:
1) The Company mainly applies the mark-to-market method of hedge
accounting and deferred hedge accounting for hedging activities related to
foreign exchange rate fluctuation exposures on certain bonds denominated
in foreign currencies. The Company also applies the exceptional account-
ing treatment (“Tokurei-shori”) for interest rate swaps to hedge the cash
flow volatility of certain loans and applies designated hedge accounting
(“ Furiate-shori”) for foreign exchange forward contracts and currency
swaps for certain financial assets and financial liabilities denominated in
foreign currencies.
2) Effectiveness of hedging activities is mainly evaluated by performing a
ratio analysis of market value movement comparisons based on the
hedging instruments and hedging methods taken, which is in accordance
with the Company’s internal risk management policies.
3) Derivative financial instruments utilized for other than hedging purposes
are stated at market value.
109108

(4) Policy-reserve-matching bonds
Securities that are held for the purpose of matching the duration of out-
standing liabilities within the sub-groups (insurance type, remaining period,
and investment policy) of insurance products, such as individual insurance
and annuities, workers’ asset-formation insurance and annuities, and group
insurance and annuities are classified as policy-reserve-matching bonds in
accordance with the Industry Audit Committee Report No. 21, “Temporary
Treatment of Accounting and Auditing Concerning Policy-Reserve-Matching
Bonds in the Insurance Industry,” issued by the JICPA.
(5) Foreign currency translation
Assets and liabilities denominated in foreign currencies are translated into
Japanese yen using the “Accounting Standards for Foreign Currency
Transactions” (Business Accounting Council).
Foreign currency-denominated available-for-sale securities of the
Company, with exchange rates which have significantly fluctuated and
where recovery is not expected, are converted to Japanese yen using either
the rate on the balance sheet date or the average one month rate prior to
the balance sheet date, whichever indicates a weaker yen. This translation
difference is recorded as a loss on valuation of securities.
(6) tangible fixed assets
1) Tangible fixed assets are depreciated based on the following methods:
a. Tangible fixed assets of the Company (except for lease assets)
(i) Buildings as of March 31, 2014 and buildings acquired on or after
April 1, 1998 (except for fixtures and structures) as of March 31,
2013 and 2012
Straight-line method.
(ii) Assets other than the above
Declining balance method.
b. Lease assets of the Company
(i) Lease assets related to financial leases where ownership is
transferred
The same depreciation method applied to fixed assets owned by
the Company.
(ii) Lease assets related to financial leases where ownership is not
transferred
Straight-line method based on lease period.
c. Tangible fixed assets of consolidated subsidiaries
Depreciated based mainly on the straight-line method in the fiscal
years ended March 31, 2014 and 2012. Depreciated based mainly on the
declining balance method in the fiscal year ended March 31, 2013.
The estimated useful lives of major items are as follows:
Buildings 2 to 50 years
Other tangible fixed assets 2 to 20 years
Tangible fixed assets are stated at cost, net of accumulated deprecia-
tion and impairment losses.
Previously, tangible fixed assets of the Company were depreciated
mainly based on the declining-balance method. From the fiscal year
ended March 31, 2014, the depreciation method for buildings and others
has been changed to the straight-line method.
This change was made because the Company decided that straight-
line depreciation over the useful lives of buildings better reflects the future
use of tangible fixed assets given that the Company now expects to make
more consistent use of buildings and others over the long term. This deci-
sion was based on several factors. First, investments in remodeling and
renovations, which slow the aging of real estate, now represent a rela-
tively higher share of investments. Remodeling and renovations have
progressively replaced the acquisition and construction of new buildings,
which now represent a lower share of investments. Previously, acquisi-
tions and construction of new buildings accounted for the bulk of invest-
ments, and therefore the declining-balance method of depreciation was
adopted as a depreciation method suited to the use of these assets.
Second, the Company has recently formulated standards such as an
overall building renovation plan and specifications for renovation work in
order to conduct real estate renovations more systematically. Following
the completion of the development of a system for managing fixed assets
in support of these changes during the fiscal year ended March 31, 2014,
the Company decided to change the depreciation method for tangible
fixed assets.
As a result, ordinary profit and surplus before income taxes and
minority interests both increased by ¥3,027 million (U.S.$29 million) in
comparison with the previous depreciation method for the fiscal year
ended March 31, 2014.
Furthermore, in the course of formulating the above overall building
renovation plan, the Company surveyed the remaining useful lives and
residual values of buildings and others. Consequently, in conjunction
with the change in depreciation method, the Company revised these
parameters to better reflect actual conditions. Accordingly, the Company
has adjusted certain useful lives and residual values from the fiscal year
ended March 31, 2014.
As a result, ordinary profit and surplus before income taxes and
minority interests both increased by ¥7,325 million (U.S.$71 million) in
comparison with the previous depreciation method for the fiscal year
ended March 31, 2014.
Following tax reforms enacted in Japan in the fiscal year ended March
31, 2012, the Company and its domestic consolidated subsidiaries adopted
the depreciation method in compliance with the revised Corporation Tax
Act for tangible fixed assets acquired on or after April 1, 2012, to which
the declining balance method is applied, from the fiscal year ended
March 31, 2013. As a result, ordinary profit and surplus before income
taxes and minority interests increased by ¥449 million in comparison
with the previous method for the fiscal year ended March 31, 2013.
Cover FeatureBusiness Perform
anceM
anagement of N
ippon Life Nippon Life’s Products and Services
Company Inform
ationFinancial Data
Operational Data
109108

2) Revaluation of land used in the operations of the Company is performed
based on the Act on Revaluation of Land. The tax effect of the amount
related to the valuation difference between the previous and the revalued
amount for land revaluation is recognized as a deferred tax liability
within the liability section. The valuation differences, excluding tax, are
recognized as land revaluation differences within the net assets section.
Revaluation Date March 31, 2002
Revaluation Methodology The amount is rationally calculated by using the land
listed value and road rate as prescribed by Article 2,
Items 1 and 4, respectively, of the Order for Enforce-
ment of the Act on Revaluation of Land.
The Act on Revaluation of Land requires companies to disclose when
the total fair value of land on the balance sheet date is below the total
book value of this land after revaluation. The excess of the total book
value of this land after revaluation as of March 31, 2013, over the total
fair value of land used in operations, as revalued in accordance with
Article 10 of the Act on Revaluation of Land as of the same date, was
¥3,351 million.
(7) software
Capitalized software for internal use, which is included within intangible
fixed assets, is amortized using the straight-line method over their estimated
useful lives as internally determined (5 years).
(8) leases
Financial leases where ownership is not transferred are capitalized based on
the “Accounting Standard for Lease Transactions” (ASBJ Statement No. 13).
Financial leases where the Company or a consolidated subsidiary is the
lessee, ownership is not transferred, and the lease start date is March 31,
2008, or prior are accounted for under the accounting treatment applied to
ordinary operating leases.
Regarding financial leases where the Company or a consolidated sub-
sidiary is the lessor and ownership is not transferred, if any, the Company
recognizes the sales amount and cost of sales at the time of receiving the
lease fee.
(9) allowance for doubtful accounts
1) An allowance for doubtful accounts for the Company is recognized in
accordance with the Company’s internal Asset Valuation Regulation and
Write-Off/Provision Rule.
i) An allowance for loans from borrowers who are legally or substan-
tially bankrupt, such as being bankrupt or being in the process of civil
rehabilitation proceedings, is recognized based on the amount of
credit remaining after directly deducting amounts expected to be
collected through the disposal of collateral or the execution of
guarantees from the balance of loans (as mentioned at 4) below).
ii) An allowance for loans from borrowers who are not currently legally
bankrupt but have a significant possibility of bankruptcy is recognized
at the amounts deemed necessary considering an assessment of the
borrowers’ overall solvency and the amounts remaining after deduc-
tion of amounts expected to be collected through the disposal of
collateral or the execution of guarantees.
iii) An allowance for loans from borrowers other than the above is pro-
vided based on the borrowers’ balance multiplied by the historical
average (of a certain period) percentage of bad debt.
2) All credits of the Company are assessed by responsible sections in accor-
dance with the Company’s internal Asset Valuation Regulation. The
assessments are verified by the independent Asset Auditing Department.
The results of the assessments are reflected in the calculation of the
allowance for doubtful accounts.
3) For consolidated subsidiaries, the Company records the allowance amounts
deemed necessary in accordance mainly with the Company’s internal
Asset Valuation Regulation and Write-Off/Provision Rule.
4) The estimated uncollectible amount calculated by subtracting the amount
of collateral value or the amount collectible by the execution of guaran-
tees from the balance of loans is directly deducted from the balance of
loans (including loans with credits secured and/or guaranteed) made to
legally or substantially bankrupt borrowers. The estimated uncollectible
amounts were ¥1,082 million (U.S.$10 million) (including ¥288 million
(U.S.$2 million) of credits secured and/or guaranteed), ¥1,570 million
(including ¥757 million of credits secured and/or guaranteed) and ¥2,668
million (including ¥1,761 million of credits secured and/or guaranteed)
as of March 31, 2014, 2013 and 2012, respectively.
(10) accrued bonuses for directors and audit and supervisory
board members
Accrued bonuses for directors and audit and supervisory board members are
recognized based on amounts estimated to be paid.
(11) net defined benefit liability and accrued retirement benefits
1) Net defined benefit liability is the amount of retirement benefit obliga-
tions prepared for payment of employee retirement benefits less pension
plan assets, based on the projected amounts as of March 31, 2014.
2) The accounting methods of the Company used for retirement benefits as
of March 31, 2014 are as follows:
1) Attribution method for estimated retirement benefits: Benefit formula
basis
2) Period of amortizing actuarial differences: 5 years
3) Period of amortizing prior service costs: 5 years
Accrued retirement benefits of the Company are recognized based on
the estimated amount of projected benefit obligations in excess of the
market value of pension plan assets for future severance payments to
employees on the balance sheet date for the fiscal years ended March 31,
2013 and 2012.111110

(12) accrued retirement benefits for directors and
audit and supervisory board members
Accrued retirement benefits for directors and audit and supervisory board
members are recognized based on estimated payment amounts under
internal rules.
(13) Reserve for program points
A reserve for program points is recognized based on the amount projected
to be incurred for expenses from the use of points granted to policyholders.
(14) accrued losses from supporting closely related companies
Accrued losses from supporting closely related companies are recognized
based on the estimated amounts required in the future to support the
restructuring of closely related companies.
(15) Reserve for loss on disaster
Reserve for loss on disaster is recognized based on estimated expenditures
associated with the Great East Japan Earthquake, such as expenditures for
the repair of tangible fixed assets.
(16) Reserve for price fluctuations in investments in securities
Reserve for price fluctuations in investments in securities is recognized based
on Article 115 of the Insurance Business Act.
(17) accounting for consumption taxes
Consumption taxes and local consumption taxes of the Company are
accounted for by the tax exclusion method. However, consumption taxes
paid on certain asset transactions, which are not deductible from consump-
tion taxes withheld and that are stipulated to be deferred under the Con-
sumption Tax Act, are deferred as prepaid expenses and amortized over a 5
year period on a straight-line basis. Consumption taxes other than deferred
consumption taxes are expensed as incurred.
(18) Policy reserves
Policy reserves of the Company are reserves set forth in accordance with
Article 116 of the Insurance Business Act. Policy reserves are recognized
based on the following methodology:
1) Reserves for contracts concluded in or after April 1996, other than those
in which factors used as a basis for computing policy reserves and insur-
ance premiums are alterable and those for variable insurance, are com-
puted by the net level premium method based on the assumption rates
locked in at the sales and renewal prescribed by the Insurance Business
Act and the statement of calculation procedures*.
2) Reserves for other contracts are determined by the net level premium
method using the assumption rates locked in at the sales and renewal
prescribed by the statement of calculation procedures*.
* Documents approved by the Financial Services Agency that describe the specific calculation methods for insurance premiums and policy reserves.
Additional policy reserve amounts are included to cover a possible
deficiency in the amount of the reserve for certain individual annuity policy-
holders in accordance with Article 69, Paragraph 5 of the Ordinance for
Enforcement of the Insurance Business Act.
(19) Revenue recognition
Regarding revenues, insurance premiums are recognized when cash is
received and insurance premiums due but not collected are not recognized
as revenues. Unearned insurance premiums are recognized as policy reserves.
(20) Policy acquisition costs
Policy acquisition costs are recorded to expense as incurred.
(21) new accounting standards
From the fiscal year ended March 31, 2014, the Company has applied
the “Accounting Standard for Retirement Benefits” (ASBJ Statement No. 26)
and the “Guidance on Accounting Standard for Retirement Benefits” (ASBJ
Guidance No. 25). The revised accounting standard permits companies to
change the calculation method of retirement benefit obligations and service
costs from the start of fiscal years beginning on or after April 1, 2013.
Accordingly, from the fiscal year ended March 31, 2014, the Company has
changed the periodic allocation method of estimated retirement benefits
from the straight-line basis to the benefit formula basis. At the end of the
current fiscal year, the amount of retirement benefit obligations minus pen-
sion assets is recorded as net defined benefit liability, and unrecognized
actuarial differences and unrecognized prior service costs are recorded in the
net defined benefit liability.
With respect to the application of the revised accounting standard, in
accordance with Article 37 of the Standard, the amount of the impact of
changes to the method of calculation of retirement benefit obligations and
service costs has been included in consolidated surplus as of the beginning
of the current fiscal year. Furthermore, at the end of the current fiscal year
the amount of the impact of recording the amount of retirement benefit
obligations minus pension assets as a net defined benefit liability was
recorded as a remeasurement of defined benefit plans under total accumu-
lated other comprehensive income.
As a result, consolidated surplus as of April 1, 2013, increased by ¥24,705
million (U.S.$240 million), while ordinary profit and surplus before income
taxes and minority interests increased by ¥1,558 million (U.S.$15 million).
Furthermore, as of March 31, 2014, the Company recorded net defined ben-
efit liability of ¥359,438 million (U.S.$3,492 million) and total accumulated
other comprehensive income of ¥20,085 million (U.S.$195 million).
Cover FeatureBusiness Perform
anceM
anagement of N
ippon Life Nippon Life’s Products and Services
Company Inform
ationFinancial Data
Operational Data
111110

3. Cash and Cash equivalentsThe reconciliation of “Cash and cash equivalents” in the consolidated state-
ments of cash flows and “Cash and deposits” in the consolidated balance
sheets as of March 31, 2014, 2013 and 2012, was as follows:
Millions of YenMillions of U.S. Dollars
2014 2013 2012 2014
Cash and deposits ¥497,125 ¥551,338 ¥479,071 $4,830
Call loans 349,400 203,900 212,300 3,394
Monetary receivables purchased 26,996 56,992 71,991 262
Investments in securities 1,599 62,758 261 15
Time deposits with initial term over 3 months to maturity and others (3,103) (54,205) (56,200) (30)
Cash and cash equivalents ¥872,018 ¥820,784 ¥707,424 $8,472
4. Financial instrumentsRegarding the investment of the Company’s general accounts (except sepa-
rate accounts as provided in Article 118, Paragraph 1 of the Insurance
Business Act), in light of the characteristics of life insurance policies, the
Company has built a portfolio geared towards mid- to long-term invest-
ment and formulated an investment plan considering the outlook of the
investment environment.
Based on this, in order to reliably pay benefits and other payments in the
future, the Company has positioned yen-denominated assets that can be
expected to provide stable income, such as bonds and loans, as the
Company’s core assets, and from the viewpoint of improving profit in the
mid- to long-term, the Company invests in stocks and foreign securities. Also,
from the viewpoint of effective investment, the Company mainly uses deriva-
tive transactions for controlling asset investment risks. Specifically, the
Company uses interest rate swaps for the Company’s interest rate related
investments, foreign exchange forward contracts and currency options and
swaps for the Company’s currency related investments, and hedge account-
ing is applied with respect to a portion thereof.
The Company mainly applies the mark-to-market method of hedge
accounting and deferred hedge accounting for hedging activities against
foreign exchange rate fluctuation exposures on certain bonds denominated
in foreign currencies. The Company also applies the exceptional accounting
treatment (“Tokurei-shori”) for interest rate swaps to hedge the cash flow
volatility of certain loans and applies designated hedge accounting (“Furiate-
shori”) for foreign exchange forward contracts and currency swaps for certain
financial assets and financial liabilities denominated in foreign currencies.
The effectiveness of hedging activities is mainly evaluated by performing a
ratio analysis of market value movement comparisons based on the hedging
instruments and hedging methods taken, which is in accordance with the
Company’s internal risk management policies.
Securities are mainly exposed to market risk and credit risk, loans are
exposed to credit risk, and derivative transactions are exposed to market risk
and credit risk. Market risk refers to the risk of incurring losses when the
market value of investment assets declines due to such factors as fluctua-
tions in interest rates, exchange rates or stock prices. Credit risk refers to the
risk of incurring losses when the value of assets, primarily loans and bonds,
declines due to deterioration of the financial condition of the party to whom
credit has been extended. These risks are managed according to rules and
regulations regarding investment risks.
To manage market risk, the Company has implemented investment
limits based on the nature of the assets in order to avoid excessive losses
from financing and investment transactions. In addition, the Company
regularly reports on the status of compliance to the Risk Management
Committee, the advisory body of the Management Committee, and has
prepared a system to control risk to acceptable levels when there is a breach
of the internal rules. Also, to control market risk in the Company’s portfolio,
the Company uses a statistical analysis method to rationally calculate the
market value-at-risk of the portfolio as a whole and conducts appropriate
asset allocation within acceptable boundaries of risk.
To manage credit risk, the Company has built a thorough monitoring
system involving the Assessment Management Department which is inde-
pendent of the departments handling investment and finance activities. The
Company also continues to build a sound portfolio through the establish-
ment of interest guidelines to ensure the returns the Company obtains are
commensurate with the risk, a system of internal ratings for classifying the
creditworthiness of borrowers, and credit ceilings to ensure that credit risk is
not excessively concentrated in a particular company or group.
In addition, the Company calculates credit value-at-risk as a measurement
of the magnitude of credit risk across the Company’s portfolio as a whole and
monitors whether the magnitude of risk stays within an appropriate range.
113112

(1) Balance sheet amounts and market values of major financial instruments and their differences are as follows:
Millions of Yen Millions of U.S. Dollars
As of March 31 2014 2013 2012 2014Balance sheet
amount (*1)Market value (*2) Difference
Balance sheet amount (*1)
Market value (*2) Difference
Balance sheet amount (*1)
Market value (*2) Difference
Balance sheet amount (*1)
Market value (*2) Difference
Cash and deposits (negotiable certificates of deposit): ¥ 236,999 ¥ 236,999 ¥ — ¥ 298,997 ¥ 298,997 ¥ — ¥ 250,997 ¥ 250,997 ¥ — $ 2,302 $ 2,302 $ —
Available-for-sale securities 236,999 236,999 — 298,997 298,997 –– 250,997 250,997 — 2,302 2,302 —
Monetary receivables purchased: 570,632 611,996 41,364 756,320 810,224 53,904 883,070 926,722 43,652 5,544 5,946 401
Policy-reserve-matching bonds 542,574 583,939 41,364 698,039 751,943 53,904 806,689 850,341 43,652 5,271 5,673 401
Available-for-sale securities 28,057 28,057 — 58,281 58,281 –– 76,381 76,381 — 272 272 —
Securities: 43,213,594 45,016,895 1,803,300 41,098,992 43,138,884 2,039,891 36,312,157 37,446,444 1,134,286 419,875 437,396 17,521
Trading securities 1,098,298 1,098,298 — 1,160,434 1,160,434 –– 1,041,876 1,041,876 — 10,671 10,671 —
Held-to-maturity debt securities 47,077 47,315 237 39,999 40,532 532 46,921 47,210 289 457 459 2
Policy-reserve-matching bonds 19,593,801 21,352,447 1,758,645 18,905,385 20,908,019 2,002,633 17,421,958 18,542,260 1,120,301 190,378 207,466 17,087
Investments in subsidiaries and affiliates 17,361 61,779 44,417 7,711 44,436 36,725 7,711 21,406 13,695 168 600 431
Available-for-sale securities 22,457,054 22,457,054 — 20,985,462 20,985,462 –– 17,793,689 17,793,689 — 218,199 218,199 —
Loans (*3): 8,481,445 8,748,579 267,133 8,511,070 8,830,097 319,026 8,626,894 8,889,148 262,253 82,408 85,003 2,595
Policy loans 782,113 782,113 — 835,281 835,281 –– 896,161 896,161 — 7,599 7,599 —
Industrial and consumer loans 7,699,332 7,966,465 267,133 7,675,789 7,994,816 319,026 7,730,733 7,992,987 262,253 74,808 77,404 2,595
Derivative financial instruments (*4): (278,716) (278,716) — (259,261) (259,261) –– (190,224) (190,224) — (2,708) (2,708) —
Hedge accounting not applied (258) (258) — 37 37 –– (81,081) (81,081) — (2) (2) —
Hedge accounting applied (278,457) (278,457) — (259,298) (259,298) –– (109,143) (109,143) — (2,705) (2,705) —
Corporate bonds (*3, *5) (157,040) (172,429) (15,389) (157,040) (159,039) (1,999) –– –– –– (1,525) (1,675) (149)
Cash received as collateral under securities lending transactions (*5) ¥ (802,691) ¥ (802,691) ¥ — ¥ (1,212,021) ¥ (1,212,021) ¥ — ¥ (935,584) ¥ (935,584) ¥ — $ (7,799) $ (7,799) $ —
(*1) For transactions for which an allowance for doubtful accounts was recorded, the amount of the allowance is deducted.(*2) For securities for which impairment losses were recognized in the fiscal years ended March 31, 2014, 2013 and 2012, the market value is the balance sheet amount after the impairment losses are deducted.(*3) The market values of derivative financial instruments that are interest rate swaps under exceptional accounting treatment (“Tokurei-shori”) or currency swaps under designated hedge accounting (“Furiate-shori”) are
included in the market values of loans and corporate bonds because they are accounted for as an integral part of the loans and corporate bonds that are the hedged items.(*4) Assets and liabilities generated by derivative financial instruments are offset and presented net. Net liabilities in total are presented in brackets.(*5) Corporate bonds and cash received as collateral under securities lending transactions are recorded in liabilities and presented in brackets.
(2) Market value measurement methods for the Company’s major financial
instruments are as follows:
1) Securities, deposits and monetary receivables purchased are treated
as securities based on the “Accounting Standard for Financial Instru-
ments” (ASBJ Statement No. 10)
a. Items with a market price
Market value is measured based on the closing market price on
the balance sheet date. However, the market values of available-
for-sale domestic and foreign equity securities are based on the
average market price over a one-month period prior to the bal-
ance sheet date.
b. Items without a market price
Market value is measured mainly by discounting future cash flows
to the present value.
2) Loans
a. Policy loans
Market value is deemed to approximate book value, due to no
repayment deadlines based on characteristics such as limiting
loans to the surrender benefits range, and expected reimburse-
ment period and interest rate requirements, and other character-
istics. Thus, the book value is used as the market value of the
policy loans.
b. Industrial and consumer loans
Market value of variable interest rate loans is deemed to approxi-
mate book value because market interest rates are reflected in
future cash flows over the short term. Thus, the book value is used
as the market value of the variable interest rate loans.
Cover FeatureBusiness Perform
anceM
anagement of N
ippon Life Nippon Life’s Products and Services
Company Inform
ationFinancial Data
Operational Data
113112

Market value of fixed interest rate loans is measured mainly by
discounting future cash flows to the present value.
Loans from legally or substantially bankrupt borrowers or bor-
rowers who are not currently legally bankrupt but have a high
probability of bankruptcy are measured by deducting the esti-
mated uncollectable amount from the book value directly prior to
the decrease.
3) Derivative financial instruments
a. Market value of futures and other market transactions is mea-
sured by the liquidation value or closing market price on the bal-
ance sheet date.
b. Market value of stock options is measured by the value obtained
from financial institutions that are the counterparties in such
transactions as of March 31, 2013. Market value of stock options
is measured by the price calculated by the Company based on
volatility and other data obtained mainly from external informa-
tion vendors as of March 31, 2014.
c. Market value of exchange contracts and currency options is mea-
sured based on theoretical values calculated by the Company
using Telegraphic Transfer Middle rates (TTM) and discount rates
obtained from financial institutions that are the counterparties in
such transactions.
d. Market value of interest rate swaps and currency swaps is measured
based on theoretical present values calculated by discounting future
cash flows using published market interest rates, and other data.
4) Corporate bonds
Corporate bonds are stated at market value on the balance sheet date.
5) Cash received as collateral under securities lending transactions
The book value is used as market value due to their short-term
settlement.
(3) Unlisted equity securities, investments in partnerships whereby partner-
ship assets consist of unlisted equity securities, and other items without
market value are not included in securities in table (1).
Balance sheet amounts by holding purpose were ¥174,894 million
(U.S.$1,699 million), ¥163,181 million and ¥121,871 million for stocks
of subsidiaries and affiliates and ¥1,023,225 million (U.S.$9,941 mil-
lion), ¥1,054,945 million and ¥1,031,153 million for available-for-sale
securities as of March 31, 2014, 2013 and 2012, respectively.
(4) Matters regarding securities and others by holding purpose are as follows:
1) Trading securities
Investments in securities for separate accounts are classified as trading securities as of March 31, 2014, 2013 and 2012.
Valuation differences included in profit and loss were gains of ¥110,562 million (U.S.$1,074 million), gains of ¥103,266 million and losses of
¥11,977 million for securities related to separate accounts for the fiscal years ended March 31, 2014, 2013 and 2012, respectively.
2) Held-to-maturity debt securities
Balance sheet amounts, market values and their differences by type are as follows:
Millions of Yen Millions of U.S. Dollars
As of March 31 2014 2013 2012 2014
TypeBalance sheet
amount Market value DifferenceBalance sheet
amount Market value DifferenceBalance sheet
amount Market value DifferenceBalance sheet
amount Market value Difference
Market value exceeds the balance sheet amount:
Domestic bonds ¥29,071 ¥29,178 ¥107 ¥28,733 ¥28,902 ¥169 ¥35,947 ¥36,125 ¥178 $282 $283 $1
Foreign securities 8,480 8,645 165 11,142 11,506 363 7,012 7,209 197 82 83 1
Subtotal 37,551 37,824 272 39,876 40,409 532 42,959 43,334 375 364 367 2
Market value does not exceed the balance sheet amount:
Domestic bonds 2,799 2,797 (1) — — — 3,533 3,450 (82) 27 27 (0)
Foreign securities 6,726 6,693 (33) 123 123 (0) 428 425 (3) 65 65 (0)
Subtotal 9,526 9,491 (35) 123 123 (0) 3,962 3,876 (85) 92 92 (0)
Total ¥47,077 ¥47,315 ¥237 ¥39,999 ¥40,532 ¥532 ¥46,921 ¥47,210 ¥289 $457 $459 $2
115114

3) Policy-reserve-matching bonds
Balance sheet amounts, market values and their differences by type are as follows:
Millions of Yen Millions of U.S. Dollars
As of March 31 2014 2013 2012 2014
TypeBalance sheet
amount Market value DifferenceBalance sheet
amount Market value DifferenceBalance sheet
amount Market value DifferenceBalance sheet
amount Market value Difference
Market value exceeds the balance sheet amount:
Monetary receivables purchased ¥ 541,392 ¥ 582,823 ¥ 41,430 ¥ 636,067 ¥ 690,445 ¥ 54,377 ¥ 748,842 ¥ 792,984 ¥ 44,141 $ 5,260 $ 5,662 $ 402
Domestic bonds 19,100,466 20,863,889 1,763,422 18,734,266 20,741,509 2,007,243 17,108,566 18,250,757 1,142,191 185,585 202,719 17,133
Foreign securities 81,594 85,489 3,895 81,033 85,399 4,366 68,973 71,780 2,806 792 830 37
Subtotal 19,723,454 21,532,202 1,808,748 19,451,366 21,517,353 2,065,986 17,926,383 19,115,522 1,189,139 191,638 209,213 17,574
Market value does not exceed the balance sheet amount:
Monetary receivables purchased 1,182 1,115 (66) 61,971 61,498 (472) 57,846 57,357 (488) 11 10 (0)
Domestic bonds 411,307 402,636 (8,671) 89,276 80,303 (8,973) 231,192 206,831 (24,360) 3,996 3,912 (84)
Foreign securities 432 431 (1) 810 807 (2) 13,226 12,890 (336) 4 4 (0)
Subtotal 412,922 404,183 (8,738) 152,057 142,608 (9,448) 302,265 277,079 (25,185) 4,012 3,927 (84)
Total ¥20,136,376 ¥21,936,386 ¥1,800,009 ¥19,603,424 ¥21,659,962 ¥2,056,538 ¥18,228,648 ¥19,392,601 ¥1,163,953 $195,650 $213,140 $17,489
4) Available-for-sale securities
Acquisition cost or amortized cost, balance sheet amounts and their differences by type are as follows:
Millions of Yen Millions of U.S. Dollars
As of March 31 2014 2013 2012 2014
Type
Acquisition cost or
amortized costBalance sheet
amount Difference
Acquisition cost or
amortized costBalance sheet
amount Difference
Acquisition cost or
amortized costBalance sheet
amount Difference
Acquisition cost or
amortized costBalance sheet
amount Difference
Balance sheet amount exceeds acquisition cost or amortized cost:
Cash and deposits (negotiable certificates of deposit) ¥ 85,000 ¥ 85,000 ¥ 0 ¥ 4,000 ¥ 4,000 ¥ 0 ¥ — ¥ — ¥ — $ 825 $ 825 $ 0
Monetary receivables purchased — — — — — — 2,855 2,860 4 — — —
Domestic bonds 2,001,660 2,101,468 99,807 1,920,976 2,021,542 100,566 1,674,703 1,730,635 55,932 19,448 20,418 969
Domestic stocks 3,206,101 6,129,795 2,923,694 3,004,021 5,396,775 2,392,753 2,656,417 4,045,867 1,389,449 31,151 59,558 28,407
Foreign securities 9,744,502 11,450,124 1,705,621 10,054,172 11,436,744 1,382,572 7,948,252 8,564,508 616,255 94,680 111,252 16,572
Other securities 436,639 489,567 52,927 354,485 394,323 39,837 173,650 181,974 8,324 4,242 4,756 514
Subtotal 15,473,904 20,255,956 4,782,051 15,337,655 19,253,386 3,915,730 12,455,879 14,525,846 2,069,967 150,348 196,812 46,463
Balance sheet amount does not exceed acquisition cost or
amortized cost:
Cash and deposits (negotiable certificates of deposit) 152,000 151,999 (0) 295,000 294,997 (2) 251,000 250,997 (2) 1,476 1,476 (0)
Monetary receivables purchased 28,061 28,057 (4) 58,291 58,281 (10) 73,540 73,521 (19) 272 272 (0)
Domestic bonds 58,373 57,292 (1,081) 51,193 49,350 (1,843) 55,089 47,378 (7,711) 567 556 (10)
Domestic stocks 875,983 782,058 (93,924) 1,301,986 1,041,216 (260,769) 1,996,221 1,551,305 (444,915) 8,511 7,598 (912)
Foreign securities 1,395,733 1,373,740 (21,993) 639,181 624,648 (14,532) 1,699,706 1,626,024 (73,682) 13,561 13,347 (213)
Other securities 74,252 73,006 (1,245) 25,382 20,860 (4,521) 61,946 45,994 (15,951) 721 709 (12)
Subtotal 2,584,405 2,466,155 (118,250) 2,371,034 2,089,354 (281,680) 4,137,504 3,595,221 (542,282) 25,110 23,961 (1,148)
Total ¥18,058,310 ¥22,722,111 ¥4,663,801 ¥17,708,690 ¥21,342,741 ¥3,634,050 ¥16,593,383 ¥18,121,068 ¥1,527,684 $175,459 $220,774 $45,314
* Securities totaling ¥1,023,225 million (U.S.$9,941 million), ¥1,054,945 million and ¥1,031,153 million, whose market values are extremely difficult to determine, as of March 31, 2014, 2013 and 2012, respectively, are not included.
Cover FeatureBusiness Perform
anceM
anagement of N
ippon Life Nippon Life’s Products and Services
Company Inform
ationFinancial Data
Operational Data
115114

¥21,415 million (U.S.$208 million), ¥96,962 million and ¥25,760
million in impairment losses were recognized for securities with a
market value during the fiscal years ended March 31, 2014, 2013 and
2012, respectively.
Regarding stocks (including foreign stocks) with market values,
impairment losses are recognized for stocks whose market value has
fallen significantly from the acquisition price based on the average
market value in the month preceding the final day of the fiscal year, in
principle. However, in the case of a security that meets certain criteria,
such as a security for which the market value falls substantially and
the fall in the market value in the month preceding the final day of the
fiscal year is substantial, impairment losses are recognized based on
the market value on the final day of the fiscal year.
The criteria by which the market value of a stock is judged to have
fallen significantly is as follows:
a. A security for which the ratio of the average market value in the
month preceding the final day of the fiscal year to the acquisition
cost is 50% or less.
b. A security that meets both of the following criteria:
1. Average market value in the month preceding the final day of
the fiscal year is between 50% and 70% of its acquisition cost.
2. The historical market value, the business conditions of the
issuing company and other aspects are subject to certain
requirements.
(5) Scheduled repayment amounts for the main monetary claims and liabilities and redemption amounts for securities with maturities are as follows:
As of March 31, 2014 Millions of Yen Millions of U.S. Dollars
1 year or underOver 1 year
under 5 yearsOver 5 years
under 10 years Over 10 years 1 year or underOver 1 year
under 5 yearsOver 5 years
under 10 years Over 10 years
Cash and deposits (negotiable certificates of deposit): ¥237,000 ¥ –– ¥ –– ¥ –– $2,302 $ –– $ –– $ ––
Available-for-sale securities 237,000 –– –– –– 2,302 –– –– ––
Monetary receivables purchased: 35,326 14,018 58,109 462,371 343 136 564 4,492
Policy-reserve-matching bonds 8,326 14,018 57,049 462,371 80 136 554 4,492
Available-for-sale securities 27,000 –– 1,059 –– 262 –– 10 ––
Securities: 847,147 4,812,991 5,556,733 22,206,240 8,231 46,764 53,990 215,762
Held-to-maturity debt securities 8,332 37,165 1,509 –– 80 361 14 ––
Policy-reserve-matching bonds 508,980 2,758,584 2,106,119 14,103,370 4,945 26,803 20,463 137,032
Available-for-sale securities 329,834 2,017,241 3,449,104 8,102,870 3,204 19,600 33,512 78,729
Loans 890,329 2,960,992 2,061,151 1,781,426 8,650 28,769 20,026 17,308
Corporate bonds –– –– –– 157,040 –– –– –– 1,525
Cash received as collateral under securities lending transactions 802,691 –– –– –– 7,799 –– –– ––
* Assets such as policy loans, for which a period is not stipulated, are not included. Also, ¥10,907 million (U.S.$105 million) in loans from legally or substantially bankrupt borrowers or borrowers who are not currently legally bankrupt but have a high probability of bankruptcy are not included.
As of March 31, 2013 Millions of Yen
1 year or underOver 1 year
under 5 yearsOver 5 years
under 10 years Over 10 years
Cash and deposits (negotiable certificates of deposit): ¥ 299,000 ¥ — ¥ — ¥ —
Available-for-sale securities 299,000 –– –– ––
Monetary receivables purchased: 58,260 10,203 57,658 629,243
Policy-reserve-matching bonds 1,260 10,203 56,959 628,651
Available-for-sale securities 57,000 –– 698 592
Securities: 729,653 4,890,305 5,260,291 20,716,068
Held-to-maturity debt securities 6,766 32,299 800 ––
Policy-reserve-matching bonds 329,179 3,048,360 1,943,515 13,457,660
Available-for-sale securities 393,707 1,809,645 3,315,975 7,258,408
Loans 980,362 3,015,407 2,067,353 1,607,278
Corporate bonds –– –– –– 157,040
Cash received as collateral under securities lending transactions 1,212,021 –– –– ––
* Assets such as policy loans, for which a period is not stipulated, are not included. Also, ¥13,485 million in loans from legally or substantially bankrupt borrowers or borrowers who are not currently legally bankrupt but have a high probability of bankruptcy are not included.
117116

As of March 31, 2012 Millions of Yen
1 year or underOver 1 year
under 5 yearsOver 5 years
under 10 years Over 10 years
Cash and deposits (negotiable certificates of deposit): ¥ 251,000 ¥ — ¥ — ¥ —
Available-for-sale securities 251,000 — — —
Monetary receivables purchased: 80,750 11,467 58,414 731,377
Policy-reserve-matching bonds 5,865 11,467 57,576 730,675
Available-for-sale securities 74,885 — 837 701
Securities: 486,042 4,392,223 4,864,014 18,533,837
Held-to-maturity debt securities 19,580 22,467 500 —
Policy-reserve-matching bonds 317,551 2,834,695 1,824,754 12,328,463
Available-for-sale securities 148,909 1,535,059 3,038,760 6,205,374
Loans 1,015,587 2,977,544 2,262,187 1,473,539
Cash received as collateral under securities lending transactions 935,584 — — —
* Assets such as policy loans, for which a period is not stipulated, are not included. Also, ¥15,033 million in loans from legally or substantially bankrupt borrowers or borrowers who are not currently legally bankrupt but have a high probability of bankruptcy are not included.
(6) Data on Market Value of Derivative Transactions
a. Hedge accounting not applied(i) Interest-rate relatedNo ending balance as of March 31, 2014, March 31, 2013 or March 31, 2012.
Cover FeatureBusiness Perform
anceM
anagement of N
ippon Life Nippon Life’s Products and Services
Company Inform
ationFinancial Data
Operational Data
117116

(ii) Currency-related Millions of Millions of Yen U.S. Dollars
As of March 31 2014 2013 2012 2014Over-the- Foreign Sold U.S. Dollar Contract amount ¥ 72,671 ¥ 66,544 ¥ 889,517 $ 706counter exchange Over 1 year — — — —
forward Market value 73,077 66,635 915,837 710contracts Net losses (406) (90) (26,319) (3)
Euro Contract amount 79,330 57,061 826,308 770Over 1 year — — — —
Market value 79,796 56,717 857,493 775Net (losses) gains (465) 343 (31,185) (4)
Total including others Contract amount 191,560 151,890 2,031,020 1,861Over 1 year — — — —
Market value 192,802 151,738 2,101,774 1,873Net gains (losses) (1,241) 151 (70,753) (12)
Purchased U.S. Dollar Contract amount 74,003 40,318 645,014 719Over 1 year — — — —
Market value 74,385 39,993 638,530 722Net gains (losses) 382 (324) (6,484) 3
Euro Contract amount 41,009 36,163 574,179 398Over 1 year — — — —
Market value 41,147 36,192 572,727 399Net gains (losses) 137 28 (1,451) 1
Total including others Contract amount 138,392 90,556 1,510,407 1,344Over 1 year — — — —
Market value 139,137 90,243 1,499,973 1,351Net gains (losses) 745 (312) (10,434) 7
Currency options
Sold Call U.S. Dollar Contract amount — — — —[—] [—] [—] [—]
Over 1 year — — — —[—] [—] [—] [—]
Market value — — — —Net gains (losses) — — — —
Euro Contract amount — — — —[—] [—] [—] [—]
Over 1 year — — — —[—] [—] [—] [—]
Market value — — — —Net gains (losses) — — — —
Total Contract amount — — — —including [—] [—] [—] [—]others Over 1 year — — — —
[—] [—] [—] [—]Market value — — — —Net gains (losses) — — — —
Put U.S. Dollar Contract amount — — — —[—] [—] [—] [—]
Over 1 year — — — —[—] [—] [—] [—]
Market value — — — —Net gains (losses) — — — —
Euro Contract amount — — — —[—] [—] [—] [—]
Over 1 year — — — —[—] [—] [—] [—]
Market value — — — —Net gains (losses) — — — —
Total Contract amount — — — —including [—] [—] [—] [—]others Over 1 year — — — —
[—] [—] [—] [—]Market value — — — —Net gains (losses) — — — —
119118

(ii) Currency-related, continued Millions of Millions of Yen U.S. Dollars
As of March 31 2014 2013 2012 2014Over-the-counter
Currency options
Purchased Call U.S. Dollar Contract amount ¥ — ¥ — ¥ — $ —[—] [—] [—] [—]
Over 1 year — — — —[—] [—] [—] [—]
Market value — — — —Net gains (losses) — — — —
Euro Contract amount — — — —[—] [—] [—] [—]
Over 1 year — — — —[—] [—] [—] [—]
Market value — — — —Net gains (losses) — — — —
Total Contract amount — — — —including [—] [—] [—] [—]others Over 1 year — — — —
[—] [—] [—] [—]Market value — — — —Net gains (losses) — — — —
Put U.S. Dollar Contract amount — — — —[—] [—] [—] [—]
Over 1 year — — — —[—] [—] [—] [—]
Market value — — — —Net gains (losses) — — — —
Euro Contract amount — — — —[—] [—] [—] [—]
Over 1 year — — — —[—] [—] [—] [—]
Market value — — — —Net gains (losses) — — — —
Total Contract amount — — — —including [—] [—] [—] [—]others Over 1 year — — — —
[—] [—] [—] [—]Market value — — — —Net gains (losses) — — — —
Currency swaps
U.S. Dollar Contract amount — — — —Over 1 year — — — —
Market value — — — —Net gains (losses) — — — —
Euro Contract amount — — — —Over 1 year — — — —
Market value — — — —Net gains (losses) — — — —
Total Contract amount — — — —including Over 1 year — — — —others Market value — — — —
Net gains (losses) — — — —Total Net (losses) gains ¥(496) ¥(161) ¥(81,187) $ (4)
Notes: 1. [ ] show option fees recorded on the balance sheets. However, these option fees already include contracted options as of the balance sheet date. 2. Net gains (losses) shows the difference between the contract amount and market value for forward agreements, the difference between the option fees and market value for option
transactions, and the current market value (present value) for swap transactions.
Cover FeatureBusiness Perform
anceM
anagement of N
ippon Life Nippon Life’s Products and Services
Company Inform
ationFinancial Data
Operational Data
119118

(iii) Stock-related Millions of Millions of Yen U.S. Dollars
As of March 31 2014 2013 2012 2014
Exchange Stock price index futures
Sold Contract amount ¥12,476 ¥ — ¥ — $121
Over 1 year — — — —
Market value 12,598 — — 122
Net losses (121) — — (1)
Purchased Contract amount 9,811 11,241 5,132 95
Over 1 year — — — —
Market value 10,089 11,370 5,193 98
Net gains 277 129 60 2
Over-the-counter Stock forward contracts
Sold Contract amount — — — —
Over 1 year — — — —
Market value — 11 — —
Net losses — (11) — —
Purchased Contract amount — — — —
Over 1 year — — — —
Market value — — — —
Net gains (losses) — — — —
Stock Options
Sold Call Contract amount — — — —
[—] [—] [—] [—]
Over 1 year — — — —
[—] [—] [—] [—]
Market value — — — —
Net gains (losses) — — — —
Put Contract amount — — — —
[—] [—] [—]
Over 1 year — — — —
[—] [—] [—] [—]
Market value — — — —
Net gains (losses) — — — —
Purchased Call Contract amount 227 233 189 2
[55] [65] [65] [0]
Over 1 year 227 190 189 2
[55] [55] [65] 0
Market value 81 69 46 0
Net gains (losses) 25 4 (18) 0
Put Contract amount — — — —
[—] [—] [—] [—]
Over 1 year — — — —
[—] [—] [—] [—]
Market value — — — —
Net gains (losses) — — — —
Total Net (losses) gains ¥ (181) ¥ 121 ¥ 41 $ (1)
Notes: 1. [ ] show option fees recorded on the balance sheets. However, these option fees already include contracted options as of the balance sheet date. 2. Net gains (losses) shows the difference between the contract amount and market value for forward agreements and the difference between the option fees and market value for option
transactions.
(iv) Bond-relatedNo ending balance as of March 31, 2014, March 31, 2013 or March 31, 2012.
(v) OthersNo ending balance as of March 31, 2014, March 31, 2013 or March 31, 2012.
b. Hedge accounting applied(i) Interest-rate relatedNo ending balance as of March 31, 2014, March 31, 2013 or March 31, 2012.
121120

(ii) Currency-related Millions of Millions of Yen U.S. Dollars
As of March 31 2014 2013 2012 2014Over-the- Mark-to- Foreign Sold U.S. Dollar Foreign Contract amount ¥3,363,587 ¥3,726,261 ¥3,426,983 $32,681counter market exchange currency- Over 1 year — — — —
hedge forward denomi- Market value 3,381,228 3,812,650 3,457,044 32,852accounting contracts nated Net losses (17,640) (86,388) (30,060) (171)
Euro bonds Contract amount 1,167,211 946,879 380,735 11,340(main Over 1 year — — — —hedged Market value 1,178,973 945,466 391,763 11,455items) Net (losses) gains (11,761) 1,413 (11,028) (114)
Total Contract amount 5,907,965 6,061,628 5,105,036 57,403including Over 1 year — — — —others Market value 5,992,835 6,213,941 5,204,129 58,228
Net losses (84,869) (152,312) (99,093) (824)Purchased U.S. Dollar Contract amount — — — —
Over 1 year — — — —Market value — — — —Net gains (losses) — — — —
Euro Contract amount — — — —Over 1 year — — — —
Market value — — — —Net gains (losses) — — — —
Total Contract amount — — — —including Over 1 year — — — —others Market value — — — —
Net gains (losses) — — — —Currency Sold Call U.S. Dollar Contract amount — — — —options [—] [—] [—] [—]
Over 1 year — — — —[—] [—] [—] [—]
Market value — — — —Net gains (losses) — — — —
Euro Contract amount — — — —[—] [—] [—] [—]
Over 1 year — — — —[—] [—] [—] [—]
Market value — — — —Net gains (losses) — — — —
Total Contract amount — — — —including [—] [—] [—] [—]others Over 1 year — — — —
[—] [—] [—] [—]Market value — — — —Net gains (losses) — — — —
Put U.S. Dollar Contract amount — — — —[—] [—] [—] [—]
Over 1 year — — — —[—] [—] [—] [—]
Market value — — — —Net gains (losses) — — — —
Euro Contract amount — — — —[—] [—] [—] [—]
Over 1 year — — — —[—] [—] [—] [—]
Market value — — — —Net gains (losses) — — — —
Total Contract amount — — — —including [—] [—] [—] [—]others Over 1 year — — — —
[—] [—] [—] [—]Market value — — — —Net gains (losses) — — — —
Cover FeatureBusiness Perform
anceM
anagement of N
ippon Life Nippon Life’s Products and Services
Company Inform
ationFinancial Data
Operational Data
121120

(ii) Currency-related, continued Millions of Millions of Yen U.S. Dollars
As of March 31 2014 2013 2012 2014Over-the- Mark-to- Currency Purchased Call U.S. Dollar Foreign Contract amount ¥ — ¥ — ¥ — $ —counter market options currency- [—] [—] [—] [—]
hedge denomi- Over 1 year — — — —accounting nated [—] [—] [—] [—]
bonds Market value — — — —(main Net gains (losses) — — — —
Euro hedged Contract amount — — — —items) [—] [—] [—] [—]
Over 1 year — — — —[—] [—] [—] [—]
Market value — — — —Net gains (losses) — — — —
Total Contract amount — — — —including [—] [—] [—] [—]others Over 1 year — — — —
[—] [—] [—] [—]Market value — — — —Net gains (losses) — — — —
Put U.S. Dollar Contract amount — — — —[—] [—] [—] [—]
Over 1 year — — — —[—] [—] [—] [—]
Market value — — — —Net gains (losses) — — — —
Euro Contract amount — — — —[—] [—] [—] [—]
Over 1 year — — — —[—] [—] [—] [—]
Market value — — — —Net gains (losses) — — — —
Total Contract amount — — — —including [—] [—] [—] [—]others Over 1 year — — — —
[—] [—] [—] [—]Market value — — — —Net gains (losses) — — — —
Deferred Currency U.S. Dollar Contract amount 360,642 243,995 200,645 3,504hedge swaps Over 1 year 360,642 242,749 199,602 3,504accounting Market value (69,508) (48,224) (6,257) (675)
Net losses (69,508) (48,224) (6,257) (675)Euro Contract amount 365,624 279,075 174,072 3,552
Over 1 year 365,624 279,075 174,072 3,552Market value (116,616) (56,394) (3,607) (1,133)Net losses (116,616) (56,394) (3,607) (1,133)
Total Contract amount 775,154 532,131 377,367 7,531including Over 1 year 775,154 530,884 376,323 7,531others Market value (193,587) (106,974) (10,049) (1,880)
Net losses (193,587) (106,974) (10,049) (1,880)Total Net losses ¥(278,457) ¥(259,287) ¥(109,143) $(2,705)
Notes: 1. [ ] show option fees recorded on the balance sheets. 2. Net gains (losses) shows the difference between the contract amount and market value for forward agreements, the difference between the option fees and market value for option
transactions, and the current market value (present value) for swap transactions.
(iii) Stock-relatedNo ending balance as of March 31, 2014, March 31, 2013 or March 31, 2012.
(iv) Bond-relatedNo ending balance as of March 31, 2014, March 31, 2013 or March 31, 2012.
(v) Others
No ending balance as of March 31, 2014, March 31, 2013 or March 31, 2012.123122

5. disclosures about market Value of investment and Rental Property
The balance sheet amounts for investment and rental properties were
¥1,141,146 million (U.S.$11,087 million), ¥1,098,084 million and ¥1,150,417
million, with a market value of ¥1,148,000 million (U.S.$11,154 million),
¥1,081,619 million and ¥1,174,168 million as of March 31, 2014, 2013 and
2012, respectively. The Company and certain subsidiary companies own
rental office buildings and commercial facilities, the market value of which at
year end is the amount measured based mainly on the “Real Estate Appraisal
Standards.” Asset retirement obligations that were included in the balance
sheet amounts of investment and rental properties were ¥359 million
(U.S.$3 million), ¥391 million and ¥504 million as of March 31, 2014, 2013
and 2012, respectively.
6. securities loaned and BorrowedThe amounts of securities lent under lending agreements were ¥2,808,047
million (U.S.$27,283 million), ¥3,129,761 million and ¥2,816,579 million as
of March 31, 2014, 2013 and 2012, respectively.
Assets that can be sold or re-secured are marketable securities lent under
lending agreements. These assets were being held without disposal totaling
¥259,102 million (U.S.$2,517 million), ¥372,031 million and ¥709,179
million at market value as of March 31, 2014, 2013 and 2012, respectively.
7. accumulated depreciationThe amounts of accumulated depreciation of tangible fixed assets were
¥1,155,636 million (U.S.$11,228 million), ¥1,139,705 million and ¥1,164,173
million as of March 31, 2014, 2013 and 2012, respectively.
8. separate accountsSeparate account assets as provided for in Article 118, Paragraph 1 of the Insur-
ance Business Act were ¥1,227,398 million (U.S.$11,925 million), ¥1,238,818
million and ¥1,146,686 million as of March 31, 2014, 2013 and 2012,
respectively, and a corresponding liability is recorded in the same amount.
The amounts of separate accounts are included in each account balance of
the consolidated balance sheets.
9. Reserve for dividends to PolicyholdersChanges in the reserve for dividends to policyholders included in policy reserves
for the fiscal years ended March 31, 2014, 2013 and 2012, were as follows:
Millions of YenMillions of U.S. Dollars
2014 2013 2012 2014
Balance at the beginning of the fiscal year ¥1,105,093 ¥1,120,336 ¥1,144,330 $10,737
Transfer to reserve from surplus in the previous fiscal year 167,172 167,313 175,513 1,624
Dividends to policyholders paid out during the fiscal year (226,128) (208,387) (226,595) (2,197)
Increase in interest 24,715 25,830 27,087 240
Balance at the end of the fiscal year ¥1,070,852 ¥1,105,093 ¥1,120,336 $10,404
10. Corporate BondsCorporate bonds with liabilities of the Company are subordinated corporate
bonds which are denominated in a foreign currency with special provisions
that subordinate the fulfillment of obligations on the bonds to all other
debt obligations.
11. accrued Retirement Benefits(1) Outline of retirement benefit plans adopted by the Company
In terms of defined benefit plans, the Company has a defined benefit
corporate pension plan and a lump-sum retirement payment plan for non-
sales personnel and sales management personnel, etc. In terms of defined
contribution plans, the Company has a defined contribution pension plan.
The Company also has a defined benefit plan for sales representatives,
etc., in the form of a lump-sum retirement payment plan and an in-house
pension plan. The main consolidated subsidiaries have a lump-sum
retirement payment plan as a defined benefit plan.
(2) Defined benefit plan
1) Reconciliation of retirement benefit obligations at the beginning and
end of the fiscal year
For the year ended March 31, 2014Millions of Yen Millions of U.S Dollars
Retirement benefit obligations at the beginning of the year ¥646,754 $6,284
Service costs 24,079 233
Interest cost 10,326 100
Actuarial differences accrued during the year (6,606) (64)
Retirement benefit payments (48,553) (471)
Others 55 0
Retirement benefit obligations at the end of the year ¥626,055 $6,082
Cover FeatureBusiness Perform
anceM
anagement of N
ippon Life Nippon Life’s Products and Services
Company Inform
ationFinancial Data
Operational Data
123122
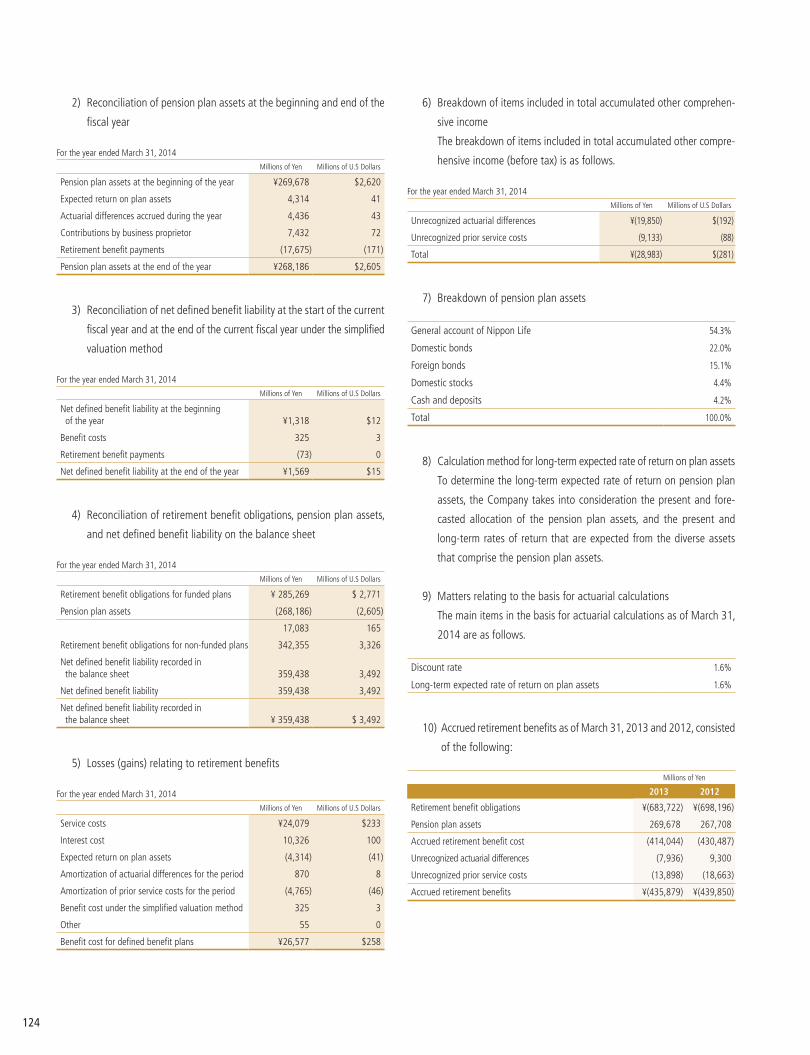
2) Reconciliation of pension plan assets at the beginning and end of the
fiscal year
For the year ended March 31, 2014Millions of Yen Millions of U.S Dollars
Pension plan assets at the beginning of the year ¥269,678 $2,620
Expected return on plan assets 4,314 41
Actuarial differences accrued during the year 4,436 43
Contributions by business proprietor 7,432 72
Retirement benefit payments (17,675) (171)
Pension plan assets at the end of the year ¥268,186 $2,605
3) Reconciliation of net defined benefit liability at the start of the current
fiscal year and at the end of the current fiscal year under the simplified
valuation method
For the year ended March 31, 2014Millions of Yen Millions of U.S Dollars
Net defined benefit liability at the beginning of the year ¥1,318 $12
Benefit costs 325 3
Retirement benefit payments (73) 0
Net defined benefit liability at the end of the year ¥1,569 $15
4) Reconciliation of retirement benefit obligations, pension plan assets,
and net defined benefit liability on the balance sheet
For the year ended March 31, 2014Millions of Yen Millions of U.S Dollars
Retirement benefit obligations for funded plans ¥ 285,269 $ 2,771
Pension plan assets (268,186) (2,605)
17,083 165
Retirement benefit obligations for non-funded plans 342,355 3,326
Net defined benefit liability recorded in the balance sheet 359,438 3,492
Net defined benefit liability 359,438 3,492
Net defined benefit liability recorded in the balance sheet ¥ 359,438 $ 3,492
5) Losses (gains) relating to retirement benefits
For the year ended March 31, 2014Millions of Yen Millions of U.S Dollars
Service costs ¥24,079 $233
Interest cost 10,326 100
Expected return on plan assets (4,314) (41)
Amortization of actuarial differences for the period 870 8
Amortization of prior service costs for the period (4,765) (46)
Benefit cost under the simplified valuation method 325 3
Other 55 0
Benefit cost for defined benefit plans ¥26,577 $258
6) Breakdown of items included in total accumulated other comprehen-
sive income
The breakdown of items included in total accumulated other compre-
hensive income (before tax) is as follows.
For the year ended March 31, 2014Millions of Yen Millions of U.S Dollars
Unrecognized actuarial differences ¥(19,850) $(192)
Unrecognized prior service costs (9,133) (88)
Total ¥(28,983) $(281)
7) Breakdown of pension plan assets
General account of Nippon Life 54.3%
Domestic bonds 22.0%
Foreign bonds 15.1%
Domestic stocks 4.4%
Cash and deposits 4.2%
Total 100.0%
8) Calculation method for long-term expected rate of return on plan assets
To determine the long-term expected rate of return on pension plan
assets, the Company takes into consideration the present and fore-
casted allocation of the pension plan assets, and the present and
long-term rates of return that are expected from the diverse assets
that comprise the pension plan assets.
9) Matters relating to the basis for actuarial calculations
The main items in the basis for actuarial calculations as of March 31,
2014 are as follows.
Discount rate 1.6%
Long-term expected rate of return on plan assets 1.6%
10) Accrued retirement benefits as of March 31, 2013 and 2012, consisted
of the following:
Millions of Yen
2013 2012
Retirement benefit obligations ¥(683,722) ¥(698,196)
Pension plan assets 269,678 267,708
Accrued retirement benefit cost (414,044) (430,487)
Unrecognized actuarial differences (7,936) 9,300
Unrecognized prior service costs (13,898) (18,663)
Accrued retirement benefits ¥(435,879) ¥(439,850)
125124

Basic information for the calculation of accrued retirement benefits is
as follows:
Periodic allocation method of estimated retirement benefits Straight-line
Discount rate 2013 and 2012: 1.6%
Expected rate of return on plan assets 2013 and 2012: 1.6%
Method of amortizing actuarial differences
Amortization occurs over a certain period (5 years) using the straight-line method within the average remaining years of service of employees one year after the accrual of liabilities.
Method of amortizing prior service costs
Amortization occurs over a certain period (5 years) using the straight-line method within the average remaining years of service of employees upon accrual of liabilities.
11) Benefit cost of accrued retirement benefits for the fiscal years ended
March 31, 2013 and 2012, was analyzed as follows:
Millions of Yen
2013 2012
Service costs ¥25,265 ¥25,812
Interest cost 11,132 11,352
Expected return on plan assets (4,283) (4,370)
Amortization of actuarial differences 9,354 8,472
Amortization of prior service costs (4,765) (4,765)
Income from abolishment of a part of the retirement benefit system — (92)
Others 2,740 3,108
Net periodic benefit cost ¥39,444 ¥39,516
(3) Defined contribution plans
The Company and its consolidated subsidiaries contributed ¥2,470 million
(U.S.$23 million) to defined contribution plans during the fiscal year ended
March 31, 2014.
12. income taxesThe provision for income taxes is computed based on the pretax income
included in the consolidated statements of income. The asset and liability
approach is used to recognize deferred tax assets and liabilities for the
expected future tax consequences of temporary differences between the
carrying amounts and the tax bases of assets and liabilities. Deferred
taxes are measured by applying the enacted statutory tax rates to the
temporary differences.
13. Foundation FundsFoundation funds serve as the primary source of capital for Japanese mutual
life insurance companies. These funds are similar to loans, as interest pay-
ments, maturity dates and other items must be established at the time of the
offering. In the event of a bankruptcy or similar development, repayment of
the principal and interest on foundation funds is subordinated to the repay-
ment of amounts owed to ordinary creditors and insurance claims and ben-
efit payments owed to policyholders. Upon redemption of foundation funds,
mutual companies are required to make an addition to the reserve for
redemption of foundation funds, which serves as retained earnings, equal to
the amount redeemed. As a result, the full amount of foundation funds
remains in net assets even after redemption. Foundation funds are therefore
positioned as a mutual company’s core capital, which is equivalent to the
stated capital of a joint-stock company. The Company redeemed ¥50,000
million (U.S.$485 million), ¥50,000 million and ¥50,000 million of founda-
tion funds and credited the same amount to reserve for redemption of
foundation funds prescribed in Article 56 of the Insurance Business Act as
of March 31, 2014, 2013 and 2012, respectively. ¥50,000 million and
¥100,000 million of foundation funds were offered pursuant to Article 60 of
the Insurance Business Act during the fiscal years ended March 31,2013 and
2012, respectively.
14. Pledged assetsAssets pledged as collateral by securities, lease receivables, and investments
in leases, land and buildings as of March 31, 2014, were ¥1,790,241 million
(U.S.$17,394 million), ¥18,790 million (U.S.$182 million), ¥252 million
(U.S.$2 million) and ¥56 million (U.S.$0 million), respectively. The total
amount of loans covered by the aforementioned assets was ¥816,568 mil-
lion (U.S.$7,934 million) as of March 31, 2014.
These amounts included ¥905,314 million (U.S.$8,796 million) of secu-
rities deposited and ¥802,691 million (U.S.$7,799 million) of cash received
as collateral under the securities lending transactions secured by cash as of
March 31, 2014.
Assets pledged as collateral by securities, lease receivables, and invest-
ments in leases, land and buildings as of March 31, 2013, were ¥2,134,013
million, ¥15,109 million, ¥252 million and ¥59 million, respectively. The total
amount of loans covered by the aforementioned assets was ¥1,223,162
million as of March 31, 2013.
These amounts included ¥1,334,903 million of securities deposited and
¥1,212,149 million of cash received as collateral under the securities lending
transactions secured by cash as of March 31, 2013.
Assets pledged as collateral by securities, lease receivables, and invest-
ments in leases, land and buildings as of March 31, 2012, were ¥1,260,121
million, ¥6,755 million, ¥2,952 million and ¥274 million respectively. The
total amount of loans covered by the aforementioned assets was ¥951,867
million as of March 31, 2012.
These amounts included ¥1,083,818 million of securities deposited and
¥946,476 million of cash received as collateral under the securities lending
transactions secured by cash as of March 31, 2012.
Cover FeatureBusiness Perform
anceM
anagement of N
ippon Life Nippon Life’s Products and Services
Company Inform
ationFinancial Data
Operational Data
125124

15. investments in nonconsolidated subsidiariesThe total amounts of stocks and investments in nonconsolidated subsidiaries
and affiliates were ¥192,256 million (U.S.$1,868 million), ¥170,892 million
and ¥129,583 million as of March 31, 2014, 2013 and 2012, respectively.
On May 21, 2014, the Company agreed to acquire a de facto holding of
20% of the shares of PT Asuransi Jiwa Sequis Life, a subsidiary of PT Gunung
Sewu Kencana, via a holding company.
On March 22, 2012, the Company reached an agreement with Reliance
Capital Limited, which is the parent company of Reliance Capital Asset Man-
agement Limited, an affiliate of the Reliance Group, to acquire 26% of the
shares of Reliance Capital Asset Management Limited.
16. loans1) The total amount of loans to bankrupt borrowers, delinquent loans, loans
that are delinquent for over three months and restructured loans, which
were included in loans, was ¥39,160 million (U.S.$380 million), ¥43,153
million and ¥49,883 million as of March 31, 2014, 2013 and 2012,
respectively.
i) The balances of loans to bankrupt borrowers and delinquent loans
were ¥2,336 million (U.S.$22 million) and ¥32,074 million (U.S.$311
million) as of March 31, 2014, ¥2,663 million and ¥34,890 million as
of March 31, 2013, and ¥3,042 million and ¥34,561 million as of
March 31, 2012.
Loans to bankrupt borrowers are loans for which interest is not
accrued as income, except for a portion of loans written off, and to
which any event specified in Article 96, Paragraph 1, Item 3 (a) to (e)
or Item 4 of the Order for Enforcement of the Corporation Tax Act has
occurred. Interest is not accrued as income for the loans since the
recovery of principal or interest on the loans is unlikely due to the fact
that principal repayments and interest payments are overdue for a
significant period of time or for other reasons.
Delinquent loans are loans with interest not accrued and exclude
loans to bankrupt borrowers and loans with interest payments extended
with the objective of restructuring or supporting the borrowers.
ii) The balance of loans delinquent for over three months was ¥23 mil-
lion (U.S.$0 million) as of March 31, 2014. There were no loans
delinquent for over three months as of March 31, 2013 and 2012.
Loans that are delinquent for over three months are loans with
principal or interest unpaid for over three months beginning one day
after the due date based on the loan agreement. These loans exclude
loans classified as loans to bankrupt borrowers and delinquent loans.
iii) The balances of restructured loans were ¥4,726 million (U.S.$45
million), ¥5,599 million and ¥12,278 million as of March 31, 2014,
2013 and 2012, respectively.
Restructured loans are loans that provide certain concessions
favorable to borrowers with the intent of supporting the borrowers’
restructuring, such as by reducing or exempting interest, postponing
principal or interest payments, releasing credits, or providing other
benefits to the borrowers. These loans exclude loans classified as
loans to bankrupt borrowers, delinquent loans, and loans delinquent
for over three months.
2) Direct write-offs of loans decreased the balances of loans to bankrupt
borrowers and delinquent loans by ¥356 million (U.S.$3 million) and
¥726 million (U.S.$7 million) as of March 31, 2014, ¥495 million and
¥1,075 million as of March 31, 2013, and ¥808 million and ¥1,860 mil-
lion as of March 31, 2012.
17. loan CommitmentsThe amounts of commitments related to loans and loans outstanding were
¥98,655 million (U.S.$958 million), ¥127,665 million and ¥67,988 million as
of March 31, 2014, 2013 and 2012, respectively.
18. Contributions to the life insurance Policyholder Protection Fund and organization
Of the maximum borrowing amount from the Life Insurance Policyholders
Protection Corporation of Japan, which is provided for in Article 37-4 of the
Order for Enforcement of the Insurance Business Act, the amounts applied to
the Company were estimated to be ¥85,750 million (U.S.$833 million),
¥86,176 million and ¥84,947 million as of March 31, 2014, 2013 and 2012,
respectively. The amounts contributed to said corporation were recorded
within operating expenses for the fiscal year.
19. impairment losses i) Method for grouping the assets
Leased property and idle property are classified as one asset group
per structure. Assets utilized for insurance business operations are clas-
sified into one asset group.
ii) Circumstances causing impairment losses
The Company observed a marked decrease in profitability or market value
in some of the fixed asset groups. The book value of fixed assets was
reduced to the recoverable amount and impairment losses were recog-
nized as extraordinary losses.
127126

iii) Breakdown of asset groups that recognized impairment losses:
For the year ended March 31, 2014Millions of Yen
Purpose of use Land Land lease rights Buildings Total
Leased property ¥2,475 ¥— ¥1,749 ¥4,224
Idle property 373 14 116 504
Total ¥2,848 ¥ 14 ¥1,865 ¥4,728
For the year ended March 31, 2013Millions of Yen
Purpose of use Land Land lease rights Buildings Total
Leased property ¥ 8,808 ¥1,105 ¥4,234 ¥14,148
Idle property 1,964 30 1,459 3,453
Total ¥10,772 ¥1,135 ¥5,693 ¥17,602
For the year ended March 31, 2012Millions of Yen
Purpose of use Land Land lease rights Buildings Total
Leased property ¥6,619 ¥26 ¥4,472 ¥11,119
Idle property 2,464 — 317 2,781
Total ¥9,084 ¥26 ¥4,789 ¥13,900
For the year ended March 31, 2014Millions of U.S. Dollars
Purpose of use Land Land lease rights Buildings Total
Leased property $24 $— $16 $41
Idle property 3 0 1 4
Total $27 $ 0 $18 $45
iv) Calculation method of recoverable amount
The recoverable amount used for the measurement of impairment losses
is based on the net realizable value upon sales of the assets or the dis-
counted future cash flows.
The discount rate used in the calculation of future cash flows is in
principle 4.0%. Net realizable values are determined based on appraisals
performed in accordance with the “Real Estate Appraisal Standards” or
posted land prices.
20. deferred tax assets and liabilities(1) Deferred tax assets/liabilities consisted of the following:
Millions of YenMillions of U.S. Dollars
2014 2013 2012 2014
Deferred tax assets ¥ 1,212,549 ¥ 1,129,639 ¥1,093,007 $ 11,781
Valuation allowance for deferred tax assets (55,380) (73,841) (81,538) (538)
Subtotal 1,157,168 1,055,798 1,011,469 11,243
Deferred tax liabilities (1,493,344) (1,174,488) (534,997) (14,509)
Net deferred tax assets/(liabilities) ¥ (336,175) ¥ (118,690) ¥ 476,472 $ (3,266)
The major components causing deferred tax assets/liabilities were
as follows:
Millions of YenMillions of U.S. Dollars
2014 2013 2012 2014
Deferred tax assets:
Policy reserves and other reserves ¥ 747,389 ¥ 698,811 ¥712,417 $ 7,261
Reserve for price fluctuations in investments in securities 191,356 135,897 106,193 1,859
Accrued retirement benefits — 135,434 137,252 —
Net defined benefit liability 119,401 — — 1,160
Allowance for doubtful accounts 3,192 4,325 6.618 31
Deferred tax liabilities:
Net unrealized gains on available-for-sale securities ¥1,435,895 ¥1,133,731 ¥494,953 $13,951
(2) The statutory tax rates were 33.2% for the fiscal years ended March 31,
2014 and 2013, and 36.1% for the fiscal year ended March 31, 2012.
The main factors in the difference between the statutory tax rates and
the effective income tax rates were as follows:
2014 2013 2012
Reserve for dividends to policyholders (21.2)% (17.6)% (12.6)%
Loss on valuation of securities 2.8 % 1.9 % —
Impact from a change in the tax rate 2.9 % — 31.0 %
(3) In conjunction with the promulgation of the “Act for Partial Revision to
the Income Tax Act” (Act No. 10 of 2014), the statutory tax rate applied
to the calculation of deferred tax assets and deferred tax liabilities of
33.2% was changed to 30.7% for collections and payments expected to
be made in the period from April 1, 2014 to March 31, 2015.
As a result of this change, as of March 31, 2014, deferred tax liabili-
ties increased by ¥8,478 million (U.S.$82 million), net unrealized gains
on available-for-sale securities, net of tax increased by ¥598 million
(U.S.$5 million), and land revaluation differences increased by ¥1 million
(U.S.$0 million), while deferred tax assets decreased by ¥152 million
(U.S.$1 million) and deferred tax liabilities for land revaluation decreased
by ¥1 million (U.S.$0 million). At the same time, income taxes—deferred
increased by ¥9,231 million (U.S.$89 million).
In line with the promulgation of the “Act for Partial Revision of the
Income Tax Act, etc. for the Purpose of Creating Taxation System Respond-
ing to Changes in Economic and Social Structures” (Act No. 114 of 2011)
and the “Act on Special Measures for Securing Financial Resources Neces-
sary to Implement Measures for Reconstruction following the Great East
Japan Earthquake” (Act No. 117 of 2011), the statutory tax rate applied
to measure deferred tax assets and liabilities was changed from 36.1%.
Cover FeatureBusiness Perform
anceM
anagement of N
ippon Life Nippon Life’s Products and Services
Company Inform
ationFinancial Data
Operational Data
127126

For items that are expected to be collected or paid during the period from
April 1, 2012, to March 31, 2015, the rate was changed to 33.2% and
for items that are expected to be collected or paid on or after April 1,
2015, the rate was changed to 30.7%.
As a result of this change, as of March 31, 2012, deferred tax assets
and deferred tax liabilities for land revaluation decreased by ¥61,556
million and ¥25,001 million, respectively, net unrealized gains on available-
for-sale securities, net of tax and land revaluation differences increased by
¥87,324 million and ¥25,001 million, respectively, and income taxes—
deferred increased by ¥148,332 million.
21. other extraordinary GainsIn the fiscal year ended March 31, 2013, other extraordinary gains represent
a reversal of accrued losses from supporting closely related companies.
22. other Comprehensive incomeThe components of other comprehensive income for the years ended March
31, 2013 and 2012, were as follows:
(1) Reclassification adjustments to profit or loss relating to other compre-
hensive income
For the year ended March 31, 2014Millions of Yen Millions of U.S. Dollars
Net unrealized gains on available-for-sale securities, net of tax:
Gains arising during the year ¥1,194,238 $11,603
Reclassification adjustments to profit or loss (146,497) ¥1,047,740 (1,423) $10,180
Deferred losses on derivatives under hedge accounting, net of tax:
Losses arising during the year (86,933) (844)
Reclassification adjustments to profit or loss 320 (86,613) 3 (841)
Foreign currency translation adjustments:
Gains arising during the year 43,410 421
Reclassification adjustments to profit or loss 2,726 46,137 26 448
Share of other comprehensive income of associates accounted for under the equity method:
Gains arising during the year 2,203 21
Reclassification adjustments to profit or loss (241) 1,961 (2) 19
Amount before income tax effect 1,009,226 9,805
Income tax effect (272,362) (2,646)
Total other comprehensive income ¥ 736,864 $ 7,159
For the year ended March 31, 2013Millions of Yen
Net unrealized gains on available-for-sale securities, net of tax:
Gains arising during the year ¥2,045,785
Reclassification adjustments to profit or loss 80,364 ¥2,126,149
Deferred losses on derivatives under hedge accounting, net of tax:
Losses arising during the year (94,119)
Reclassification adjustments to profit or loss (2,805) (96,924)
Foreign currency translation adjustments:
Gains arising during the year 26,151
Reclassification adjustments to profit or loss — 26,151
Share of other comprehensive income of associates accounted for under the equity method:
Gains arising during the year 4,696
Reclassification adjustments to profit or loss (132) 4,563
Amount before income tax effect 2,059,940
Income tax effect (607,362)
Total other comprehensive income ¥1,452,577
For the year ended March 31, 2012Millions of Yen
Net unrealized gains on available-for-sale securities, net of tax:
Gains arising during the year ¥326,676
Reclassification adjustments to profit or loss 6,037 ¥332,713
Deferred losses on derivatives under hedge accounting, net of tax:
Losses arising during the year (20,743)
Reclassification adjustments to profit or loss — (20,743)
Foreign currency translation adjustments:
Losses arising during the year (2,671)
Reclassification adjustments to profit or loss — (2,671)
Share of other comprehensive income of associates accounted for under the equity method:
Gains arising during the year 1,342
Reclassification adjustments to profit or loss (95) 1,246
Amount before income tax effect 310,545
Income tax effect (23,543)
Total other comprehensive income ¥287,002
129128

(2) Income tax effect relating to other comprehensive income
For the year ended March 31, 2014Millions of Yen Millions of U.S. Dollars
Before income
tax effectIncome
tax effect
After income
tax effect
Before income
tax effectIncome
tax effect
After income
tax effect
Net unrealized gains on available-for-sale securities, net of tax ¥1,047,740 ¥(298,947) ¥748,792 $10,180 $(2,904) $7,275
Deferred losses on derivatives under hedge accounting, net of tax (86,613) 26,585 (60,027) (841) 258 (583)
Foreign currency translation adjustments 46,137 — 46,137 448 — 448
Share of other comprehensive income of associates accounted for under the equity method 1,961 — 1,961 19 — 19
Total other comprehensive income ¥1,009,226 ¥(272,362) ¥736,864 $ 9,805 $(2,646) $7,159
For the year ended March 31, 2013Millions of Yen
Before income
tax effectIncome
tax effect
After income
tax effect
Net unrealized gains on available-for-sale securities, net of tax ¥2,126,149 ¥(639,080) ¥1,487,069
Deferred losses on derivatives under hedge accounting, net of tax (96,924) 29,765 (67,159)
Land revaluation differences –– 1,952 1,952
Foreign currency translation adjustments 26,151 –– 26,151
Share of other comprehensive income of associates accounted for under the equity method 4,563 –– 4,563
Total other comprehensive income ¥2,059,940 ¥(607,362) ¥1,452,577
For the year ended March 31, 2012Millions of Yen
Before income
tax effectIncome
tax effect
After income
tax effect
Net unrealized gains on available-for-sale securities, net of tax ¥332,713 ¥(55,934) ¥276,778
Deferred losses on derivatives under hedge accounting, net of tax (20,743) 6,941 (13,802)
Land revaluation differences — 25,450 25,450
Foreign currency translation adjustments (2,671) — (2,671)
Share of other comprehensive income of associates accounted for under the equity method 1,246 — 1,246
Total other comprehensive income ¥310,545 ¥(23,543) ¥287,002
23. othersThe following items are disclosed in the nonconsolidated statements and not
required to be disclosed in the consolidated statements by the Japanese
Insurance Business Act.
• Net Assets Provided for in the Ordinance for Enforcement of the Insurance
Business Act
• Policy Reserves for Reinsurance Contracts Provided in Accordance with
Article 71, Paragraph 1 of the Ordinance for Enforcement of the Insurance
Business Act
• Investment Income and Expenses
• Policy Reserves for Ceded Reinsurance
24. subsequent event Approval of proposed appropriation of surplus at the annual meeting of the
representatives of policyholders.
The nonconsolidated proposed appropriations of surplus for the fiscal
year ended March 31, 2014, were approved as planned at the annual meet-
ing of the representatives of policyholders held on July 2, 2014.
Cover FeatureBusiness Perform
anceM
anagement of N
ippon Life Nippon Life’s Products and Services
Company Inform
ationFinancial Data
Operational Data
129128

NONCONSOLIDateD FINaNCIaL StateMeNtS6. nonconsolidated Balance sheetsNippon Life Insurance Company
Millions of YenMillions of U.S. Dollars
As of March 31 2014 2013 2012 2014
ASSETS:
Cash and deposits (Note 3): ¥ 467,727 ¥ 502,956 ¥ 422,236 $ 4,544
Cash 310 550 562 3
Deposits 467,416 502,405 421,673 4,541
Call loans 349,400 203,900 212,300 3,394
Receivables under securities borrowing transactions 159,856 150,709 211,928 1,553
Monetary receivables purchased (Note 3) 570,632 756,320 883,070 5,544
Investments in securities (Notes 3, 5, 15 and 16):
National government bonds 17,578,858 16,543,499 14,668,001 170,801
Local government bonds 1,522,414 1,586,508 1,583,685 14,792
Corporate bonds 2,944,847 3,092,231 3,218,751 28,612
Domestic stocks 7,334,077 6,917,409 6,071,844 71,259
Foreign securities 14,258,244 13,556,511 11,608,261 138,537
Other securities 730,571 578,037 372,215 7,098
Subtotal 44,369,012 42,274,197 37,522,761 431,101
Loans (Notes 3, 17 and 18):
Policy loans 782,280 835,460 896,347 7,600
Industrial and consumer loans 7,746,698 7,746,341 7,825,262 75,269
Subtotal 8,528,979 8,581,801 8,721,609 82,869
Tangible fixed assets (Notes 4, 6, 15 and 23):
Land 1,185,348 1,144,344 1,198,419 11,517
Buildings 474,175 484,567 515,114 4,607
Lease assets 3,740 2,713 3,205 36
Construction in progress 42,930 31,132 13,500 417
Other tangible fixed assets 12,020 13,543 20,163 116
Subtotal 1,718,217 1,676,301 1,750,402 16,694
Intangible fixed assets:
Software 87,100 93,186 110,219 846
Other intangible fixed assets 92,191 91,804 89,952 895
Subtotal 179,292 184,990 200,172 1,742
Reinsurance receivables 260 222 222 2
Other assets:
Accounts receivable 91,782 152,896 268,391 891
Prepaid expenses 7,871 8,706 9,822 76
Accrued income 255,976 236,498 220,629 2,487
Money on deposit 37,310 38,575 39,638 362
Deposits for futures transactions 5,753 6,285 5,182 55
Futures transactions variation margin — 46 25 —
Derivative financial instruments (Note 3) 10,151 71,453 28,718 98
Suspense 6,331 6,411 13,446 61
Other assets 9,052 10,019 19,049 87
Subtotal 424,228 530,894 604,904 4,121
Deferred tax assets (Note 24) — — 466,934 —
Customers’ liability for acceptances and guarantees 30,137 29,233 26,755 292
Allowance for doubtful accounts (7,024) (8,704) (13,885) (68)
Total assets ¥56,790,719 ¥54,882,824 ¥51,009,414 $551,794
The accompanying notes are an integral part of the nonconsolidated financial statements.
131130

Millions of YenMillions of U.S. Dollars
As of March 31 2014 2013 2012 2014LIABILITIES: Policy reserves and other reserves: Reserve for outstanding claims ¥ 199,582 ¥ 203,848 ¥ 206,634 $ 1,939 Policy reserves (Notes 19 and 22) 47,515,496 46,161,263 44,448,079 461,674 Reserve for dividends to policyholders (Note 9) 1,070,852 1,105,093 1,120,336 10,404 Subtotal 48,785,930 47,470,205 45,775,051 474,017 Reinsurance payables 343 271 335 3 Corporate bonds (Notes 3 and 10) 157,040 157,040 — 1,525 Other liabilities: Cash received as collateral under securities lending transactions 802,691 1,212,021 935,584 7,799 Loans payable 9,127 25 32 88 Income taxes payable 101,948 45,091 — 990 Accounts payable 124,982 264,435 332,320 1,214 Accrued expenses 57,257 63,373 62,518 556 Deferred income 22,870 22,246 21,730 222 Deposits received 98,158 99,495 101,190 953 Guarantee deposits received 84,102 84,171 88,442 817 Futures transactions variation margin 296 155 42 2 Derivative financial instruments 288,867 330,715 218,942 2,806 Lease obligations 4,930 4,262 4,565 47 Asset retirement obligations 2,031 2,035 2,012 19 Suspense receipts 9,868 19,758 12,201 95 Other liabilities — 128 10,891 — Subtotal 1,607,132 2,147,917 1,790,476 15,615 Accrued bonuses for directors and audit and supervisory board members 50 52 53 0 Accrued retirement benefits (Note 12) 385,283 433,184 437,421 3,743 Accrued retirement benefits for directors and
audit and supervisory board members 4,403 4,374 4,564 42 Reserve for program points 12,609 9,564 7,238 122 Accrued losses from supporting closely related companies — — 397 — Reserve for loss on disaster — — 739 — Reserve for price fluctuations in investments in securities 623,312 427,529 333,710 6,056 Deferred tax liabilities 328,632 123,652 — 3,193 Deferred tax liabilities for land revaluation 128,236 129,132 142,498 1,245 Acceptances and guarantees 30,137 29,233 26,755 292Total liabilities 52,063,111 50,932,158 48,519,242 505,859NET ASSETS: Foundation funds (Note 14) 250,000 300,000 300,000 2,429 Reserve for redemption of foundation funds (Note 14) 1,000,000 950,000 900,000 9,716 Reserve for revaluation 651 651 651 6 Surplus: Legal reserve for deficiencies 13,270 12,571 11,889 128 Other surplus reserves: 426,752 338,006 330,392 4,146 Contingency funds 71,917 71,917 71,917 698 Reserve for social public welfare assistance 259 236 213 2 Reserve for reduction entry of real estate 42,693 34,666 31,746 414 Reserve for reduction entry of real estate to be purchased 33 — — 0 Other reserves 170 170 170 1 Unappropriated surplus 311,679 231,016 226,344 3,028 Total surplus 440,022 350,577 342,281 4,275 Total foundation funds and others 1,690,674 1,601,228 1,542,932 16,427 Net unrealized gains on available-for-sale securities, net of tax 3,256,652 2,508,046 1,021,724 31,642 Deferred losses on derivatives under hedge accounting,
net of tax (134,156) (74,128) (6,969) (1,303) Land revaluation differences (85,561) (84,481) (67,515) (831) Total valuations, conversions, and others 3,036,934 2,349,436 947,239 29,507Total net assets 4,727,608 3,950,665 2,490,171 45,934Total liabilities and net assets ¥56,790,719 ¥54,882,824 ¥51,009,414 $551,794
The accompanying notes are an integral part of the nonconsolidated financial statements.
Cover FeatureBusiness Perform
anceM
anagement of N
ippon Life Nippon Life’s Products and Services
Company Inform
ationFinancial Data
Operational Data
131130

7. nonconsolidated statements of incomeNippon Life Insurance Company
Millions of YenMillions of U.S. Dollars
For the years ended March 31 2014 2013 2012 2014ORDINARY INCOME: Revenues from insurance and reinsurance: Insurance premiums ¥4,824,669 ¥5,342,079 ¥5,367,387 $46,877 Reinsurance revenue 907 777 885 8 Subtotal 4,825,577 5,342,857 5,368,272 46,886 Investment income (Note 21): Interest, dividends, and other income: 1,296,640 1,217,010 1,198,148 12,598 Interest on deposits and savings 268 272 285 2 Interest on securities and dividends 1,029,275 935,962 904,267 10,000 Interest on loans 171,827 178,296 185,293 1,669 Real estate rental income 79,237 82,608 85,868 769 Other income 16,031 19,870 22,434 155 Gain from assets held in trust, net 5 13 16 0 Gain on sales of securities 260,438 192,348 233,923 2,530 Gain on redemptions of securities 248 284 239 2 Foreign exchange gains, net 1,693 1,201 — 16 Reversal of allowance for doubtful accounts 1,667 4,561 5,964 16 Other investment income 441 857 2,995 4 Gain from separate accounts, net 122,626 144,611 18,640 1,191 Subtotal 1,683,763 1,560,888 1,459,929 16,359 Other ordinary income: Income from annuity riders 7,836 7,769 10,328 76 Income from deferred benefits 153,912 152,482 171,335 1,495 Reversal of reserve for outstanding claims 4,266 2,786 41,933 41 Other ordinary income 38,733 27,445 23,187 376 Subtotal 204,748 190,483 246,785 1,989Total ordinary income 6,714,089 7,094,229 7,074,986 65,235
ORDINARY EXPENSES: Benefits and other payments: Death and other claims 1,016,847 1,059,742 1,167,385 9,879 Annuity payments 857,662 686,205 649,373 8,333 Health and other benefits 769,645 828,082 804,484 7,478 Surrender benefits 839,852 834,495 1,011,204 8,160 Other refunds 292,927 207,332 252,933 2,846 Reinsurance premiums 1,284 1,271 1,337 12 Subtotal 3,778,221 3,617,129 3,886,720 36,710 Provision for policy reserves: Provision for policy reserves 1,354,233 1,713,183 1,341,183 13,158 Provision for interest on reserve for dividends to policyholders (Note 9) 24,715 25,830 27,087 240 Subtotal 1,378,948 1,739,014 1,368,270 13,398 Investment expenses (Note 21): Interest expenses 7,792 4,717 2,658 75 Loss on sales of securities 57,738 72,088 154,062 560 Loss on valuation of securities 22,254 98,668 29,364 216 Loss on redemptions of securities 24,628 30,526 16,265 239 Loss on derivative financial instruments, net 36,508 176,689 157,980 354 Foreign exchange losses, net — — 6,282 — Write-offs of loans 0 1 3 0 Depreciation of rental real estate and other assets 15,410 23,954 25,848 149 Other investment expenses 21,976 21,503 21,993 213 Subtotal 186,309 428,149 414,459 1,810 Operating expenses (Note 20) 561,860 566,920 572,065 5,459 Other ordinary expenses: Deferred benefit payments 197,808 243,173 248,424 1,921 Taxes 34,643 37,376 37,392 336 Depreciation 47,308 57,839 50,511 459 Other ordinary expenses 16,371 15,883 15,573 159 Subtotal 296,133 354,273 351,902 2,877Total ordinary expenses 6,201,473 6,705,486 6,593,418 60,255Ordinary profit ¥ 512,616 ¥ 388,742 ¥ 481,568 $ 4,980
133132

Millions of YenMillions of U.S. Dollars
For the years ended March 31 2014 2013 2012 2014Extraordinary gains: Gain on disposals of fixed assets ¥ 2,750 ¥ 4,138 ¥ 72 $ 26 Reversal of reserve for price fluctuations in investments in securities — — 13,293 — Reversal of reserve for loss on disaster — 326 335 — Gain on liquidation of subsidiaries and affiliates 40,486 — — 393 Other extraordinary gains (Note 27) — 388 — — Subtotal 43,236 4,853 13,700 420
Extraordinary losses: Loss on disposals of fixed assets 6,252 31,130 7,013 60 Impairment losses (Note 23) 4,728 17,602 13,900 45 Provision for reserve for price fluctuations in investments in securities 195,783 93,819 — 1,902 Loss on reduction entry of real estate 96 2,531 57 0 Contributions for assisting social public welfare 1,477 1,477 1,477 14 Subtotal 208,338 146,560 22,449 2,024
Surplus before income taxes 347,515 247,035 472,819 3,376Income taxes (Notes 13 and 24): Current 142,385 66,158 28,821 1,383 Deferred (79,286) (29,745) 222,112 (770) Total income taxes 63,098 36,412 250,933 613Net surplus ¥ 284,416 ¥ 210,622 ¥ 221,886 $ 2,763
The accompanying notes are an integral part of the nonconsolidated financial statements.
Cover FeatureBusiness Perform
anceM
anagement of N
ippon Life Nippon Life’s Products and Services
Company Inform
ationFinancial Data
Operational Data
133132

8. nonconsolidated statements of Changes in net assetsNippon Life Insurance Company
Millions of yen
Foundation funds and others
Foundation funds
(Note 14)
Reserve for redemption
of foundation funds
(Note 14)
Reserve for
revaluation
Surplus
Total foundation funds and
others
Legal reserve for deficiencies
Other surplus reserves
Total surplusFor the year ended March 31, 2012
Contingency funds
Reserve for social public
welfare assistance
Reserve for reduction entry of
real estateOther
reserves
Un- appropriated
surplus
Beginning balance ¥250,000 ¥850,000 ¥651 ¥11,193 ¥71,917 ¥ 190 ¥31,701 ¥170 ¥ 231,264 ¥ 346,435 ¥1,447,086
Increase/decrease:
Issuance of foundation funds 100,000 100,000
Additions to reserve for dividends to policyholders (Note 9) (175,513) (175,513) (175,513)
Additions to legal reserve for deficiencies 696 (696) — —
Additions to reserve for redemption of foundation funds 50,000 (50,000) (50,000) —
Interest on foundation funds (3,508) (3,508) (3,508)
Net surplus 221,886 221,886 221,886
Redemption of foundation funds (50,000) (50,000)
Additions to reserve for social public welfare assistance 1,500 (1,500) — —
Reversal of reserve for social public welfare assistance (1,477) 1,477 — —
Additions to reserve for reduction entry of real estate 714 (714) — —
Reversal of reserve for reduction entry of real estate (668) 668 — —
Reversal of land revaluation differences 2,981 2,981 2,981
Net change, excluding foundation funds and others
Net change 50,000 50,000 — 696 — 23 45 — (4,919) (4,154) 95,845
Ending balance ¥300,000 ¥900,000 ¥651 ¥11,889 ¥71,917 ¥ 213 ¥31,746 ¥170 ¥ 226,344 ¥ 342,281 ¥1,542,932
Millions of yen
Valuations, conversions, and others
Total net assetsFor the year ended March 31, 2012
Net unrealized gains on available-for-sale securities, net of tax
Deferred losses on derivatives under hedge accounting, net of tax
Land revaluation differences
Total valuations, conversions, and others
Beginning balance ¥ 745,036 ¥ 6,832 ¥(89,985) ¥661,884 ¥2,108,971
Increase/decrease:
Issuance of foundation funds 100,000
Additions to reserve for dividends to policyholders (Note 9) (175,513)
Additions to legal reserve for deficiencies —
Additions to reserve for redemption of foundation funds —
Interest on foundation funds (3,508)
Net surplus 221,886
Redemption of foundation funds (50,000)
Additions to reserve for social public welfare assistance —
Reversal of reserve for social public welfare assistance —
Additions to reserve for reduction entry of real estate —
Reversal of reserve for reduction entry of real estate —
Reversal of land revaluation differences 2,981
Net change, excluding foundation funds and others 276,688 (13,802) 22,469 285,355 285,355
Net change 276,688 (13,802) 22,469 285,355 381,200
Ending balance ¥1,021,724 ¥ (6,969) ¥(67,515) ¥947,239 ¥2,490,171
135134

Millions of yen
Foundation funds and others
Foundation funds
(Note 14)
Reserve for redemption
of foundation funds
(Note 14)
Reserve for
revaluation
Surplus
Total foundation funds and
others
Legal reserve for deficiencies
Other surplus reserves
Total surplusFor the year ended March 31, 2013
Contingency funds
Reserve for social public
welfare assistance
Reserve for reduction entry of
real estateOther
reserves
Un- appropriated
surplus
Beginning balance ¥300,000 ¥900,000 ¥651 ¥11,889 ¥71,917 ¥ 213 ¥31,746 ¥170 ¥ 226,344 ¥ 342,281 ¥1,542,932
Increase/decrease:
Issuance of foundation funds 50,000 50,000
Additions to reserve for dividends to policyholders (Note 9) (167,313) (167,313) (167,313)
Additions to legal reserve for deficiencies 682 (682) — —
Additions to reserve for redemption of foundation funds 50,000 (50,000) (50,000) —
Interest on foundation funds (3,930) (3,930) (3,930)
Net surplus 210,622 210,622 210,622
Redemption of foundation funds (50,000) (50,000)
Additions to reserve for social public welfare assistance 1,500 (1,500) — —
Reversal of reserve for social public welfare assistance (1,477) 1,477 — —
Additions to reserve for reduction entry of real estate 3,604 (3,604) — —
Reversal of reserve for reduction entry of real estate (685) 685 — —
Reversal of land revaluation differences 18,917 18,917 18,917
Net change, excluding foundation funds and others
Net change — 50,000 — 682 — 23 2,919 — 4,672 8,296 58,296
Ending balance ¥300,000 ¥950,000 ¥651 ¥12,571 ¥71,917 ¥ 236 ¥34,666 ¥170 ¥ 231,016 ¥ 350,577 ¥1,601,228
Millions of yen
Valuations, conversions, and others
Total net assetsFor the year ended March 31, 2013
Net unrealized gains on available-for-sale securities, net of tax
Deferred losses on derivatives under hedge accounting, net of tax
Land revaluation differences
Total valuations, conversions, and others
Beginning balance ¥1,021,724 ¥ (6,969) ¥(67,515) ¥ 947,239 ¥2,490,171
Increase/decrease:
Issuance of foundation funds 50,000
Additions to reserve for dividends to policyholders (Note 9) (167,313)
Additions to legal reserve for deficiencies —
Additions to reserve for redemption of foundation funds —
Interest on foundation funds (3,930)
Net surplus 210,622
Redemption of foundation funds (50,000)
Additions to reserve for social public welfare assistance —
Reversal of reserve for social public welfare assistance —
Additions to reserve for reduction entry of real estate —
Reversal of reserve for reduction entry of real estate —
Reversal of land revaluation differences 18,917
Net change, excluding foundation funds and others 1,486,322 (67,159) (16,965) 1,402,197 1,402,197
Net change 1,486,322 (67,159) (16,965) 1,402,197 1,460,493
Ending balance ¥2,508,046 ¥(74,128) ¥(84,481) ¥2,349,436 ¥3,950,665
Cover FeatureBusiness Perform
anceM
anagement of N
ippon Life Nippon Life’s Products and Services
Company Inform
ationFinancial Data
Operational Data
135134

Millions of yen
Foundation funds and others
Foundation funds
(Note 14)
Reserve for redemption
of foundation funds
(Note 14)
Reserve for
revaluation
Surplus
Total foundation funds and
others
Legal reserve for deficiencies
Other surplus reserves
Total surplusFor the year ended March 31, 2014
Contingency funds
Reserve for social public
welfare assistance
Reserve for reduction
entry of real estate
Reserve for reduction
entry of real estate to be purchased
Other reserves
Un- appropriated
surplus
Beginning balance ¥300,000 ¥ 950,000 ¥651 ¥12,571 ¥71,917 ¥ 236 ¥34,666 — ¥170 ¥ 231,016 ¥ 350,577 ¥1,601,228
Cumulative effect of change in accounting policies 24,705 24,705 24,705
Beginning balance after reflecting accounting policy changes 300,000 950,000 651 12,571 71,917 236 34,666 — 170 255,722 375,282 1,625,934
Increase/decrease:
Additions to reserve for dividends to policyholders (Note 9) (167,172) (167,172) (167,172)
Additions to legal reserve for deficiencies 699 (699) — —
Additions to reserve for redemption of foundation funds 50,000 (50,000) (50,000) —
Interest on foundation funds (3,585) (3,585) (3,585)
Net surplus 284,416 284,416 284,416
Redemption of foundation funds (50,000) (50,000)
Additions to reserve for social public welfare assistance 1,500 (1,500) — —
Reversal of reserve for social public welfare assistance (1,477) 1,477 — —
Additions to reserve for reduction entry of real estate 9,868 (9,868) — —
Reversal of reserve for reduction entry of real estate (1,841) 1,841 — —
Additions to reserve for reduction entry of real estate to be purchased 33 (33) — —
Reversal of land revaluation differences 1,080 1,080 1,080
Net change, excluding foundation funds and others
Net change (50,000) 50,000 — 699 — 23 8,027 33 — 55,957 64,740 64,740
Ending balance ¥250,000 ¥1,000,000 ¥651 ¥13,270 ¥71,917 ¥ 259 ¥42,693 ¥33 ¥170 ¥ 311,679 ¥ 440,022 ¥1,690,674
Millions of Yen
Valuations, conversions, and others
Total net assetsFor the year ended March 31, 2014
Net unrealized gains on available-for-sale securities, net of tax
Deferred losses on derivatives under hedge accounting, net of tax
Land revaluation differences
Total valuations, conversions, and others
Beginning balance ¥2,508,046 ¥ (74,128) ¥(84,481) ¥2,349,436 ¥3,950,665
Cumulative effect of change in accounting policies 24,705
Beginning balance after reflecting accounting policy changes 2,508,046 (74,128) (84,481) 2,349,436 3,975,371
Increase/decrease:
Additions to reserve for dividends to policyholders (Note 9) (167,172)
Additions to legal reserve for deficiencies —
Additions to reserve for redemption of foundation funds —
Interest on foundation funds (3,585)
Net surplus 284,416
Redemption of foundation funds (50,000)
Additions to reserve for social public welfare assistance —
Reversal of reserve for social public welfare assistance —
Additions to reserve for reduction entry of real estate —
Reversal of reserve for reduction entry of real estate —
Additions to reserve for reduction entry of real estate to be purchased —
Reversal of land revaluation differences 1,080
Net change, excluding foundation funds and others 748,605 (60,027) (1,080) 687,497 687,497
Net change 748,605 (60,027) (1,080) 687,497 752,237
Ending balance ¥3,256,652 ¥(134,156) ¥(85,561) ¥3,036,934 ¥4,727,608
137136

Millions of U.S. Dollars
Foundation funds and others
Foundation funds
(Note 14)
Reserve for redemption
of foundation funds
(Note 14)
Reserve for
revaluation
Surplus
Total foundation funds and
others
Legal reserve for deficiencies
Other surplus reserves
Total surplusFor the year ended March 31, 2014
Contingency funds
Reserve for social public
welfare assistance
Reserve for reduction
entry of real estate
Reserve for reduction
entry of real estate to be purchased
Other reserves
Un- appropriated
surplus
Beginning balance $2,914 $9,230 $ 6 $122 $698 $ 2 $336 $— $ 1 $ 2,244 $ 3,406 $15,557
Cumulative effect of change in accounting policies 240 240 240
Beginning balance after reflecting accounting policy changes 2,914 9,230 6 122 698 2 336 — 1 2,484 3,646 15,798
Increase/decrease:
Additions to reserve for dividends to policyholders (Note 9) (1,624) (1,624) (1,624)
Additions to legal reserve for deficiencies 6 (6) — —
Additions to reserve for redemption of foundation funds 485 (485) (485) —
Interest on foundation funds (34) (34) (34)
Net surplus 2,763 2,763 2,763
Redemption of foundation funds (485) (485)
Additions to reserve for social public welfare assistance 14 (14) — —
Reversal of reserve for social public welfare assistance (14) 14 — —
Additions to reserve for reduction entry of real estate 95 (95) — —
Reversal of reserve for reduction entry of real estate (17) 17 — —
Additions to reserve for reduction entry of real estate to be purchased 0 (0) — —
Reversal of land revaluation differences 10 10 10
Net change, excluding foundation funds and others
Net change (485) 485 — 6 — 0 77 0 — 543 629 629
Ending balance $2,429 $9,716 $ 6 $128 $698 $ 2 $414 $ 0 $ 1 $ 3,028 $ 4,275 $16,427
Millions of U.S. Dollars
Valuations, conversions, and others
Total net assetsFor the year ended March 31, 2014
Net unrealized gains on available-for-sale securities, net of tax
Deferred losses on derivatives under hedge accounting, net of tax
Land revaluation differences
Total valuations, conversions, and others
Beginning balance $24,368 $ (720) $(820) $22,827 $38,385
Cumulative effect of change in accounting policies 240
Beginning balance after reflecting accounting policy changes 24,368 (720) (820) 22,827 38,625
Increase/decrease:
Additions to reserve for dividends to policyholders (Note 9) (1,624)
Additions to legal reserve for deficiencies —
Additions to reserve for redemption of foundation funds —
Interest on foundation funds (34)
Net surplus 2,763
Redemption of foundation funds (485)
Additions to reserve for social public welfare assistance —
Reversal of reserve for social public welfare assistance —
Additions to reserve for reduction entry of real estate —
Reversal of reserve for reduction entry of real estate —
Additions to reserve for reduction entry of real estate to be purchased —
Reversal of land revaluation differences 10
Net change, excluding foundation funds and others 7,273 (583) (10) 6,679 6,679
Net change 7,273 (583) (10) 6,679 7,308
Ending balance $31,642 $(1,303) $(831) $29,507 $45,934
The accompanying notes are an integral part of the consolidated financial statements.
Cover FeatureBusiness Perform
anceM
anagement of N
ippon Life Nippon Life’s Products and Services
Company Inform
ationFinancial Data
Operational Data
137136

Thousands of YenThousands of U.S. Dollars
For the years ended March 31 2014 2013 2012 2014
Unappropriated surplus ¥311,679,459 ¥231,016,619 ¥226,344,537 $3,028,366
Reversal from voluntary surplus reserves: 677,396 1,841,308 685,311 6,581
Reversal of reserve for reduction entry of real estate 677,396 1,841,308 685,311 6,581
Total ¥312,356,855 ¥232,857,928 ¥227,029,849 $3,034,948
Appropriations: ¥312,356,855 ¥232,857,928 ¥227,029,849 $3,034,948
Reserve for dividends to policyholders 201,765,958 167,172,049 167,313,298 1,960,415
Net surplus 110,590,897 65,685,879 59,716,550 1,074,532
Legal reserve for deficiencies 938,000 699,000 682,000 9,113
Reserve for redemption of foundation funds 50,000,000 50,000,000 50,000,000 485,814
Interest on foundation funds 2,785,000 3,585,000 3,930,000 27,059
Voluntary surplus reserves: 56,867,897 11,401,879 5,104,550 552,544
Equalized reserve for dividends to policyholders 50,000,000 — — 485,814
Reserve for social public welfare assistance 3,000,000 1,500,000 1,500,000 29,148
Reserve for reduction entry of real estate 3,866,656 9,868,719 3,604,550 37,569
Reserve for reduction entry of real estate to be purchased 1,241 33,159 — 12
Surplus carried forward — — — —
Of the surplus available for disposition, a minimum ratio for the reserve for dividends to policyholders needs to be established in the Articles of Incorporation.Nippon Life applies mutatis mutandis Article 30-6 of the Ordinance for Enforcement of the Insurance Business Act in the Articles of Incorporation and has established the ratio (20/100) stipulated in said Article 30-6 as the minimum ratio in the Articles of Incorporation. The ratio of provision of the appropriation of surplus in the fiscal year ended March 31, 2014, was 98.16%.Amounts of less than one thousand yen and one thousand of U.S. dollars have been eliminated in the table above.
9. nonconsolidated Proposed appropriations of surplusNippon Life Insurance Company
139138

1. Basis of Presenting the nonconsolidated Financial statements
(1) accounting principles and presentation
The accompanying nonconsolidated financial statements have been pre-
pared from the accounts and records maintained by NIPPON LIFE INSUR-
ANCE COMPANY (“Nippon Life” or the “Company”) in accordance with the
provisions set forth in the Insurance Business Act and the related rules and
regulations applicable to the mutual life insurance industry, and in accor-
dance with accounting principles generally accepted in Japan, which are
different in certain respects from the application and disclosure requirements
of International Financial Reporting Standards. Certain accounting and
reporting practices required to be followed by the industry are regulated by
the Financial Services Agency and the related ministry by means of ministe-
rial ordinances and guidance. The accompanying nonconsolidated financial
statements of Nippon Life are in compliance with such requirements. How-
ever, while the business report and supporting schedules have been prepared
by the management of Nippon Life as a part of the disclosures required by
the Japanese Commercial Code and the Insurance Business Act, they are not
provided herein. The information provided in the nonconsolidated financial
statements including the notes to the nonconsolidated financial statements
is limited to that required by Japanese laws and regulations. Amounts of less
than one million yen and one million U.S. dollars have been eliminated. As a
result, totals may not add up exactly. As consolidated statements of cash
flows and certain disclosures are presented in the consolidated financial
statements of the Company, nonconsolidated statements of cash flows and
certain disclosures are not presented herein in accordance with accounting
principles generally accepted in Japan.
(2) United states dollar amounts
Nippon Life prepares its nonconsolidated financial statements in Japanese
yen. The U.S. dollar amounts included in the nonconsolidated financial state-
ments and notes thereto represent the arithmetical results of translating
Japanese yen to U.S. dollars on the basis of ¥102.92=U.S.$1, the effective
rate of exchange at the balance sheet date of March 31, 2014. The inclusion
of such U.S. dollar amounts is solely for convenience and is not intended to
imply that Japanese yen amounts have been or could be readily converted,
realized or settled in U.S. dollars at ¥102.92=U.S.$1 or at any other rate.
2. summary of significant accounting Policies(1) securities and hedging activities
1) Securities (including items such as deposits and monetary receivables
purchased which are treated as securities based on the “Accounting
Standard for Financial Instruments” (The Accounting Standards Board of
Japan (ASBJ) Statement No. 10) and securities within assets held in trust)
are valued as follows:
i) Trading securities are stated at market value on the balance sheet
date. The moving average method is used for calculating cost of sales.
ii) Held-to-maturity debt securities are valued using the moving average
method, net of accumulated amortization (straight-line).
iii) Policy-reserve-matching bonds are valued using the moving average
method, net of accumulated amortization (straight-line), in accor-
dance with the Industry Audit Committee Report No. 21, “Temporary
Treatment of Accounting and Auditing Concerning Policy-Reserve-
Matching Bonds in the Insurance Industry,” issued by the Japanese
Institute of Certified Public Accountants (JICPA).
iv) Investments in subsidiaries and affiliates (stocks issued by subsidiar-
ies prescribed in Article 2, Paragraph 12 of the Insurance Business Act
excluding subsidiaries prescribed in Article 13-5-2, Paragraph 3 of the
Order for Enforcement of the Insurance Business Act and stocks
issued by affiliates prescribed in Article 13-5-2, Paragraph 4 of the
Order for Enforcement of the Insurance Business Act) are valued using
the moving average method.
v) Available-for-sale securities
a. Regarding securities with a market value, stocks (including foreign
stocks) are valued by using the average market value during the
period of one month before the balance sheet date (cost of sales
is calculated by using the moving average method). Other securi-
ties with a market value are valued by using the market value on
the balance sheet date (cost of sales is calculated by using the
moving average method).
b. Regarding securities of which the market value is extremely diffi-
cult to be determined, and public and corporate bonds (including
foreign bonds) for which the difference between the purchase
price and face value is due to an interest rate adjustment are
valued at cost using the moving average method, net of accumu-
lated amortization (straight-line). Other securities are valued at
cost using the moving average method.
2) Unrealized gains/losses, net of applicable taxes for available-for-sale
securities, are recorded in a separate component of net assets.
Hedge accounting is applied based on the following method:
1) The Company mainly applies the mark-to-market method of hedge
accounting and deferred hedge accounting for hedging activities related
to foreign exchange rate fluctuation exposures on certain bonds denomi-
nated in foreign currencies. The Company also applies the exceptional
accounting treatment (“Tokurei-shori”) for interest rate swaps to hedge
the cash flow volatility of certain loans and applies designated hedge
accounting (“ Furiate-shori”) for foreign exchange forward contracts and
currency swaps for certain financial assets and financial liabilities
denominated in foreign currencies.
2) Effectiveness of hedging activities is mainly evaluated by performing a
ratio analysis of market value movement comparisons based on the
hedging instruments and hedging methods taken, which is in accordance
with the Company’s internal risk management policies.
10. notes to the nonconsolidated Financial statementsNippon Life Insurance Company
Cover FeatureBusiness Perform
anceM
anagement of N
ippon Life Nippon Life’s Products and Services
Company Inform
ationFinancial Data
Operational Data
139138
3) Derivative financial instruments utilized for other than hedging purposes
are stated at market value.
(2) Policy-reserve-matching bonds
Securities that are held for the purpose of matching the duration of out-
standing liabilities within the sub-groups (insurance type, remaining period,
and investment policy) of insurance products, such as individual insurance
and annuities, workers’ asset-formation insurance and annuities, and group
insurance and annuities are classified as policy-reserve-matching bonds in
accordance with the Industry Audit Committee Report No. 21, “Temporary
Treatment of Accounting and Auditing Concerning Policy-Reserve-Matching
Bonds in the Insurance Industry,” issued by the JICPA.
(3) Foreign currency translation
Assets and liabilities denominated in foreign currencies are translated into
Japanese yen using the “Accounting Standards for Foreign Currency
Transactions” (Business Accounting Council).
Foreign currency-denominated available-for-sale securities of the
Company, with exchange rates which have significantly fluctuated and
where recovery is not expected, are converted to Japanese yen using either
the rate on the balance sheet date or the average one month rate prior to
the balance sheet date, whichever indicates a weaker yen. This translation
difference is recorded as a loss on valuation of securities.
(4) tangible fixed assets
1) Tangible fixed assets are depreciated based on the following methods:
a. Tangible fixed assets (except for lease assets)
(i) Buildings as of March 31, 2014 and buildings acquired on or after
April 1, 1998 (except for fixtures and structures) as of March 31,
2013 and 2012
Straight-line method.
(ii) Assets other than the above
Declining balance method.
b. Lease assets
(i) Lease assets related to financial leases where ownership is
transferred
The same depreciation method applied to fixed assets owned by
the Company.
(ii) Lease assets related to financial leases where ownership is not
transferred
Straight-line method based on lease period.
The estimated useful lives of major items are as follows:
Buildings 2 to 50 years
Other tangible fixed assets 2 to 20 years
Tangible fixed assets are stated at cost, net of accumulated depreciation
and impairment losses.
Previously, tangible fixed assets of the Company were depreciated
mainly based on the declining-balance method. From the fiscal year ended
March 31, 2014, the depreciation method for buildings and others has been
changed to the straight-line method.
This change was made because the Company decided that straight-line
depreciation over the useful lives of buildings better reflects the future use of
tangible fixed assets given that the Company now expects to make more
consistent use of buildings and others over the long term. This decision was
based on several factors. First, investments in remodeling and renovations,
which slow the aging of real estate, now represent a relatively higher share
of the Company’s investments. Remodeling and renovations have progres-
sively replaced the acquisition and construction of new buildings, which now
represent a lower share of investments. Previously, acquisitions and con-
struction of new buildings accounted for the bulk of investments, and
therefore the declining-balance method of depreciation was adopted as a
depreciation method suited to the use of these assets. Second, the Company
has recently formulated standards such as an overall building renovation
plan and specifications for renovation work in order to conduct real estate
renovations more systematically. Following the completion of the develop-
ment of a system for managing fixed assets in support of these changes
during the fiscal year ended March 31, 2014, the Company decided to
change the depreciation method for tangible fixed assets.
As a result, ordinary profit and surplus before income taxes both
increased by ¥3,027 million (U.S.$29 million) in comparison with the previ-
ous depreciation method for the fiscal year ended March 31, 2014.
Furthermore, in the course of formulating the above overall building
renovation plan, the Company surveyed the remaining useful lives and residual
values of buildings and others. Consequently, in conjunction with the change
in depreciation method, the Company revised these parameters to better
reflect actual conditions. Accordingly, the Company has adjusted certain
useful lives and residual values from the fiscal year ended March 31, 2014.
As a result, ordinary profit and surplus before income taxes both
increased by ¥7,325 million (U.S.$71 million) in comparison with the previ-
ous depreciation method for the fiscal year ended March 31, 2014.
Following tax reforms enacted in Japan in the fiscal year ended March
31, 2012, the Company adopted the depreciation method in compliance
with the revised Corporation Tax Act for tangible fixed assets acquired on or
after April 1, 2012, to which the declining balance method is applied, from
the fiscal year ended March 31, 2013. As a result, ordinary profit and surplus
before income taxes increased by ¥435 million in comparison with the previ-
ous method for the fiscal year ended March 31, 2013.
141140

2) Revaluation of land used in the operations is performed based on the Act
on Revaluation of Land. The tax effect of the amount related to the valu-
ation difference between the previous and the revalued amount for land
revaluation is recognized as a deferred tax liability within the liability
section. The valuation differences, excluding tax, are recognized as land
revaluation differences within the net assets section.
Revaluation Date: March 31, 2002
Revaluation Methodology:
The amount is rationally calculated by using the land
listed value and road rate as prescribed by Article 2,
Items 1 and 4, respectively, of the Order for Enforce-
ment of the Act on Revaluation of Land.
The Act on Revaluation of Land requires companies to disclose when the
total fair value of land on the balance sheet date is below the total book
value of this land after revaluation.
The excess of the total book value of this land after revaluation as of
March 31, 2013, over the total fair value of land used in operations, as
revalued in accordance with Article 10 of the Act on Revaluation of Land as
of the same date, was ¥3,351 million.
(5) software
Capitalized software for internal use, which is included within intangible
fixed assets, is amortized using the straight-line method over their estimated
useful lives as internally determined (5 years).
(6) leases
Financial leases where ownership is not transferred are capitalized based on
the “Accounting Standard for Lease Transactions” (ASBJ Statement No. 13).
Financial leases where the Company is the lessee, ownership is not trans-
ferred, and the lease start date is March 31, 2008, or prior are accounted for
under the accounting treatment applied to ordinary operating leases.
(7) allowance for doubtful accounts
1) An allowance for doubtful accounts is recognized in accordance with
the Company’s internal Asset Valuation Regulation and Write-Off/
Provision Rule.
i) An allowance for loans from borrowers who are legally or substan-
tially bankrupt, such as being bankrupt or being in the process of civil
rehabilitation proceedings, is recognized based on the amount of credit
remaining after directly deducting amounts expected to be collected
through the disposal of collateral or the execution of guarantees from
the balance of loans (as mentioned at 3) below).
ii) An allowance for loans from borrowers who are not currently legally
bankrupt but have a significant possibility of bankruptcy is recognized
at the amounts deemed necessary considering an assessment of the
borrowers’ overall solvency and the amounts remaining after deduc-
tion of amounts expected to be collected through the disposal of
collateral or the execution of guarantees.
iii) An allowance for loans from borrowers other than the above is pro-
vided based on the borrowers’ balance multiplied by the historical
average (of a certain period) percentage of bad debt.
2) All credits are assessed by responsible sections in accordance with the
Company’s internal Asset Valuation Regulation. The assessments are
verified by the independent Asset Auditing Department. The results of
the assessments are reflected in the calculation of the allowance for
doubtful accounts.
3) The estimated uncollectible amount calculated by subtracting the amount
of collateral value or the amount collectible by the execution of guaran-
tees from the balance of loans is directly deducted from the balance of
loans (including loans with credits secured and/or guaranteed) made to
legally or substantially bankrupt borrowers. The estimated uncollectible
amounts were ¥703 million (U.S.$6 million) (including ¥240 million
(U.S.$2 million) of credits secured and/or guaranteed), ¥831 million
(including ¥313 million of credits secured and/or guaranteed) and ¥1,754
million (including ¥1,114 million of credits secured and/or guaranteed)
as of March 31, 2014, 2013 and 2012, respectively.
(8) accrued bonuses for directors and audit and supervisory
board members
Accrued bonuses for directors and audit and supervisory board members are
recognized based on amounts estimated to be paid.
(9) accrued retirement benefits
Accrued retirement benefits are recognized based on the estimated amount
of projected benefit obligations in excess of the market value of pension
plan assets for future severance payments to employee on the balance
sheet date as of March 31, 2014, 2013 and 2012.
The accounting methods used for retirement benefits as of March 31,
2014 are as follows:
1) Attribution method for estimated retirement benefits: Benefit formula
basis
2) Period of amortizing actuarial differences: 5 years
3) Period of amortizing prior service costs: 5 years
(10) accrued retirement benefits for directors and
audit and supervisory board members
Accrued retirement benefits for directors and audit and supervisory board
members are recognized based on estimated payment amounts under
internal rules.
(11) Reserve for program points
A reserve for program points is recognized based on the amount projected
to be incurred for expenses from the use of points granted to policyholders.
Cover FeatureBusiness Perform
anceM
anagement of N
ippon Life Nippon Life’s Products and Services
Company Inform
ationFinancial Data
Operational Data
141140

(12) accrued losses from supporting closely related companies
Accrued losses from supporting closely related companies are recognized
based on the estimated amounts required in the future to support the
restructuring of closely related companies.
(13) Reserve for loss on disaster
Reserve for loss on disaster is recognized based on estimated expenditures
associated with the Great East Japan Earthquake, such as expenditures for
the repair of tangible fixed assets.
(14) Reserve for price fluctuations in investments in securities
Reserve for price fluctuations in investments in securities is recognized based
on Article 115 of the Insurance Business Act.
(15) accounting for consumption taxes
Consumption taxes and local consumption taxes are accounted for by the
tax exclusion method. However, consumption taxes paid on certain asset
transactions, which are not deductible from consumption taxes withheld and
that are stipulated to be deferred under the Consumption Tax Act, are
deferred as prepaid expenses and amortized over a 5 year period on a
straight-line basis. Consumption taxes other than deferred consumption
taxes are expensed as incurred.
(16) Policy reserves
Policy reserves of the Company are reserves set forth in accordance with
Article 116 of the Insurance Business Act. Policy reserves are recognized
based on the following methodology:
1) Reserves for contracts concluded in or after April 1996, other than those
in which factors used as a basis for computing policy reserves and insur-
ance premiums are alterable and those for variable insurance, are com-
puted by the net level premium method based on the assumption rates
locked in at the sales and renewal prescribed by the Insurance Business
Act and the statement of calculation procedures*.
2) Reserves for other contracts are determined by the net level premium
method using the assumption rates locked in at the sales and renewal
prescribed by the statement of calculation procedures*.
* Documents approved by the Financial Services Agency that describe the specific calculation methods for insurance premiums and policy reserves.
Additional policy reserve amounts are included to cover a possible
deficiency in the amount of the reserve for certain individual annuity policy-
holders in accordance with Article 69, Paragraph 5 of the Ordinance for
Enforcement of the Insurance Business Act.
(17) Revenue recognition
Regarding revenues, insurance premiums are recognized when cash is
received and insurance premiums due but not collected are not recognized
as revenues. Unearned insurance premiums are recognized as policy reserves.
(18) Policy acquisition costs
Policy acquisition costs are recorded to expense as incurred.
(19) new accounting standards
From the fiscal year ended March 31, 2014, the Company has applied the
“Accounting Standard for Retirement Benefits” (ASBJ Statement No. 26) and
the “Guidance on Accounting Standard for Retirement Benefits” (ASBJ
Guidance No. 25). The revised accounting standard permits companies to
change the calculation method of retirement benefit obligations and service
costs from the start of fiscal years beginning on or after April 1, 2013.
Accordingly, from the fiscal year ended March 31, 2014, the Company has
changed the periodic allocation method of estimated retirement benefits
from the straight-line basis to the benefit formula basis.
With respect to the application of the revised accounting standard, in
accordance with Article 37 of the Standard, the amount of the impact of
changes to the method of calculation of retirement benefit obligations and
service costs has been included in unappropriated surplus as of the begin-
ning of the current fiscal year.
As a result, unappropriated surplus as of April 1, 2013 increased by
¥24,705 million (U.S.$240 million). Ordinary profit and surplus before
income taxes increased by ¥1,558 million (U.S.$15 million).
3. Financial instrumentsRegarding the investment of general accounts (except separate accounts as
provided in Article 118, Paragraph 1 of the Insurance Business Act), in light
of the characteristics of life insurance policies, the Company has built a
portfolio geared towards mid- to long-term investment and formulated an
investment plan considering the outlook of the investment environment.
Based on this, in order to reliably pay benefits and other payments in the
future, the Company has positioned yen-denominated assets that can be
expected to provide stable income, such as bonds and loans, as the
Company’s core assets, and from the viewpoint of improving profit in the
mid- to long-term, the Company invests in stocks and foreign securities. Also,
from the viewpoint of effective investment, the Company mainly uses deriva-
tive transactions for controlling asset investment risks. Specifically, the
Company uses interest rate swaps for the Company’s interest rate related
investments, foreign exchange forward contracts and currency options and
swaps for the Company’s currency related investments, and hedge account-
ing is applied with respect to a portion thereof.
The Company mainly applies the mark-to-market method of hedge
accounting and deferred hedge accounting for hedging activities against
foreign exchange rate fluctuation exposures on certain bonds denominated
in foreign currencies. The Company also applies the exceptional accounting
treatment (“Tokurei-shori”) for interest rate swaps to hedge the cash flow
volatility of certain loans and applies designated hedge accounting
(“ Furiate-shori”) for foreign exchange forward contracts and currency swaps
for certain financial assets and financial liabilities denominated in foreign
currencies. The effectiveness of hedging activities is mainly evaluated by 143142

performing a ratio analysis of market value movement comparisons based on
the hedging instruments and hedging methods taken, which is in accordance
with the Company’s internal risk management policies.
Securities are mainly exposed to market risk and credit risk, loans are
exposed to credit risk, and derivative transactions are exposed to market risk
and credit risk. Market risk refers to the risk of incurring losses when the
market value of investment assets declines due to such factors as fluctua-
tions in interest rates, exchange rates or stock prices. Credit risk refers to the
risk of incurring losses when the value of assets, primarily loans and bonds,
declines due to deterioration of the financial condition of the party to whom
credit has been extended. These risks are managed according to rules and
regulations regarding investment risks.
To manage market risk, the Company has implemented investment limits
based on the nature of the assets in order to avoid excessive losses from
financing and investment transactions. In addition, the Company regularly
reports on the status of compliance to the Risk Management Committee, the
advisory body of the Management Committee, and has prepared a system to
control risk to acceptable levels when there is a breach of the internal rules.
Also, to control market risk in the Company’s portfolio, the Company uses a
statistical analysis method to rationally calculate the market value-at-risk of
the portfolio as a whole and conducts appropriate asset allocation within
acceptable boundaries of risk.
To manage credit risk, the Company has built a thorough monitoring
system involving the Assessment Management Department which is inde-
pendent of the departments handling investment and finance activities. The
Company also continues to build a sound portfolio through the establish-
ment of interest guidelines to ensure the returns the Company obtains are
commensurate with the risk, a system of internal ratings for classifying the
creditworthiness of borrowers, and credit ceilings to ensure that credit risk is
not excessively concentrated in a particular company or group.
In addition, the Company calculates credit value-at-risk as a mea-
surement of the magnitude of credit risk across the Company’s portfolio
as a whole and monitors whether the magnitude of risk stays within an
appropriate range.
(1) Balance sheet amounts and market values of major financial instruments and their differences are as follows:
Millions of Yen Millions of U.S. Dollars
As of March 31 2014 2013 2012 2014Balance sheet
amount (*1)Market
value (*2) DifferenceBalance sheet
amount (*1)Market
value (*2) DifferenceBalance sheet
amount (*1)Market
value (*2) DifferenceBalance sheet
amount (*1)Market value (*2) Difference
Cash and deposits (negotiable certificates of deposit) ¥ 234,999 ¥ 234,999 ¥ –– ¥ 298,997 ¥ 298,997 ¥ — ¥ 250,997 ¥ 250,997 ¥ — $ 2,283 $ 2,283 $ —
Available-for-sale securities 234,999 234,999 –– 298,997 298,997 –– 250,997 250,997 — 2,283 2,283 —
Monetary receivables purchased 570,632 611,996 41,364 756,320 810,224 53,904 883,070 926,722 43,652 5,544 5,946 401
Policy-reserve-matching bonds 542,574 583,939 41,364 698,039 751,943 53,904 806,689 850,341 43,652 5,271 5,673 401
Available-for-sale securities 28,057 28,057 –– 58,281 58,281 –– 76,381 76,381 — 272 272 —
Securities 43,113,992 44,926,705 1,812,713 40,934,073 42,973,432 2,039,358 36,243,953 37,377,929 1,133,975 418,907 436,520 17,612
Trading securities 1,098,298 1,098,298 –– 1,072,950 1,072,950 –– 1,041,876 1,041,876 — 10,671 10,671 —
Held-to-maturity debt securities –– –– –– –– –– –– 14,500 14,479 (21) –– –– ––
Policy-reserve-matching bonds 19,593,801 21,352,447 1,758,645 18,905,385 20,908,019 2,002,633 17,421,958 18,542,260 1,120,301 190,378 207,466 17,087
Investments in subsidiaries and affiliates 7,711 61,779 54,068 7,711 44,436 36,725 7,711 21,406 13,695 74 600 525
Available-for-sale securities 22,414,180 22,414,180 –– 20,948,026 20,948,026 –– 17,757,906 17,757,906 — 217,782 217,782 —
Loans (*3) 8,523,357 8,791,565 268,207 8,574,646 8,894,847 320,200 8,710,573 8,976,875 266,301 82,815 85,421 2,605
Policy loans 782,113 782,113 –– 835,281 835,281 –– 896,161 896,161 — 7,599 7,599 —
Industrial and consumer loans 7,741,243 8,009,451 268,207 7,739,365 8,059,565 320,200 7,814,412 8,080,713 266,301 75,216 77,822 2,605
Derivative financial instruments (*4) (278,716) (278,716) –– (259,261) (259,261) –– (190,224) (190,224) — (2,708) (2,708) —
Hedge accounting not applied (258) (258) –– 37 37 –– (81,081) (81,081) — (2) (2) —
Hedge accounting applied (278,457) (278,457) –– (259,298) (259,298) –– (109,143) (109,143) — (2,705) (2,705) —
Corporate bonds (*3,*5) (157,040) (172,429) (15,389) (157,040) (159,039) (1,999) — — — (1,525) (1,675) (149)
Cash received as collateral under securities lending transactions (*5) ¥ (802,691) ¥ (802,691) ¥ –– ¥ (1,212,021) ¥ (1,212,021) ¥ — ¥ (935,584) ¥ (935,584) ¥ — $ (7,799) $ (7,799) $ —
(*1) For transactions for which an allowance for doubtful accounts was recorded, the amount of the allowance is deducted.(*2) For securities for which impairment losses were recognized in the fiscal years ended March 31, 2014, 2013 and 2012, the market value is the balance sheet amount after the impairment losses are deducted.(*3) The market values of derivative financial instruments that are interest rate swaps under exceptional accounting treatment (“Tokurei-shori”) or currency swaps under designated hedge accounting (“Furiate-shori”) are
included in the market values of loans and corporate bonds because they are accounted for as an integral part of the loans and corporate bonds that are the hedged items.(*4) Assets and liabilities generated by derivative financial instruments are offset and presented net. Net liabilities in total are presented in brackets.(*5) Corporate bonds and cash received as collateral under securities lending transactions are recorded in liabilities and presented in brackets.
Cover FeatureBusiness Perform
anceM
anagement of N
ippon Life Nippon Life’s Products and Services
Company Inform
ationFinancial Data
Operational Data
143142

(2) Market value measurement methods for major financial instruments are
as follows:
1) Securities, deposits and monetary receivables purchased are treated
as securities based on the “Accounting Standard for Financial Instru-
ments” (ASBJ Statement No. 10)
a. Items with a market price
Market value is measured based on the closing market price on
the balance sheet date. However, the market values of available-
for-sale domestic and foreign equity securities are based on the
average market price over a one-month period prior to the bal-
ance sheet date.
b. Items without a market price
Market value is measured mainly by discounting future cash flows
to the present value.
2) Loans
a. Policy loans
Market value is deemed to approximate book value, due to no
repayment deadlines based on characteristics such as limiting loans
to the surrender benefits range, and expected reimbursement
period and interest rate requirements, and other characteristics.
Thus, the book value is used as the market value of the policy loans.
b. Industrial and consumer loans
Market value of variable interest rate loans is deemed to approxi-
mate book value because market interest rates are reflected in
future cash flows over the short term. Thus, the book value is used
as the market value of the variable interest rate loans.
Market value of fixed interest rate loans is measured mainly by
discounting future cash flows to the present value.
Loans from legally or substantially bankrupt borrowers or bor-
rowers who are not currently legally bankrupt but have a high
probability of bankruptcy are measured by deducting the esti-
mated uncollectable amount from the book value directly prior to
the decrease.
3) Derivative financial instruments
a. Market value of futures and other market transactions is measured
by the liquidation value or closing market price on the balance
sheet date.
b. Market value of stock options is measured by the value obtained
from financial institutions that are the counterparties in such trans-
actions as of March 31, 2013. Market value of stock options is
measured by the price calculated by the Company based on vola-
tility and other data obtained mainly from external information
vendors as of March 31, 2014.
c. Market value of exchange contracts and currency options is mea-
sured based on theoretical values calculated by the Company
using Telegraphic Transfer Middle rates (TTM) and discount rates
obtained from financial institutions that are the counterparties in
such transactions.
d. Market value of interest rate swaps and currency swaps is mea-
sured based on theoretical present values calculated by discount-
ing future cash flows using published market interest rates, and
other data.
4) Corporate bonds
Corporate bonds are stated at market value on the balance sheet date.
5) Cash received as collateral under securities lending transactions
The book value is used as market value due to their short-term
settlement.
(3) Unlisted equity securities, investments in partnerships whereby partner-
ship assets consist of unlisted equity securities, and other items without
market value are not included in securities in table (1).
Balance sheet amounts by holding purpose were ¥231,983 million
(U.S.$2,254 million), ¥285,945 million and ¥247,911 million for stocks
of subsidiaries and affiliates, and ¥1,023,037 million (U.S.$9,940
million), ¥1,054,178 million and ¥1,030,896 million for available-for-
sale securities as of March 31, 2014, 2013 and 2012, respectively.
(4) Matters regarding securities and others by holding purpose are as follows:
1) Trading securities
Investments in securities for separate accounts are classified as
trading securities as of March 31, 2014, 2013 and 2012.
Valuation differences included in profit and loss were gains of
¥110,562 million (U.S.$1,074 million), gains of ¥103,266 million
and losses of ¥11,977 million for securities related to separate
accounts for the fiscal years ended March 31, 2014, 2013 and
2012, respectively.
145144

2) Held-to-maturity debt securities
Balance sheet amounts, market values and their differences by type are as follows:
Millions of Yen Millions of U.S. Dollars
As of March 31 2014 2013 2012 2014
TypeBalance sheet
amount Market value DifferenceBalance sheet
amount Market value DifferenceBalance sheet
amount Market value DifferenceBalance sheet
amount Market value Difference
Market value exceeds the balance sheet amount
Domestic bonds ¥— ¥— ¥— ¥— ¥— ¥— ¥12,000 ¥12,061 ¥ 61 $— $— $—
Market value does not exceed the balance sheet amount
Domestic bonds — — — — — — 2,499 2,417 (82) — — —
Total ¥— ¥— ¥— ¥— ¥— ¥— ¥14,500 ¥14,479 ¥(21) $— $— $—
3) Policy-reserve-matching bonds
Balance sheet amounts, market values and their differences by type are as follows:
Millions of Yen Millions of U.S. Dollars
As of March 31 2014 2013 2012 2014
TypeBalance sheet
amount Market value DifferenceBalance sheet
amount Market value DifferenceBalance sheet
amount Market value DifferenceBalance sheet
amountMarket value Difference
Market value exceeds the balance sheet amount
Monetary receivables purchased ¥ 541,392 ¥ 582,823 ¥ 41,430 ¥ 636,067 ¥ 690,445 ¥ 54,377 ¥ 748,842 ¥ 792,984 ¥ 44,141 $ 5,260 $ 5,662 $ 402
Domestic bonds 19,100,466 20,863,889 1,763,422 18,734,266 20,741,509 2,007,243 17,108,566 18,250,757 1,142,191 185,585 202,719 17,133
Foreign securities 81,594 85,489 3,895 81,033 85,399 4,366 68,973 71,780 2,806 792 830 37
Subtotal 19,723,454 21,532,202 1,808,748 19,451,366 21,517,353 2,065,986 17,926,383 19,115,522 1,189,139 191,638 209,213 17,574
Market value does not exceed the balance sheet amount
Monetary receivables purchased 1,182 1,115 (66) 61,971 61,498 (472) 57,846 57,357 (488) 11 10 (0)
Domestic bonds 411,307 402,636 (8,671) 89,276 80,303 (8,973) 231,192 206,831 (24,360) 3,996 3,912 (84)
Foreign securities 432 431 (1) 810 807 (2) 13,226 12,890 (336) 4 4 (0)
Subtotal 412,922 404,183 (8,738) 152,057 142,608 (9,448) 302,265 277,079 (25,185) 4,012 3,927 (84)
Total ¥20,136,376 ¥21,936,386 ¥1,800,009 ¥19,603,424 ¥21,659,962 ¥2,056,538 ¥18,228,648 ¥19,392,601 ¥1,163,953 $195,650 $213,140 $17,489
Cover FeatureBusiness Perform
anceM
anagement of N
ippon Life Nippon Life’s Products and Services
Company Inform
ationFinancial Data
Operational Data
145144

4) Available-for-sale securities
Acquisition cost or amortized cost, balance sheet amounts and their differences by type are as follows:
Millions of Yen Millions of U.S. Dollars
As of March 31 2014 2013 2012 2014
Type
Acquisition cost or
amortized costBalance sheet
amount Difference
Acquisition cost or
amortized costBalance sheet
amount Difference
Acquisition cost or
amortized costBalance sheet
amount Difference
Acquisition cost or
amortized costBalance sheet
amount Difference
Balance sheet amount exceeds acquisition cost or amortized cost
Cash and deposits (negotiable certificates of deposit) ¥ 85,000 ¥ 85,000 ¥ 0 ¥ 4,000 ¥ 4,000 ¥ 0 ¥ — ¥ — ¥ — $ 825 $ 825 $ 0
Monetary receivables purchased — — — — — — 2,855 2,860 4 — — —
Domestic bonds 1,998,843 2,098,646 99,802 1,917,151 2,017,712 100,561 1,669,385 1,725,313 55,928 19,421 20,391 969
Domestic stocks 3,205,936 6,129,206 2,923,269 3,003,896 5,396,584 2,392,688 2,656,297 4,045,678 1,389,380 31,149 59,553 28,403
Foreign securities 9,732,154 11,437,129 1,704,975 10,041,063 11,422,644 1,381,580 7,936,643 8,551,825 615,182 94,560 111,126 16,566
Other securities 431,137 482,272 51,134 349,996 388,421 38,425 170,767 178,190 7,423 4,189 4,685 496
Subtotal 15,453,071 20,232,254 4,779,182 15,316,107 19,229,363 3,913,256 12,435,950 14,503,868 2,067,918 150,146 196,582 46,435
Balance sheet amount does not exceed acquisition cost or
amortized cost
Cash and deposits (negotiable certificates of deposit) 150,000 149,999 (0) 295,000 294,997 (2) 251,000 250,997 (2) 1,457 1,457 (0)
Monetary receivables purchased 28,061 28,057 (4) 58,291 58,281 (10) 73,540 73,521 (19) 272 272 (0)
Domestic bonds 57,473 56,392 (1,081) 51,193 49,350 (1,843) 55,089 47,378 (7,711) 558 547 (10)
Domestic stocks 875,973 782,049 (93,923) 1,301,935 1,041,168 (260,767) 1,996,138 1,551,249 (444,889) 8,511 7,598 (912)
Foreign securities 1,377,572 1,356,047 (21,525) 626,364 611,958 (14,406) 1,688,081 1,614,767 (73,314) 13,384 13,175 (209)
Other securities 73,669 72,437 (1,231) 24,623 20,185 (4,437) 58,887 43,503 (15,383) 715 703 (11)
Subtotal 2,562,750 2,444,983 (117,767) 2,357,409 2,075,941 (281,467) 4,122,738 3,581,417 (541,320) 24,900 23,756 (1,144)
Total ¥18,015,822 ¥22,677,237 ¥4,661,415 ¥17,673,517 ¥21,305,305 ¥3,631,788 ¥16,558,688 ¥18,085,285 ¥1,526,597 $175,046 $220,338 $45,291
* Securities totaling ¥1,023,037 million (U.S.$9,940 million), ¥1,054,178 million and ¥1,030,896 million, whose market values are extremely difficult to determine, as of March 31, 2014, 2013 and 2012, respectively, are not included.
¥21,401 million (U.S.$207 million), ¥96,901 million and ¥25,760
million in impairment losses were recognized for securities with a
market value during the fiscal years ended March 31, 2014, 2013 and
2012, respectively.
Regarding stocks (including foreign stocks) with market values,
impairment losses are recognized for stocks whose market value has
fallen significantly from the acquisition price based on the average
market value in the month preceding the final day of the fiscal year, in
principle. However, in the case of a security that meets certain criteria,
such as a security for which the market value falls substantially and
the fall in the market value in the month preceding the final day of the
fiscal year is substantial, impairment losses are recognized based on
the market value on the final day of the fiscal year.
The criteria by which the market value of a stock is judged to have
fallen significantly is as follows:
a. A security for which the ratio of the average market value in the
month preceding the final day of the fiscal year to the acquisition
cost is 50% or less.
b. A security that meets both of the following criteria:
1. Average market value in the month preceding the final day of
the fiscal year is between 50% and 70% of its acquisition cost.
2. The historical market value, the business conditions of the
issuing company and other aspects are subject to certain
requirements.
147146
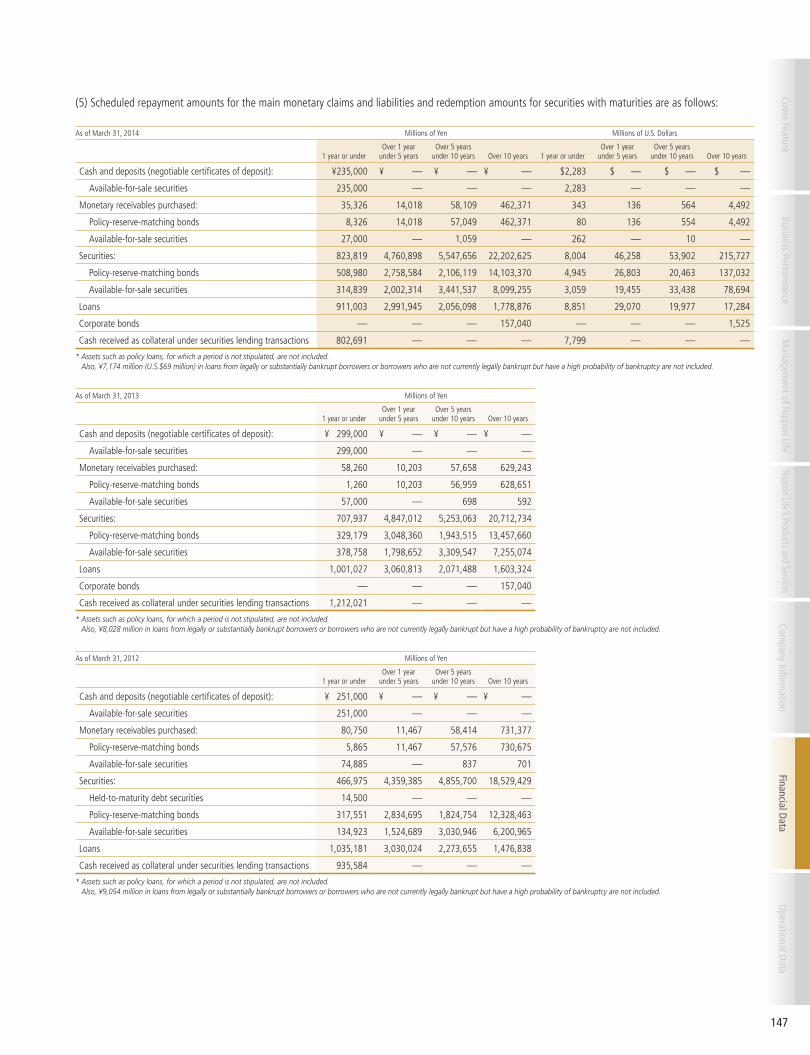
(5) Scheduled repayment amounts for the main monetary claims and liabilities and redemption amounts for securities with maturities are as follows:
As of March 31, 2014 Millions of Yen Millions of U.S. Dollars
1 year or underOver 1 year
under 5 yearsOver 5 years
under 10 years Over 10 years 1 year or underOver 1 year
under 5 yearsOver 5 years
under 10 years Over 10 years
Cash and deposits (negotiable certificates of deposit): ¥235,000 ¥ — ¥ — ¥ — $2,283 $ — $ — $ —
Available-for-sale securities 235,000 — — — 2,283 — — —
Monetary receivables purchased: 35,326 14,018 58,109 462,371 343 136 564 4,492
Policy-reserve-matching bonds 8,326 14,018 57,049 462,371 80 136 554 4,492
Available-for-sale securities 27,000 — 1,059 — 262 — 10 —
Securities: 823,819 4,760,898 5,547,656 22,202,625 8,004 46,258 53,902 215,727
Policy-reserve-matching bonds 508,980 2,758,584 2,106,119 14,103,370 4,945 26,803 20,463 137,032
Available-for-sale securities 314,839 2,002,314 3,441,537 8,099,255 3,059 19,455 33,438 78,694
Loans 911,003 2,991,945 2,056,098 1,778,876 8,851 29,070 19,977 17,284
Corporate bonds — — — 157,040 — — — 1,525
Cash received as collateral under securities lending transactions 802,691 — — — 7,799 — — —
* Assets such as policy loans, for which a period is not stipulated, are not included. Also, ¥7,174 million (U.S.$69 million) in loans from legally or substantially bankrupt borrowers or borrowers who are not currently legally bankrupt but have a high probability of bankruptcy are not included.
As of March 31, 2013 Millions of Yen
1 year or underOver 1 year
under 5 yearsOver 5 years
under 10 years Over 10 years
Cash and deposits (negotiable certificates of deposit): ¥ 299,000 ¥ — ¥ — ¥ —
Available-for-sale securities 299,000 — — —
Monetary receivables purchased: 58,260 10,203 57,658 629,243
Policy-reserve-matching bonds 1,260 10,203 56,959 628,651
Available-for-sale securities 57,000 — 698 592
Securities: 707,937 4,847,012 5,253,063 20,712,734
Policy-reserve-matching bonds 329,179 3,048,360 1,943,515 13,457,660
Available-for-sale securities 378,758 1,798,652 3,309,547 7,255,074
Loans 1,001,027 3,060,813 2,071,488 1,603,324
Corporate bonds — — — 157,040
Cash received as collateral under securities lending transactions 1,212,021 — — —
* Assets such as policy loans, for which a period is not stipulated, are not included. Also, ¥8,028 million in loans from legally or substantially bankrupt borrowers or borrowers who are not currently legally bankrupt but have a high probability of bankruptcy are not included.
As of March 31, 2012 Millions of Yen
1 year or underOver 1 year
under 5 yearsOver 5 years
under 10 years Over 10 years
Cash and deposits (negotiable certificates of deposit): ¥ 251,000 ¥ — ¥ — ¥ —
Available-for-sale securities 251,000 — — —
Monetary receivables purchased: 80,750 11,467 58,414 731,377
Policy-reserve-matching bonds 5,865 11,467 57,576 730,675
Available-for-sale securities 74,885 — 837 701
Securities: 466,975 4,359,385 4,855,700 18,529,429
Held-to-maturity debt securities 14,500 — — —
Policy-reserve-matching bonds 317,551 2,834,695 1,824,754 12,328,463
Available-for-sale securities 134,923 1,524,689 3,030,946 6,200,965
Loans 1,035,181 3,030,024 2,273,655 1,476,838
Cash received as collateral under securities lending transactions 935,584 — — —
* Assets such as policy loans, for which a period is not stipulated, are not included. Also, ¥9,054 million in loans from legally or substantially bankrupt borrowers or borrowers who are not currently legally bankrupt but have a high probability of bankruptcy are not included.
Cover FeatureBusiness Perform
anceM
anagement of N
ippon Life Nippon Life’s Products and Services
Company Inform
ationFinancial Data
Operational Data
147146

4. disclosures about market Value of investment and Rental Property
The balance sheet amounts for investment and rental properties were
¥1,164,094 million (U.S.$11,310 million), ¥1,121,383 million and ¥1,164,127
million, with a market value of ¥1,174,628 million (U.S.$11,413 million),
¥1,107,845 million and ¥1,147,794 million as of March 31, 2014, 2013 and
2012, respectively. The Company owns rental office buildings and commer-
cial facilities, the market value of which at year end is the amount measured
based mainly on the “Real Estate Appraisal Standards.” Asset retirement
obligations that were included in the balance sheet amounts of investment
and rental properties were ¥366 million (U.S.$3 million), ¥398 million and
¥512 million as of March 31, 2014, 2013 and 2012, respectively.
5. securities loaned and BorrowedThe amounts of securities lent under lending agreements were ¥2,808,047
million (U.S.$27,283 million), ¥3,129,761 million and ¥2,816,579 million as
of March 31, 2014, 2013 and 2012, respectively.
Assets that can be sold or re-secured are marketable securities lent
under lending agreements. These assets were being held without disposal
totaling ¥259,102 million (U.S.$2,517 million), ¥372,031 million and
¥709,179 million at market value as of March 31, 2014, 2013 and 2012,
respectively.
6. accumulated depreciationThe amounts of accumulated depreciation of tangible fixed assets were
¥1,132,867 million (U.S.$11,007 million), ¥1,132,993 million and ¥1,141,335
million as of March 31, 2014, 2013 and 2012, respectively.
7. separate accountsSeparate account assets as provided for in Article 118, Paragraph 1 of the
Insurance Business Act were ¥1,227,398 million (U.S.$11,925 million),
¥1,238,818 million and ¥1,146,686 million as of March 31, 2014, 2013 and
2012, respectively, and a corresponding liability is recorded in the same
amount. The amounts of separate accounts are included in each account
balance of the nonconsolidated balance sheets.
8. monetary Receivables from/and monetary liabilities to subsidiaries
The total amount of credits and debits to subsidiaries as of March 31, 2014,
2013 and 2012, were as follows:
Millions of YenMillions of U.S. Dollars
2014 2013 2012 2014
Monetary receivables ¥139,879 ¥155,070 ¥167,125 $1,359
Monetary liabilities 3,932 4,388 3,381 38
9. Reserve for dividends to PolicyholdersChanges in the reserve for dividends to policyholders included in policy
reserves for the fiscal years ended March 31, 2014, 2013 and 2012, were
as follows:
Millions of YenMillions of U.S. Dollars
2014 2013 2012 2014
Balance at the beginning of the fiscal year ¥1,105,093 ¥1,120,336 ¥1,144,330 $10,737
Transfer to reserve from surplus in the previous fiscal year 167,172 167,313 175,513 1,624
Dividends to policyholders paid out during the fiscal year (226,128) (208,387) (226,595) (2,197)
Increase in interest 24,715 25,830 27,087 240
Balance at the end of the fiscal year ¥1,070,852 ¥1,105,093 ¥1,120,336 $10,404
10. Corporate BondsCorporate bonds with liabilities are subordinated corporate bonds which are
denominated in a foreign currency with special provisions that subordinate
the fulfillment of obligations on the bonds to all other debt obligations.
11. net assets Provided for in the ordinance for enforcement of the insurance Business act
The amounts per Article 30, Paragraph 2 of the Ordinance for Enforcement
of the Insurance Business Act were ¥3,123,147 million (U.S.$30,345 mil-
lion), ¥2,434,569 million and ¥1,015,406 million as of March 31, 2014,
2013 and 2012, respectively.
149148

12. accrued Retirement Benefits(1) Outline of retirement benefit plans adopted by the Company
In terms of defined benefit plans, the Company has a defined benefit corpo-
rate pension plan and a lump-sum retirement payment plan for non-sales
personnel and sales management personnel, etc. In terms of defined contri-
bution plans, the Company has a defined contribution pension plan. The
Company also has a defined benefit plan for sales representatives, etc., in the
form of a lump-sum retirement payment plan and an in-house pension plan.
(2) Defined benefit plan
1) Reconciliation of retirement benefit obligations at the beginning
and end of the fiscal year
For the year ended March 31, 2014Millions of Yen Millions of U.S Dollars
Retirement benefit obligations at the beginning of the year ¥645,377 $6,270
Service costs 23,883 232
Interest cost 10,326 100
Actuarial differences accrued during the year (6,606) (64)
Retirement benefit payments (48,494) (471)
Retirement benefit obligations at the end of the year ¥624,485 $6,067
2) Reconciliation of pension plan assets at the beginning and end of the
fiscal year
For the year ended March 31, 2014Millions of Yen Millions of U.S Dollars
Pension plan assets at the beginning of the year ¥269,678 $2,620
Expected return on plan assets 4,314 41
Actuarial differences accrued during the year 4,436 43
Contributions by business proprietor 7,432 72
Retirement benefit payments (17,675) (171)
Pension plan assets at the end of the year ¥268,186 $2,605
3) Reconciliation of retirement benefit obligations, pension plan assets,
and accrued retirement benefits on the balance sheet
For the year ended March 31, 2014Millions of Yen Millions of U.S Dollars
Retirement benefit obligations for funded plans ¥ 285,269 $ 2,771
Pension plan assets (268,186) (2,605)
17,083 165
Retirement benefit obligations for non-funded plans 339,216 3,295
Unrecognized actuarial differences 19,850 192
Unrecognized prior service costs 9,133 88
Accrued retirement benefits ¥ 385,283 $ 3,743
4) Losses (gains) relating to retirement benefits
For the year ended March 31, 2014Millions of Yen Millions of U.S Dollars
Service costs ¥23,883 $232
Interest cost 10,326 100
Expected return on plan assets (4,314) (41)
Amortization of actuarial differences for the period 870 8
Amortization of prior service costs for the period (4,765) (46)
Benefit cost for defined benefit plans ¥26,000 $252
5) Breakdown of pension plan assets
General account of Nippon Life 54.3%
Domestic bonds 22.0%
Foreign bonds 15.1%
Domestic stocks 4.4%
Cash and deposits 4.2%
Total 100.0%
6) Calculation method for long-term expected rate of return on plan assets
To determine the long-term expected rate of return on pension plan
assets, the Company takes into consideration the present and fore-
casted allocation of the pension plan assets, and the present and
long-term rates of return that are expected from the diverse assets
that comprise the pension plan assets.
7) Matters relating to the basis for actuarial calculations
The main items in the basis for actuarial calculations as of March 31,
2014 are as follows.
Discount rate 1.6%
Long-term expected rate of return on plan assets 1.6%
Cover FeatureBusiness Perform
anceM
anagement of N
ippon Life Nippon Life’s Products and Services
Company Inform
ationFinancial Data
Operational Data
149148

8) Accrued retirement benefits as of March 31, 2013 and 2012, consisted
of the following:
Millions of Yen
2013 2012
Retirement benefit obligations ¥(681,027) ¥(695,766)
Pension plan assets 269,678 267,708
Accrued retirement benefit cost (411,349) (428,058)
Unrecognized actuarial differences (7,936) 9,300
Unrecognized prior service costs (13,898) (18,663)
Accrued retirement benefits ¥(433,184) ¥(437,421)
Basic information for the calculation of accrued retirement benefits is
as follows:
Periodic allocation method of
estimated retirement benefits Straight-line
Discount rate 2013 and 2012: 1.6%
Expected rate of return on
plan assets 2013 and 2012: 1.6%
Method of amortizing
actuarial differences
Amortization occurs over a certain period (5 years)
using the straight-line method within the average
remaining years of service of employees one year
after the accrual of liabilities.
Method of amortizing prior
service costs
Amortization occurs over a certain period (5 years)
using the straight-line method within the average
remaining years of service of employees upon
accrual of liabilities.
9) Benefit cost of accrued retirement benefits for the fiscal years ended
March 31, 2013 and 2012, was analyzed as follows:
Millions of Yen
2013 2012
Service costs ¥25,265 ¥25,812
Interest cost 11,132 11,352
Expected return on plan assets (4,283) (4,370)
Amortization of actuarial differences 9,354 8,472
Amortization of prior service costs (4,765) (4,765)
Others 2,005 2,403
Net periodic benefit cost ¥38,709 ¥38,905
(3) Defined contribution plans
The Company contributed ¥2,161 million (U.S.$20 million) to defined
contribution plans during the fiscal year ended March 31, 2014.
13. income taxesThe provision for income taxes is computed based on the pretax income
included in the nonconsolidated statements of income. The asset and liability
approach is used to recognize deferred tax assets and liabilities for the
expected future tax consequences of temporary differences between the
carrying amounts and the tax bases of assets and liabilities. Deferred taxes
are measured by applying the enacted statutory tax rates to the temporary
differences.
14. Foundation FundsFoundation funds serve as the primary source of capital for Japanese mutual
life insurance companies. These funds are similar to loans, as interest pay-
ments, maturity dates and other items must be established at the time of the
offering. In the event of a bankruptcy or similar development, repayment of
the principal and interest on foundation funds is subordinated to the repay-
ment of amounts owed to ordinary creditors and insurance claims and ben-
efit payments owed to policyholders. Upon redemption of foundation funds,
mutual companies are required to make an addition to the reserve for
redemption of foundation funds, which serves as retained earnings, equal to
the amount redeemed. As a result, the full amount of foundation funds
remains in net assets even after redemption. Foundation funds are therefore
positioned as a mutual company’s core capital, which is equivalent to the
stated capital of a joint-stock company. The Company redeemed ¥50,000
million (U.S.$485 million), ¥50,000 million and ¥50,000 million of founda-
tion funds and credited the same amount to reserve for redemption of
foundation funds prescribed in Article 56 of the Insurance Business Act as
of March 31, 2014, 2013 and 2012, respectively. ¥50,000 million and
¥100,000 million of foundation funds were offered pursuant to Article 60 of
the Insurance Business Act during the fiscal years ended March 31, 2013 and
2012, respectively.
151150

15. Pledged assetsAssets pledged as collateral by securities, land and buildings as of March 31,
2014, were ¥1,790,241 million (U.S.$17,394 million), ¥252 million (U.S.$2
million), and ¥56 million (U.S.$0 million), respectively. The total amount of
loans covered by the aforementioned assets was ¥802,706 million
(U.S.$7,799 million) as of March 31, 2014.
These amounts included ¥905,314 million (U.S.$8,796 million) of secu-
rities deposited and ¥802,691 million (U.S.$7,799 million) of cash received
as collateral under the securities lending transactions secured by cash as of
March 31, 2014.
Assets pledged as collateral by securities, land and buildings as of March
31, 2013, were ¥2,134,013 million, ¥252 million, and ¥59 million, respec-
tively. The total amount of loans covered by the aforementioned assets was
¥1,212,170 million as of March 31, 2013.
These amounts included ¥1,334,903 million of securities deposited and
¥1,212,149 million of cash received as collateral under the securities lending
transactions secured by cash as of March 31, 2013.
Assets pledged as collateral by securities, land and buildings as of March
31, 2012, were ¥1,260,121 million, ¥2,952 million, and ¥274 million,
respectively. The total amount of loans covered by the aforementioned assets
was ¥946,508 million as of March 31, 2012.
These amounts included ¥1,083,818 million of securities deposited and
¥946,476 million of cash received as collateral under the securities lending
transactions secured by cash as of March 31, 2012.
16. investments in subsidiariesThe total amounts of stocks and investments in subsidiaries were ¥239,694
million (U.S.$2,328 million), ¥293,656 million and ¥255,622 million as of
March 31, 2014, 2013 and 2012, respectively.
On March 22, 2012, the Company reached an agreement with Reliance
Capital Limited, which is the parent company of Reliance Capital Asset
Management Limited, an affiliate of the Reliance Group, to acquire 26% of
the shares of Reliance Capital Asset Management Limited.
17. loans(1) The total amount of loans to bankrupt borrowers, delinquent loans, loans
that are delinquent for over three months and restructured loans, which
were included in loans, was ¥39,030 million (U.S.$379 million), ¥42,052
million and ¥42,589 million as of March 31, 2014, 2013 and 2012,
respectively.
i) The balances of loans to bankrupt borrowers and delinquent loans
were ¥2,339 million (U.S.$22 million) and ¥31,941 million (U.S.$310
million) as of March 31, 2014, ¥2,658 million and ¥33,794 million as
of March 31, 2013, and ¥3,018 million and ¥33,532 million as of
March 31, 2012.
Loans to bankrupt borrowers are loans for which interest is not
accrued as income, except for a portion of loans written off, and to
which any event specified in Article 96, Paragraph 1, Item 3 (a) to (e)
or Item 4 of the Order for Enforcement of the Corporation Tax Act has
occurred. Interest is not accrued as income for the loans since the
recovery of principal or interest on the loans is unlikely due to the fact
that principal repayments and interest payments are overdue for a
significant period of time or for other reasons.
Delinquent loans are loans with interest not accrued and exclude
loans to bankrupt borrowers and loans with interest payments
extended with the objective of restructuring or supporting the borrowers.
ii) The balance of loans delinquent for over three months was ¥23 mil-
lion (U.S.$0 million) as of March 31, 2014. There were no loans
delinquent for over three months as of March 31, 2013 and 2012.
Loans that are delinquent for over three months are loans with
principal or interest unpaid for over three months beginning one day
after the due date based on the loan agreement. These loans exclude
loans classified as loans to bankrupt borrowers and delinquent loans.
iii) The balances of restructured loans were ¥4,726 million (U.S.$45
million), ¥5,599 million and ¥6,038 million as of March 31, 2014,
2013 and 2012, respectively.
Restructured loans are loans that provide certain concessions
favorable to borrowers with the intent of supporting the borrowers’
restructuring, such as by reducing or exempting interest, postponing
principal or interest payments, releasing credits, or providing other
benefits to the borrowers. These loans exclude loans classified as
loans to bankrupt borrowers, delinquent loans, and loans delinquent
for over three months.
(2) Direct write-offs of loans decreased the balances of loans to bankrupt
borrowers and delinquent loans by ¥299 million (U.S.$2 million) and
¥403 million (U.S.$3 million) as of March 31, 2014, ¥449 million and
¥382 million as of March 31, 2013, and ¥752 million and ¥1,001 million
as of March 31, 2012.
Cover FeatureBusiness Perform
anceM
anagement of N
ippon Life Nippon Life’s Products and Services
Company Inform
ationFinancial Data
Operational Data
151150

18. loan CommitmentsThe amounts of commitments related to loans and loans outstanding were
¥179,531 million (U.S.$1,744 million), ¥201,481 million and ¥137,032 mil-
lion as of March 31, 2014, 2013 and 2012, respectively.
19. Policy Reserves for Reinsurance Contracts Provided in accordance with article 71, Paragraph 1 of the ordinance for enforcement of the insurance Business act
The amounts of policy reserves provided for the portion of reinsurance (here-
after referred to as “policy reserves for ceded reinsurance”) as defined in
Article 71, Paragraph 1 of the Ordinance for Enforcement of the Insurance
Business Act were ¥188 million (U.S.$1 million), ¥179 million and ¥164 mil-
lion as of March 31, 2014, 2013 and 2012, respectively.
20. Contributions to the life insurance Policyholder Protection Fund and organization
Of the maximum borrowing amount from the Life Insurance Policyholders
Protection Corporation of Japan, which is provided for in Article 37-4 of the
Order for Enforcement of the Insurance Business Act, the amounts applied to
the Company were estimated to be ¥85,750 million (U.S.$833 million),
¥86,176 million and ¥84,947 million as of March 31, 2014, 2013 and 2012,
respectively. The amounts contributed to said corporation were recorded
within operating expenses for the fiscal year.
21. investment income and expensesThe major components of gain on sales of securities were as follows:
Millions of YenMillions of U.S. Dollars
2014 2013 2012 2014
Domestic bonds including national government bonds ¥ 16,879 ¥76,133 ¥ 43,709 $ 164
Domestic stocks 239,424 54,060 68,433 2,326
Foreign securities 4,135 62,155 121,780 40
The major components of loss on sales of securities were as follows:
Millions of YenMillions of U.S. Dollars
2014 2013 2012 2014
Domestic bonds including national government bonds ¥ 1,774 ¥ 263 ¥ 138 $ 17
Domestic stocks 13,678 56,528 34,992 132
Foreign securities 42,277 15,295 118,926 410
The major components of loss on valuation of securities were as follows:
Millions of YenMillions of U.S. Dollars
2014 2013 2012 2014
Domestic stocks ¥21,477 ¥97,749 ¥26,206 $208
Foreign securities 713 675 2,702 6
Loss on derivative financial instruments, net, included net valuation
gains of ¥2,709 million (U.S.$26 million), gains of ¥81,709 million and losses
of ¥84,089 million for the fiscal years ended March 31, 2014, 2013 and
2012, respectively.
22. Policy Reserves for Ceded ReinsuranceProvision for policy reserves for ceded reinsurance that was deducted from
the calculation of provision for policy reserves was ¥8 million (U.S.$0 mil-
lion), ¥14 million and ¥1 million for the fiscal years ended March 31, 2014,
2013 and 2012, respectively.
153152

23. impairment losses i) Method for grouping the assets
Leased property and idle property are classified as one asset group per
structure. Assets utilized for insurance business operations are classified
into one asset group.
ii) Circumstances causing impairment losses
The Company observed a marked decrease in profitability or market value
in some of the fixed asset groups. The book value of fixed assets was
reduced to the recoverable amount and impairment losses were recog-
nized as extraordinary losses.
iii) Breakdown of asset groups that recognized impairment losses:
For the year ended March 31, 2014Millions of Yen
Purpose of use LandLand lease
rights Buildings Total
Leased property ¥2,475 ¥— ¥1,749 ¥4,224
Idle property 373 14 116 504
Total ¥2,848 ¥ 14 ¥1,865 ¥4,728
For the year ended March 31, 2013Millions of Yen
Purpose of use LandLand lease
rights Buildings Total
Leased property ¥ 8,808 ¥1,105 ¥4,234 ¥14,148
Idle property 1,964 30 1,459 3,453
Total ¥10,772 ¥1,135 ¥5,693 ¥17,602
For the year ended March 31, 2012Millions of Yen
Purpose of use LandLand lease
rights Buildings Total
Leased property ¥6,619 ¥ 26 ¥4,472 ¥11,119
Idle property 2,464 — 317 2,781
Total ¥9,084 ¥ 26 ¥4,789 ¥13,900
For the year ended March 31, 2014Millions of U.S. Dollars
Purpose of use LandLand lease
rights Buildings Total
Leased property $24 $— $16 $41
Idle property 3 0 1 4
Total $27 $ 0 $18 $45
iv) Calculation method of recoverable amount
The recoverable amount used for the measurement of impairment losses
is based on the net realizable value upon sales of the assets or the dis-
counted future cash flows.
The discount rate used in the calculation of future cash flows is in
principle 4.0%. Net realizable values are determined based on appraisals
performed in accordance with the “Real Estate Appraisal Standards” or
posted land prices.
24. deferred tax assets and liabilities(1) Deferred tax assets/liabilities consisted of the following:
Millions of YenMillions of U.S. Dollars
2014 2013 2012 2014
Deferred tax assets ¥ 1,206,414 ¥ 1,122,651 ¥1,082,260 $ 11,721
Valuation allowance for deferred tax assets (55,202) (74,031) (81,422) (536)
Subtotal 1,151,212 1,048,620 1,000,838 11,185
Deferred tax liabilities (1,479,843) (1,172,272) (533,903) (14,378)
Net deferred tax assets/ (liabilities) ¥ (328,631) ¥ (123,652) ¥ 466,934 $ (3,193)
The major components causing deferred tax assets/liabilities were as
follows:
Millions of YenMillions of U.S. Dollars
2014 2013 2012 2014
Deferred tax assets:
Policy reserves and other reserves ¥ 747,389 ¥ 698,811 ¥712,374 $ 7,261
Reserve for price fluctuations in investments in securities 191,356 135,897 106,193 1,859
Accrued retirement benefits 118,282 134,473 136,388 1,149
Allowance for doubtful accounts 2,575 3,332 5,386 25
Deferred tax liabilities:
Net unrealized gains on available-for-sale securities ¥1,434,983 ¥1,132,875 ¥494,409 $13,942
(2) The statutory rates were 33.2% for the fiscal years ended March 31,
2014 and 2013, and 36.1% for the fiscal year ended March 31, 2012.
The main factors in the difference between the statutory tax rates and
the effective income tax rates were as follows:
2014 2013 2012
Reserve for dividends to policyholders (19.3)% (22.5)% (12.8)%
Impact from a change in the tax rate — — 31.3 %
Cover FeatureBusiness Perform
anceM
anagement of N
ippon Life Nippon Life’s Products and Services
Company Inform
ationFinancial Data
Operational Data
153152

(3) In conjunction with the promulgation of the “Act for Partial Revision to
the Income Tax Act” (Act No. 10 of 2014), the statutory tax rate applied
to the calculation of deferred tax assets and deferred tax liabilities of
33.2% was changed to 30.7% for collections and payments expected to
be made in the period from April 1, 2014 to March 31, 2015.
As a result of this change, as of March 31, 2014, deferred tax liabili-
ties increased by ¥8,487 million (U.S.$82 million), net unrealized gains
on available-for-sale securities, net of tax increased by ¥582 million
(U.S.$5 million), and land revaluation differences increased by ¥1 million
(U.S.$0 million), while deferred tax liabilities for land revaluation
decreased by ¥1 million (U.S.$0 million). At the same time, income
taxes—deferred increased by ¥9,070 million (U.S.$88 million).
In line with the promulgation of the “Act for Partial Revision of the
Income Tax Act, etc., for the Purpose of Creating Taxation System
Responding to Changes in Economic and Social Structures” (Act No. 114
of 2011) and the “Act on Special Measures for Securing Financial
Resources Necessary to Implement Measures for Reconstruction follow-
ing the Great East Japan Earthquake” (Act No. 117 of 2011), the statu-
tory tax rate applied to measure deferred tax assets and liabilities was
changed from 36.1%. For items that are expected to be collected or paid
during the period from April 1, 2012, to March 31, 2015, the rate was
changed to 33.2%, and for items that are expected to be collected or
paid on or after April 1, 2015, the rate was changed to 30.7%.
As a result of this change, as of March 31, 2012, deferred tax assets
and deferred tax liabilities for land revaluation decreased by ¥61,157
million and ¥25,001 million, respectively, net unrealized gains on available-
for-sale securities, net of tax and land revaluation differences increased
by ¥87,305 million and ¥25,001 million, respectively, and income
taxes—deferred increased by ¥147,915 million.
25. transactions with subsidiariesThe total income and expenses from transactions with subsidiaries for the
fiscal years ended March 31, 2014, 2013 and 2012, were as follows:
Millions of YenMillions of U.S. Dollars
2014 2013 2012 2014
Total income ¥53,430 ¥11,377 ¥ 8,309 $519
Total expenses 29,359 29,759 32,275 285
26. transactions with Related PartiesFor the fiscal years ended March 31, 2014 and 2012
Transactions with related parties are as follows:
Subsidiaries:
Type: Subsidiary
Company Name: NLI Properties West, Inc.
Location: Delaware, U.S.A. (New York, U.S.A.)
Capital as of March 31, 2014: $290 million
Main Business:
Acquisition, management, disposal, and mortgage lending services for real estate for lease
Percentage of Shareholder Voting Rights: —*
Nature of Relationship between Parties: —*
Details of Transaction: Gain on liquidation of subsidiaries and affiliates*
Balance as of March 31, 2014: ¥40,486 million (U.S.$393 million)
* NLI Properties West, Inc. was liquidated in February 2014. Gain on liquidation of subsidiaries and affiliates represents a liquidation dividend from this company.
Subsidiaries
Type: Subsidiary
Company Name: Nissay Credit Guarantee Co., Ltd.
Location: Osaka
Capital as of March 31, 2012: ¥950 million
Main Business: Debt guarantee services
Percentage of Shareholder Voting Rights as of March 31, 2012: Direct 87.3%
Indirect 6.3%
Nature of Relationship between Parties: Debt guarantees
Interlocking directors
Details of Transaction: Debt guarantees of Nippon Life’s loans*
Balance as of March 31, 2012: ¥513,616 million
* Debt guarantees of the loans held by Nippon Life are made in accordance with the guarantee service agreement bound between Nissay Credit Guarantee Co., Ltd. and the debtor.
27. other extraordinary GainsIn the fiscal year ended March 31, 2013, other extraordinary gains represent
a reversal of accrued losses from supporting closely related companies.
28. subsequent event Approval of proposed appropriation of surplus at the annual meeting of the
representatives of policyholders.
The nonconsolidated proposed appropriations of surplus for the fiscal
year ended March 31, 2014, were approved as planned at the annual
meeting of the representatives of policyholders held on July 2, 2014.
155154

INDepeNDeNt aUDItOr’S repOrt (Consolidated Financial Statements)Cover Feature
Business Performance
Managem
ent of Nippon Life
Nippon Life’s Products and ServicesCom
pany Information
Financial DataO
perational Data
155154

INDepeNDeNt aUDItOr’S repOrt (Nonconsolidated Financial Statements)
156