Embed Size (px)
Citation preview
RIASSUNTO
Il lavoro riporta i risultati di un insieme di indagini idrogeologicheed idrochimiche eseguite sul sistema acquifero multistrato di Cremona- caratterizzato dalla presenza di una interfaccia acqua dolce/acqua sal-mastra tra i 400-500 m dal piano campagna - dove sorgerà un nuovocampo pozzi, ad est della città (AEM, 2001). Il progetto del campopozzi, realizzato dall’Azienda Energetica Municipale di Cremona(AEM), prevede l’abbandono di alcune precedenti captazioni e la rea-lizzazione di dieci nuove opere. Al momento sono stati realizzati quat-tro piezometri e due pozzi, che emungono da diversi livelli acquiferiposti a differente profondità. Dalle prove di emungimento effettuatesui due pozzi sono stati ricavati trasmissività (~10-2 m2/s) e coeffi-ciente d’immagazzinamento (10-3÷10-5) per ogni orizzonte acquifero.
È stato costruito un modello semplificato del campo pozzi, cali-brato sulla base dei risultati delle prove di pompaggio: il modello èstato successivamente utilizzato per simulare il comportamento del-l’acquifero a campo pozzi ultimato. La simulazione ha messo in evi-denza l’interferenza tra i coni di depressione, che determina un abbas-samento piezometrico massimo di circa 4 m superiore rispetto a quel-lo che si è verificato con un solo pozzo in funzione, nel caso in cuitutti i pozzi sfruttino due soli degli orizzonti acquiferi utilizzabili.
Le analisi chimiche delle acque hanno rilevato la presenza natu-rale di ammoniaca, ferro, manganese ed arsenico in tutte le falde,confermando la necessità di un impianto di potabilizzazione.
Le analisi delle prove di pompaggio e dei risultati delle simulazio-ni eseguite indicano che, pur se in tempi lunghi (probabilmente del-l’ordine della decina di anni) vi é una possibilità realistica che l’inter-faccia acqua dolce/acqua salmastra risalga fino ai pozzi. È quindiopportuno che l’avvio del campo pozzi coincida con ulteriori indaginiper progettare sin da ora soluzioni che eliminino la possibilità che talefenomeno si verifichi.
TERMINI CHIAVE: pozzo, acquifero multistrato, prova di pompaggio, interfac-cia acqua dolce/salata
INTRODUZIONE
Questo lavoro intende portare un contributo alle conoscenze delsistema acquifero multistrato della Provincia di Cremona e fornire
ABSTRACT
This paper gives the results of a series of hydrogeological andhydrochemical investigations carried out on the multilayered aquifersystem of Cremona – characterized by a fresh water/salt water inter-face 400-500 meters below ground level – where a new well field isto be built east of town (AEM, 2001). The well field project is beingcarried out by the Municipal Energy Company of Cremona (AEM)and calls for the abandoning of a number of older wells and thebuilding of ten new wells. Up to now four piezometers and twowells have already been drilled, which pump at different levels fromaquifers located at different depths. The pumping tests done at thetwo wells have provided transmissivity (~10-2 m2/s) and storagecoefficient (10-3÷10-5) data for each aquifer horizon.
A simplified model of the well field was built, calibratedfrom the pumping test results. The model was then used tosimulate aquifer behavior with the well field completed. Thesimulation showed that the cones of depression would inter-fere with each other, causing a maximum drawdown of about4 meters greater than that occurring with only one well inoperation, if all the wells exploit only two of the usableaquifer horizons.
The hydrochemical analysis revealed the natural presence ofammonia, iron, manganese and arsenic in all the aquifers, confirmingthe necessity of a water treatment plant.
An analysis of both the pumping tests and the simulationresults indicate that there is a realistic possibility that thesalt/fresh water interface may rise up to the wells, although overa long time period (probably decades). Thus it is advisable thatthe putting into operation of the well field coincide with furtherinvestigations for planning solutions to eliminate the possibilityof the rising of this interface.
KEY WORDS: well, multilayered aquifer, pumping test, salt/fresh water inter-face
INTRODUCTION
This paper aims at contributing to the knowledge on the multi-layered aquifer system in the Province of Cremona and to provide
COSTANZA CAMBI*, WALTER DRAGONI*, FEDERICO PASSERI*, DANIELA VALIGI*
*University of Perugia - Department of Earth Sciences - Perugia, Italy - [email protected]
CONTRIBUTO ALLE CONOSCENZE IDROGEOLOGICHE DEL SOTTOSUOLO DICREMONA ED ALLO SFRUTTAMENTO DI NUOVE RISORSE IDROPOTABILI
CONTRIBUTION TO THE HYDROGEOLOGICAL KNOWLEDGE OF THE CREMONAAQUIFER SYSTEM AND TO THE EXPLOITATION OF NEW WATER RESOURCES
Italian Journal of Engineering Geology and Environment, 1 (2005) 71

ipotesi di gestione del nuovo campo pozzi ad est della città. Il siste-ma acquifero multistrato di Cremona comprende varie unità idrostra-tigrafiche (Gruppi Acquiferi) definite da barriere di permeabilità adestensione regionale. In particolare il Gruppo Acquifero da cui vieneprelevata l’acqua nel nuovo campo pozzi è denominato “C”(REGIONE LOMBARDIA – ENI DIVISIONE AGIP, 2002). Nell’area cremo-nese è presente una interfaccia acqua dolce-acqua salmastra, caratte-ristica di tutta la pianura lombarda, che ha una profondità intorno ai400-500 m dal p.c. (REGIONE LOMBARDIA – ENI DIVISIONE AGIP,2002), così da limitare la massima profondità raggiungibile da pozziper acque potabili, anche in funzione della risalita legata al pompag-gio. La presenza di elevate concentrazioni di solfuri e cloruri è statainfatti recentemente rilevata anche a profondità inferiori (circa a 250m dal p.c.) nel già esistente pozzo Postumia, anch’esso situato ad estdella città, ed in funzione da diversi anni.
Il lavoro si basa su prove idrogeologiche ed idrochimiche ese-guite sulle perforazioni già realizzate per il nuovo campo pozzi e puòessere così sintetizzato:u Caratterizzazione dell’acquifero multistrato sulla base di dati
stratigrafici e geofisici sperimentali, esistenti e di nuova acqui-sizione.
u Esecuzione di prove di pompaggio su due pozzi di recente realiz-zazione denominati A e B. Analisi chimica dei campioni di acquaprelevati dai pozzi A e B.
u Costruzione, tramite il noto codice alle differenze finite MOD-FLOW, di un modello semplificato del campo pozzi per ottenereindicazioni riguardo al comportamento dell’acquifero quando tuttii pozzi saranno attivati.
INQUADRAMENTO GEOLOGICO E GEOMORFOLOGICO
La pianura lombarda si caratterizza per la presenza di sedimenticontinentali sovrapposti a sedimenti marini preesistenti; nella pro-vincia di Cremona affiorano esclusivamente depositi continentalicostituiti da sedimenti fluvio–glaciali ed alluvionali di età compresatra il Pleistocene e l’Olocene. In particolare affiorano le seguentiunità (BERETTA et alii, 1993):u Alluvioni recenti (Olocene): alluvioni ghiaioso–sabbioso–limose
degli alvei fluviali. Affiorano con continuità sulle sponde delFiume Adda, del Fiume Serio e del Fiume Oglio.
u Alluvioni antiche (Olocene inferiore): alluvioni sabbiose e ghiaiose,poligeniche con strato di alterazione superficiale mancante o ridotto;ricoprono una fascia estesa di territorio alla sinistra del Fiume Adda.
u Fluvioglaciale Wurm Auct. (Pleistocene superiore): alluvioni sab-biose e ghiaiose per lo più non alterate; è presente, tra i FiumiAdda e Po, uno strato di alterazione giallo con spessore inferioreal metro.
u Fluvioglaciale Riss – Mindel Auct. (Pleistocene medio): sedimentifluvio-glaciali e ghiaiosi, con lenti e banchi limoso argillosi. Talidepositi formano il terrazzo di Romanengo e sono ricoperti da unacoltre di alterazione argilloso – limosa gialla rossastra spessa fino a2.50 m.
hypotheses for the management of the new well field on the easternside of town. The Cremona multilayered aquifer system includes anumber of hydrostratigraphic units (Aquifer Groups) defined byregional permeability barriers. In particular, the water in the newwell field is drawn from Aquifer Group “C” (REGIONE LOMBARDIA –ENI DIVISIONE AGIP, 2002). In the Cremona area there is a freshwater/salt water interface, characteristic of the entire Lombardyplain, at a depth of 400-500 m from ground level (REGIONE
LOMBARDIA – ENI DIVISIONE AGIP, 2002), limiting the maximumdepth that can be reached by the wells for drinkable water, alsodepending on the interface rise resulting from pumping. High con-centrations of sulfides and chlorides have in fact been found recent-ly at lesser depths (about 250 m from ground level) in the existingPostumia well, also located east of town, and which has been inoperation for a number of years.
This work is based on hydrogeological and hydrochemical testsdone on wells already drilled for the new well field, and can besummarized thus:u Characterization of the multilayered aquifer on the basis of both
known and newly acquired experimental stratigraphic and geo-physical data.
u Carrying out of pumping tests on two recently drilled wells,called A and B. Chemical analysis of water samples taken fromwells A and B.
u The building of a simplified model of the well field using thewell-known MODFLOW finite differences code, in order to sim-ulate the behavior of the aquifer when all the wells will be inoperation.
GEOLOGIC AND GEOMORPHOLOGIC OUT-LINE
The Lombardy plain is characterized by continental sedimentslying over preexisting marine sediments; in the province ofCremona only continental deposits outcrop, composed of fluvial-glacial and alluvial sediments from the Pleistocene to theHolocene. In particular, the following units outcrop (BERETTA etalii, 1993):u Recent alluvial sediments (Holocene): gravelly– sandy–silty allu-
vial sediments of river beds. They outcrop with continuity on thebanks of the Adda River, the Serio River and the Oglio River.
u Ancient alluvial sediments (Lower Holocene): sandy and gravelly allu-vial sediments, polygenetic with a limited or no layer of surface alter-ation; they cover a wide strip of the area on the left of the Adda River.
u Fluvial-glacial Wurm Auct. (Upper Pleistocene): sandy and gravel-ly alluvial sediments, for the most part unaltered; between the Addaand Po rivers there is a yellow layer of alteration less than onemeter thick.
u Fluvial-glacial Riss–Mindel Auct. (Middle Pleistocene): fluvial-glacial and gravelly sediments, with lenses and silty-argillaceousbanks. These deposits form the Romanengo terrace and are coveredwith a sheet of reddish yellow argillaceous–silty alteration up to2.50 m thick.
Costanza CAMBI, Walter DRAGONI, Federico PASSERI, Daniela VALIGI72
CONTRIBUTO ALLE CONOSCENZE IDROGEOLOGICHE DEL SOTTOSUOLO DI CREMONA ED ALLO SFRUTTAMENTO DI NUOVE RISORSE IDROPOTABILI
Dal punto di vista morfologico il territorio in esame presenta unacomplessiva uniformità con quote comprese tra i 42 e i 43 m s.l.m..Il reticolo idrografico è costituito da una fitta rete di canali alimenta-ti da vari corsi d’acqua (Adda, Oglio, etc.); le acque nell’insiemescorrono verso sud est in accordo con la pendenza del terreno.
CARATTERISTICHE IDROGEOLOGICHE
Dal punto di vista idrogeologico nella pianura lombarda rivesteparticolare importanza il fatto che i depositi marini sono ancora inparte, permeati da acqua salmastra. L’acqua dolce infiltratasi succes-sivamente ha permeato i depositi continentali e ha spinto in profondi-tà l’interfaccia acqua dolce/acqua salmastra. Presso Brescia l’interfac-cia si attesta attualmente a circa 740 m al di sotto del livello del mare,per risalire bruscamente verso la superficie nelle aree Mantovana eCremonese, tra i 350 e i 450 m al di sotto del livello del mare(REGIONE LOMBARDIA – ENI DIVISIONE AGIP, 2002). L’interfacciaacqua dolce/acqua salmastra non è comunque statica perché dipendeanche dai prelievi esercitati nelle soprastanti e più leggere acque dolci.I depositi permeati da acque dolci si caratterizzano per l’alternanza dilivelli sabbiosi, limosi ed argillosi, con subordinati livelli di ghiaietto,torba e lignite che determinano una sovrapposizione di livelli per-meabili e non. Ciò comporta la presenza di acquiferi multistrato, la cuiimpostazione è favorita anche dall’andamento monoclinalico dellasuccessione alluvionale, che determina, tra l’altro, un flusso idricounidirezionale verso l’alveo del Po (BERETTA et alii, 1993; REGIONE
LOMBARDIA – ENI DIVISIONE AGIP, 2002). È da notare che l’isolamen-to tra una falda e l’altra sembra verificarsi per un’estensione arealenon superiore a qualche chilometro quadrato (BASSI, 2000).
PROGETTO DEI NUOVI CAMPI POZZI DI CREMONA
L’attuale servizio di approvvigionamento idrico di Cremona èaffidato all’Azienda Energetica Municipale (AEM). L’AEM hadeciso di abbandonare buona parte delle captazioni già esistenti e direalizzare due nuovi campi pozzi situati ad est e ad ovest della cittàal fine di rientrare nei nuovi parametri limite proposti dallaDirettiva Europea 98/83/CE del 03/11/1998, divenuta D.L. n° 31 il2 febbraio 2001. Tale direttiva obbliga alla rimozione spinta diferro, manganese, ammoniaca e arsenico, elementi che si trovano innatura nella zona cremonese (ZAVATTI et alii, 1995). I due nuovicampi pozzi andrebbero ad affiancare alcuni pozzi già esistenti,quali il pozzo Postumia ed il pozzo Nuvolone, e ogni sito sarà dota-to di un proprio impianto di trattamento.
In questo lavoro ci si occuperà del campo pozzi situato adest della città, che da ora in poi verrà chiamato Campo PozziEst.
CAMPO POZZI EST
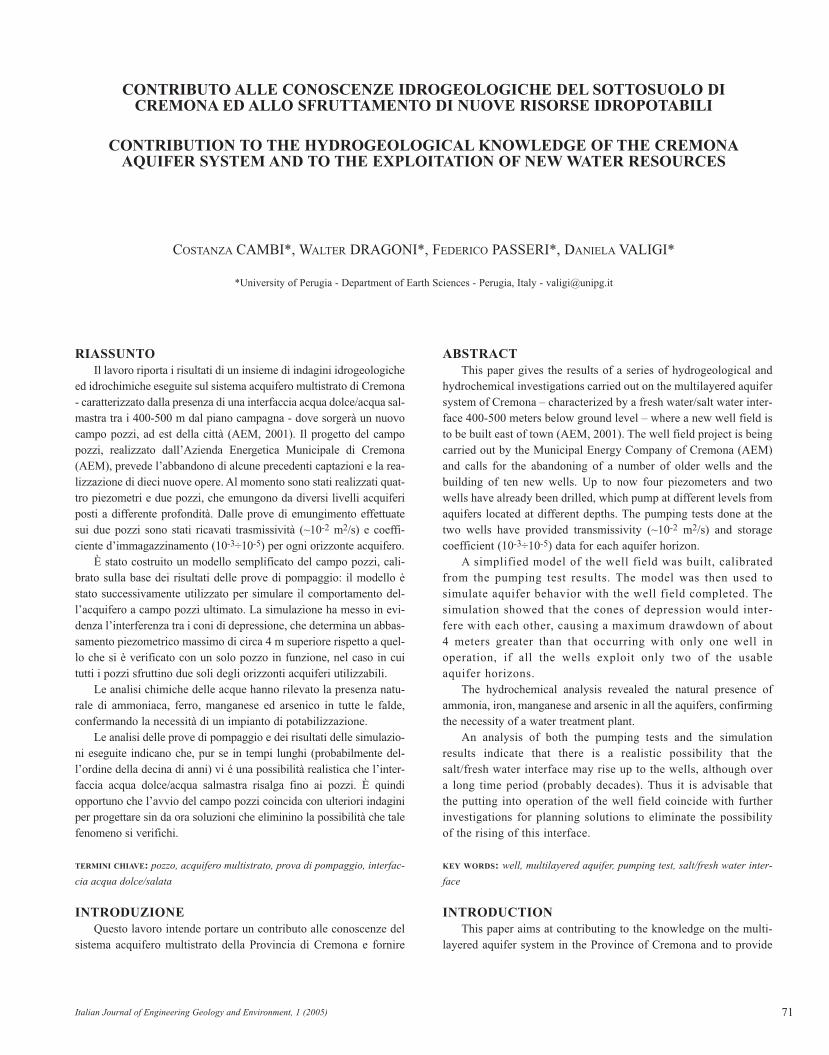
Il progetto esecutivo del Campo Pozzi Est prevede la realizza-zione di dieci nuovi pozzi che andranno ad affiancare il già esistentePozzo Postumia (Fig. 1). Per evitare possibili problemi di contami-
Morphologically, the area being investigated is uniform overall,at an elevation between 42 and 43 m a.s.l. The channel net is com-posed of a dense network of channels fed by various rivers (Adda,Oglio, etc.); on the whole the water flows southeast, following theslope of the land.
HYDROGEOLOGICAL CHARACTERISTUCS
In the Lombardy plain, of particular importance from a hydroge-ological viewpoint is the fact that the marine deposits are still par-tially permeated by salt water. The fresh water that infiltrated subse-quently permeated the continental deposits and pushed the freshwater/salt water interface downward. The interface is currently atabout 740 m below sea level near Brescia, and then it rises abruptlyto 350-450 m below sea level in the Mantua and Cremona areas(REGIONE LOMBARDIA – ENI DIVISIONE AGIP, 2002). The freshwater/salt water interface is not static, however, because it dependsalso on the amount of water being drawn from the overlying andlighter fresh water. The deposits permeated with fresh water are char-acterized by the alternation of sandy, silty and argillaceous levels,with subordinate levels of fine gravel, peat and lignite that create asuperposition of permeable and impermeable levels. This bringsabout the presence of multilayered aquifers, whose structure isfavored also by the monocline trend of the alluvial sequence, which,moreover, causes the groundwater to flow in a single direction,toward the Po River (BERETTA et alii, 1993; REGIONE LOMBARDIA –ENI DIVISIONE AGIP, 2002). It should be noticed that the isolationbetween one groundwater layer and the next seems to occur over anarea no greater than a few square kilometers (BASSI, 2000).
NEW WELL FIELDS PROJECT IN CREMONA
At the present time, water in Cremona is supplied by theAzienda Energetica Municipale (AEM–Municipal EnergyCompany). The AEM has decided to abandon many of the exist-ing wells and to build two new well fields on the eastern andwestern sides of town, in order to comply with the new maxi-mum allowable levels proposed by European Directive98/83/EC of 3 November 1998, which became D.L. no. 31 of 2February 2001. This directive requires the removal of iron,manganese, ammonia and arsenic, elements which are found innature in the Cremona area (ZAVATTI et alii, 1995). The two newwell fields will join a number of existing wells, such as thePostumia and Nuvolone wells, and each site will have its owntreatment plant.
This work will deal with the well field located east of town,which hereinafter will be called the Eastern Well Field.
EASTERN WELL FIELD
The final plan for the Eastern Well Field calls for thedrilling of ten new wells, which will join the existing PostumiaWell (Fig. 1). In order to avoid possible problems of contami-
Italian Journal of Engineering Geology and Environment, 1 (2005) 73
CONTRIBUTION TO THE HYDROGEOLOGICAL KNOWLEDGE OF THE CREMONAAQUIFER SYSTEM AND TO THE EXPLOITATION OF NEW WATER RESOURCES
nazione di origine antropica l’AEM ha scelto di sfruttare gli orizzon-ti acquiferi più profondi.
L’area rientra nella tavoletta NW, quadrante III, foglio 61 dellaCarta IGM 1:25000. Una volta ultimato, il Campo Pozzi Est svolge-rebbe una doppia funzione: alimentare la zona orientale della città erifornire la Centrale Realdo Colombo per l’approvvigionamento idricodel centro storico. Il progetto prevede inoltre che, dopo aver messo inesercizio le nuove opere di captazione, si provveda, in maniera gra-duale, a dismettere e successivamente a cementare parte dei pozziattualmente in uso.
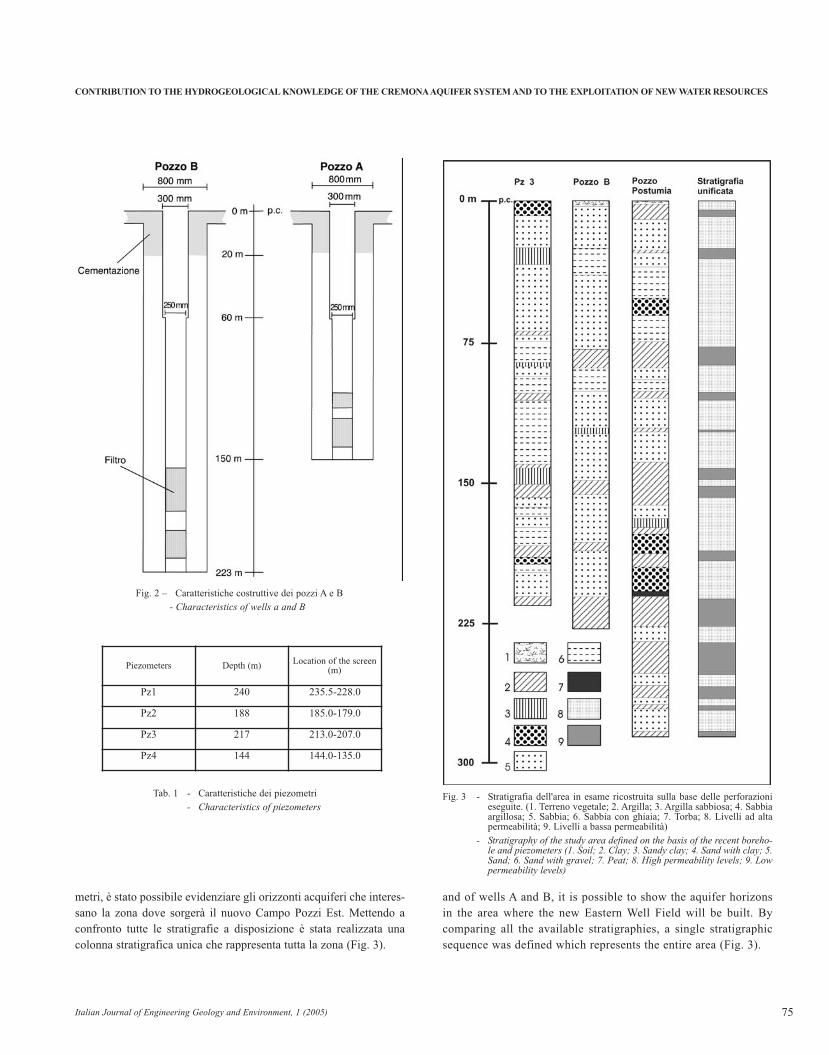
La portata di emungimento prevista per ogni pozzo è di circa0.050-0.060 m3/s. Il progetto prevede la captazione selettiva dadiversi acquiferi, garantita dalla ricostruzione degli orizzonti di sepa-razione a bassa permeabilità attraversati dalla perforazione. La pro-fondità massima prevista per i pozzi non sarà superiore ai 240 m dalp.c. come suggerito dalle indagini eseguite preventivamente sulpozzo Postumia, profondo 285 m dal p.c. Ulteriori informazioni idro-geologiche-idrochimiche sono state ottenute dopo la realizzazione diquattro piezometri (Pz1, Pz2, Pz3 e Pz4) e di due pozzi (Pozzo A ePozzo B). I quattro piezometri, realizzati nel 2001, raggiungono diver-se profondità, e captano acqua da livelli acquiferi differenti; i pozzi,realizzati tra la fine del 2001 e l’inizio del 2002, raggiungono 150(pozzo A) e 223 (pozzo B) m di profondità (Fig. 2), e distano 200 ml’uno dall’altro. I piezometri 2 e 3 attingono, ciascuno, ad uno deilivelli che interessano il pozzo B, mentre il piezometro 4 interessa unodei due livelli che alimentano il pozzo A.
La Tabella 1 mostra la profondità di ciascun piezometro e la posi-zione dei filtri. Sulla base delle indagini idrogeologiche condotte sulpozzo Postumia, dei logs geofisici effettuati nel piezometro 3 (BALDI,2001) e della ricostruzione litostratigrafica basata sui campioni dicuttings prelevati durante le perforazioni dei pozzi A e B e dei piezo-
nation caused by man, the AEM decided to exploit the deeperaquifer levels.
The area lies within the NW table, quadrant III, sheet 61 of theIGM Map 1:25000. Once completed, the Eastern Well Field willhave a dual function: to supply the eastern area of town and to sup-ply the Centrale Realdo Colombo for providing water to the his-toric center. After the new wells are in operation, the plan also pro-vides for the gradual abandoning and sealing of part of the wellscurrently being used.
The pumping discharge estimated for each well is approxi-mately 0.050-0.060 m3/s. The plan provides for the selective tap-ping of different aquifers, guaranteed by the reconstruction of thelow permeability separation horizons through drilling. The maxi-mum depth planned for the wells will not be greater than 240 mfrom ground level, as suggested by the investigations done before-hand on the Postumia Well, which is 285 m deep from groundlevel. Further hydrogeological-hydrochemical information wasobtained after the drilling of four piezometers (Pz1, Pz2, Pz3 andPz4) and two wells (Well A and Well B). The four piezometers,drilled in 2001, reach different depths, and draw water from dif-ferent aquifer levels. The wells were drilled in late 2001/early2002, and reach depths of 150 m (well A) and 223 meters (well B)(Fig. 2), and are located 200 m apart from each other. Piezometers2 and 3 each draw at one of the levels that feed well B, andpiezometer 4 at one of the two levels that feed well A.
Table 1 shows the depth of each piezometer and the positionof the filters.
On the basis of the hydrogeological investigations conductedon the Postumia well, the geophysical logs carried out in piezome-ter 3 (BALDI, 2001) and the lithostratigraphic reconstruction basedon samples of cuttings taken during the drilling of the piezometers
Costanza CAMBI, Walter DRAGONI, Federico PASSERI, Daniela VALIGI74
CONTRIBUTO ALLE CONOSCENZE IDROGEOLOGICHE DEL SOTTOSUOLO DI CREMONA ED ALLO SFRUTTAMENTO DI NUOVE RISORSE IDROPOTABILI
Fig. 1 - Schema progettuale preliminare del campo pozzi Est (1. Pozzi da rea-lizzare secondo il progetto; 2. Pozzi perforati recentemente; 3. Pozzipreesistenti ed in esercizio; 4. Piezometri; 5. Impianto di trattamento)
- Eastern well field scheme according to the project (1. Wells to be dril-led according to the project; 2. Recently borehole; 3. Former wells cur-rently in operation; 4. Piezometers; 5. Treatment plant)
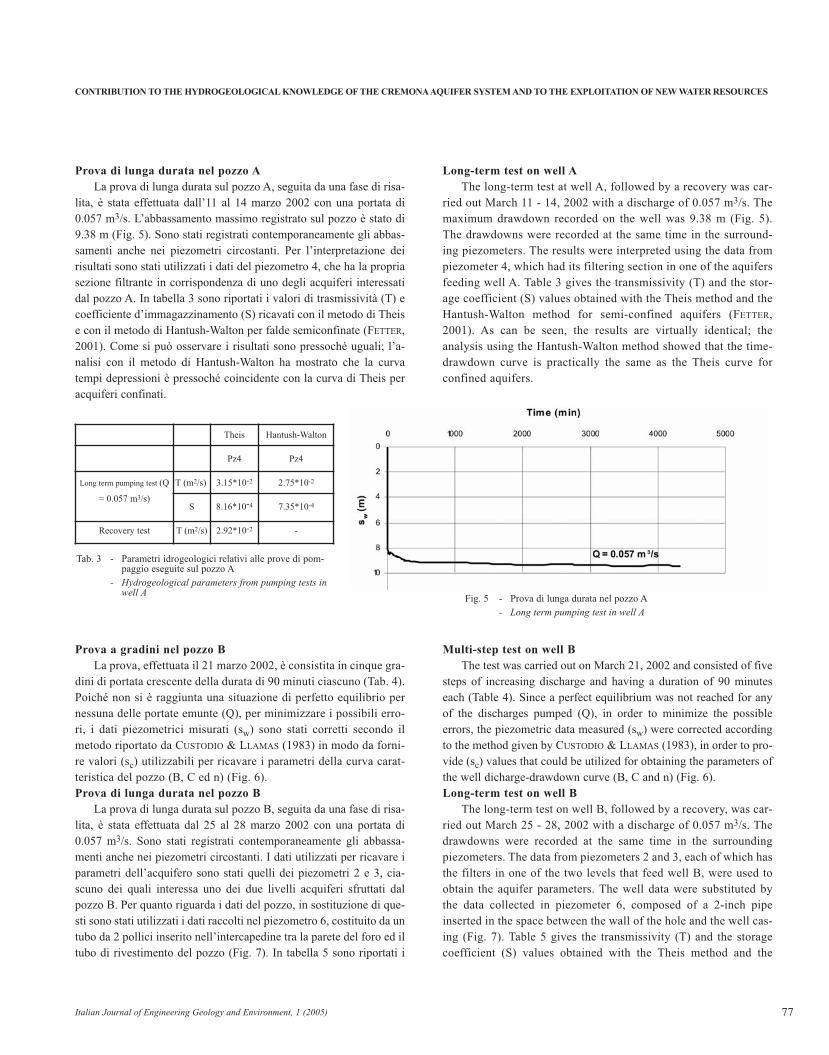
metri, è stato possibile evidenziare gli orizzonti acquiferi che interes-sano la zona dove sorgerà il nuovo Campo Pozzi Est. Mettendo aconfronto tutte le stratigrafie a disposizione è stata realizzata unacolonna stratigrafica unica che rappresenta tutta la zona (Fig. 3).
and of wells A and B, it is possible to show the aquifer horizonsin the area where the new Eastern Well Field will be built. Bycomparing all the available stratigraphies, a single stratigraphicsequence was defined which represents the entire area (Fig. 3).
Italian Journal of Engineering Geology and Environment, 1 (2005) 75
CONTRIBUTION TO THE HYDROGEOLOGICAL KNOWLEDGE OF THE CREMONAAQUIFER SYSTEM AND TO THE EXPLOITATION OF NEW WATER RESOURCES
Tab. 1 - Caratteristiche dei piezometri
- Characteristics of piezometers
Piezometers Depth (m) Location of the screen(m)
Pz1 240 235.5-228.0
Pz2 188 185.0-179.0
Pz3 217 213.0-207.0
Pz4 144 144.0-135.0
Fig. 2 – Caratteristiche costruttive dei pozzi A e B
- Characteristics of wells a and B
Fig. 3 - Stratigrafia dell'area in esame ricostruita sulla base delle perforazionieseguite. (1. Terreno vegetale; 2. Argilla; 3. Argilla sabbiosa; 4. Sabbiaargillosa; 5. Sabbia; 6. Sabbia con ghiaia; 7. Torba; 8. Livelli ad altapermeabilità; 9. Livelli a bassa permeabilità)
- Stratigraphy of the study area defined on the basis of the recent boreho-le and piezometers (1. Soil; 2. Clay; 3. Sandy clay; 4. Sand with clay; 5.Sand; 6. Sand with gravel; 7. Peat; 8. High permeability levels; 9. Lowpermeability levels)

Costanza CAMBI, Walter DRAGONI, Federico PASSERI, Daniela VALIGI
CONTRIBUTO ALLE CONOSCENZE IDROGEOLOGICHE DEL SOTTOSUOLO DI CREMONA ED ALLO SFRUTTAMENTO DI NUOVE RISORSE IDROPOTABILI
GradinoStep Q (m3/s) sw (m) sc (m)
1° 0.024 3.43 3.43
2° 0.036 5.23 5.17
3° 0.057 9.08 8.97
Fig. 4 - Curva caratteristica del pozzo A e relativi parametri. La linea tratteggiata indica l'andamento delleperdite di carico lineari
- Discharge-drawdown curve of well A and parameters according to the Jacob equation. The dashedline indicates the linear trend
PROVE DI EMUNGIMENTO NEL CAMPO POZZI EST
Per avere maggiori indicazioni sulle caratteristiche idrogeo-logiche dell’area, sono state eseguite prove di pompaggio, a gra-dini e di lunga durata, sui pozzi A e B, i cui livelli statici eranorispettivamente, al momento delle prove, 11.04 e 10.87 m da p.c..In contemporanea sono stati misurati i livelli dinamici sui piezo-metri circostanti. I dati delle prove a gradini sono stati utilizzatiper definire i parametri della curva caratteristica di ciascunpozzo, mentre i dati delle prove a lunga durata e quelli registratiin risalita sono serviti a definire il valore di trasmissività (T) ecoefficiente d’immagazzinamento (S) dei vari acquiferi.
Prova a gradini nel pozzo A
La prova, effettuata l’8 marzo 2002, ha consistito in quattro gra-dini di portata crescente della durata di 120 minuti ciascuno (Tab. 2).A causa di problemi tecnici che hanno provocato l’interruzione del-l’emungimento nella prima ora di prova si è ritenuto opportuno uti-lizzare i soli dati degli ultimi tre gradini per la sua interpretazione.Poiché non si è raggiunta una situazione di perfetto equilibrio pernessuna delle portate emunte (Q), per minimizzare i possibili errori,i dati piezometrici misurati (sw) sono stati corretti secondo il metodoriportato da CUSTODIO & LLAMAS (1983), in modo da fornire valori(sc) utilizzabili per ricavare i parametri della curva caratteristica delpozzo (B, C ed n) (Fig. 4).
PUMPING TESTS IN THE EASTERN WELL FIELD
In order to improve knowledge on the area’s hydrogeologicalcharacteristics, multi-step and long term constant dischargepumping tests were carried out on wells A and B, whose undis-turbedpiezometric levels at the time of the tests were respective-ly 11.04 m and 10.87 m from ground surface. At the same time,the drawdown of the surrounding piezometers were measured.The multi-step test data were used to define the parameters of thedischarge-drawdown curve for each well, while the long-termtest data and the recovery data served to define the transmissivi-ty (T) and storage coefficient (S) values of the various aquifers.
Multi-step test on well A
The test was carried out on March 8, 2002 and consisted of foursteps of increasing discharge and having a duration of 120 minuteseach (Table 2). Because of technical problems which interrupted thepumping during the first hour of the test, it was considered best touse only the data from the last three steps. Since a perfect equilibri-um was not reached for any of the discharges pumped (Q), in orderto minimize the possible errors, the piezometric data measured (sw)were corrected according to the method given by CUSTODIO &LLAMAS (1983), in order to provide (sc) values that could be utilizedfor obtaining the parameters of the well discharge-drawdown curve(B, C and n) (Fig. 4).
Tab. 2 - Dati relativi alla prova a gradini nel pozzo A
- Multi-step pumping test data in well A
76
Prova di lunga durata nel pozzo A
La prova di lunga durata sul pozzo A, seguita da una fase di risa-lita, è stata effettuata dall’11 al 14 marzo 2002 con una portata di0.057 m3/s. L’abbassamento massimo registrato sul pozzo è stato di9.38 m (Fig. 5). Sono stati registrati contemporaneamente gli abbas-samenti anche nei piezometri circostanti. Per l’interpretazione deirisultati sono stati utilizzati i dati del piezometro 4, che ha la propriasezione filtrante in corrispondenza di uno degli acquiferi interessatidal pozzo A. In tabella 3 sono riportati i valori di trasmissività (T) ecoefficiente d’immagazzinamento (S) ricavati con il metodo di Theise con il metodo di Hantush-Walton per falde semiconfinate (FETTER,2001). Come si può osservare i risultati sono pressoché uguali; l’a-nalisi con il metodo di Hantush-Walton ha mostrato che la curvatempi depressioni è pressoché coincidente con la curva di Theis peracquiferi confinati.
Prova a gradini nel pozzo B
La prova, effettuata il 21 marzo 2002, è consistita in cinque gra-dini di portata crescente della durata di 90 minuti ciascuno (Tab. 4).Poiché non si è raggiunta una situazione di perfetto equilibrio pernessuna delle portate emunte (Q), per minimizzare i possibili erro-ri, i dati piezometrici misurati (sw) sono stati corretti secondo ilmetodo riportato da CUSTODIO & LLAMAS (1983) in modo da forni-re valori (sc) utilizzabili per ricavare i parametri della curva carat-teristica del pozzo (B, C ed n) (Fig. 6).Prova di lunga durata nel pozzo B
La prova di lunga durata sul pozzo B, seguita da una fase di risa-lita, è stata effettuata dal 25 al 28 marzo 2002 con una portata di0.057 m3/s. Sono stati registrati contemporaneamente gli abbassa-menti anche nei piezometri circostanti. I dati utilizzati per ricavare iparametri dell’acquifero sono stati quelli dei piezometri 2 e 3, cia-scuno dei quali interessa uno dei due livelli acquiferi sfruttati dalpozzo B. Per quanto riguarda i dati del pozzo, in sostituzione di que-sti sono stati utilizzati i dati raccolti nel piezometro 6, costituito da untubo da 2 pollici inserito nell’intercapedine tra la parete del foro ed iltubo di rivestimento del pozzo (Fig. 7). In tabella 5 sono riportati i
Long-term test on well A
The long-term test at well A, followed by a recovery was car-ried out March 11 - 14, 2002 with a discharge of 0.057 m3/s. Themaximum drawdown recorded on the well was 9.38 m (Fig. 5).The drawdowns were recorded at the same time in the surround-ing piezometers. The results were interpreted using the data frompiezometer 4, which had its filtering section in one of the aquifersfeeding well A. Table 3 gives the transmissivity (T) and the stor-age coefficient (S) values obtained with the Theis method and theHantush-Walton method for semi-confined aquifers (FETTER,2001). As can be seen, the results are virtually identical; theanalysis using the Hantush-Walton method showed that the time-drawdown curve is practically the same as the Theis curve forconfined aquifers.
Multi-step test on well B
The test was carried out on March 21, 2002 and consisted of fivesteps of increasing discharge and having a duration of 90 minuteseach (Table 4). Since a perfect equilibrium was not reached for anyof the discharges pumped (Q), in order to minimize the possibleerrors, the piezometric data measured (sw) were corrected accordingto the method given by CUSTODIO & LLAMAS (1983), in order to pro-vide (sc) values that could be utilized for obtaining the parameters ofthe well dicharge-drawdown curve (B, C and n) (Fig. 6).Long-term test on well B
The long-term test on well B, followed by a recovery, was car-ried out March 25 - 28, 2002 with a discharge of 0.057 m3/s. Thedrawdowns were recorded at the same time in the surroundingpiezometers. The data from piezometers 2 and 3, each of which hasthe filters in one of the two levels that feed well B, were used toobtain the aquifer parameters. The well data were substituted bythe data collected in piezometer 6, composed of a 2-inch pipeinserted in the space between the wall of the hole and the well cas-ing (Fig. 7). Table 5 gives the transmissivity (T) and the storagecoefficient (S) values obtained with the Theis method and the
Italian Journal of Engineering Geology and Environment, 1 (2005)
CONTRIBUTION TO THE HYDROGEOLOGICAL KNOWLEDGE OF THE CREMONAAQUIFER SYSTEM AND TO THE EXPLOITATION OF NEW WATER RESOURCES
77
Theis Hantush-Walton
Pz4 Pz4
Long term pumping test (Q
= 0.057 m3/s)
T (m2/s) 3.15*10-2 2.75*10-2
S 8.16*10-4 7.35*10-4
Recovery test T (m2/s) 2.92*10-2 -
Tab. 3 - Parametri idrogeologici relativi alle prove di pom-paggio eseguite sul pozzo A
- Hydrogeological parameters from pumping tests inwell A
Fig. 5 - Prova di lunga durata nel pozzo A
- Long term pumping test in well A
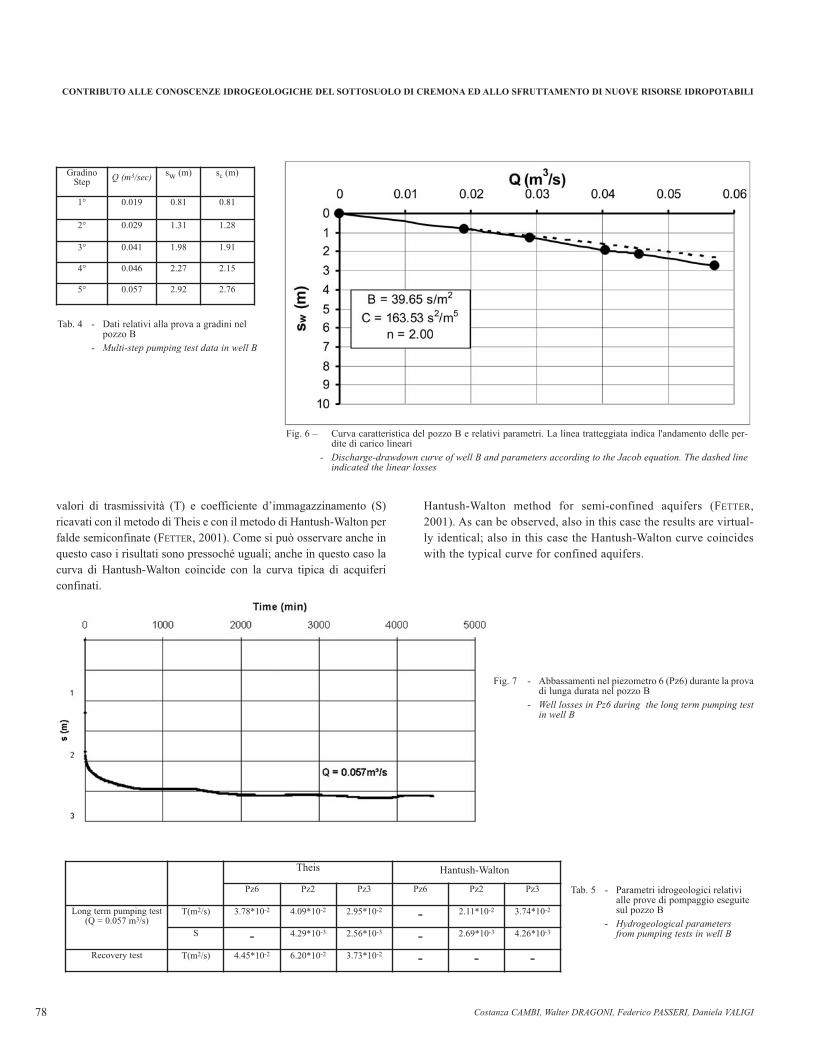
valori di trasmissività (T) e coefficiente d’immagazzinamento (S)ricavati con il metodo di Theis e con il metodo di Hantush-Walton perfalde semiconfinate (FETTER, 2001). Come si può osservare anche inquesto caso i risultati sono pressoché uguali; anche in questo caso lacurva di Hantush-Walton coincide con la curva tipica di acquifericonfinati.
Hantush-Walton method for semi-confined aquifers (FETTER,2001). As can be observed, also in this case the results are virtual-ly identical; also in this case the Hantush-Walton curve coincideswith the typical curve for confined aquifers.
Costanza CAMBI, Walter DRAGONI, Federico PASSERI, Daniela VALIGI78
CONTRIBUTO ALLE CONOSCENZE IDROGEOLOGICHE DEL SOTTOSUOLO DI CREMONA ED ALLO SFRUTTAMENTO DI NUOVE RISORSE IDROPOTABILI
Fig. 6 – Curva caratteristica del pozzo B e relativi parametri. La linea tratteggiata indica l'andamento delle per-dite di carico lineari
- Discharge-drawdown curve of well B and parameters according to the Jacob equation. The dashed lineindicated the linear losses
Fig. 7 - Abbassamenti nel piezometro 6 (Pz6) durante la provadi lunga durata nel pozzo B
- Well losses in Pz6 during the long term pumping testin well B
GradinoStep Q (m3/sec) sw (m) sc (m)
1° 0.019 0.81 0.81
2° 0.029 1.31 1.28
3° 0.041 1.98 1.91
4° 0.046 2.27 2.15
5° 0.057 2.92 2.76
TheisTheis
Pz6 Pz2 Pz3 Pz6 Pz2 Pz3
Long term pumping test(Q = 0.057 m3/s)
T(m2/s) 3.78*10-2 4.09*10-2 2.95*10-2 - 2.11*10-2 3.74*10-2
S - 4.29*10-3 2.56*10-3 - 2.69*10-3 4.26*10-3
Recovery test T(m2/s) 4.45*10-2 6.20*10-2 3.73*10-2 - - -
Tab. 4 - Dati relativi alla prova a gradini nelpozzo B
- Multi-step pumping test data in well B
Tab. 5 - Parametri idrogeologici relativialle prove di pompaggio eseguitesul pozzo B
- Hydrogeological parametersfrom pumping tests in well B
Hantush-Walton

Italian Journal of Engineering Geology and Environment, 1 (2005)
CONTRIBUTION TO THE HYDROGEOLOGICAL KNOWLEDGE OF THE CREMONAAQUIFER SYSTEM AND TO THE EXPLOITATION OF NEW WATER RESOURCES
OSSERVAZIONI SULLE PROVE
I grafici delle prove di pompaggio e la loro interpretazione indi-cano che, sostanzialmente, gli acquiferi considerati possono essereassimilati ad acquiferi confinati. Le prove a gradini mostrano che,nonostante le perplessità che si possono avanzare sui metodi tradi-zionali d’interpretazione della curva caratteristica (DRISCOLL, 1989;DRAGONI, 1999), i pozzi sono stati ben progettati e ben costruiti: perentrambe le opere i dati indicano infatti che la curva caratteristicasegue l’equazione di Jacob e che l’efficienza rimane al di sopra del75%, anche alla massima portata (0.057 m3/s). Sebbene il parametroefficienza possa talvolta non dare indicazioni significative sulla“qualità” del sistema pozzo acquifero (CAMBI, 2001), nel caso in que-stione le depressioni si mantengono piuttosto contenute in rapportoalle portate emunte. In questo contesto, nonostante i dubbi che si pos-sono avanzare sul cosiddetto criterio di Walton, vale la pena di sotto-lineare che in entrambi i pozzi il coefficiente C dell’equazione diJacob é ben inferiore a 675 s2/m5: secondo tale criterio ciò indica chei pozzi sono “ben costruiti e ben condizionati” (DE MARSILY, 1986;HAMILL & BELL, 1986).
Si noti che, sia alla massima portata emunta nel corso della provaa gradini che durante la prova di lunga durata, la depressione regi-strata nel pozzo A (~ 9 m) è circa il triplo di quella registrata nelpozzo B (~ 3 m): ciò é coerente con il maggiore valore medio dellatrasmissività per il pozzo B e con il minor valore del coefficiente Cper lo stesso pozzo. La curva caratteristica di entrambi i pozzi é tipi-ca di opere che emungono da acquiferi confinati.
Nel corso delle prove di lunga durata e nel corso della risalita sisono verificate delle oscillazioni periodiche dei livelli dovute, conogni probabilità, al fatto che alcune opere di captazione nei pressi delnuovo Campo Pozzi Est, sono attive di giorno e vengono spentedurante la notte. In fase di elaborazione dei dati non si è tenuto contodi queste oscillazioni, che sono dell’ordine di pochi centimetri e pos-sono essere considerate ininfluenti. Tuttavia l’esistenza di questeanomalie indica l’interferenza delle opere del Campo Pozzi Est conpozzi già esistenti in zone limitrofe.
PRINCIPALI CARATTERI CHIMICI DELL’ACQUIFE-
RO DI CREMONA
La più recente normativa sulla qualità delle acque é il D.L. 31 del2001; questo decreto indica le concentrazioni massime ammissibilicon il termine “Valore del Parametro” (Allegato I, parte B): nel segui-to, si userà il termine VMA (Valore Massimo Ammissibile) perché dipiù immediata comprensione.
Ammoniaca, ferro, manganese e arsenico sono naturalmentepresenti, in quantità non trascurabili, nelle acque degli acquifericremaschi (FRANCANI et alii, 1994). È importante notare che l’en-trata in vigore del suddetto decreto ha abbassato il VMA dell’arse-nico a 10 µg/l, contro i 50 µg/l precedentemente ammessi dalD.P.R. 236 del 1988, mentre ha lasciato invariate i VMA di Fe, Mned ammoniaca. Questa variazione è particolarmente significativanel caso delle acque di Cremona perché, in base alle indagini sulle
TEST OBSERVATIONS
The graphs of the pumping tests and their interpretation indicatethat, in practice, the aquifers under consideration can be assimilatedto confined aquifers. The multi-step tests show that although theremay be some perplexities regarding the traditional methods of inter-pretation of the discharge-drawdown curve (DRISCOLL, 1989;DRAGONI, 1999), the wells were properly planned and built: the datafor both wells show in fact that the discharge-drawdown curve fol-lows the Jacob equation and that efficiency remains above 75% evenat maximum discharge (0.057 m3/s). Even though the efficiencyparameter may not always give significant indications as to the“quality” of the aquifer-well system, (CAMBI, 2001), in the case beingexamined here the drawdowns remained rather limited in relation tothe discharges pumped. In this context, despite the doubts that maybe entertained regarding the so-called Walton criterion, it should beunderlined that in both wells coefficient C of the Jacob equation ismuch lower than 675 s2/m5: according to the mentioned criterion thisindicates that the wells are “well-built and well-conditioned” (DE
MARSILY, 1986; HAMILL & BELL, 1986).It should be noted that at the maximum discharge pumped dur-
ing both the multi-step and the long-term tests, the drawdownrecorded in well A (~ 9 m) is about three times higher than thedrawdown recorded in well B (~ 3 m): this is consistent with thehigher mean transmissivity value and the lower coefficient C forwell B. The discharge-drawdown curve for both wells is typical ofwells pumping from confined aquifers.
During the long-term tests and during the recovery stage therewere periodic oscillations in the levels, probably due to the fact thatsome wells near the new Eastern Well Field are in operation duringthe day and are shut down at night. These oscillations were nottaken into consideration during the processing of the data, as theyare on the order of a just a few centimeters and can be consideredto be not influential. However, these anomalies provide evidence ofthe interference of the Eastern Well Field wells with existing wellsin nearby areas.
MAIN CHEMICAL CHARACTERISTICS OF THE
CREMONA AQUIFER
The most recent law on water quality is D.L. 31/2001; thisdecree gives the maximum concentrations allowable using the term“Parameter Value” (Annex I, part B): hereinafter the term MAV(Maximum Allowable Value) will be used, because it is more read-ily understood.
Ammonia, iron, manganese and arsenic are naturally presentin significant amounts in the water in the Cremona aquifers(FRANCANI et alii, 1994). It is important to note that the cominginto force of the aforesaid decree has lowered the MAV of arsenicto 10 µg/l, compared to the 50 µg/l previously allowed by D.P.R.236 of 1988, while the MAVs of Fe, Mn and ammonia haveremained unchanged. This variation is particularly significant inthe case of Cremona’s water, because analysis of the chemical-
79
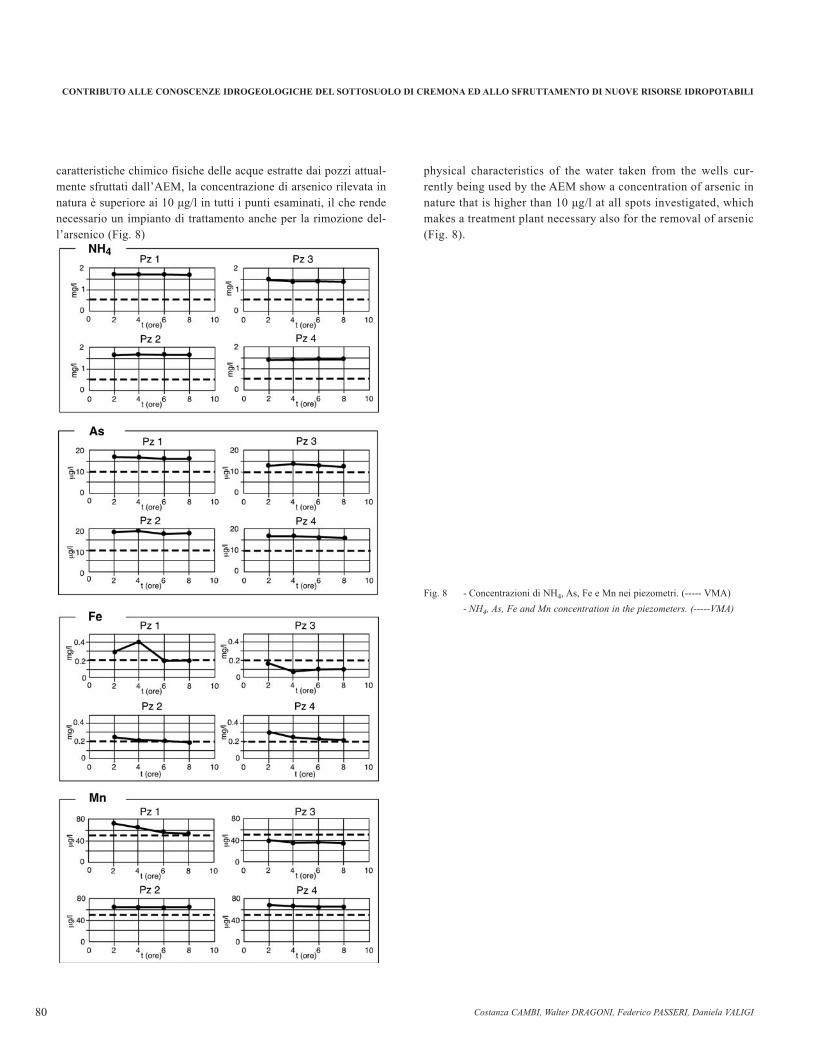
caratteristiche chimico fisiche delle acque estratte dai pozzi attual-mente sfruttati dall’AEM, la concentrazione di arsenico rilevata innatura è superiore ai 10 µg/l in tutti i punti esaminati, il che rendenecessario un impianto di trattamento anche per la rimozione del-l’arsenico (Fig. 8)
physical characteristics of the water taken from the wells cur-rently being used by the AEM show a concentration of arsenic innature that is higher than 10 µg/l at all spots investigated, whichmakes a treatment plant necessary also for the removal of arsenic(Fig. 8).
Costanza CAMBI, Walter DRAGONI, Federico PASSERI, Daniela VALIGI80
CONTRIBUTO ALLE CONOSCENZE IDROGEOLOGICHE DEL SOTTOSUOLO DI CREMONA ED ALLO SFRUTTAMENTO DI NUOVE RISORSE IDROPOTABILI
Fig. 8 - Concentrazioni di NH4, As, Fe e Mn nei piezometri. (----- VMA)
- NH4, As, Fe and Mn concentration in the piezometers. (-----VMA)

Piezometri
Nel corso delle prove di pompaggio preliminari eseguite sui pie-zometri 1, 2, 3 e 4 (CADROBBI et alii, 2001) sono stati effettuati pre-lievi per la caratterizzazione idrochimica dell’acqua, con cadenza didue ore, allo scopo di verificare le concentrazioni delle varie sostan-ze. Per quanto riguarda l’ammoniaca, la sua concentrazione risultasuperiore alla VMA; la concentrazione dello ione ammonio è minorenella falda più superficiale e nel livello acquifero compreso tra i207.0 e i 213.0 m dal p.c., che interessa il piezometro 3. Nello stessopiezometro non si registrano concentrazioni di ferro e manganesesuperiori alla VMA, come accade, invece, negli altri piezometri. Laconcentrazione di arsenico è costantemente superiore al valore diVMA previsto dal D.L. n° 31/2001. Anche nel caso dell’arsenico ilpiezometro 3 è quello che presenta concentrazioni più basse.Pozzi “A” e “B”
Durante la prova di lunga durata sul pozzo A sono stati eseguiti tre prelievidi acqua, con cadenza giornaliera, per effettuare le analisi idrochimiche.
Analogamente a quanto riscontrato nei piezometri, le concentra-zioni di arsenico, manganese ed ammonio risultano costantemente aldi sopra della VMA secondo la nuova normativa. L’arsenico ha unaconcentrazione media di 22.6 µg/l, il manganese ha una concentrazio-ne media di 65.6 µg/l mentre la concentrazione di ammoniaca è pari,in media, a 1.5 mg/l. La concentrazione di Ferro (0.14 mg/l) è infe-riore alla VMA. La temperatura misurata è di 15.3 °C, il pH di pocoinferiore ad 8.00 unità ed il contenuto di solfati, nitrati, mercurio,nitriti, selenio, cadmio, cromo, piombo, solfuri e silice è trascurabile.
È stato eseguito un prelievo di acqua anche durante laprova di emungimento di lunga durata effettuata nel pozzo B,dopo quattro giorni dall’inizio del pompaggio.
La concentrazione di ammoniaca (1.44 mg/l) e quella di manga-nese (62.8 µg/l) sono circa uguali a quelle del pozzo A, mentre laconcentrazione di arsenico è inferiore (18 µg/l), sebbene ancora supe-riore alla VMA. Anche in questo caso la concentrazione del ferro(0.056 mg/l) è inferiore alla VMA ed è anche inferiore alla concen-trazione rilevata nel pozzo A. La temperatura misurata è di 16.2 °C,mentre il pH è di poco superiore alle 8.00 unità
Da questa analisi si ha la conferma che le acque emunte dai pozziA e B dovranno subire un processo di potabilizzazione.
STUDIO PRELIMINARE CON IL MODELLO MOD-
FLOW DELL’USGS
Visto che il progetto dell’ente gestore prevede la realizzazione didieci nuovi pozzi, per avere una prima indicazione sul comporta-mento dell’acquifero multistrato in condizioni di pompaggio simul-taneo da tutti i pozzi, è stato costruito, sulla base dei dati finoraacquisiti, un modello preliminare semplificato dell’acquifero, in cuisono stati trascurati gli effetti di interferenza con altri pozzi limitro-
Piezometers
During the preliminary pumping tests carried out on piezometers1, 2, 3 and 4 (CADROBBI et alii, 2001) samples for determining thehydrochemical characteristics of the water were taken every twohours, in order to monitor the concentrations of various substances.The concentration of ammonia was always higher than the MAV; theconcentration of the ammonium ion was lower in the stratum nearestthe surface and in the aquifer level between 207.0 and 213.0 m fromground level, which are both cut by piezometer 3. The concentrationsof iron and manganese recorded in this piezometer were not abovethe MAV, contrary to that found in the other piezometers. The con-centration of arsenic is persistently above the MAV established byD.L. 31/2001. For arsenic, piezometer 3 was again that whichshowed the lowest concentration.Wells “A” and “B”
During the long-term test on well A, three water samples weretaken, one per day, for hydrochemical analysis.
Like that found in the piezometers, the concentrations ofarsenic, manganese and ammonium were constantly above theMAV of the new regulation. Arsenic had an average concentra-tion of 22.6 µg/l, manganese had an average concentration of65.6 µg/l, and the average concentration of ammonia was 1.5mg/l. Iron (0.14 mg/l) was below the MAV. The temperaturemeasured was 15.3°C, the pH just below 8.00, and the content ofsulfates, nitrates, mercury, nitrites, selenium, cadmium, chrome,lead, sulfides and silica was negligible.
A water sample was also taken during the long-termpumping test done on well B, four days after the start ofpumping.
The concentrations of ammonia (1.44 mg/l) and of man-ganese (62.8 µg/l) were about equal to those of well A, while theconcentration of arsenic was lower (18 µg/l), although still abovethe MAV. Here also the concentration of iron (0.056 mg/l) waslower than the MAV, and was also lower than the concentrationfound in well A. The temperature measured was 16.2°C, and thepH just above 8.00.
This analysis confirmed that the water pumped from wells A andB must be treated to make it suitable for drinking.
PRELIMINARY STUDY WITH THE USGS MOD-
FLOW MODEL
Given that the AEM’s plan calls for the building of tennew wells, in order to get an initial idea of the behavior of themultilayered aquifer in conditions of simultaneous pumpingfrom all the wells, a simplified preliminary model was builton the basis of the data acquired up until now, ignoring theeffects of interference with other nearby wells. The model
Italian Journal of Engineering Geology and Environment, 1 (2005) 81
CONTRIBUTION TO THE HYDROGEOLOGICAL KNOWLEDGE OF THE CREMONAAQUIFER SYSTEM AND TO THE EXPLOITATION OF NEW WATER RESOURCES

fi. Per la costruzione del modello è stato utilizzato il ben noto codi-ce darciano MODFLOW dell’USGS.
Sulla base dei dati stratigrafici disponibili, l’acquifero è stato rap-presentato mediante un griglia di 14 strati orizzontali fino ad una pro-fondità di 265 m (Fig. 9), per una estensione areale di 1.000x20000 m2,dimensione ritenuta superiore al possibile raggio di influenza dei pozzi.
Gli orizzonti compresi tra 0 e 105 m dal p.c., non influenzati dalpompaggio negli acquiferi più profondi, sono stati rappresentati median-te un unico strato; inoltre gli orizzonti a bassa permeabilità posti tra i 145e i 158 m dal p.c. - separati da un sottile orizzonte permeabile - sono staticonsiderati come un unico livello a bassa permeabilità. A ciascuno deglistrati permeabili sono stati inizialmente assegnati i parametri idrogeolo-gici medi ricavati dall’analisi delle prove di emungimento. Sulla grigliasono stati ubicati tutti i pozzi e i piezometri già realizzati ed i pozzi darealizzare secondo il progetto (cfr. Fig. 1). Questi ultimi sono stati inse-riti, inizialmente, con lo stesso schema costruttivo del pozzo B, che èquello in cui le depressioni registrate risultano inferiori. Per questo moti-vo in fase di calibrazione sono stati utilizzati, come dati di riferimento,quelli relativi alla prova di lunga durata eseguita sul pozzo B, con porta-ta di 0.057 m3/s. Nelle immediate vicinanze del pozzo B e dei due pie-zometri la griglia è stata infittita, ovvero è stato aumentato il numero dirighe e colonne, per poter riprodurre al meglio la distribuzione dei poten-ziali osservati e le sue variazioni.
La griglia è stata delimitata mediante due contorni a potenzialeimposto situati sui lati nord e sud, in modo da simulare il flusso natu-rale della falda diretto a sud, verso il fiume Po: il valore del poten-ziale assegnato a questi due contorni è stato scelto in modo da otte-nere un gradiente idraulico pari 0.001, conforme a quello rilevato daprecedenti studi - a larga scala - sull’acquifero profondo cremonese(BERETTA et alii, 1993) e tale da consentire di riprodurre in manieraappropriata il livello statico indisturbato dei punti di misura disponi-
was built using the well-known Darcian MODFLOW of theUSGS.
On the basis of the available stratigraphic data, the aquifer wasrepresented by a grid of 14 horizontal layers down to a depth of 265m (Fig. 9), over an area of 10,000x20,000 m2, considered greaterthan the possible range of influence of the wells.
The horizons between 0 m and 105 m from ground level, notinfluenced by pumping in the deeper aquifers, were represented bya single layer; furthermore, the low permeability horizons locatedbetween 145 m and 158 m from ground level – separated by a thinpermeable horizon – were considered as a single low permeabilitylevel. Each of the permeable layers was initially assigned the meanhydrogeological parameters obtained from the analysis of thepumping tests. All the wells and piezometers already drilled andthe wells yet to be drilled were placed on the grid (cf. Fig. 1). Thewells to be drilled were initially inserted with the same construc-tion plan as well B, which is the well which showed lesser draw-downs. For this reason during the calibration stage the data fromthe long-term test on well B, with a discharge of 0.057 m3/s, wereused as reference data. The number of rows and columns in thegrid was increased near well B and the two piezometers, in orderto better reproduce the distribution of potentials observed and itsvariations.
The grid was delimited by two imposed potential boundaries sit-uated on the northern and southern sides, so as to simulate the natu-ral southward flow of groundwater toward the Po River: the value ofthe potential assigned to these two boundaries was chosen so as toobtain a hydraulic gradient of 0.001, in conformity with that found inthe preceding large-scale studies on the deep Cremona aquifer(BERETTA et alii, 1993) and such as to make it possible to reproduceappropriately the undisturbed static level of the available points of
Costanza CAMBI, Walter DRAGONI, Federico PASSERI, Daniela VALIGI
CONTRIBUTO ALLE CONOSCENZE IDROGEOLOGICHE DEL SOTTOSUOLO DI CREMONA ED ALLO SFRUTTAMENTO DI NUOVE RISORSE IDROPOTABILI
82
Fig. 9 - Sezione della griglia. Gli stratiscuri sono quelli a bassa permea-bilità (A)
- Cross-section of the grid. Thedark strata have low permeabi-lity (A)
bili. Gli altri due contorni sono stati imposti a flusso nullo. Sulla basedelle prove di pompaggio gli strati di separazione degli acquiferisono stati considerati impermeabili. Lungo la verticale i potenzialisono stati posti costanti, visto che dai dati a disposizione e dalla let-teratura non sono risultate indicazioni riguardo diverse distribuzioni.
CALIBRAZIONE DEL MODELLO
Poiché nel corso delle prove di pompaggio è stato pressoché rag-giunto l’equilibrio, la calibrazione del modello è stata eseguita inregime stazionario. In fase di calibrazione è stato necessario variareleggermente il valore della trasmissività relativa agli strati interessa-ti dal pozzo B e dai due piezometri, portandoli a 1.6 x 10⁻² m2/s nellivello acquifero superiore, ed a 1.42 x 10⁻² m2/s nel livello acquife-ro inferiore. Inoltre gli strati interessati dai filtri del pozzo, sono statisuddivisi in due per tentare di simulare la presenza di lenti a bassapermeabilità. Si è così passati da 12 a 14 strati.
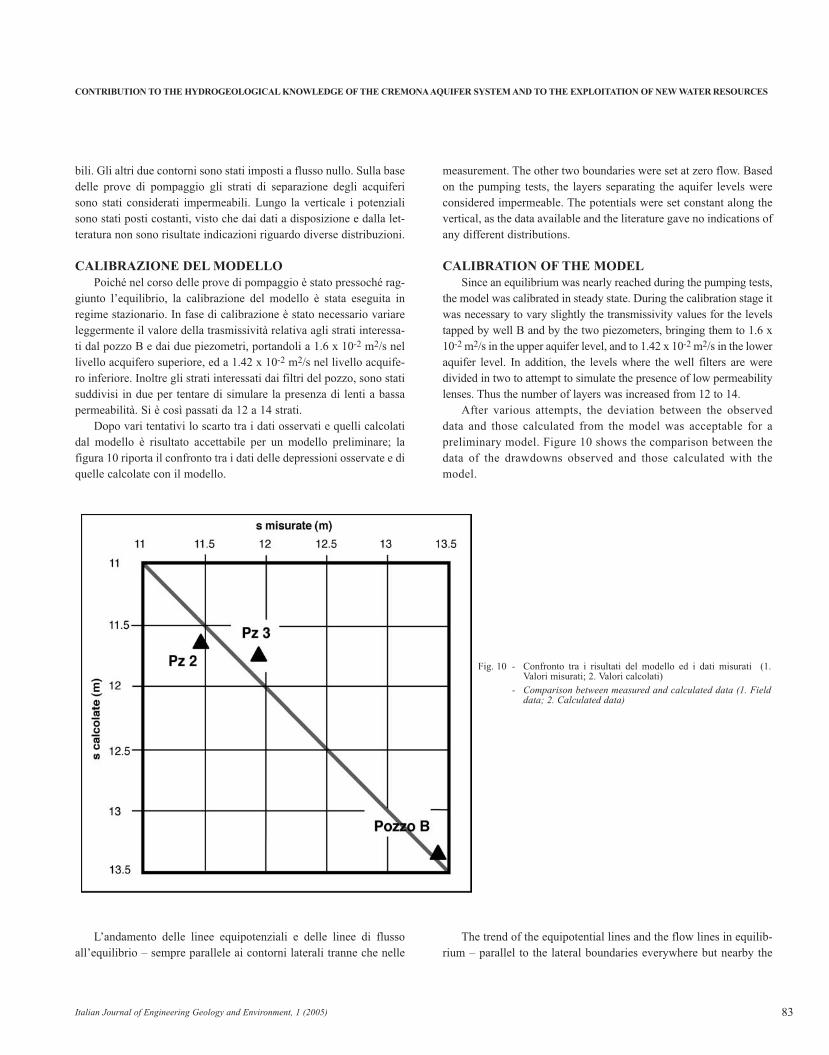
Dopo vari tentativi lo scarto tra i dati osservati e quelli calcolatidal modello è risultato accettabile per un modello preliminare; lafigura 10 riporta il confronto tra i dati delle depressioni osservate e diquelle calcolate con il modello.
L’andamento delle linee equipotenziali e delle linee di flussoall’equilibrio – sempre parallele ai contorni laterali tranne che nelle
measurement. The other two boundaries were set at zero flow. Basedon the pumping tests, the layers separating the aquifer levels wereconsidered impermeable. The potentials were set constant along thevertical, as the data available and the literature gave no indications ofany different distributions.
CALIBRATION OF THE MODEL
Since an equilibrium was nearly reached during the pumping tests,the model was calibrated in steady state. During the calibration stage itwas necessary to vary slightly the transmissivity values for the levelstapped by well B and by the two piezometers, bringing them to 1.6 x10⁻² m2/s in the upper aquifer level, and to 1.42 x 10⁻² m2/s in the loweraquifer level. In addition, the levels where the well filters are weredivided in two to attempt to simulate the presence of low permeabilitylenses. Thus the number of layers was increased from 12 to 14.
After various attempts, the deviation between the observeddata and those calculated from the model was acceptable for apreliminary model. Figure 10 shows the comparison between thedata of the drawdowns observed and those calculated with themodel.
The trend of the equipotential lines and the flow lines in equilib-rium – parallel to the lateral boundaries everywhere but nearby the
Italian Journal of Engineering Geology and Environment, 1 (2005) 83
CONTRIBUTION TO THE HYDROGEOLOGICAL KNOWLEDGE OF THE CREMONAAQUIFER SYSTEM AND TO THE EXPLOITATION OF NEW WATER RESOURCES
Fig. 10 - Confronto tra i risultati del modello ed i dati misurati (1.Valori misurati; 2. Valori calcolati)
- Comparison between measured and calculated data (1. Fielddata; 2. Calculated data)
Costanza CAMBI, Walter DRAGONI, Federico PASSERI, Daniela VALIGI
CONTRIBUTO ALLE CONOSCENZE IDROGEOLOGICHE DEL SOTTOSUOLO DI CREMONA ED ALLO SFRUTTAMENTO DI NUOVE RISORSE IDROPOTABILI
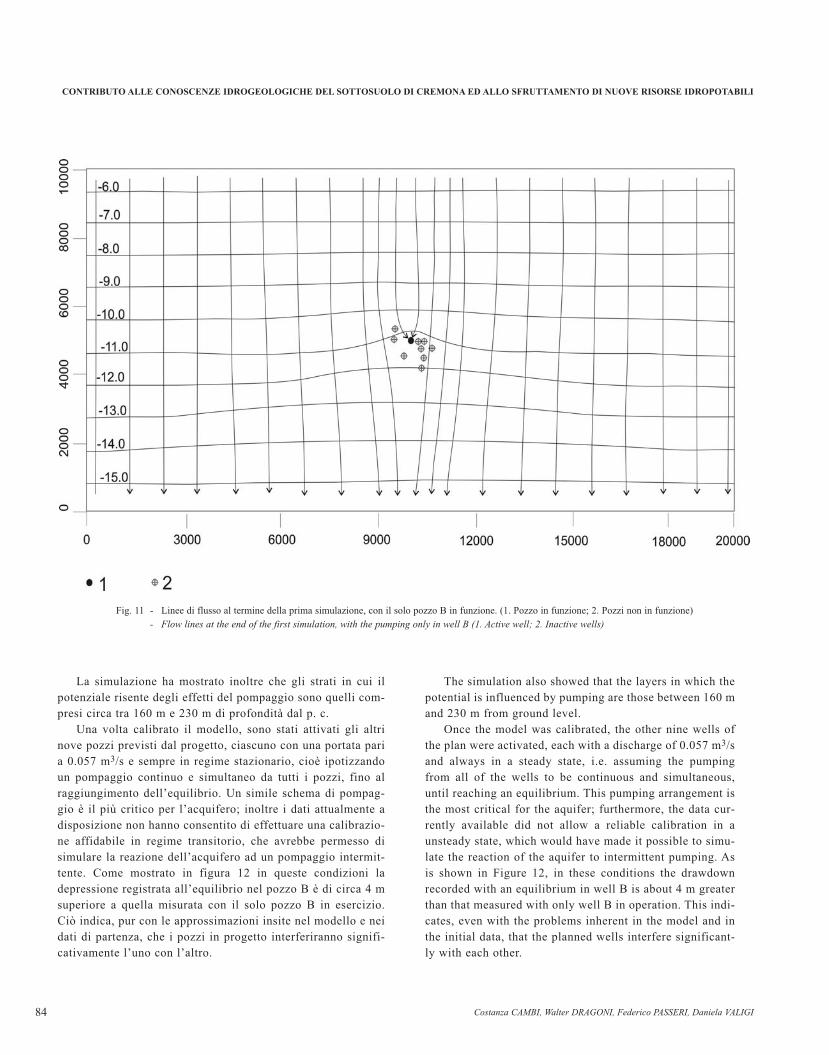
Fig. 11 - Linee di flusso al termine della prima simulazione, con il solo pozzo B in funzione. (1. Pozzo in funzione; 2. Pozzi non in funzione)
- Flow lines at the end of the first simulation, with the pumping only in well B (1. Active well; 2. Inactive wells)
La simulazione ha mostrato inoltre che gli strati in cui ilpotenziale risente degli effetti del pompaggio sono quelli com-presi circa tra 160 m e 230 m di profondità dal p. c.
Una volta calibrato il modello, sono stati attivati gli altrinove pozzi previsti dal progetto, ciascuno con una portata paria 0.057 m3/s e sempre in regime stazionario, cioè ipotizzandoun pompaggio continuo e simultaneo da tutti i pozzi, fino alraggiungimento dell’equilibrio. Un simile schema di pompag-gio è il più critico per l’acquifero; inoltre i dati attualmente adisposizione non hanno consentito di effettuare una calibrazio-ne affidabile in regime transitorio, che avrebbe permesso disimulare la reazione dell’acquifero ad un pompaggio intermit-tente. Come mostrato in figura 12 in queste condizioni ladepressione registrata all’equilibrio nel pozzo B è di circa 4 msuperiore a quella misurata con il solo pozzo B in esercizio.Ciò indica, pur con le approssimazioni insite nel modello e neidati di partenza, che i pozzi in progetto interferiranno signifi-cativamente l’uno con l’altro.
The simulation also showed that the layers in which thepotential is influenced by pumping are those between 160 mand 230 m from ground level.
Once the model was calibrated, the other nine wells ofthe plan were activated, each with a discharge of 0.057 m3/sand always in a steady state, i.e. assuming the pumpingfrom all of the wells to be continuous and simultaneous,until reaching an equilibrium. This pumping arrangement isthe most critical for the aquifer; furthermore, the data cur-rently available did not allow a reliable calibration in aunsteady state, which would have made it possible to simu-late the reaction of the aquifer to intermittent pumping. Asis shown in Figure 12, in these conditions the drawdownrecorded with an equilibrium in well B is about 4 m greaterthan that measured with only well B in operation. This indi-cates, even with the problems inherent in the model and inthe initial data, that the planned wells interfere significant-ly with each other.
84

vicinanze del pozzo (Fig. 11) – indica che i contorni laterali noninfluenzano la simulazione del pompaggio.
IL PROBLEMA DELLA RISALITA DELL’INTERFAC-
CIA ACQUA DOLCE - ACQUA SALMASTRA
È stato detto precedentemente che nel pozzo Postumia (Fig.1) èstata rilevata la presenza di cloruri e solfuri in concentrazioni eleva-te nella parte più profonda del pozzo. Ciò suggerisce l’opportunità dianalizzare i possibili effetti che il nuovo campo pozzi avrebbe in ter-mini di risalita dell’interfaccia acqua dolce/acqua salata.
E’ ben noto (cfr., per esempio BEAR, 1979) che nel caso di unacquifero costituito da uno strato di acqua dolce sovrastante uno stra-to di acqua salata l’emungimento dell’acqua dolce provoca una risa-lita (upconing) di acqua salata, come schematizzato in figura 13.
Per avere almeno un’idea del valore della risalita dell acquasalata sotto il pozzo (DELLEUR, 1999), si consideri lo schema difigura 13, e si assuma che i simboli ρd e ρs siano rispettivamente ladensità dell acqua dolce e dell acqua salata (g/cm3). Al di sotto delpozzo, in condizioni di equilibrio si avrà:
(1)da cui:
sdd zzHH ρρρ =−∆−− )(
well (Fig. 11) – indicates that the lateral boundaries do not influencethe pumping simulation.
THE PROBLEM OF THE RISING OF THE FRESH
WATER SALT - WATER INTERFACE
It was said earlier that chlorides and sulfides were found in highconcentrations in the deeper part of the Postumia well (Fig. 1). Thissuggests that that it would be advisable to analyze the possible effectsthat the new well field would have in terms of the rising of the freshwater/salt water interface.
It is well known (cf., for example, BEAR, 1979) that in anaquifer having a layer of fresh water above a layer of salt water,the pumping of fresh water causes an upconing of salt water, asis shown in Figure 13.
To get an idea of the extent of the upconing of salt water under-neath the well (DELLEURS, 1999), consider the diagram in Figure13, and assume that the symbols ρd and ρs are respectively the den-sity of fresh water and of salt water (g/cm3). Underneath the well,in equilibrium conditions, we will have:
(1)from which:
sdd zzHH ρρρ =−∆−− )(
Italian Journal of Engineering Geology and Environment, 1 (2005)
CONTRIBUTION TO THE HYDROGEOLOGICAL KNOWLEDGE OF THE CREMONAAQUIFER SYSTEM AND TO THE EXPLOITATION OF NEW WATER RESOURCES
85
Fig. 12 - Linee di flusso al termine della seconda simulazione, con tutti i pozzi in funzione
- Flow lines at the end of the second simulation, with the pumping in all wells in operation

(1a)
Il fatto che la (1a) coincida con la ben nota equazione di Ghyben-Hertzberg per le intrusioni saline su acquiferi costieri, mentre nelnostro caso si sia ben lontani dal mare, è irrilevante: la situazioneinfatti è descritta fisicamente nello stesso modo ed indica che, per ρs=1.025 g/cm3 e ρd = 1 g/cm3 densità tipiche dell’acqua marina e del-l’acqua dolce, si avrebbe z ~ 40D. Peraltro la (1a) indica che se fosseρs < 1.025 g/cm3 si avrebbe z > 40D. È evidente che l’innalzamentodell’interfaccia é comunque di qualche decina di volte superioreall’abbassamento piezometrico indotto dal pompaggio. La possibili-tà di richiamare nei pozzi acqua salmastra dipende dalla conduttivitàidraulica verticale del materiale che si trova al di sopra dell’interfac-cia e dalla effettiva profondità di questa, ma purtroppo in questo casotali informazioni sono piuttosto incerte. Secondo BASSI (2000) l’in-terfaccia ha profondità variabile da luogo a luogo ed è compresa fragli estremi di 250-400 m dal p.c.; secondo la Regione Lombardial’interfaccia nei pressi di Cremona si trova fra i 450 ed i 500 metridal p.c. (REGIONE LOMBARDIA – ENI DIVISIONE AGIP, 2002). Nellamigliore delle ipotesi, quindi, l’interfaccia si trova a circa 280 m al disotto del fondo del pozzo B.
Se si considerano i valori di densità sopra indicati, e il campopozzi dovesse emungere secondo lo schema adottato nel modello,all’equilibrio e alla massima depressione registrata (circa 6 m), siavrebbe un innalzamento dell’interfaccia di circa 240 metri; questoimplica che se l’interfaccia si trova ad una profondità inferiore ai 460metri si avrebbe, in tempi più o meno lunghi, l’arrivo di acqua salinanei pozzi.
Tale considerazione rimane valida anche se il problema vieneaffrontato con metodi più sofisticati dell’equazione di Ghyben-Herzberg. Il problema della risalita dell’acqua salina a partire da unainterfaccia orizzontale è meglio descritta, all’equilibrio, dall’equazio-
ds
dzρρ
ρ
−
∆=
(1a)
The fact that (1a) coincides with the well-known Ghyben-Hertzberg equation for salt-water intrusions in coastal aquifers, whilein our case we are far from the sea, is irrelevant: the situation is infact described physically in the same way and indicates that for ρs =1.025 g/cm3 and ρd = 1 g/cm3 typical densities of sea water and freshwater we would have z ~ 40D. Moreover (1a) indicates that if wehave ρs < 1.025 g/cm3, then z > 40D. It is evident that the rising ofthe interface is in any case a few dozen times greater than the piezo-metric drawdown induced by pumping. The possibility of abstractingsalt water into wells depends on the vertical hydraulic conductivity ofthe material found above the interface and the actual interface depth,but unfortunately in this case these information are rather uncertain.According to BASSI (2000), the depth of the interface varies fromplace to place, and lies between the extremes of 250-400 m fromground level; according to Regione Lombardia, the interface in theCremona area is between 450 and 500 m from ground level (REGIONE
LOMBARDIA – ENI DIVISIONE AGIP, 2002). At best, therefore, the inter-face is at about 280 m below the bottom of well B.
If one considers the above density values, and if the well fieldpumps according to the scheme adopted by the model, at equilib-rium and with the maximum drawdown recorded (about 6 m), theinterface would rise by about 240 meters. This implies that if theinterface is at a depth of less than 460 meters, sooner or later saltwater would reach the wells.
This consideration remains valid even if the problem is faced usingmore sophisticated methods than that of the Ghyben-Hertzberg equation.The problem of the upconing of salt water starting with a horizontalinterface is better described, at equilibrium, by the Dagan-Bear equation(DAGAN & BEAR, 1968), which takes into consideration the dischargepumped, the distance between the bottom of the well and the interface L
ds
dzρρ
ρ
−
∆=
Costanza CAMBI, Walter DRAGONI, Federico PASSERI, Daniela VALIGI
CONTRIBUTO ALLE CONOSCENZE IDROGEOLOGICHE DEL SOTTOSUOLO DI CREMONA ED ALLO SFRUTTAMENTO DI NUOVE RISORSE IDROPOTABILI
Fig. 13 - Risalita dell'interfaccia acqua dolce/acquasalata durante il pompaggio nel pozzo. 1.Piano Campagna; 2. Superficie indisturbatadella falda; 3. Livello dinamico della faldaall'equilibrio; 4. Livello del fondo pozzo; 5.Livello di risalita dell'interfaccia acquadolce/acqua salata all'equilibrio; 6. Livelloindisturbato dell'interfaccia acquadolce/acqua salata
- Upcone of salt/fresh water interface duringthe pumping. 1. Ground surface; 2. Staticpiezometric surface; 3. Dynamic piezome-tric surface in steady state conditions; 4.Well bottom level; 5. Upcone of salt/freshwater interface in steady state conditions; 6.Uninfluenced salt/fresh water interface
86
ne di Dagan-Bear (DAGAN & BEAR, 1968), che considera la portataemunta, la distanza fra il fondo del pozzo e l’interfaccia L (Fig. 13) ela permeabilità orizzontale. Dato che quest’ultima non è nota e che siha a che fare con un insieme di pozzi con notevole interferenza, nonsi è qui ritenuto opportuno cercare di affrontare il problema secondoquesto approccio. Va tenuto però presente che i lavori di Dagan e Bearindicano che una risalita Z ? 0.3L rende instabile l’interfaccia, cheoltre tale soglia risale fino a raggiungere il pozzo, indipendentementedalla depressione registrata al suo interno. Secondo il criterio diDagan e Bear, assumendo che la distanza L tra il fondo dei pozzi el’attuale interfaccia sia di circa 225 (differenza tra i 223 m di profon-dità nel pozzo B e i 450 m di profondità dell’interfaccia secondo la let-teratura esistente), una risalita accettabile sarebbe dell’ordine dei 75m, che corrisponde ad una depressione non superiore a 1.9 m.
Alla luce di queste osservazioni, appare opportuno integrare l’at-tuale progetto del Campo Pozzi Est con uno studio finalizzato adinvestigare il possibile problema della risalita di acqua salmastra. Nelcaso tale eventualità si dimostri concreta, una ovvia soluzione sareb-be quella di diminuire i prelievi in maniera opportuna. Un’alternativapotrebbe essere quella di prevedere la perforazione di pozzi che attin-gano contemporaneamente da tutti gli orizzonti acquiferi sfruttabili,cioè sia da quelli che alimentano il pozzo A che da quelli che ali-mentano il pozzo B. Tale schema, che avrebbe comunque lo svantag-gio di non rispettare l’attuale tendenza a non perforare pozzi che met-tono in comunicazione più acquiferi, permetterebbe, a parità di por-tata emunta, di avere un sistema acquifero complessivamente più tra-smissivo e, conseguentemente, depressioni più contenute. Per avereun’indicazione quantitativa sulla validità di questa ipotesi il modelloprecedentemente descritto è stato nuovamente utilizzato aggiungen-do ad ogni pozzo sezioni filtranti in corrispondenza degli strati cherappresentano i livelli acquiferi che alimentano il pozzo A, in modotale che ogni pozzo risultasse alimentato da quattro orizzonti anzichéda due. È stata poi eseguita una simulazione assumendo, ancora, chetutti pozzi emungessero simultaneamente e continuativamente, fino araggiungere l’equilibrio, con una portata di 0.057 m3/s. Stando airisultati del modello l’aggiunta di due nuovi orizzonti filtranti a cia-scuno dei pozzi utilizzati fa sì che la massima depressione registratanel sistema (che si verifica intorno al pozzo B, dove la densità deipozzi è massima) sia dell’ordine dei 3.5 m, anziché dell’ordine dei 6come si verificava quando tutti i pozzi erano costruiti sul modello delpozzo B (due soli orizzonti filtranti). Ciò implicherebbe una risalitadell’ordine dei 140 m, cioè ancora superiore al massimo ammissibi-le (attorno a 75 m).
Il problema della risalita di acqua salmastra, sebbene da valutarecon attenzione, dovrebbe comunque presentarsi in tempi tali da con-sentire di determinare la miglior soluzione; la risalita dell’interfacciainfatti, avviene in genere in tempi dell’ordine di decenni (MANDEL &SHIFTAN, 1981); ciò dovrebbe permettere di adattare progressivamen-te lo schema del campo pozzi e del pompaggio, in modo da ridurre lamassima depressione e quindi l’entità della risalita. Per la corretta
(Fig. 13), and horizontal permeability. Given that the horizontal perme-ability is unknown and that we are dealing with a set of wells with con-siderable interference, in this case it did not seem wise to attempt to facethe problem following this approach. It should be kept in mind howeverthat the works of Dagan and Bear indicate that an upconing Z ? 0.3Lmakes the interface unstable, which beyond that threshold rises until itreaches the well, regardless of the drawdown recorded inside the well.According to Dagan & Bear’s criterion, assuming that the distance Lbetween the well bottom and the current interface is 225 meters (the dif-ference between the 223-meter depth of well B and the 450-meter depthof the interface according to the existing literature), an acceptable upcon-ing would be around 75 m, which corresponds to a drawdown of notmore than 1.9 m.
In light of these observations, it seems best to integrate thecurrent Eastern Well Field plan with a study aimed at investigat-ing the possible problem of the upconing of salt water. Should thispossibility prove to be concrete, an obvious solution would be todecrease in an appropriate manner the amount of water pumped.One alternative could be to plan the drilling of wells that drawfrom all of the exploitable aquifers at the same time, i.e. both fromthose that feed well A and from those that feed well B. This plan,which would have the disadvantage of not following the currenttendency not to drill wells that put aquifers into communicationwith each other, would however make it possible, with the samedischarges pumped, to have an aquifer system that is more trans-missive overall and, consequently, more limited drawdowns. Toget a quantitative idea of the validity of this hypothesis, the modeldescribed previously was used again, adding filtering sections toeach well at the layers that represent the aquifer levels that feedwell A, such that each well is fed by four horizons instead of two.A simulation was then done assuming, once again, that all thewells pumped simultaneously and continuously until reaching anequilibrium, with a discharge of 0.057 m3/s. According to theresults of the model, the addition of two new filtering horizons toeach of the wells used would make the maximum drawdownrecorded in the system (which takes place around well B, wherethere is the highest concentration of wells) be about 3.5 m, insteadof about 6 m as occurred when all of the wells were built on themodel of well B (only two filtering horizons). This would meanan upconing of about 140 m, still higher than the maximum allow-able (around 75 m).
Although the problem of the upconing of salt water must becarefully evaluated, the time needed for it to occur should be longenough to allow for the determining of the best solution. The risingof the interface generally takes place over a number of decades(MANDEL & SHIFTAN, 1981); this should make it possible to adaptprogressively the well field and pumping plan, so as to reduce themaximum drawdown and, therefore, the extent of the rise. An accu-rate mathematical model would be of great help in correctly deter-mining the solution, starting from an experimental data base that is
Italian Journal of Engineering Geology and Environment, 1 (2005)
CONTRIBUTION TO THE HYDROGEOLOGICAL KNOWLEDGE OF THE CREMONAAQUIFER SYSTEM AND TO THE EXPLOITATION OF NEW WATER RESOURCES
87
determinazione della soluzione sarebbe comunque di grande aiuto unaaccurata modellazione matematica eseguita a partire da una base didati sperimentali molto più ampia di quella oggi disponibile, e chepotrebbe essere raccolta una volta che il campo pozzi fosse operativo.In particolare sarebbe opportuno che la nuova modellazione fosse svi-luppata con un codice che tratti il flusso di fluidi a diversa densità, condati precisi sulle permeabilità verticali, sulla profondità dell’interfac-cia, sulla distribuzione dei potenziali indisturbati e considerandosimulazioni per periodi molto lunghi, fino ad una-due decine di anni(cf., per esempio, LIN et alii, 1999; VASS & KOCH, 2001; ZHOU et alii,2004).
CONCLUSIONI
I dati piezometrici osservati nei pozzi A e B, e nei piezometriadiacenti, durante le prove di emungimento, hanno permesso la carat-terizzazione del sistema acquifero multistrato di Cremona. I valori ditrasmissività stimati - simili per tutti gli orizzonti acquiferi sfruttati -sono dell’ordine di 10-2 m2/s; i valori del coefficiente d’immagazzi-namento sono indicativamente compresi tra 10-3 e 10-5; l’andamentodelle prove ha mostrato che gli orizzonti sfruttati possono essere assi-milati ad acquiferi confinati.
L’unico acquifero in pressione non interessato dai filtri dei duenuovi pozzi del Campo Pozzi Est è quello più profondo, 244 m circadal p.c., escluso dopo aver appurato, sulla base delle analisi chimi-che, una alta presenza di cloruri che fa pensare ad una stretta vici-nanza con l’interfaccia acqua dolce – acqua salmastra, presumibil-mente risalita in seguito al pompaggio dei pozzi già esistenti.
Entrambi i pozzi, secondo i criteri convenzionalmente adottatiper l’interpretazione della curva caratteristica, mostrano un’efficien-za di almeno il 75% anche per le portate più elevate (0.057 m3/s).Dalle analisi chimiche sono state riscontrate delle concentrazioni diammoniaca, ferro, manganese ed arsenico che hanno confermato lanecessità di un impianto di potabilizzazione.
L’applicazione del programma MODFLOW dell’USGS, pur sebasata su alcune assunzioni semplificative – potenziali idraulicicostanti lungo la verticale, acquiferi perfettamente confinati - hamostrato che i pozzi, se costruiti in modo da attingere a due soli deilivelli acquiferi utilizzabili, e ubicati secondo lo schema preliminaredel progetto del campo pozzi, generano coni di depressione che inter-feriscono gli uni con gli altri, provocando una depressione massimadi circa 6 m, nel caso in cui tutti i pozzi emungano continuativamen-te e simultaneamente, ciascuno con una portata costante di 0.057m3/s. Secondo l’equazione di Ghyben-Hertzberg e secondo il criteriodi DAGAN & BEAR (1968), una simile depressione potrebbe provoca-re fenomeni di upconing della sottostante falda salmastra, con conse-guente fenomeni di contaminazione: sarebbe quindi utile considerarel’opportunità di ultimare il campo pozzi perforando pozzi che attin-gano contemporaneamente ad un maggior numero di orizzonti acqui-feri, in modo tale da aumentare la trasmissività complessiva del siste-ma. Ovviamente, in via cautelativa, la captazione dovrebbe essere
much more extensive than that now available, and that could be cre-ated once the well field is in operation. In particular, it would beadvisable to develop the new model with a code that deals with theflow of fluids of different density, with precise data on vertical per-meability, on the interface depth, on the distribution of undisturbedpotentials, and considering simulations for very long time periods,up to 10-20 years (cf., for example, LIN et alii, 1999; VASS & KOCH,2001; ZHOU et alii, 2004).
CONCLUSIONS
The piezometric data observed in wells A and B and in thenearby piezometers during the pumping tests made it possible tocharacterize the Cremona multilayered aquifer system. The esti-mated transmissivity values – similar for all the aquifer horizonsexploited – are on the order of 10-2 m2/s; the storage coefficientvalues are approximately between 10-3 and 10-5; the test resultsshowed that the horizons exploited can be assimilated to confinedaquifers.
The only aquifer under pressure not tapped by the filters ofthe two new wells in the Eastern Well Field is the deepest one,approximately 244 m from ground level, which was excludedafter verifying from chemical analyses that a high concentrationof chlorides suggests a close proximity to the fresh water/saltwater interface, which had presumably risen following the pump-ing at the existing wells.
According to criteria conventionally adopted for the inter-pretation of the dicharge-drawdown curve, both wells show anefficiency of at least 75% even at the highest discharges (0.057m3/s). Chemical analyses revealed concentrations of ammonia,iron, manganese and arsenic, which confirmed the necessity ofa water treatment plant.
The application of the USGS’s MODFLOW program,although based on some simplified assumptions – hydraulicpotentials constant along the vertical, perfectly confined aquifers– has shown that if the wells are built so as to draw from only twoof the usable aquifer levels and are located according to the pre-liminary plan of the well field project, they generate cones ofdepression that interfere with each other, causing a maximumdrawdown of about 6 meters, in the case in which all the wells arepumping continuously and simultaneously, each with a constantdischarge of 0.057 m3/s. According to the Ghyben-Hertzbergequation and the criterion of DAGAN & BEAR (1968), such adrawdown could cause the upconing of the underlying salt water,resulting in contamination: thus it would be useful to consider theopportuneness of completing the well field by drilling wells thatdraw from a greater number of aquifer horizons at the same time,so as to increase the system’s overall transmissivity. Obviously,
Costanza CAMBI, Walter DRAGONI, Federico PASSERI, Daniela VALIGI
CONTRIBUTO ALLE CONOSCENZE IDROGEOLOGICHE DEL SOTTOSUOLO DI CREMONA ED ALLO SFRUTTAMENTO DI NUOVE RISORSE IDROPOTABILI
88
effettuata singolarmente (con più pozzi o con pozzi cluster) e nonsimultaneamente nello stesso pozzo. In ogni caso il fenomeno dellarisalita dell’interfaccia avviene in generale in tempi sufficientementelenti (decine di anni) da permettere di determinare la miglior solu-zione al problema (modifica dello schema di pompaggio e/o delcampo pozzi) una volta che i pozzi saranno in funzione e fornirannoulteriori dati sperimentali. In quest’ottica sarebbe opportuna una ulte-riore modellazione matematica tridimensionale (con codici checonsiderino gradienti di densità), basata su dati precisi riguardopermeabilità verticali, potenziali idraulici e profondità dell’inter-faccia.
Si ringrazia l’Azienda Energetica Municipale di Cremona e inparticolare l’Ing. Andrea Guereschi per aver messo a disposizione idati storici e per il supporto tecnico-logistico. Il lavoro è frutto dellacollaborazione paritetica di tutti gli autori.
as a precaution, the tapping must be done singly (with severalwells or with cluster wells) and not simultaneously in the samewell. In any event the phenomenon of the rising of the interfacegenerally takes place over a sufficiently long period (decades)as to allow time for determining the best solution to the prob-lem (modifying of the pumping schedule and/or well field) oncethe wells are in operation and can provide further experimentaldata. In this perspective further tridimensional mathematicalmodeling (with codes that take into consideration density gradi-ents) would be advisable, based on precise data regarding verti-cal permeability, hydraulic potentials and interface depth.
The Authors wish to thank the Azienda Energetica Municipale ofCremona and in particular the engineer Andrea Guereschi for pro-viding historical data and for technical-logistical assistance. Thiswork is the fruit of the joint collaboration of all the authors.
Italian Journal of Engineering Geology and Environment, 1 (2005)
CONTRIBUTION TO THE HYDROGEOLOGICAL KNOWLEDGE OF THE CREMONAAQUIFER SYSTEM AND TO THE EXPLOITATION OF NEW WATER RESOURCES
OPERE CITATE – REFERENCES
AEM (Azienda Energetica Municipale di Cremona) (2001) - Progetto campo pozzi: studi di impatto ambientale. Cremona.BALDI A.M. (2001) - Esecuzione di carotaggi geofisici all’interno di una perforazione ubicata in via Postumia, Cremona. Relazione tecnica, Cremona.
BASSI G. (2000) - Progetto di un campo pozzi ad est della città. Relazione geologica. Cremona.
BEAR J. (1979) - Hydraulic of Groundwater. Mc Graw-Hill, New York.
BERETTA G.P., FRANCANI V. & FUMAGALLI L. (1993) - Studio Idrogeologico della Provincia di Cremona. Pubbl. n°610 del GNDCI, Pitagora Editrice, Bologna.
CADROBBI L., NOBILE M., PATERNOSTER S. & VALLE C. (2001) - Interpretazione preliminare delle prove di falda su quattro piezometri. Relazione geologica.
Cremona.
CAMBI C. (2001) - Considerazioni sul significato del parametro efficienza nell’analisi delle prove di pompaggio. Acque Sotterranee, 71: 45-51.
CUSTODIO E. & LLAMAS M. R. (1983) - Hidrologia subterranea, tomo 1 e 2, Omega, Barcellona.
DAGAN G. & BEAR J. (1968) - Solving the problem of local interface upconing in a coastal aquifer by a method of small perturbations. J. Hydr. Research, 6: 15-44.
DELLEUR J.W. (1986) - Elementary groundwater flow and transport processes. In “The Handbook of Groundwater Engineering”, Delleur J.W. Ed., CRC Press, ISBN
0-8493-2698-2.
DE MARSILY G. (1986) - Quantitative Hydrogeology - Groundwater Hydrology for Engineers. Academic Press, INC, ISBN 0-12-208916-2.
DRAGONI W. (1999) - La curva caratteristica dei pozzi: considerazioni teorico-pratiche, stima dei coefficienti e procedura PTA. In “La curva caratteristica dei
pozzi”, Cerbini G., Dragoni W., Nucci M., 3-49, GEOGRAPH, Milano.
DRISCOLL F.G. (1989) - Groundwater and wells. Johnson Filtration System Inc., St. Paul, Minnesota, 2nd ed.
FETTER C.W. (2001) – Applied Hydrologeology. Prentice Hall. Upper Saddler River, New Jersey.
FRANCANI V. (1990) - Protection of Ground waters in the Po valley. Pubbl. n° 83 del GNDCI, 445-465, Torino.
FRANCANI V., BERETTA G.P., BAREGGI A., NOBILE A., CREMONINI BIANCHI M., CATTANEO F. (1994) - Aspetti idrogeologici del problema della presenza di azoto ammo-niacale nelle acque sotterranee della provincia di Cremona. Quaderni di Tecniche e Protezione Ambientale, 41, Pitagora Editrice, Bologna.
HAMILL L. & BELL F.G. (1986) - Groundwater Resources Development. Butterworths, London, 344 pp.
LIN L., TSAY T. & HSU N. (1999) - Saltwater upconing due to freshwater pumping. Proc. Nat. Sc. Counc. ROC(A), 23,2: 248-258.
MANDEL S. & SHIFTAN Z.L. (1981) – Groundwater Resources Investigation and Development. Academic Press, Inc., 269 pp.
REGIONE LOMBARDIA - ENI DIVISIONE AGIP (2002) - Geologia degli acquiferi padani della Regione Lombardia a cura di Carcano C. & Piccin A. S.E.L.C.A., Firenze.
VOSS A. & KOCH M. (2001) - Numerical simulations of topography-induced saltwater upconing in the state of Brandenburg, Germany. Physics and Chemistry of
the Earth, Part B: Hydrology, Oceans and Atmosphere. Elsevier Science, 353-359.
ZAVATTI A., ATRAMINI D., BONAZZI A., BORALDI V,. MALAGÒ R., MARTINELLI G., NALDI S., PATRIZI G., PEZZERA G., VANDINI W., VENTURINI L. & ZUPPI G.M. (1995)
- La presenza di Arsenico nelle acque sotterranee della Pianura Padana: evidenze ambientali e ipotesi geochimiche. Quaderni di Geologia Applicata, 2: 301-
325, Pitagora Editrice, Bologna.
ZHOU Q., BEAR J. & BENSABAT J. (2004) - Saltwater upconing and decay beneath a well pumping above an interface zone. Lawrence Berkeley National Laboratory,
Paper LBNL 55486, 34 pp.
89

90