Embed Size (px)
Citation preview
econstor www.econstor.eu
Der Open-Access-Publikationsserver der ZBW – Leibniz-Informationszentrum WirtschaftThe Open Access Publication Server of the ZBW – Leibniz Information Centre for Economics
Standard-Nutzungsbedingungen:
Die Dokumente auf EconStor dürfen zu eigenen wissenschaftlichenZwecken und zum Privatgebrauch gespeichert und kopiert werden.
Sie dürfen die Dokumente nicht für öffentliche oder kommerzielleZwecke vervielfältigen, öffentlich ausstellen, öffentlich zugänglichmachen, vertreiben oder anderweitig nutzen.
Sofern die Verfasser die Dokumente unter Open-Content-Lizenzen(insbesondere CC-Lizenzen) zur Verfügung gestellt haben sollten,gelten abweichend von diesen Nutzungsbedingungen die in der dortgenannten Lizenz gewährten Nutzungsrechte.
Terms of use:
Documents in EconStor may be saved and copied for yourpersonal and scholarly purposes.
You are not to copy documents for public or commercialpurposes, to exhibit the documents publicly, to make thempublicly available on the internet, or to distribute or otherwiseuse the documents in public.
If the documents have been made available under an OpenContent Licence (especially Creative Commons Licences), youmay exercise further usage rights as specified in the indicatedlicence.
zbw Leibniz-Informationszentrum WirtschaftLeibniz Information Centre for Economics
Neumann, Karl-Heinz; Vogelsang, Ingo
Conference Paper
How to price the unbundled local loop in thetransition from copper to fiber access networks?
24th European Regional Conference of the International Telecommunication Society,Florence, Italy, 20-23 October 2013
Provided in Cooperation with:International Telecommunications Society (ITS)
Suggested Citation: Neumann, Karl-Heinz; Vogelsang, Ingo (2013) : How to price the unbundledlocal loop in the transition from copper to fiber access networks?, 24th European RegionalConference of the International Telecommunication Society, Florence, Italy, 20-23 October 2013
This Version is available at:http://hdl.handle.net/10419/88516
Contents lists available at SciVerse ScienceDirect
Telecommunications Policy
Telecommunications Policy ] (]]]]) ]]]–]]]
0308-59http://d
n CorrE-m
Pleascopp
URL: www.elsevier.com/locate/telpol
How to price the unbundled local loop in the transitionfrom copper to fiber access networks?
Karl-Heinz Neumann a, Ingo Vogelsang b,n
a WIK-Consult GmbH, Rhöndorfer Straße 68, 53604 Bad Honnef, Germanyb Department of Economics, Boston University, 270 Bay State Road, Boston, MA 02215, USA
a r t i c l e i n f o
Keywords:Copper accessFiber to the home (FTTH)Modern equivalent assetLong-run incremental costs (LRIC)Performance delta
61/$ - see front matter & 2013 Elsevier Ltd.x.doi.org/10.1016/j.telpol.2013.05.011
esponding author. Tel.: +1 617 353 2996.ail address: [email protected] (I. Vogelsang).
e cite this article as: Neumann, K.-Her to fiber access networks? Teleco
a b s t r a c t
In many countries worldwide access networks are in the transition from copper to fiberaccess. During the transition phase copper and fiber networks are operated in parallel. Allregulators facing this situation of technological change have to decide how to priceunbundled access to the copper loop in this transition phase. Should they keep the usualforward looking long-run incremental cost standard charge, or should they move to somedifferent approach? The authors propose to price copper access based on the modernequivalent asset (MEA) of fiber access. Since fiber access is superior to copper access, thecost of fiber access (as a basis for pricing copper access) should, however, be corrected bythe performance delta between copper and fiber access.
Instead of using quality of service (QoS) differences, the authors determine theperformance delta based on the market valuation of services provided over the copperand fiber access represented by the end-user prices of services and corrected by costdifferences downstream of the access provision. Under this approach an access seekerbecomes indifferent (on the margin) between using the copper or the fiber access networkand wholesale pricing (or regulation) becomes competitively neutral towards technologychoice between copper and fiber access and does not distort the platform competitiontowards cable.
To test its practicability numerical simulations of the approach are performed bymeans of a quantitative competition model. The model analysis suggests that theapproach leads to unique and robust results. Its main conclusion is that the methodtends to be conservative relative to the theoretical case of pure vertical productdifferentiation, meaning that the measured performance delta underestimates thetheoretical performance delta.
& 2013 Elsevier Ltd. All rights reserved.
1. Introduction
In many countries worldwide access networks are in the transition from copper to fiber access. There is either a partialupgrade in the form of fiber to the node (FTTN) which entails a substitution of the feeder part of the network through fiberor a full substitution of the copper access network by means of a fiber to the home (FTTH) architecture. The transitionprocess occurs gradually and will take more than a decade to be completed. The tendency that fiber goes deeper into theaccess network seems to be irreversible. In any case, during the transition phase copper and fiber networks are operated inparallel.
All rights reserved.
., & Vogelsang, I. How to price the unbundled local loop in the transition frommmunications Policy (2013), http://dx.doi.org/10.1016/j.telpol.2013.05.011i
K.-H. Neumann, I. Vogelsang / Telecommunications Policy ] (]]]]) ]]]–]]]2
All regulators facing this situation of technological change have to answer the question how to price unbundled access tothe copper loop in this transition phase. Should they keep the usual forward looking long-run incremental cost standardbased on the current cost of replacing the copper access network for determining the copper access charge? Or should theymove to an approach where fiber access is regarded as the modern equivalent asset (MEA) to copper access and thewholesale price for copper access is determined on the basis of the forward-looking long-run average incremental costs(FL-LRIC or simply LRIC)1 of fiber access?
This decision has to be taken in order to facilitate the deployment of next generation access networks (NGA), toencourage market investment in open and competitive networks and at the same time to meet the welfare targets such thatthe outcome is in the long term interest of users.
This article presents a novel solution to the problem mentioned above. It is to price copper access based on the modernequivalent asset of fiber access. Since fiber access is superior to copper access, the cost of fiber access (as a basis for pricingcopper access) should, however, be corrected by the performance delta between copper and fiber access. Such aperformance delta often is quantified on the basis of capacity, bandwidth or quality of service (QoS) difference. The papershows that such approaches are inappropriate to solve the economic issues of pricing. Instead, the approach determines theperformance delta based on the market valuation of services provided over the copper and fiber access represented by theend-user prices of services and corrected by cost differences downstream of the access provision. An access seeker thenbecomes indifferent (on the margin) between using the copper or the fiber access network and wholesale pricing (orregulation) becomes neutral towards technology choice. This MEA approach is competitively neutral between copper andfiber access. Competitive neutrality is chosen as the performance criterion, because regulators commonly use it and becauseit best reflects the “equivalence” of the MEA.
To test its practicability the approach has been numerically simulated by means of a quantitative competition model. Themodel analysis generates unique and robust results. It also provides some further considerations about how to apply theapproach in practice. The paper presents major results of these model calculations and draws recommendations toregulators on the implementation of the pricing approach.
2. FL-LRIC as a commonly used cost standard2
2.1. Characterization of FL-LRIC
The provision that the wholesale bottleneck services are to be offered at a cost-oriented basis has been implementedunder the FL-LRIC standard within European Member States.3 FL-LRIC as a long-run measure aims at the costs of efficientproduction of units where those variable and fixed costs are included which are essential for a group of services.4
Consequently, outdated technologies and inefficiently incurred costs like redundant manpower are not reflected. “Forward-looking long-run” means that the time span of new investments is included in the cost consideration. It also means that allinputs are generally considered as variable. In the forward-looking approach only the actual (forecasted) operating costs areconsidered, hence the equipment is assessed at the replacement value and over-capacities are usually not taken intoaccount.5 The costs also include a reasonable profit depending on the risk of the investment and reflected in the cost ofcapital. In order to calculate the average incremental costs per loop, the sum of the costs considered are divided by the(actual or forecasted) loops. From an economic perspective, FL-LRIC results in wholesale access charges above short-runmarginal cost, since adequate fixed and common costs of production are also included.
It is well-known that, in a perfectly competitive market with U-shaped average cost curves and free entry, prices equalshort-run marginal costs and, in the long-run, equal long-run average costs and long-run marginal costs. These conditionsare not feasible in markets with extensive economies of scale and scope. Nevertheless, achieving the next best to theperfectly competitive standard would be desirable. Markets characterized by scale and scope economies would yield long-run competitive prices between long-run incremental costs and long-run stand-alone costs (SAC).6 FL-LRIC always fulfill thiscondition and in growing markets are therefore always compatible with this competitive standard. FL-LRIC will thereforeallow as many entrants in the market as are warranted by economies of scale downstream in retail markets.
FL-LRIC will generally cover all costs that are expected over the lifetime of the assets and include mark-ups for commoncosts. Wholesale charges at FL-LRIC levels will therefore provide correct expansion and replacement investment incentivesfor bottleneck assets of the incumbent. Higher than cost-covering charges would lead to less investment because of thereduction in downstream demand associated with higher downstream prices that especially competitors would have tocharge. Lower charges would lead to lower investments on the part of the bottleneck provider because of insufficient cost
1 The abbreviation FL-LRAIC would be correct, but FL-LRIC is the more familiar usage.2 This part of the paper relies on Briglauer and Vogelsang (2011) and Hoernig et al. (2011).3 See Cullen International (2007); the methodologies mandated by European regulators differ somewhat with respect to cost bases and cost standards.4 See IRG—Independent Regulators Group (2000).5 See Evans and Guthrie (2005) for the inclusion of optimally planned excess capacity under the heading of “optimized deprival value”. Mandy and
Sharkey (2003) calculate the effect of lumpiness on FL-LRIC.6 Stand-alone costs are the costs incurred by a firm producing only the single service in question (therefore not benefiting from economies of scope/
synergies if any).
Please cite this article as: Neumann, K.-H., & Vogelsang, I. How to price the unbundled local loop in the transition fromcopper to fiber access networks? Telecommunications Policy (2013), http://dx.doi.org/10.1016/j.telpol.2013.05.011i
K.-H. Neumann, I. Vogelsang / Telecommunications Policy ] (]]]]) ]]]–]]] 3
coverage.7 Under cost and/or demand uncertainty a buffer may be necessary to cover for estimation risks. It is usuallyassumed that investment risks of the incumbent are correctly covered in the weighted average cost of capital (WACC) usedfor the FL-LRIC calculation.8
To conclude, FL-LRIC has proved to be quite valuable in setting regulated prices, in particular prices for wholesale servicesin markets under expansion. Conceptually, it is the cost standard on which, at least on average, prices are based that wouldobtain under effective competition. Prices set this way provide entrants with the necessary information in respect of buy-or-make decisions regarding their own infrastructure investment and at the same time provide incumbents with correctsignals regarding their investment decisions. They assure (if properly applied) entrants the opportunity to take advantage ofthe business prospects offered by growing retail markets on essentially an equal footing with the incumbent. In the finalanalysis, they are one of the cornerstones assuring that consumers will get the best deal.
2.2. Regulatory practice
European National Regulatory Agencies (NRAs) show relatively clear preferences regarding price control methods, costbase and accounting methodologies for regulating the unbundled wholesale access charge. The degree of harmonization ofmethodologies for key wholesale markets seems high as BEREC (2011) points out in its latest Regulatory Accounting report.The analysis shows a clear preference for cost orientation, a trend towards using current cost accounting (CCA) and a fairlyeven distribution of LRIC and fully distributed costing (FDC) methods.
27 countries9 participated in the BEREC (2011) survey for the year 2011. 19 NRAs out of the 27 countries reported CCA tobe their cost base for unbundled access. 5 NRAs reported historic costs as their relevant cost base and 1 NRA reported to usea different cost base. CCA is by far the most commonly used cost base methodology applied. The most commonly usedaccounting methodology in 2011 and in the previous years is LRIC. 64% of the NRAs are applying LRIC for wholesale productsin market 4 and 36% are applying FDC.
European NRAs so far prefer CCA as a cost base combined with LRIC as the costing methodology and cost orientation asthe price control method for unbundled wholesale access.
While many European NRAs still apply the traditional FL-LRIC method to determine ULL prices, some of them haveresponded to the situation of decreasing demand for copper access and adapted their previous regulated pricing regime.Two prominent examples should be mentioned here.
The most radical change has been adopted by the Swedish regulator PTS in 2011 in a country with a significantdeployment of fiber. Since then PTS considers fiber and wireless technologies to be the MEA for copper access technology.This means, if an operator were faced with the decision to roll-out an access network in Sweden, it would choose a fiber-based instead of a copper-based network. Consequently, the LRIC model only uses fiber access technology to calculate thecosts for both, copper and fiber-based wholesale access services. PTS sets a single national price for fully unbundled copperaccess which is an average of the costs of deploying fiber in the four geotypes where fiber is actually deployed in Sweden. Incalculating copper access charges PTS does not take into consideration any performance (or value) differences betweencopper and fiber access.
The intensive ongoing fiber roll-out activities also motivated the French regulator ARCEP to adopt a new wholesalepricing regime for copper access. Within its current costing approach ARCEP first drastically reduced the remaining lifetimeof copper cables to 13 years and extended the economic lifetime of ducts (which are also used for deploying fiber) from 40 to50 years. The combined effect of both measures result in a downward pressure to copper access prices. Additionally, ARCEPchanged the allocation rules for shared use of ducts. The costs for ducts are now allocated between fiber and copper accessaccording to the number of customers using either technology and not to the physical space actually used by eachtechnology. The new allocation rules are not cost-based (which would require an allocation according to physical spaceactually used) but represent a type of value of service pricing. This would initially include a cross-subsidization of fiber bycopper access, because there are very few active fiber lines and many active copper lines to start with. Over time the costallocation rule applied brings the allocation of costs closer to the actual capacity used and closer to the actual costs causedby fiber.
3. Pitfalls of applying FL-LRIC to copper-based access10
Applying FL-LRIC to copper-based access at this time of declining volumes due to substitution of copper by fiber andupgraded cable is made inappropriate by at least three developments. The first is that the use of FL-LRIC is conceptuallybased on an expanding market, where additional capacity is being installed. The market for copper-based access, however,
7 This argument is explained more extensively in Vogelsang (2012).8 This article only considers the appropriate level of a regulated wholesale access charge that is levied on a wholesale access service on a pay-as-you-go
basis. Alternative access arrangements, such as investment sharing may or may not provide better investment incentives. See, for example, Nitsche andWiethaus (2010).
9 The countries contributing included the 27 EU Member States plus Iceland, Norway, Switzerland and Croatia. The following numbers only refer tocountries which participated in the survey in each year.
10 The presentation in this section draws on Briglauer and Vogelsang (2011).
Please cite this article as: Neumann, K.-H., & Vogelsang, I. How to price the unbundled local loop in the transition fromcopper to fiber access networks? Telecommunications Policy (2013), http://dx.doi.org/10.1016/j.telpol.2013.05.011i
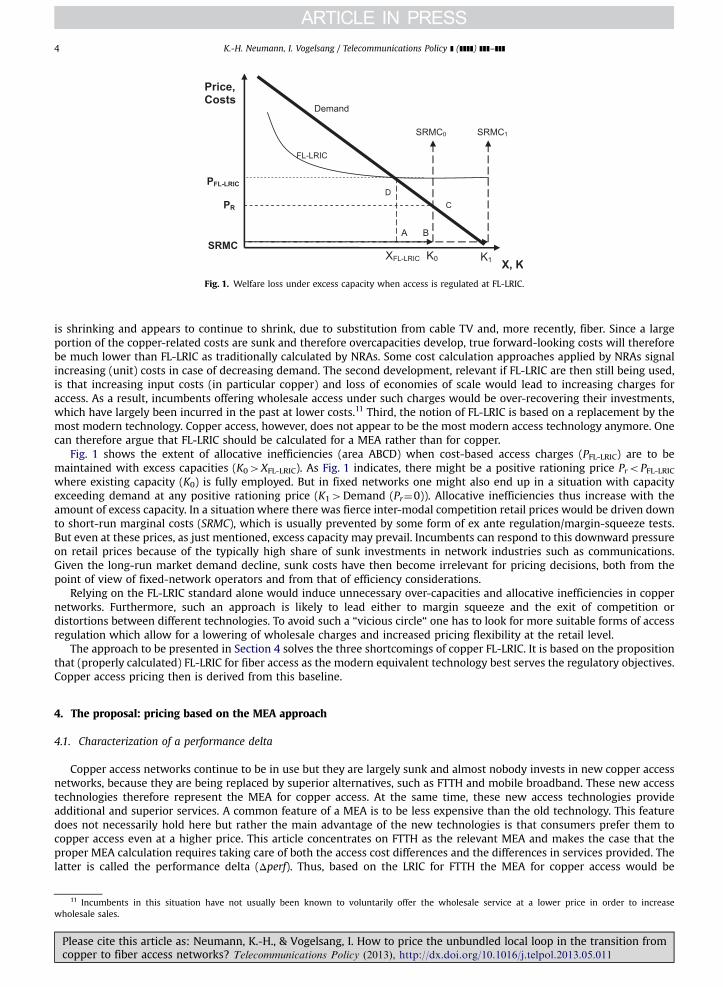
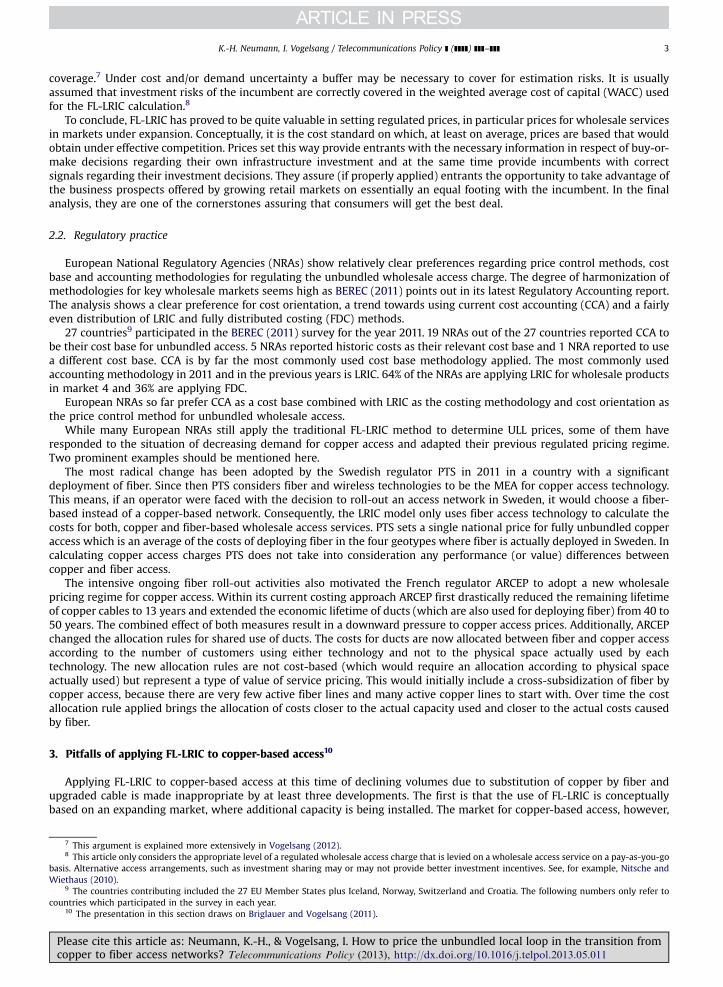
Fig. 1. Welfare loss under excess capacity when access is regulated at FL-LRIC.
K.-H. Neumann, I. Vogelsang / Telecommunications Policy ] (]]]]) ]]]–]]]4
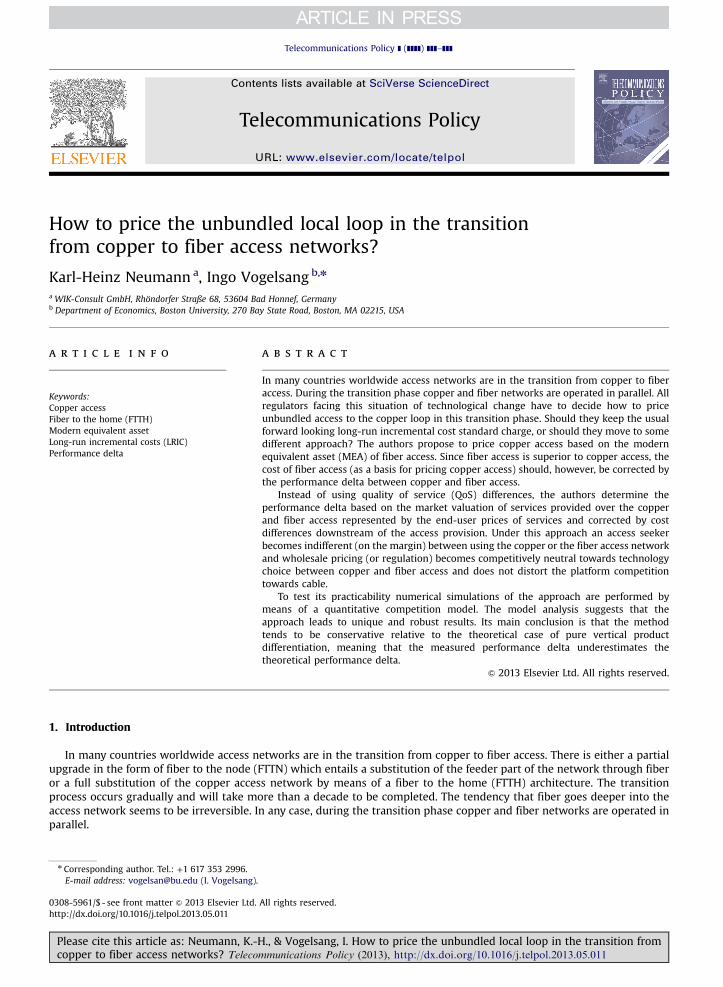
is shrinking and appears to continue to shrink, due to substitution from cable TV and, more recently, fiber. Since a largeportion of the copper-related costs are sunk and therefore overcapacities develop, true forward-looking costs will thereforebe much lower than FL-LRIC as traditionally calculated by NRAs. Some cost calculation approaches applied by NRAs signalincreasing (unit) costs in case of decreasing demand. The second development, relevant if FL-LRIC are then still being used,is that increasing input costs (in particular copper) and loss of economies of scale would lead to increasing charges foraccess. As a result, incumbents offering wholesale access under such charges would be over-recovering their investments,which have largely been incurred in the past at lower costs.11 Third, the notion of FL-LRIC is based on a replacement by themost modern technology. Copper access, however, does not appear to be the most modern access technology anymore. Onecan therefore argue that FL-LRIC should be calculated for a MEA rather than for copper.
Fig. 1 shows the extent of allocative inefficiencies (area ABCD) when cost-based access charges (PFL-LRIC) are to bemaintained with excess capacities (K04XFL-LRIC). As Fig. 1 indicates, there might be a positive rationing price ProPFL-LRICwhere existing capacity (K0) is fully employed. But in fixed networks one might also end up in a situation with capacityexceeding demand at any positive rationing price (K14Demand (Pr¼0)). Allocative inefficiencies thus increase with theamount of excess capacity. In a situation where there was fierce inter-modal competition retail prices would be driven downto short-run marginal costs (SRMC), which is usually prevented by some form of ex ante regulation/margin-squeeze tests.But even at these prices, as just mentioned, excess capacity may prevail. Incumbents can respond to this downward pressureon retail prices because of the typically high share of sunk investments in network industries such as communications.Given the long-run market demand decline, sunk costs have then become irrelevant for pricing decisions, both from thepoint of view of fixed-network operators and from that of efficiency considerations.
Relying on the FL-LRIC standard alone would induce unnecessary over-capacities and allocative inefficiencies in coppernetworks. Furthermore, such an approach is likely to lead either to margin squeeze and the exit of competition ordistortions between different technologies. To avoid such a “vicious circle“ one has to look for more suitable forms of accessregulation which allow for a lowering of wholesale charges and increased pricing flexibility at the retail level.
The approach to be presented in Section 4 solves the three shortcomings of copper FL-LRIC. It is based on the propositionthat (properly calculated) FL-LRIC for fiber access as the modern equivalent technology best serves the regulatory objectives.Copper access pricing then is derived from this baseline.
4. The proposal: pricing based on the MEA approach
4.1. Characterization of a performance delta
Copper access networks continue to be in use but they are largely sunk and almost nobody invests in new copper accessnetworks, because they are being replaced by superior alternatives, such as FTTH and mobile broadband. These new accesstechnologies therefore represent the MEA for copper access. At the same time, these new access technologies provideadditional and superior services. A common feature of a MEA is to be less expensive than the old technology. This featuredoes not necessarily hold here but rather the main advantage of the new technologies is that consumers prefer them tocopper access even at a higher price. This article concentrates on FTTH as the relevant MEA and makes the case that theproper MEA calculation requires taking care of both the access cost differences and the differences in services provided. Thelatter is called the performance delta (Δperf). Thus, based on the LRIC for FTTH the MEA for copper access would be
11 Incumbents in this situation have not usually been known to voluntarily offer the wholesale service at a lower price in order to increasewholesale sales.
Please cite this article as: Neumann, K.-H., & Vogelsang, I. How to price the unbundled local loop in the transition fromcopper to fiber access networks? Telecommunications Policy (2013), http://dx.doi.org/10.1016/j.telpol.2013.05.011i
K.-H. Neumann, I. Vogelsang / Telecommunications Policy ] (]]]]) ]]]–]]] 5
LRICMEA¼LRICFTTH−Δperf. Contrary to the measurement of LRICFTTH, for which bottom-up cost models exist, there is as ofnow no established methodology for measuring Δperf.
The most straightforward approach to measuring Δperf would be based on well-known quality indicators of both typesof access networks, among which bandwidth sticks out.12 The problem with such a measurement based on qualityindicators is that it is very imperfectly related to the monetary values which users attribute to the different access servicesand which are relevant for the Δperf in the MEA calculation. In particular, FTTH bandwidths tend to be (sometimes large)multiples of copper bandwidths, while at least today the value differences are much smaller. Also, bandwidth is not the onlyrelevant component of quality differences between the two technologies so that various quality indicators would need to beaggregated into a single Δperf measurement. Presumably, the only sensible way this can be done is based on consumervaluations in markets.
Market prices (to the extent available) are the most acceptable scale for economists to measure value differences. To theextent market prices are not available value differences may be extracted from observations of related goods and services.Applied to the case of wholesale copper and fiber access networks two methods are considered. The first method applies“hedonic pricing” techniques (pioneered by Rosen (1974)) to the services provided with copper and FTTH access, while thesecond method is based on actual prices in the retail markets served by copper and fiber access lines.
The “hedonic pricing” method consists of five steps. In the first step the prices of services supplied via copper access linesare derived (econometrically) from end-user prices of copper access bundles observed in markets. These services could, forexample, be voice, TV and internet or single-play, double-play and triple-play bundles. In the second step the weights ofthese services in copper access would be estimated and thereby the value of copper access established. In the third step amarket analysis would be used for determining the weights of these services under FTTH access. In the fourth step theaggregated value of these services in FTTH access would be calculated as the value of FTTH access. In the last step thedifference between the results of steps 4 and 2 would be used to determine the Δperf. While this method does not requirean observation of market prices for FTTH access, it requires substantial data on copper pricing and it requires quantitativeanalysis of weights for services provided by FTTH.
A more direct method is proposed here that, however, requires the observation of retail market prices for both copperand FTTH access. It is based on the philosophy that the method for determining Δperf must answer the question: Whichwholesale access charge aC for copper access makes the wholesale user (an alternative service provider or the – verticallyseparated – downstream division of the incumbent)13 indifferent between buying copper access at aC and buying FTTHaccess at aF¼LRICFTTH? The resulting Δperf then solves aC¼LRICFTTH−Δperf.
Thus, the aC determined that way is competitively neutral between copper and FTTH access technologies provided thatFTTH access is offered competitively (at LRIC prices). This is justified by the fact that the copper access network is largelysunk so that its forward-looking costs are indeterminate between the short-run incremental costs (SRIC) of running thenetwork (including the capital costs of the resale value of the remaining assets) and the LRIC of building a new network.Choosing the Δperf the way described above strikes the right balance for the regulated copper access network betweenstaying idle because of a too high access charge and foregoing access revenue because of a too low access charge (assumingthat no market power can be exercised).
The philosophy behind the measurement of Δperf is that it should establish the value difference between copper andFTTH access for the specific purpose, for which the MEA analogy is used, and that purpose is regulated wholesale access.This means that the Δperf is not directly given by the price differences between the respective retail access products. Rather,these retail prices are only an important ingredient, because the demand for wholesale access is derived from the demandfor retail access. However, assuming competitive retail markets the relevant Δperf based on the competitors’ deriveddemand for the wholesale access product has to include in addition to the difference in the retail prices the difference incosts incurred downstream from the wholesale product (if there is any). As a result, the indifference postulated abovetranslates to Eq. (1):
pF−CFdownstream−FL−LRICFTTH ¼ pC−CCdownstream−aC ¼ pC−CCdownstream−FL−LRICFTTH þ Δperf|fflfflfflfflfflfflfflfflfflfflfflfflfflfflfflfflfflffl{zfflfflfflfflfflfflfflfflfflfflfflfflfflfflfflfflfflffl}−ac
ð1Þ
Here CFdownstream and CCdownstream are the average downstream variable costs of providing FTTH and copper at retail.The equation implies
Δperf ¼ ðpF−pCÞ−ðCFdownstream−CCdownstreamÞ; ð2Þ
which is the difference between the downstream markups of copper and FTTH. This specifically neglects any fixed costsdownstream, which are irrelevant for price setting but could be relevant for entry and exit decisions of alternative serviceproviders.
12 The following arguments only concern demand side differences between copper and fiber access, while the issue of downstream cost differences istaken up at the end of this section.
13 As shown in Section 4.3.3 the measurement results for Δperf may differ between entrants’ and incumbent’s prices.
Please cite this article as: Neumann, K.-H., & Vogelsang, I. How to price the unbundled local loop in the transition fromcopper to fiber access networks? Telecommunications Policy (2013), http://dx.doi.org/10.1016/j.telpol.2013.05.011i
WtP for copper
WtP for copper minus transport cost
∆perf≅ vertical product differentiation
Location copper
WtP for FTTH
Location FTTH
WtP for FTTH minus transport cost
A
Fig. 2. Illustration of Δperf in a simple Hotelling model.
K.-H. Neumann, I. Vogelsang / Telecommunications Policy ] (]]]]) ]]]–]]]6
4.2. Properties of the performance delta in idealized settings
What properties does the chosen Δperf have in idealized regulatory and market settings? Ideal would be a perfect MEA,defined by the property that the two services are perfect substitutes at prices that reflect Δperf.14 This view of the MEA isrelated to but not the same as vertical product differentiation, which is defined by the property that all consumers value oneservice (FTTH) higher than the other (copper) so that there is a well-defined quality advantage.
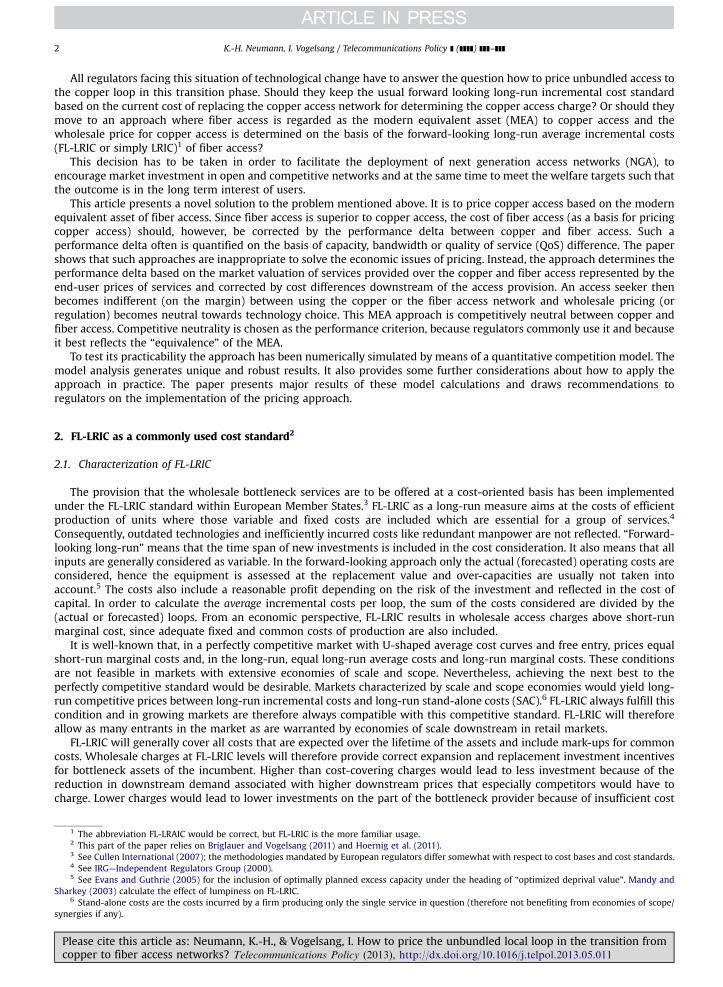
The challenge for building a competition model that captures the interaction of firms offering different types of servicesand differentiating brands within service groups is to characterize user preferences for services and firms and to derivedemand. The main approach to this has been the Hotelling model, which customarily assumes that the consumers and twocompeting firms are located along a line with fixed length. Neglecting the downstream cost differences used in the abovedefinition of Δperf, Fig. 2 illustrates some relationships between the MEA approach and product differentiation in thecontext of a simple Hotelling model. The bold horizontal line is the Hotelling line representing the location of the twoqualities “FTTH” and “copper” on both ends. The vertical lines measure willingness to pay (WtP) of consumers for the twoservices at their respective locations. Users are distributed along the horizontal line and their WtP for each of the services isgiven by the WtP at the location of the service minus the “transport costs” from the service location to the users. Withpositive transport costs the WtP for each service is given by the continuous downward-sloped line originating at thatservice. In contrast, the two horizontal dashed lines represent the case of zero transport costs. In this case the difference inWtP characterizes a perfect MEA and pure vertical product differentiation in the sense that all users prefer FTTH by the sameamount. However, this is a very restrictive case, because, due to the zero transport costs, all consumers are the same.15
For illustrative purposes only the prices for both services are here assumed to be the same. Otherwise, the WtP wouldhave to be interpreted net of the prices asked by the service providers (as is done in the mathematical Appendix A to thispaper). Because the slopes of the WtP lines induce horizontal product differentiation they are here called the “horizontalproduct differentiation parameters” and the vertical intercepts are called the “vertical product differentiation parameters”,also referred to below as the “theoretical Δperf”.
In case of a perfect MEA there exists a certain price difference Δperf with the property that at a smaller price differenceonly the higher-valued service (FTTH) is demanded and at any larger price difference only the lower-valued service (copper)is demanded. An equilibrium, in which both services are traded, therefore implies that the price difference between FTTHand copper, pF−pC, exactly equals Δperf. It is clear that downstream cost differences are easily included here for measuringthe respective derived demands for the wholesale products.
However, copper and FTTH access are characterized by both vertical and horizontal product differentiation. In contrast tothe case of a perfect MEA price differences do not have to equal Δperf now in order for both services to be traded side byside. There are customers buying the higher-valued service even if the price difference is greater than the theoretical Δperf(that would result from only vertical differentiation) and there are customers who buy the lower-valued service even if theprice difference is smaller than the theoretical Δperf. In this case there exists no thoroughly clean measurement of Δperf.
As can be seen from Fig. 2 above, a restriction of output for FTTH to points left of A leads to WtP differences (andtherefore observed price differences), which are larger than the theoretical Δperf. Thus, the market price for FTTH is raisedby a market power effect so that pF−pC4Δperf. If one now uses the measured price difference as the value of Δperf one endsup at an access charge aC that is smaller than it should have been.16
14 An imperfect MEA could be characterized by the property that FTTH access (at an access charge equal LRICFTTH) is in the same relevant market ascopper access after applying Δperf to the copper access charge.
15 This observation is due to an anonymous referee.16 This implication may, however, have positive welfare effects. It generates an indirect pricing constraint on the fiber access service which is in
particular relevant if fiber access is unregulated.
Please cite this article as: Neumann, K.-H., & Vogelsang, I. How to price the unbundled local loop in the transition fromcopper to fiber access networks? Telecommunications Policy (2013), http://dx.doi.org/10.1016/j.telpol.2013.05.011i
1
42
3
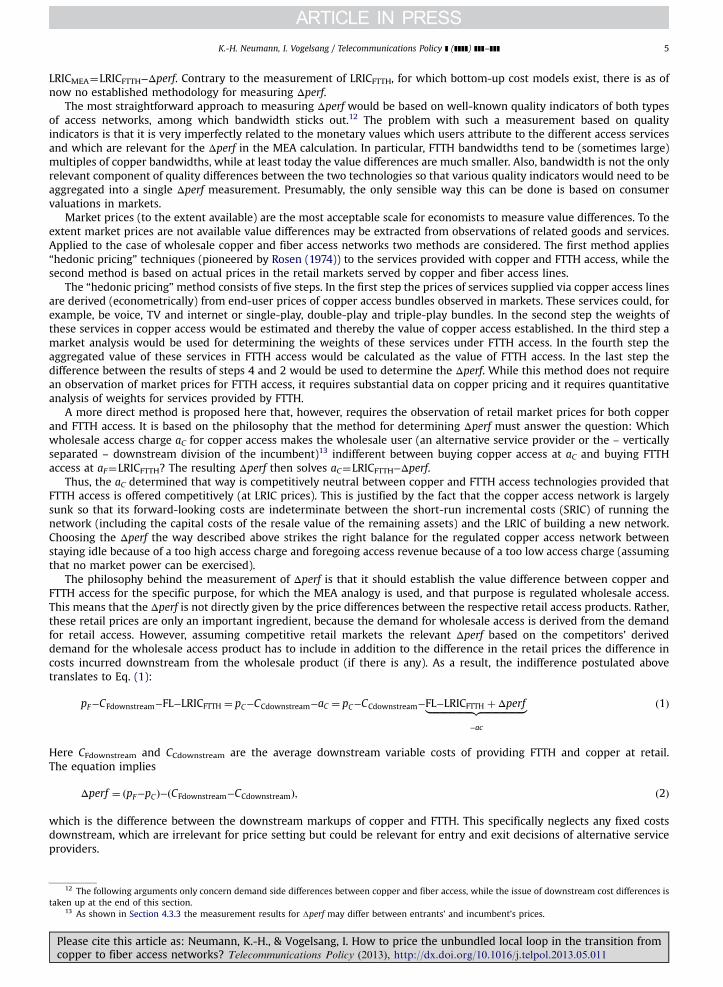
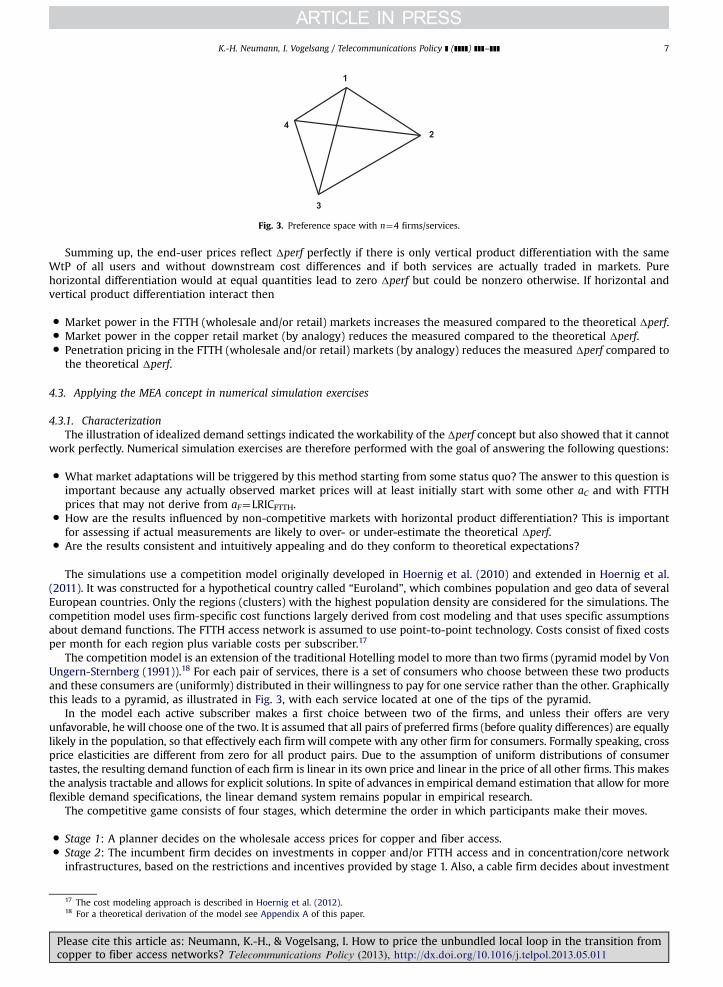
Fig. 3. Preference space with n¼4 firms/services.
K.-H. Neumann, I. Vogelsang / Telecommunications Policy ] (]]]]) ]]]–]]] 7
Summing up, the end-user prices reflect Δperf perfectly if there is only vertical product differentiation with the sameWtP of all users and without downstream cost differences and if both services are actually traded in markets. Purehorizontal differentiation would at equal quantities lead to zero Δperf but could be nonzero otherwise. If horizontal andvertical product differentiation interact then
�
Pc
Market power in the FTTH (wholesale and/or retail) markets increases the measured compared to the theoretical Δperf.
� Market power in the copper retail market (by analogy) reduces the measured compared to the theoretical Δperf. � Penetration pricing in the FTTH (wholesale and/or retail) markets (by analogy) reduces the measured Δperf compared tothe theoretical Δperf.
4.3. Applying the MEA concept in numerical simulation exercises
4.3.1. CharacterizationThe illustration of idealized demand settings indicated the workability of the Δperf concept but also showed that it cannot
work perfectly. Numerical simulation exercises are therefore performed with the goal of answering the following questions:
�
What market adaptations will be triggered by this method starting from some status quo? The answer to this question isimportant because any actually observed market prices will at least initially start with some other aC and with FTTHprices that may not derive from aF¼LRICFTTH. � How are the results influenced by non-competitive markets with horizontal product differentiation? This is importantfor assessing if actual measurements are likely to over- or under-estimate the theoretical Δperf.�
Are the results consistent and intuitively appealing and do they conform to theoretical expectations?The simulations use a competition model originally developed in Hoernig et al. (2010) and extended in Hoernig et al.(2011). It was constructed for a hypothetical country called “Euroland”, which combines population and geo data of severalEuropean countries. Only the regions (clusters) with the highest population density are considered for the simulations. Thecompetition model uses firm-specific cost functions largely derived from cost modeling and that uses specific assumptionsabout demand functions. The FTTH access network is assumed to use point-to-point technology. Costs consist of fixed costsper month for each region plus variable costs per subscriber.17
The competition model is an extension of the traditional Hotelling model to more than two firms (pyramid model by VonUngern-Sternberg (1991)).18 For each pair of services, there is a set of consumers who choose between these two productsand these consumers are (uniformly) distributed in their willingness to pay for one service rather than the other. Graphicallythis leads to a pyramid, as illustrated in Fig. 3, with each service located at one of the tips of the pyramid.
In the model each active subscriber makes a first choice between two of the firms, and unless their offers are veryunfavorable, he will choose one of the two. It is assumed that all pairs of preferred firms (before quality differences) are equallylikely in the population, so that effectively each firmwill compete with any other firm for consumers. Formally speaking, crossprice elasticities are different from zero for all product pairs. Due to the assumption of uniform distributions of consumertastes, the resulting demand function of each firm is linear in its own price and linear in the price of all other firms. This makesthe analysis tractable and allows for explicit solutions. In spite of advances in empirical demand estimation that allow for moreflexible demand specifications, the linear demand system remains popular in empirical research.
The competitive game consists of four stages, which determine the order in which participants make their moves.
�
Stage 1: A planner decides on the wholesale access prices for copper and fiber access. � Stage 2: The incumbent firm decides on investments in copper and/or FTTH access and in concentration/core networkinfrastructures, based on the restrictions and incentives provided by stage 1. Also, a cable firm decides about investment
17 The cost modeling approach is described in Hoernig et al. (2012).18 For a theoretical derivation of the model see Appendix A of this paper.
lease cite this article as: Neumann, K.-H., & Vogelsang, I. How to price the unbundled local loop in the transition fromopper to fiber access networks? Telecommunications Policy (2013), http://dx.doi.org/10.1016/j.telpol.2013.05.011i
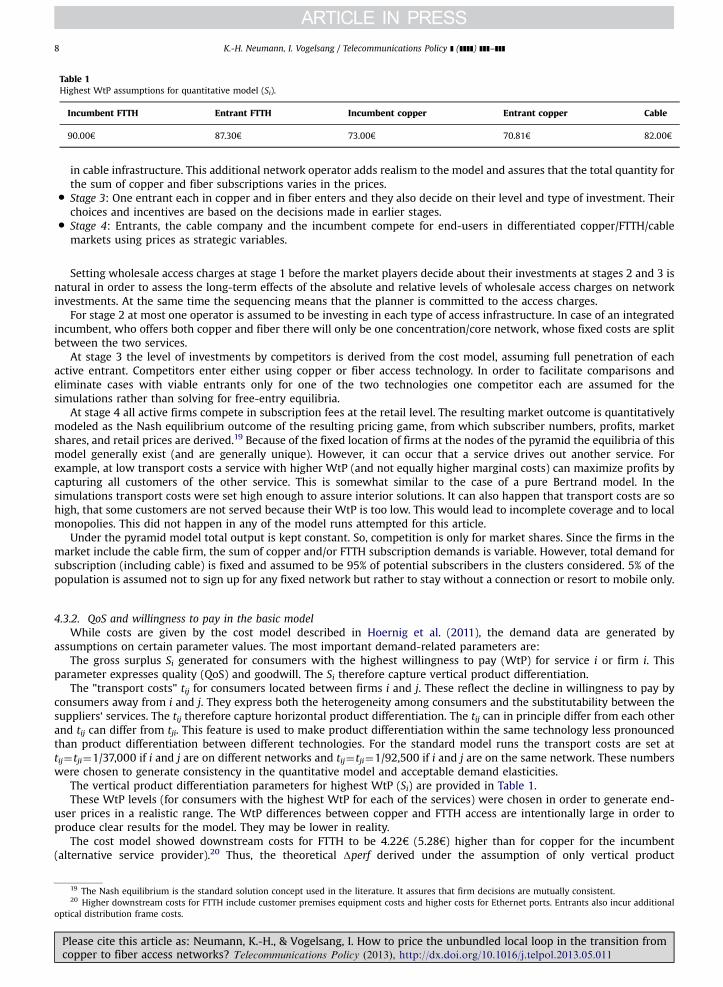
Table 1Highest WtP assumptions for quantitative model (Si).
Incumbent FTTH Entrant FTTH Incumbent copper Entrant copper Cable
90.00€ 87.30€ 73.00€ 70.81€ 82.00€
opt
Pc
K.-H. Neumann, I. Vogelsang / Telecommunications Policy ] (]]]]) ]]]–]]]8
in cable infrastructure. This additional network operator adds realism to the model and assures that the total quantity forthe sum of copper and fiber subscriptions varies in the prices.
�
Stage 3: One entrant each in copper and in fiber enters and they also decide on their level and type of investment. Theirchoices and incentives are based on the decisions made in earlier stages.�
Stage 4: Entrants, the cable company and the incumbent compete for end-users in differentiated copper/FTTH/cablemarkets using prices as strategic variables.Setting wholesale access charges at stage 1 before the market players decide about their investments at stages 2 and 3 isnatural in order to assess the long-term effects of the absolute and relative levels of wholesale access charges on networkinvestments. At the same time the sequencing means that the planner is committed to the access charges.
For stage 2 at most one operator is assumed to be investing in each type of access infrastructure. In case of an integratedincumbent, who offers both copper and fiber there will only be one concentration/core network, whose fixed costs are splitbetween the two services.
At stage 3 the level of investments by competitors is derived from the cost model, assuming full penetration of eachactive entrant. Competitors enter either using copper or fiber access technology. In order to facilitate comparisons andeliminate cases with viable entrants only for one of the two technologies one competitor each are assumed for thesimulations rather than solving for free-entry equilibria.
At stage 4 all active firms compete in subscription fees at the retail level. The resulting market outcome is quantitativelymodeled as the Nash equilibrium outcome of the resulting pricing game, from which subscriber numbers, profits, marketshares, and retail prices are derived.19 Because of the fixed location of firms at the nodes of the pyramid the equilibria of thismodel generally exist (and are generally unique). However, it can occur that a service drives out another service. Forexample, at low transport costs a service with higher WtP (and not equally higher marginal costs) can maximize profits bycapturing all customers of the other service. This is somewhat similar to the case of a pure Bertrand model. In thesimulations transport costs were set high enough to assure interior solutions. It can also happen that transport costs are sohigh, that some customers are not served because their WtP is too low. This would lead to incomplete coverage and to localmonopolies. This did not happen in any of the model runs attempted for this article.
Under the pyramid model total output is kept constant. So, competition is only for market shares. Since the firms in themarket include the cable firm, the sum of copper and/or FTTH subscription demands is variable. However, total demand forsubscription (including cable) is fixed and assumed to be 95% of potential subscribers in the clusters considered. 5% of thepopulation is assumed not to sign up for any fixed network but rather to stay without a connection or resort to mobile only.
4.3.2. QoS and willingness to pay in the basic modelWhile costs are given by the cost model described in Hoernig et al. (2011), the demand data are generated by
assumptions on certain parameter values. The most important demand-related parameters are:The gross surplus Si generated for consumers with the highest willingness to pay (WtP) for service i or firm i. This
parameter expresses quality (QoS) and goodwill. The Si therefore capture vertical product differentiation.The "transport costs" tij for consumers located between firms i and j. These reflect the decline in willingness to pay by
consumers away from i and j. They express both the heterogeneity among consumers and the substitutability between thesuppliers‘ services. The tij therefore capture horizontal product differentiation. The tij can in principle differ from each otherand tij can differ from tji. This feature is used to make product differentiation within the same technology less pronouncedthan product differentiation between different technologies. For the standard model runs the transport costs are set attij¼tji¼1/37,000 if i and j are on different networks and tij¼tji¼1/92,500 if i and j are on the same network. These numberswere chosen to generate consistency in the quantitative model and acceptable demand elasticities.
The vertical product differentiation parameters for highest WtP (Si) are provided in Table 1.These WtP levels (for consumers with the highest WtP for each of the services) were chosen in order to generate end-
user prices in a realistic range. The WtP differences between copper and FTTH access are intentionally large in order toproduce clear results for the model. They may be lower in reality.
The cost model showed downstream costs for FTTH to be 4.22€ (5.28€) higher than for copper for the incumbent(alternative service provider).20 Thus, the theoretical Δperf derived under the assumption of only vertical product
19 The Nash equilibrium is the standard solution concept used in the literature. It assures that firm decisions are mutually consistent.20 Higher downstream costs for FTTH include customer premises equipment costs and higher costs for Ethernet ports. Entrants also incur additionalical distribution frame costs.
lease cite this article as: Neumann, K.-H., & Vogelsang, I. How to price the unbundled local loop in the transition fromopper to fiber access networks? Telecommunications Policy (2013), http://dx.doi.org/10.1016/j.telpol.2013.05.011i
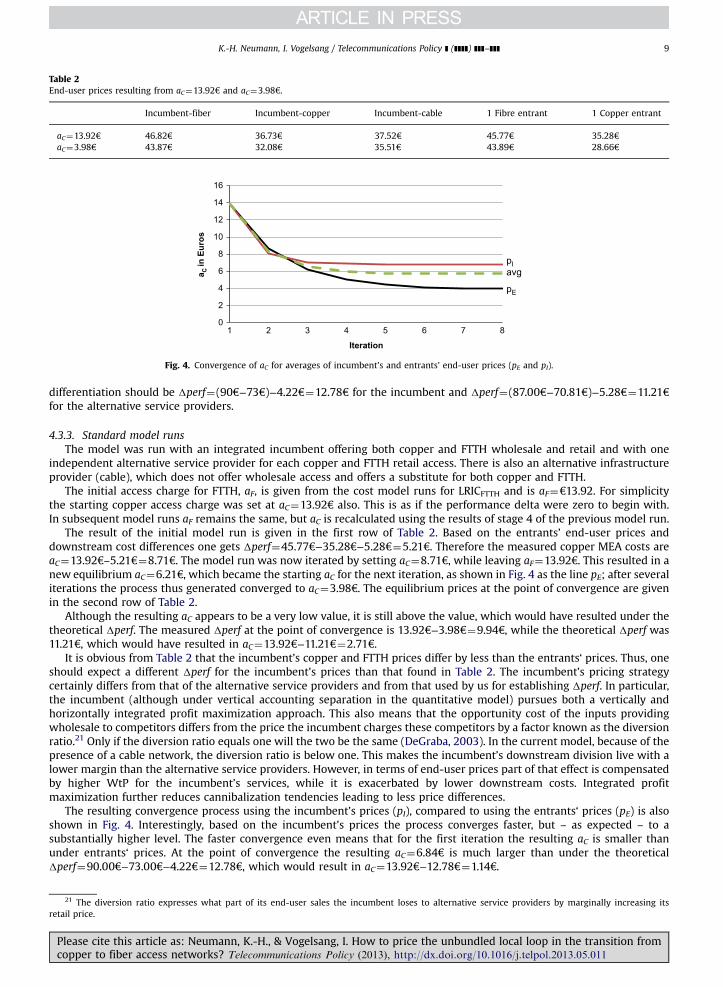
Table 2End-user prices resulting from aC¼13.92€ and aC¼3.98€.
Incumbent-fiber Incumbent-copper Incumbent-cable 1 Fibre entrant 1 Copper entrant
aC¼13.92€ 46.82€ 36.73€ 37.52€ 45.77€ 35.28€aC¼3.98€ 43.87€ 32.08€ 35.51€ 43.89€ 28.66€
0
2
4
6
8
10
12
14
16
1 2 3 4 5 6 7 8
a C in
Eur
os
Iteration
pIavg
pE
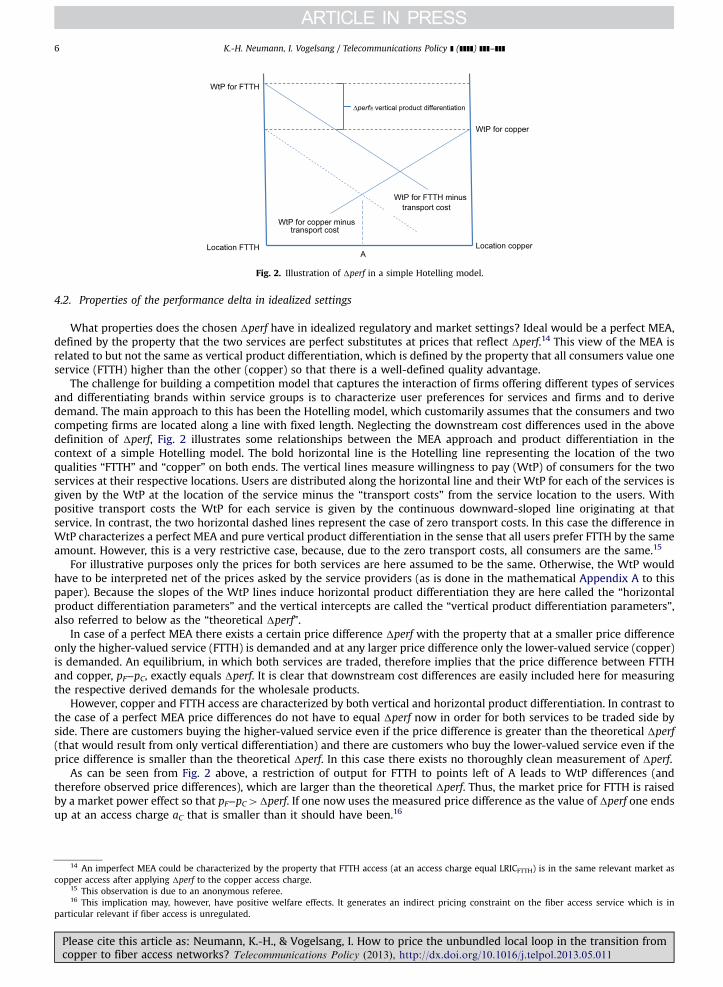
Fig. 4. Convergence of aC for averages of incumbent’s and entrants’ end-user prices (pE and pI).
K.-H. Neumann, I. Vogelsang / Telecommunications Policy ] (]]]]) ]]]–]]] 9
differentiation should be Δperf¼(90€−73€)−4.22€¼12.78€ for the incumbent and Δperf¼(87.00€−70.81€)−5.28€¼11.21€for the alternative service providers.
4.3.3. Standard model runsThe model was run with an integrated incumbent offering both copper and FTTH wholesale and retail and with one
independent alternative service provider for each copper and FTTH retail access. There is also an alternative infrastructureprovider (cable), which does not offer wholesale access and offers a substitute for both copper and FTTH.
The initial access charge for FTTH, aF, is given from the cost model runs for LRICFTTH and is aF¼€13.92. For simplicitythe starting copper access charge was set at aC¼13.92€ also. This is as if the performance delta were zero to begin with.In subsequent model runs aF remains the same, but aC is recalculated using the results of stage 4 of the previous model run.
The result of the initial model run is given in the first row of Table 2. Based on the entrants’ end-user prices anddownstream cost differences one gets Δperf¼45.77€−35.28€−5.28€¼5.21€. Therefore the measured copper MEA costs areaC¼13.92€–5.21€¼8.71€. The model run was now iterated by setting aC¼8.71€, while leaving aF¼13.92€. This resulted in anew equilibrium aC¼6.21€, which became the starting aC for the next iteration, as shown in Fig. 4 as the line pE; after severaliterations the process thus generated converged to aC¼3.98€. The equilibrium prices at the point of convergence are givenin the second row of Table 2.
Although the resulting aC appears to be a very low value, it is still above the value, which would have resulted under thetheoretical Δperf. The measured Δperf at the point of convergence is 13.92€−3.98€¼9.94€, while the theoretical Δperf was11.21€, which would have resulted in aC¼13.92€−11.21€¼2.71€.
It is obvious from Table 2 that the incumbent’s copper and FTTH prices differ by less than the entrants‘ prices. Thus, oneshould expect a different Δperf for the incumbent’s prices than that found in Table 2. The incumbent’s pricing strategycertainly differs from that of the alternative service providers and from that used by us for establishing Δperf. In particular,the incumbent (although under vertical accounting separation in the quantitative model) pursues both a vertically andhorizontally integrated profit maximization approach. This also means that the opportunity cost of the inputs providingwholesale to competitors differs from the price the incumbent charges these competitors by a factor known as the diversionratio.21 Only if the diversion ratio equals one will the two be the same (DeGraba, 2003). In the current model, because of thepresence of a cable network, the diversion ratio is below one. This makes the incumbent’s downstream division live with alower margin than the alternative service providers. However, in terms of end-user prices part of that effect is compensatedby higher WtP for the incumbent’s services, while it is exacerbated by lower downstream costs. Integrated profitmaximization further reduces cannibalization tendencies leading to less price differences.
The resulting convergence process using the incumbent’s prices (pI), compared to using the entrants‘ prices (pE) is alsoshown in Fig. 4. Interestingly, based on the incumbent’s prices the process converges faster, but – as expected – to asubstantially higher level. The faster convergence even means that for the first iteration the resulting aC is smaller thanunder entrants‘ prices. At the point of convergence the resulting aC¼6.84€ is much larger than under the theoreticalΔperf¼90.00€−73.00€−4.22€¼12.78€, which would result in aC¼13.92€−12.78€¼1.14€.
21 The diversion ratio expresses what part of its end-user sales the incumbent loses to alternative service providers by marginally increasing itsretail price.
Please cite this article as: Neumann, K.-H., & Vogelsang, I. How to price the unbundled local loop in the transition fromcopper to fiber access networks? Telecommunications Policy (2013), http://dx.doi.org/10.1016/j.telpol.2013.05.011i
0
2
4
6
8
10
12
14
16
1 2 3 4 5 6 7 8
a C in
Eur
os
Iteration
aF = 13.92
aF = 20
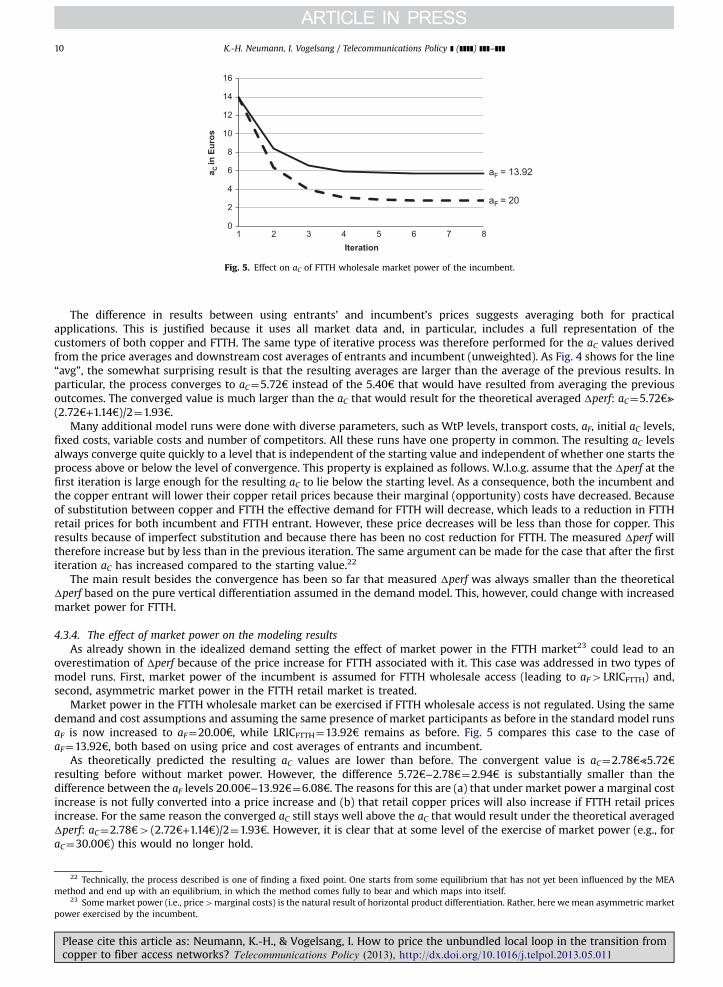
Fig. 5. Effect on aC of FTTH wholesale market power of the incumbent.
K.-H. Neumann, I. Vogelsang / Telecommunications Policy ] (]]]]) ]]]–]]]10
The difference in results between using entrants’ and incumbent’s prices suggests averaging both for practicalapplications. This is justified because it uses all market data and, in particular, includes a full representation of thecustomers of both copper and FTTH. The same type of iterative process was therefore performed for the aC values derivedfrom the price averages and downstream cost averages of entrants and incumbent (unweighted). As Fig. 4 shows for the line“avg”, the somewhat surprising result is that the resulting averages are larger than the average of the previous results. Inparticular, the process converges to aC¼5.72€ instead of the 5.40€ that would have resulted from averaging the previousoutcomes. The converged value is much larger than the aC that would result for the theoretical averaged Δperf: aC¼5.72€⪢(2.72€+1.14€)/2¼1.93€.
Many additional model runs were done with diverse parameters, such as WtP levels, transport costs, aF, initial aC levels,fixed costs, variable costs and number of competitors. All these runs have one property in common. The resulting aC levelsalways converge quite quickly to a level that is independent of the starting value and independent of whether one starts theprocess above or below the level of convergence. This property is explained as follows. W.l.o.g. assume that the Δperf at thefirst iteration is large enough for the resulting aC to lie below the starting level. As a consequence, both the incumbent andthe copper entrant will lower their copper retail prices because their marginal (opportunity) costs have decreased. Becauseof substitution between copper and FTTH the effective demand for FTTH will decrease, which leads to a reduction in FTTHretail prices for both incumbent and FTTH entrant. However, these price decreases will be less than those for copper. Thisresults because of imperfect substitution and because there has been no cost reduction for FTTH. The measured Δperf willtherefore increase but by less than in the previous iteration. The same argument can be made for the case that after the firstiteration aC has increased compared to the starting value.22
The main result besides the convergence has been so far that measured Δperf was always smaller than the theoreticalΔperf based on the pure vertical differentiation assumed in the demand model. This, however, could change with increasedmarket power for FTTH.
4.3.4. The effect of market power on the modeling resultsAs already shown in the idealized demand setting the effect of market power in the FTTH market23 could lead to an
overestimation of Δperf because of the price increase for FTTH associated with it. This case was addressed in two types ofmodel runs. First, market power of the incumbent is assumed for FTTH wholesale access (leading to aF4LRICFTTH) and,second, asymmetric market power in the FTTH retail market is treated.
Market power in the FTTH wholesale market can be exercised if FTTH wholesale access is not regulated. Using the samedemand and cost assumptions and assuming the same presence of market participants as before in the standard model runsaF is now increased to aF¼20.00€, while LRICFTTH¼13.92€ remains as before. Fig. 5 compares this case to the case ofaF¼13.92€, both based on using price and cost averages of entrants and incumbent.
As theoretically predicted the resulting aC values are lower than before. The convergent value is aC¼2.78€⪡5.72€resulting before without market power. However, the difference 5.72€−2.78€¼2.94€ is substantially smaller than thedifference between the aF levels 20.00€−13.92€¼6.08€. The reasons for this are (a) that under market power a marginal costincrease is not fully converted into a price increase and (b) that retail copper prices will also increase if FTTH retail pricesincrease. For the same reason the converged aC still stays well above the aC that would result under the theoretical averagedΔperf: aC¼2.78€4(2.72€+1.14€)/2¼1.93€. However, it is clear that at some level of the exercise of market power (e.g., foraC¼30.00€) this would no longer hold.
22 Technically, the process described is one of finding a fixed point. One starts from some equilibrium that has not yet been influenced by the MEAmethod and end up with an equilibrium, in which the method comes fully to bear and which maps into itself.
23 Some market power (i.e., price4marginal costs) is the natural result of horizontal product differentiation. Rather, here we mean asymmetric marketpower exercised by the incumbent.
Please cite this article as: Neumann, K.-H., & Vogelsang, I. How to price the unbundled local loop in the transition fromcopper to fiber access networks? Telecommunications Policy (2013), http://dx.doi.org/10.1016/j.telpol.2013.05.011i
0
2
4
6
8
10
12
14
16
1 2 3 4 5 6 7 8
a C in
Eur
os
Iteration
1 FTTH entrant2 FTTH entrants
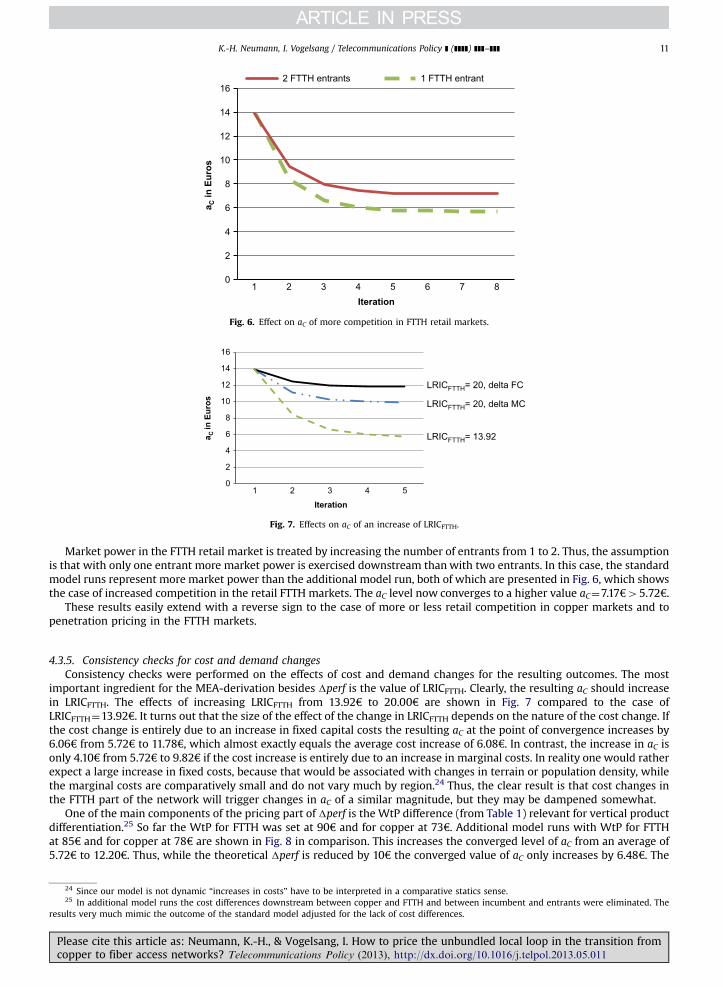
Fig. 6. Effect on aC of more competition in FTTH retail markets.
0
2
4
6
8
10
12
14
16
1 2 3 4 5
a C in
Eur
os
Iteration
LRICFTTH= 20, delta FC
LRICFTTH= 20, delta MC
LRICFTTH= 13.92
Fig. 7. Effects on aC of an increase of LRICFTTH.
K.-H. Neumann, I. Vogelsang / Telecommunications Policy ] (]]]]) ]]]–]]] 11
Market power in the FTTH retail market is treated by increasing the number of entrants from 1 to 2. Thus, the assumptionis that with only one entrant more market power is exercised downstream than with two entrants. In this case, the standardmodel runs represent more market power than the additional model run, both of which are presented in Fig. 6, which showsthe case of increased competition in the retail FTTH markets. The aC level now converges to a higher value aC¼7.17€45.72€.
These results easily extend with a reverse sign to the case of more or less retail competition in copper markets and topenetration pricing in the FTTH markets.
4.3.5. Consistency checks for cost and demand changesConsistency checks were performed on the effects of cost and demand changes for the resulting outcomes. The most
important ingredient for the MEA-derivation besides Δperf is the value of LRICFTTH. Clearly, the resulting aC should increasein LRICFTTH. The effects of increasing LRICFTTH from 13.92€ to 20.00€ are shown in Fig. 7 compared to the case ofLRICFTTH¼13.92€. It turns out that the size of the effect of the change in LRICFTTH depends on the nature of the cost change. Ifthe cost change is entirely due to an increase in fixed capital costs the resulting aC at the point of convergence increases by6.06€ from 5.72€ to 11.78€, which almost exactly equals the average cost increase of 6.08€. In contrast, the increase in aC isonly 4.10€ from 5.72€ to 9.82€ if the cost increase is entirely due to an increase in marginal costs. In reality one would ratherexpect a large increase in fixed costs, because that would be associated with changes in terrain or population density, whilethe marginal costs are comparatively small and do not vary much by region.24 Thus, the clear result is that cost changes inthe FTTH part of the network will trigger changes in aC of a similar magnitude, but they may be dampened somewhat.
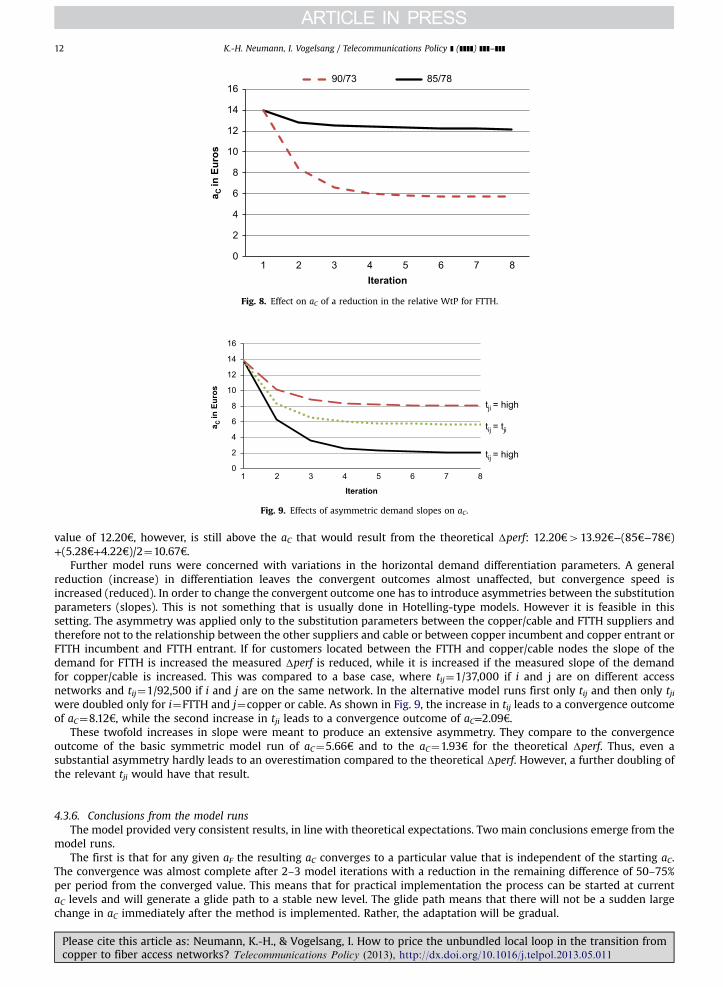
One of the main components of the pricing part of Δperf is the WtP difference (from Table 1) relevant for vertical productdifferentiation.25 So far the WtP for FTTH was set at 90€ and for copper at 73€. Additional model runs with WtP for FTTHat 85€ and for copper at 78€ are shown in Fig. 8 in comparison. This increases the converged level of aC from an average of5.72€ to 12.20€. Thus, while the theoretical Δperf is reduced by 10€ the converged value of aC only increases by 6.48€. The
24 Since our model is not dynamic “increases in costs” have to be interpreted in a comparative statics sense.25 In additional model runs the cost differences downstream between copper and FTTH and between incumbent and entrants were eliminated. The
results very much mimic the outcome of the standard model adjusted for the lack of cost differences.
Please cite this article as: Neumann, K.-H., & Vogelsang, I. How to price the unbundled local loop in the transition fromcopper to fiber access networks? Telecommunications Policy (2013), http://dx.doi.org/10.1016/j.telpol.2013.05.011i
0
2
4
6
8
10
12
14
16
1 2 3 4 5 6 7 8
a C in
Eur
os
Iteration
85/7890/73
Fig. 8. Effect on aC of a reduction in the relative WtP for FTTH.
0
2
4
6
8
10
12
14
16
1 2 3 4 5 6 7 8
a C in
Eur
os
Iteration
tji = high
tij = tji
tij = high
Fig. 9. Effects of asymmetric demand slopes on aC.
K.-H. Neumann, I. Vogelsang / Telecommunications Policy ] (]]]]) ]]]–]]]12
value of 12.20€, however, is still above the aC that would result from the theoretical Δperf: 12.20€413.92€−(85€−78€)+(5.28€+4.22€)/2¼10.67€.
Further model runs were concerned with variations in the horizontal demand differentiation parameters. A generalreduction (increase) in differentiation leaves the convergent outcomes almost unaffected, but convergence speed isincreased (reduced). In order to change the convergent outcome one has to introduce asymmetries between the substitutionparameters (slopes). This is not something that is usually done in Hotelling-type models. However it is feasible in thissetting. The asymmetry was applied only to the substitution parameters between the copper/cable and FTTH suppliers andtherefore not to the relationship between the other suppliers and cable or between copper incumbent and copper entrant orFTTH incumbent and FTTH entrant. If for customers located between the FTTH and copper/cable nodes the slope of thedemand for FTTH is increased the measured Δperf is reduced, while it is increased if the measured slope of the demandfor copper/cable is increased. This was compared to a base case, where tij¼1/37,000 if i and j are on different accessnetworks and tij¼1/92,500 if i and j are on the same network. In the alternative model runs first only tij and then only tjiwere doubled only for i¼FTTH and j¼copper or cable. As shown in Fig. 9, the increase in tij leads to a convergence outcomeof aC¼8.12€, while the second increase in tji leads to a convergence outcome of aC=2.09€.
These twofold increases in slope were meant to produce an extensive asymmetry. They compare to the convergenceoutcome of the basic symmetric model run of aC¼5.66€ and to the aC¼1.93€ for the theoretical Δperf. Thus, even asubstantial asymmetry hardly leads to an overestimation compared to the theoretical Δperf. However, a further doubling ofthe relevant tji would have that result.
4.3.6. Conclusions from the model runsThe model provided very consistent results, in line with theoretical expectations. Two main conclusions emerge from the
model runs.The first is that for any given aF the resulting aC converges to a particular value that is independent of the starting aC.
The convergence was almost complete after 2–3 model iterations with a reduction in the remaining difference of 50–75%per period from the converged value. This means that for practical implementation the process can be started at currentaC levels and will generate a glide path to a stable new level. The glide path means that there will not be a sudden largechange in aC immediately after the method is implemented. Rather, the adaptation will be gradual.
Please cite this article as: Neumann, K.-H., & Vogelsang, I. How to price the unbundled local loop in the transition fromcopper to fiber access networks? Telecommunications Policy (2013), http://dx.doi.org/10.1016/j.telpol.2013.05.011i
K.-H. Neumann, I. Vogelsang / Telecommunications Policy ] (]]]]) ]]]–]]] 13
The second main conclusion is that the method tends to be conservative relative to the theoretical case of pure verticalproduct differentiation, meaning that the measured Δperf underestimates the theoretical Δperf. Thus, the incumbent willlikely receive a higher aC than theoretically correct. The measured Δperf is likely to be smaller because of
�
Pc
Horizontal product differentiation;
� Penetration pricing for FTTH; � An averaging of prices and downstream cost differences of incumbent and entrants (if such averaging is performed); � An automatic glide path that keeps aC higher at the beginning.In contrast, the Δperf could be overestimated if the incumbent (or someone else) exercises market power in the FTTHmarkets. However, this exercise of market power needs to be substantial before it overcomes the before-mentioned effects.At the same time the reduction in aC resulting from this market power may prevent the incumbent from exercising it.
The Δperf could also be overestimated if there is a strong asymmetry in the horizontal product differentiation parameters(slopes). This is quite unlikely to occur.
Thus, in general one can expect the glide path generated by the approach to end at a level that is higher than under onlyvertical product differentiation.
4.4. Concerns and necessary steps for practical implementation
There are four main concerns for practical application of the MEA-approach analyzed. They are (1) strategic behavior ofmarket participants, (2) availability of price data, for FTTH in particular, (3) availability of cost data, for FTTH and fordownstream services in particular, and (4) proper upper and lower bounds for aC.
4.4.1. Strategic behavior of market participantsAny regulatory approach may be undermined by strategic behavior, mostly by the regulated firm. The MEA approach
suggested here is dynamic in the sense that the current price for wholesale copper access is made dependent on theobserved previous retail prices for copper and FTTH access (which are assumed to be unregulated). If, for example, theincumbent charges a lower than profit-maximizing FTTH price and/or higher than profit-maximizing copper price today thiswill lead to a higher regulated aC for the next period. Clearly, the incumbent would thereby be sacrificing profits today inorder to gain profits later from the higher aC, which will trigger higher retail prices as well as generate more wholesaleprofits. Without further strategic behavior and without the exit of other firms the process would revert to lower aC levels inthe future, ending in a cycle (from the convergence result). Only if such a cycle were profitable or if successful predationwere profitable would such strategic behavior be undertaken. This cannot be analyzed with the model but it is unlikely to beprofitable for two reasons. First, the cycle takes time so that the additional profits have to be discounted. This is part of thetraditional argument against the rationality of predation. Second, the incumbent only receives 50% weight in the averagingprocedure for determining aC. This acts like a 50% discount rate and substantially strengthens the previous argument. It alsoargues against using the incumbent’s market share as a weight for determining the pricing averages when calculating aC.One signal that such strategic behavior could be occurring would be a margin squeeze for FTTH. Without a price increase ofcopper access at the retail level this would lead to a margin squeeze for copper as well. Thus, a margin squeeze for coppershould be disallowed via setting an upper bound for aC.
A somewhat similar argument for strategic behavior could be made for the alternative service providers for copperaccess, who could reduce their copper retail prices in order to gain a future reduction in aC. This argument is even weakerthan that for the incumbent, because there can be no predation. Therefore, the probability of such type of strategic behavioris low.
4.4.2. Availability of price dataFTTH has very low penetration rates in many countries. Reliable FTTH retail prices cannot therefore be expected
everywhere. In such a case it may be necessary to import price data from countries with higher FTTH penetration and withlonger FTTH experience.26 Such prices, however, do not easily translate via exchange rates or purchasing power parities. Inparticular, the absolute differences between FTTH and copper prices may not be very meaningful. In contrast, the ratiobetween FTTH and copper prices is likely to be much more robust, because it does not require any exchange rates. Thissuggests considering properties of using the price and cost ratios instead of price and cost differences for determining Δperf.
Based on ratios aC should be determined as
aC ¼ LRICFTTHð1−Δperf Þ ð3Þand
Δperf ¼ ððpF−CFdownstreamÞ−ðpC−CCdownstreamÞÞ=ðpF−CFdownstreamÞ; ð4Þ
26 Using foreign price data also means that the market conditions in those countries are deemed acceptable.
lease cite this article as: Neumann, K.-H., & Vogelsang, I. How to price the unbundled local loop in the transition fromopper to fiber access networks? Telecommunications Policy (2013), http://dx.doi.org/10.1016/j.telpol.2013.05.011i
K.-H. Neumann, I. Vogelsang / Telecommunications Policy ] (]]]]) ]]]–]]]14
which imply
aC ¼ FL−LRICFTTHðpC−CCdownstreamÞ=ðpF−CFdownstreamÞ: ð5ÞWhile the determination of aC using price and cost differences leads to the same absolute markup for copper and FTTH at
the retail level, the ratio method only leads to the same relative markup. Because aC will be smaller than LRICFTTH the ratiomethod will therefore lead to lower markups for copper and also to higher aC levels. Using the ratio method will thereforetend to understate the measured Δperf compared to the theoretical Δperf.
4.4.3. Availability of cost dataCost data for FTTH are substantially less available than cost data for copper access. However, several bottom-up cost
models exist that could be used by regulators.The other cost data needed concern downstream costs for copper and FTTH. Most of these downstream costs are likely to
be similar (e.g., marketing and sales costs) but there will be some differences, such as higher CPE costs and higher costs forEthernet ports incurred for FTTH. The costing exercise only needs to calculate these differences.
4.4.4. Lower and upper bounds for aCAs the simulations showed for some extreme cases, the resulting aC at convergence could be very low (in case of very
high WtP differences and/or exercise of market power for FTTH) or very high (in case of penetration pricing for FTTH and/orlow WtP differences). Both of these results may be unacceptable.
In the first case of a very low resulting aC copper access should actually no longer be offered. However, one should leavethat to the market and set a lower bound for aC that covers the incumbent’s costs of continuing operation. These costs areSRIC plus the apportioned value of capital costs of assets that could otherwise be sold in second-hand markets.
In the second case of a very high resulting aC FTTH access would not really be the MEA for copper access. This would holdif the resulting aC exceeded the copper LRICC. Thus, aC¼LRICC (including some common costs) would have to form an upperbound for the aC values.
4.5. Conjectured efficiency and investment properties
Being competitively neutral does not mean that using the described MEA approach will necessarily lead to a staticwelfare optimum or to dynamically efficient investment incentives.
It is hard to evaluate static welfare effects of the MEA method, because neither it nor the traditional LRIC approach usesRamsey pricing markups on marginal costs. Compared to the use of traditional LRIC-based access charges the overallmarkups on both fiber and copper will be reduced under the MEA approach. The net effect on welfare will therefore beambiguous, but the MEA method would improve consumer welfare over traditional LRIC-based prices. This is also borne outby the quantitative model results, where under the standard model runs over all iterations total welfare declined by about0.5%, while consumer surplus increased by about 10%.
In a world with expected parallel operation of copper and fiber access networks over a long time span the investmentincentive properties of the relationship between copper and fiber access charges depend on the interaction of two effects,called replacement effect and migration effect (Bourreau, Cambini, & Dogan, 2012).
The replacement effect calls for a large enough difference between the copper and fiber access charge so that profits fromcopper alone are lower than profits from operating both a copper and a fiber access network. That means replacing copperwith fiber needs to be sufficiently profitable in order to induce fiber investment. The MEA approach provides for such anaccess charge difference, although it is likely to be smaller than it would be if only the replacement effect were operating.
The migration effect calls for small enough price differences between copper and fiber access so that end-users haveincentives to switch from copper to fiber, once fiber is offered. Because it is based on indifference between copper and fiberthe MEA approach leads to price differences that are precisely based on such a consideration. It is not tilted in favor of fiber,though. However, with the expected underestimation of the measured as compared to the theoretical performance delta apreference for fiber should result, which would favor fiber investment.
5. Conclusions
Most European regulators still apply FL-LRIC principles to calculate the copper access charges. This article has made thecase that this pricing principle is no longer adequate due to the decreasing demand for copper access and the transitionfrom copper to fiber access. FL-LRIC was designed for a market environment which actually no longer prevails in the accessmarket. Some regulators have reacted and either capped the copper access charge, are gradually reducing it or are treatingfiber access as the modern equivalent asset to copper access.
This article developed and presented a novel solution to optimal pricing of copper access in the transition to fiber access.To become competitively and technologically neutral, copper access should be based on the cost of fiber access corrected bythe performance delta between copper and fiber access. The performance delta should be derived from the market valuationof services provided over copper and fiber access represented by the end-user prices of services and corrected by costdifferences down stream of the access provision.
Please cite this article as: Neumann, K.-H., & Vogelsang, I. How to price the unbundled local loop in the transition fromcopper to fiber access networks? Telecommunications Policy (2013), http://dx.doi.org/10.1016/j.telpol.2013.05.011i
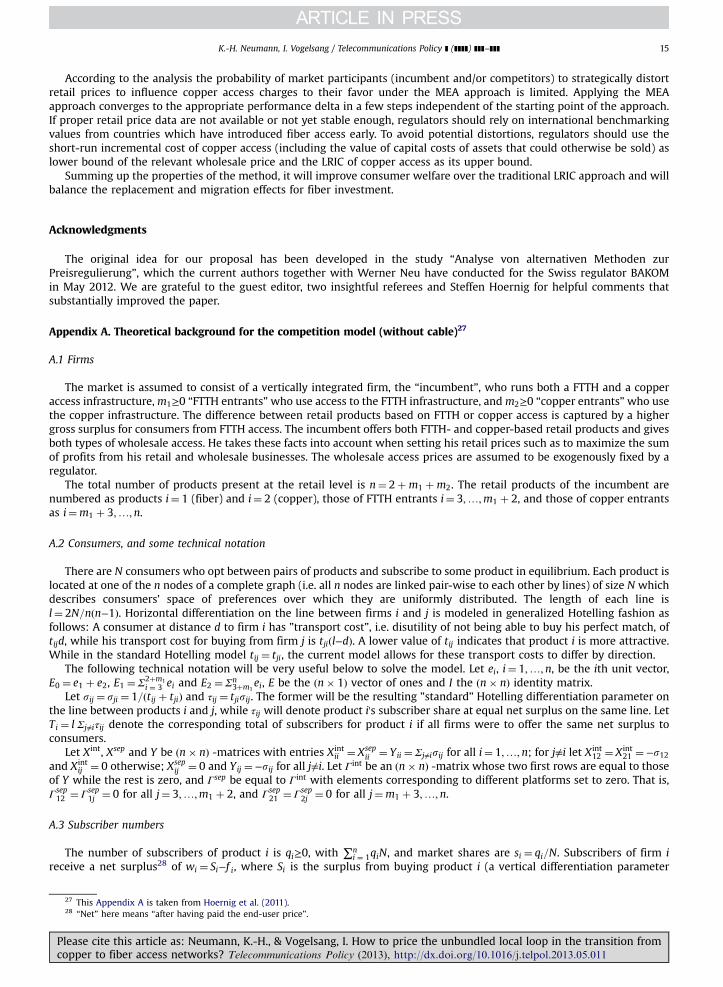
K.-H. Neumann, I. Vogelsang / Telecommunications Policy ] (]]]]) ]]]–]]] 15
According to the analysis the probability of market participants (incumbent and/or competitors) to strategically distortretail prices to influence copper access charges to their favor under the MEA approach is limited. Applying the MEAapproach converges to the appropriate performance delta in a few steps independent of the starting point of the approach.If proper retail price data are not available or not yet stable enough, regulators should rely on international benchmarkingvalues from countries which have introduced fiber access early. To avoid potential distortions, regulators should use theshort-run incremental cost of copper access (including the value of capital costs of assets that could otherwise be sold) aslower bound of the relevant wholesale price and the LRIC of copper access as its upper bound.
Summing up the properties of the method, it will improve consumer welfare over the traditional LRIC approach and willbalance the replacement and migration effects for fiber investment.
Acknowledgments
The original idea for our proposal has been developed in the study “Analyse von alternativen Methoden zurPreisregulierung”, which the current authors together with Werner Neu have conducted for the Swiss regulator BAKOMin May 2012. We are grateful to the guest editor, two insightful referees and Steffen Hoernig for helpful comments thatsubstantially improved the paper.
Appendix A. Theoretical background for the competition model (without cable)27
A.1 Firms
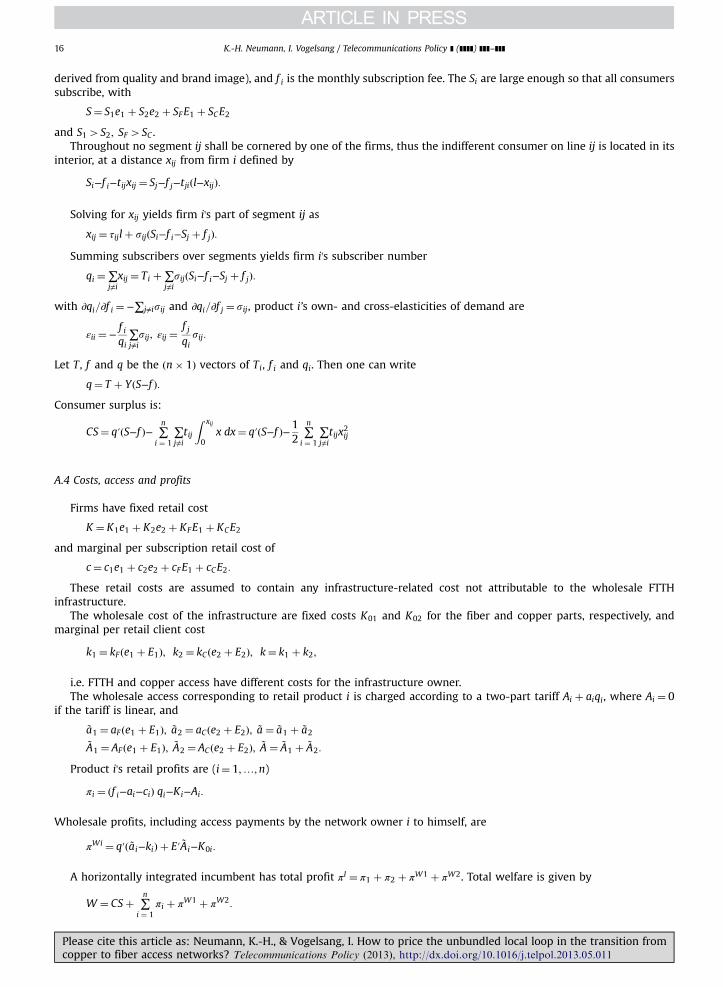
The market is assumed to consist of a vertically integrated firm, the “incumbent”, who runs both a FTTH and a copperaccess infrastructure,m1≥0 “FTTH entrants”who use access to the FTTH infrastructure, andm2≥0 “copper entrants”who usethe copper infrastructure. The difference between retail products based on FTTH or copper access is captured by a highergross surplus for consumers from FTTH access. The incumbent offers both FTTH- and copper-based retail products and givesboth types of wholesale access. He takes these facts into account when setting his retail prices such as to maximize the sumof profits from his retail and wholesale businesses. The wholesale access prices are assumed to be exogenously fixed by aregulator.
The total number of products present at the retail level is n¼ 2þm1 þm2. The retail products of the incumbent arenumbered as products i¼ 1 (fiber) and i¼ 2 (copper), those of FTTH entrants i¼ 3;…;m1 þ 2, and those of copper entrantsas i¼m1 þ 3;…;n.
A.2 Consumers, and some technical notation
There are N consumers who opt between pairs of products and subscribe to some product in equilibrium. Each product islocated at one of the n nodes of a complete graph (i.e. all n nodes are linked pair-wise to each other by lines) of size N whichdescribes consumers’ space of preferences over which they are uniformly distributed. The length of each line isl¼ 2N=nðn−1Þ. Horizontal differentiation on the line between firms i and j is modeled in generalized Hotelling fashion asfollows: A consumer at distance d to firm i has ”transport cost”, i.e. disutility of not being able to buy his perfect match, oftijd, while his transport cost for buying from firm j is tjiðl−dÞ. A lower value of tij indicates that product i is more attractive.While in the standard Hotelling model tij ¼ tji, the current model allows for these transport costs to differ by direction.
The following technical notation will be very useful below to solve the model. Let ei, i¼ 1;…;n, be the ith unit vector,E0 ¼ e1 þ e2, E1 ¼ Σ2þm1
i ¼ 3 ei and E2 ¼ Σn3þm1
ei, E be the ðn� 1Þ vector of ones and I the ðn� nÞ identity matrix.Let sij ¼ sji ¼ 1=ðtij þ tjiÞ and τij ¼ tjisij. The former will be the resulting ”standard” Hotelling differentiation parameter on
the line between products i and j, while τij will denote product i's subscriber share at equal net surplus on the same line. LetTi ¼ l Σj≠iτij denote the corresponding total of subscribers for product i if all firms were to offer the same net surplus toconsumers.
Let Xint, Xsep and Y be ðn� nÞ -matrices with entries Xintii ¼ Xsep
ii ¼ Yii ¼ Σj≠isij for all i¼ 1;…;n; for j≠i let Xint12 ¼ Xint
21 ¼−s12and Xint
ij ¼ 0 otherwise; Xsepij ¼ 0 and Yij ¼−sij for all j≠i. Let Γint be an ðn� nÞ -matrix whose two first rows are equal to those
of Y while the rest is zero, and Γsep be equal to Γint with elements corresponding to different platforms set to zero. That is,Γsep12 ¼ Γsep
1j ¼ 0 for all j¼ 3;…;m1 þ 2, and Γsep21 ¼ Γsep
2j ¼ 0 for all j¼m1 þ 3;…;n.
A.3 Subscriber numbers
The number of subscribers of product i is qi≥0, with ∑ni ¼ 1qiN, and market shares are si ¼ qi=N. Subscribers of firm i
receive a net surplus28 of wi ¼ Si−f i, where Si is the surplus from buying product i (a vertical differentiation parameter
27 This Appendix A is taken from Hoernig et al. (2011).28 “Net” here means “after having paid the end-user price”.
Please cite this article as: Neumann, K.-H., & Vogelsang, I. How to price the unbundled local loop in the transition fromcopper to fiber access networks? Telecommunications Policy (2013), http://dx.doi.org/10.1016/j.telpol.2013.05.011i
K.-H. Neumann, I. Vogelsang / Telecommunications Policy ] (]]]]) ]]]–]]]16
derived from quality and brand image), and f i is the monthly subscription fee. The Si are large enough so that all consumerssubscribe, with
S¼ S1e1 þ S2e2 þ SFE1 þ SCE2
and S14S2; SF4SC .Throughout no segment ij shall be cornered by one of the firms, thus the indifferent consumer on line ij is located in its
interior, at a distance xij from firm i defined by
Si−f i−tijxij ¼ Sj−f j−tjiðl−xijÞ:
Solving for xij yields firm i's part of segment ij as
xij ¼ τijlþ sijðSi−f i−Sj þ f jÞ:
Summing subscribers over segments yields firm i's subscriber number
qi ¼∑j≠ixij ¼ Ti þ∑
j≠isijðSi−f i−Sj þ f jÞ:
with ∂qi=∂f i ¼ −∑j≠isij and ∂qi=∂f j ¼ sij, product i’s own- and cross-elasticities of demand are
εii ¼ −f iqi∑j≠isij; εij ¼
f jqisij:
Let T , f and q be the ðn� 1Þ vectors of Ti, f i and qi. Then one can write
q¼ T þ YðS−f Þ:Consumer surplus is:
CS¼ q′ðS−f Þ− ∑n
i ¼ 1∑j≠itij
Z xij
0x dx¼ q′ðS−f Þ−1
2∑n
i ¼ 1∑j≠itijx2ij
A.4 Costs, access and profits
Firms have fixed retail cost
K ¼ K1e1 þ K2e2 þ KFE1 þ KCE2
and marginal per subscription retail cost of
c¼ c1e1 þ c2e2 þ cFE1 þ cCE2:
These retail costs are assumed to contain any infrastructure-related cost not attributable to the wholesale FTTHinfrastructure.
The wholesale cost of the infrastructure are fixed costs K01 and K02 for the fiber and copper parts, respectively, andmarginal per retail client cost
k1 ¼ kF ðe1 þ E1Þ; k2 ¼ kCðe2 þ E2Þ; k¼ k1 þ k2;
i.e. FTTH and copper access have different costs for the infrastructure owner.The wholesale access corresponding to retail product i is charged according to a two-part tariff Ai þ aiqi, where Ai ¼ 0
if the tariff is linear, and
~a1 ¼ aF ðe1 þ E1Þ; ~a2 ¼ aCðe2 þ E2Þ; ~a ¼ ~a1 þ ~a2
~A1 ¼ AF ðe1 þ E1Þ; ~A2 ¼ ACðe2 þ E2Þ; ~A ¼ ~A1 þ ~A2:
Product i's retail profits are (i¼ 1;…;n)
πi ¼ ðf i−ai−ciÞ qi−Ki−Ai:
Wholesale profits, including access payments by the network owner i to himself, are
πWi ¼ q′ð ~ai−kiÞ þ E′ ~Ai−K0i:
A horizontally integrated incumbent has total profit πI ¼ π1 þ π2 þ πW1 þ πW2. Total welfare is given by
W ¼ CSþ ∑n
i ¼ 1πi þ πW1 þ πW2:
Please cite this article as: Neumann, K.-H., & Vogelsang, I. How to price the unbundled local loop in the transition fromcopper to fiber access networks? Telecommunications Policy (2013), http://dx.doi.org/10.1016/j.telpol.2013.05.011i
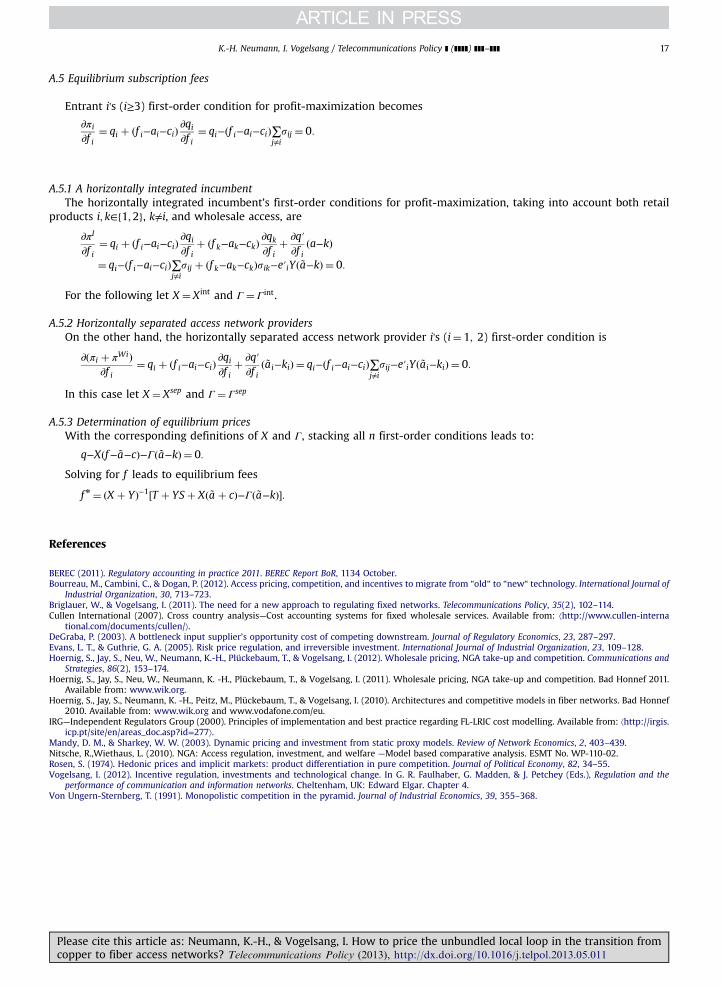
K.-H. Neumann, I. Vogelsang / Telecommunications Policy ] (]]]]) ]]]–]]] 17
A.5 Equilibrium subscription fees
Entrant i's (i≥3) first-order condition for profit-maximization becomes
∂πi∂f i
¼ qi þ ðf i−ai−ciÞ∂qi∂f i
¼ qi−ðf i−ai−ciÞ∑j≠isij ¼ 0:
A.5.1 A horizontally integrated incumbentThe horizontally integrated incumbent’s first-order conditions for profit-maximization, taking into account both retail
products i; k∈f1;2g, k≠i, and wholesale access, are
∂πI
∂f i¼ qi þ ðf i−ai−ciÞ
∂qi∂f i
þ ðf k−ak−ckÞ∂qk∂f i
þ ∂q′∂f i
ða−kÞ¼ qi−ðf i−ai−ciÞ∑
j≠isij þ ðf k−ak−ckÞsik−e′iYð ~a−kÞ ¼ 0:
For the following let X ¼ Xint and Γ ¼ Γint.
A.5.2 Horizontally separated access network providersOn the other hand, the horizontally separated access network provider i's (i¼ 1; 2) first-order condition is
∂ðπi þ πWiÞ∂f i
¼ qi þ ðf i−ai−ciÞ∂qi∂f i
þ ∂q′∂f i
ð ~ai−kiÞ ¼ qi−ðf i−ai−ciÞ∑j≠isij−e′iYð ~ai−kiÞ ¼ 0:
In this case let X ¼ Xsep and Γ ¼ Γsep
A.5.3 Determination of equilibrium pricesWith the corresponding definitions of X and Γ, stacking all n first-order conditions leads to:
q−Xðf− ~a−cÞ−Γð ~a−kÞ ¼ 0:
Solving for f leads to equilibrium fees
f n ¼ ðX þ YÞ−1½T þ YSþ Xð ~a þ cÞ−Γð ~a−kÞ�:
References
BEREC (2011). Regulatory accounting in practice 2011. BEREC Report BoR, 1134 October.Bourreau, M., Cambini, C., & Dogan, P. (2012). Access pricing, competition, and incentives to migrate from “old“ to “new“ technology. International Journal of
Industrial Organization, 30, 713–723.Briglauer, W., & Vogelsang, I. (2011). The need for a new approach to regulating fixed networks. Telecommunications Policy, 35(2), 102–114.Cullen International (2007). Cross country analysis—Cost accounting systems for fixed wholesale services. Available from: ⟨http://www.cullen-interna
tional.com/documents/cullen/⟩.DeGraba, P. (2003). A bottleneck input supplier’s opportunity cost of competing downstream. Journal of Regulatory Economics, 23, 287–297.Evans, L. T., & Guthrie, G. A. (2005). Risk price regulation, and irreversible investment. International Journal of Industrial Organization, 23, 109–128.Hoernig, S., Jay, S., Neu, W., Neumann, K.-H., Plückebaum, T., & Vogelsang, I. (2012). Wholesale pricing, NGA take-up and competition. Communications and
Strategies, 86(2), 153–174.Hoernig, S., Jay, S., Neu, W., Neumann, K. -H., Plückebaum, T., & Vogelsang, I. (2011). Wholesale pricing, NGA take-up and competition. Bad Honnef 2011.
Available from: www.wik.org.Hoernig, S., Jay, S., Neumann, K. -H., Peitz, M., Plückebaum, T., & Vogelsang, I. (2010). Architectures and competitive models in fiber networks. Bad Honnef
2010. Available from: www.wik.org and www.vodafone.com/eu.IRG—Independent Regulators Group (2000). Principles of implementation and best practice regarding FL-LRIC cost modelling. Available from: ⟨http://irgis.
icp.pt/site/en/areas_doc.asp?id=277⟩.Mandy, D. M., & Sharkey, W. W. (2003). Dynamic pricing and investment from static proxy models. Review of Network Economics, 2, 403–439.Nitsche, R.,Wiethaus, L. (2010). NGA: Access regulation, investment, and welfare —Model based comparative analysis. ESMT No. WP-110-02.Rosen, S. (1974). Hedonic prices and implicit markets: product differentiation in pure competition. Journal of Political Economy, 82, 34–55.Vogelsang, I. (2012). Incentive regulation, investments and technological change. In G. R. Faulhaber, G. Madden, & J. Petchey (Eds.), Regulation and the
performance of communication and information networks. Cheltenham, UK: Edward Elgar. Chapter 4.Von Ungern-Sternberg, T. (1991). Monopolistic competition in the pyramid. Journal of Industrial Economics, 39, 355–368.
Please cite this article as: Neumann, K.-H., & Vogelsang, I. How to price the unbundled local loop in the transition fromcopper to fiber access networks? Telecommunications Policy (2013), http://dx.doi.org/10.1016/j.telpol.2013.05.011i