Embed Size (px)
Citation preview
Growing Global
………………………………………………………………………………………………………………………………………………………………………………….. Innovation Quality
Corporate Presentation 2014
Scaling greater heights
Growing Global
………………………………………………………………………………………………………………………………………………………………………………….. Innovation Quality
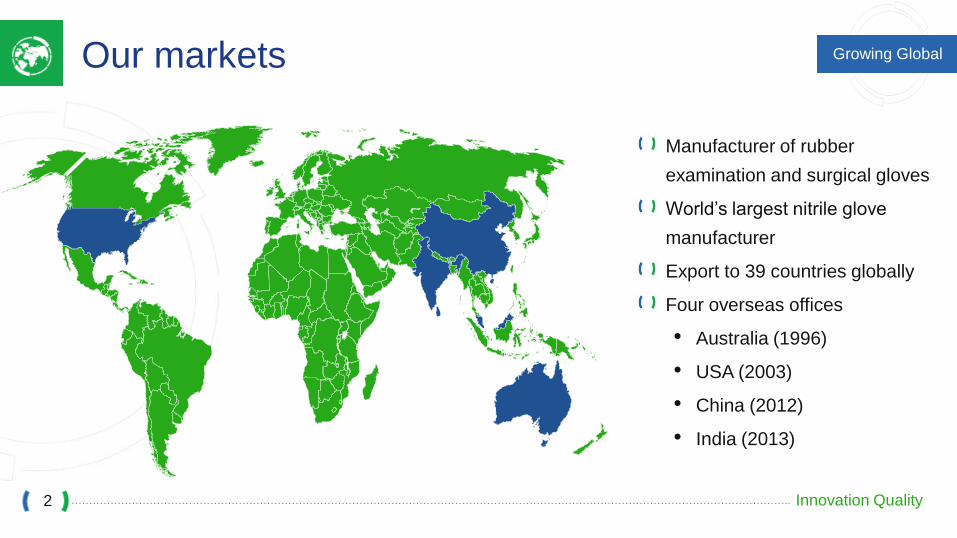
Our markets
Manufacturer of rubber
examination and surgical gloves
World’s largest nitrile glove
manufacturer
Export to 39 countries globally
Four overseas offices
• Australia (1996)
• USA (2003)
• China (2012)
• India (2013)
2
Growing Global
………………………………………………………………………………………………………………………………………………………………………………….. Innovation Quality
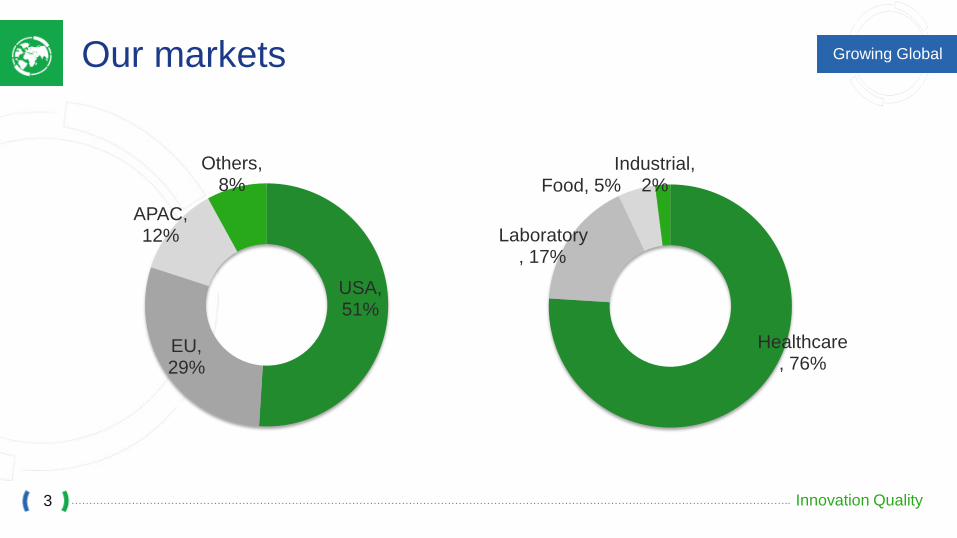
USA, 51%
EU, 29%
APAC, 12%
Others, 8%
Healthcare, 76%
Laboratory, 17%
Food, 5% Industrial,
2%
Our markets
3
Growing Global
………………………………………………………………………………………………………………………………………………………………………………….. Innovation Quality
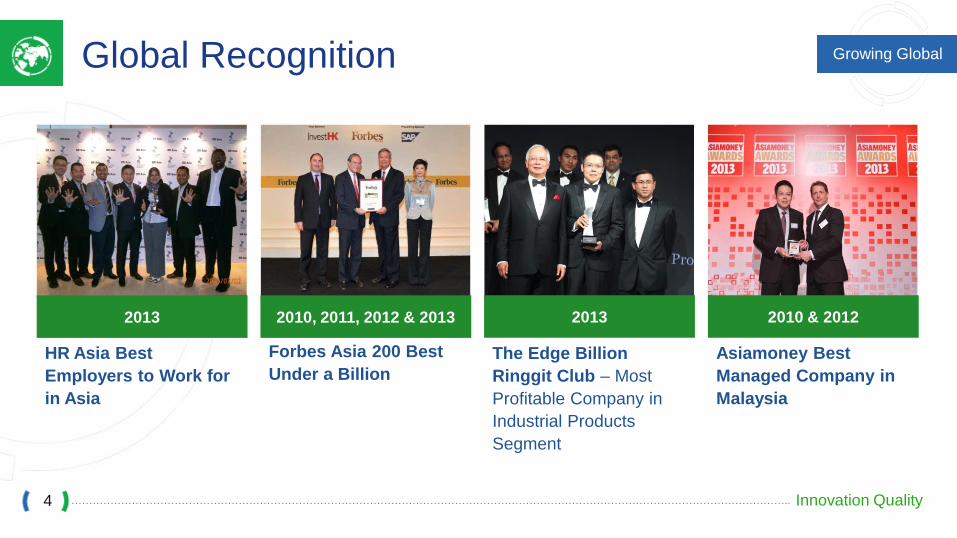
Global Recognition
2013 2010, 2011, 2012 & 2013 2013 2010 & 2012
HR Asia Best
Employers to Work for
in Asia
Forbes Asia 200 Best
Under a Billion
The Edge Billion
Ringgit Club – Most
Profitable Company in
Industrial Products
Segment
Asiamoney Best
Managed Company in
Malaysia
4
Growing Global
………………………………………………………………………………………………………………………………………………………………………………….. Innovation Quality
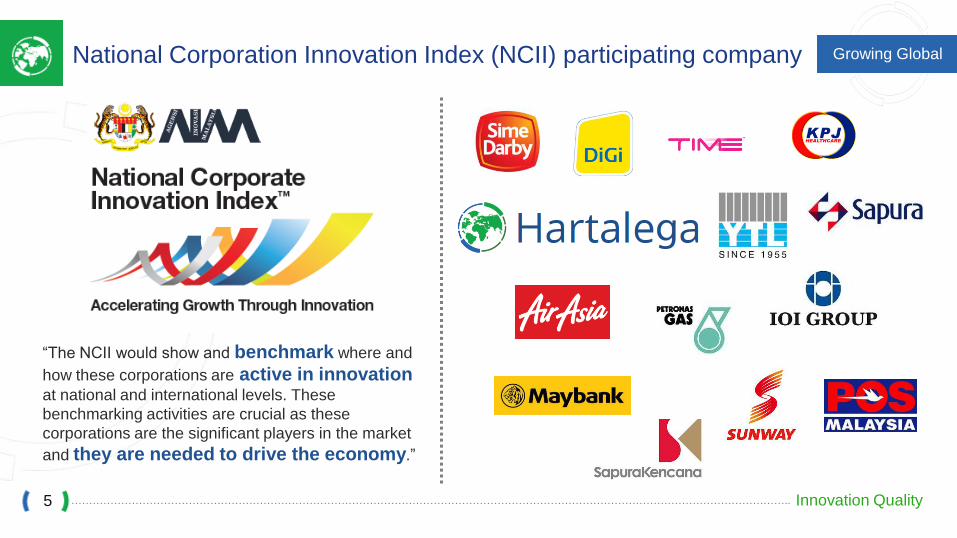
National Corporation Innovation Index (NCII) participating company
“The NCII would show and benchmark where and
how these corporations are active in innovation at national and international levels. These
benchmarking activities are crucial as these
corporations are the significant players in the market
and they are needed to drive the economy.”
5
Growing Global
………………………………………………………………………………………………………………………………………………………………………………….. Innovation Quality
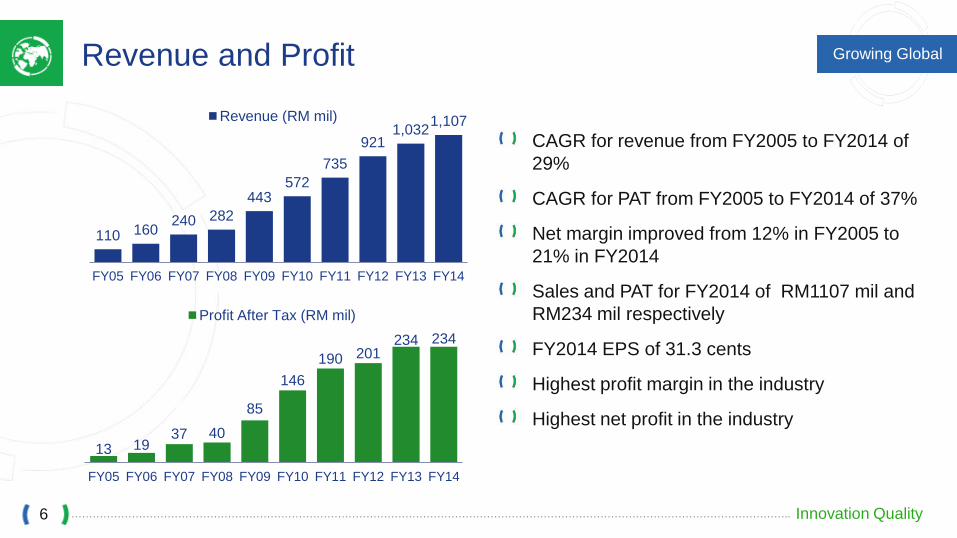
Revenue and Profit
110 160 240 282
443 572
735
921 1,032
1,107
FY05 FY06 FY07 FY08 FY09 FY10 FY11 FY12 FY13 FY14
Revenue (RM mil)
13 19 37 40
85
146
190 201 234 234
FY05 FY06 FY07 FY08 FY09 FY10 FY11 FY12 FY13 FY14
Profit After Tax (RM mil)
6
CAGR for revenue from FY2005 to FY2014 of
29%
CAGR for PAT from FY2005 to FY2014 of 37%
Net margin improved from 12% in FY2005 to
21% in FY2014
Sales and PAT for FY2014 of RM1107 mil and
RM234 mil respectively
FY2014 EPS of 31.3 cents
Highest profit margin in the industry
Highest net profit in the industry
Growing Global
………………………………………………………………………………………………………………………………………………………………………………….. Innovation Quality
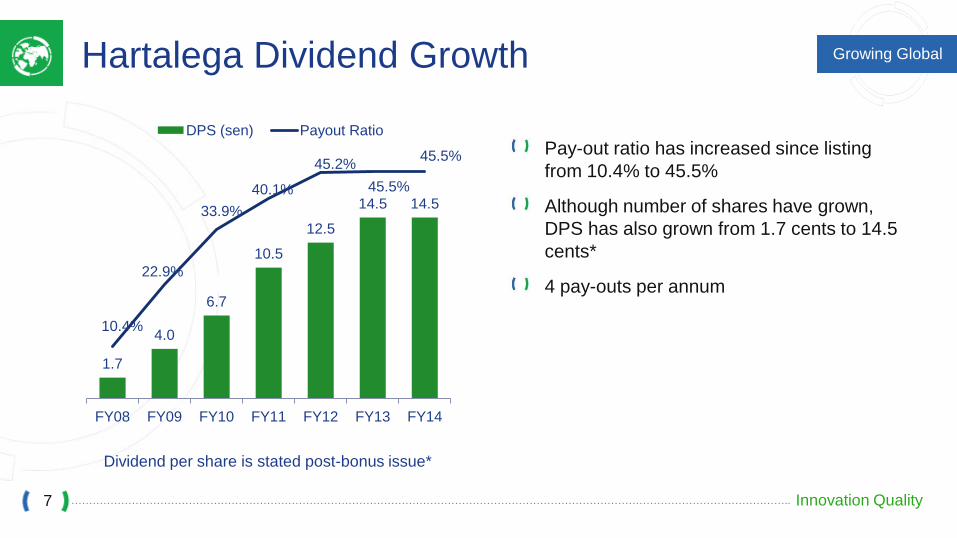
Hartalega Dividend Growth
Dividend per share is stated post-bonus issue*
1.7
4.0
6.7
10.5
12.5
14.5 14.5
10.4%
22.9%
33.9%
40.1%
45.2%
45.5%
45.5%
FY08 FY09 FY10 FY11 FY12 FY13 FY14
DPS (sen) Payout Ratio
7
Pay-out ratio has increased since listing
from 10.4% to 45.5%
Although number of shares have grown,
DPS has also grown from 1.7 cents to 14.5
cents*
4 pay-outs per annum
Growing Global
………………………………………………………………………………………………………………………………………………………………………………….. Innovation Quality
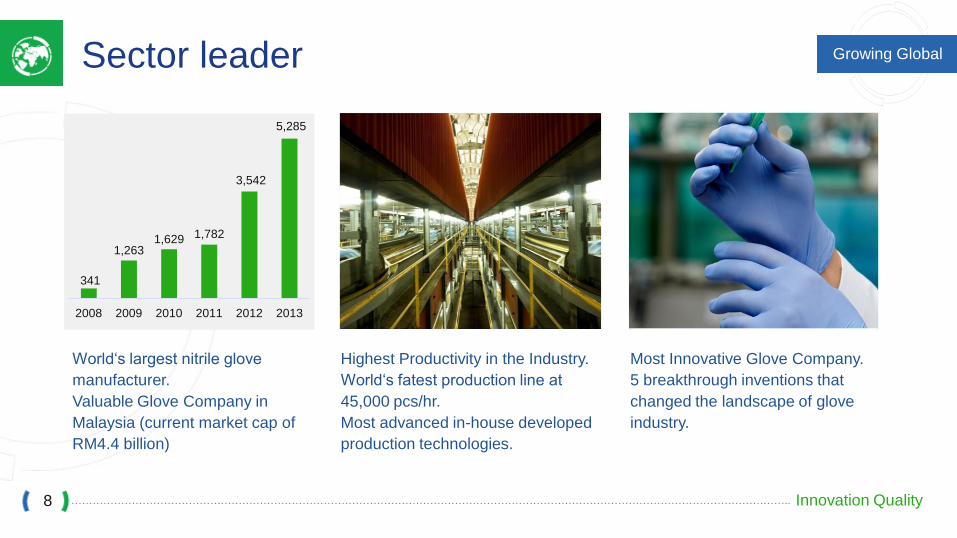
Sector leader
World‘s largest nitrile glove
manufacturer.
Valuable Glove Company in
Malaysia (current market cap of
RM4.4 billion)
Highest Productivity in the Industry.
World‘s fatest production line at
45,000 pcs/hr.
Most advanced in-house developed
production technologies.
Most Innovative Glove Company.
5 breakthrough inventions that
changed the landscape of glove
industry.
341
1,263 1,629 1,782
3,542
5,285
2008 2009 2010 2011 2012 2013
8
Growing Global
………………………………………………………………………………………………………………………………………………………………………………….. Innovation Quality
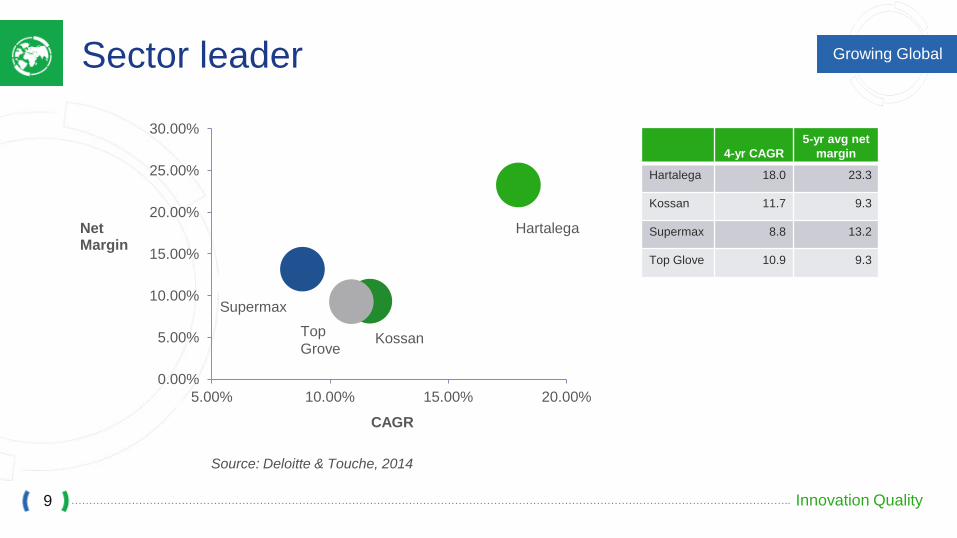
0.00%
5.00%
10.00%
15.00%
20.00%
25.00%
30.00%
5.00% 10.00% 15.00% 20.00%
Net Margin
CAGR
Kossan Top
Grove
Supermax
Hartalega
4-yr CAGR
5-yr avg net
margin
Hartalega 18.0 23.3
Kossan 11.7 9.3
Supermax 8.8 13.2
Top Glove 10.9 9.3
Sector leader
Source: Deloitte & Touche, 2014
9
Growing Global
………………………………………………………………………………………………………………………………………………………………………………….. Innovation Quality
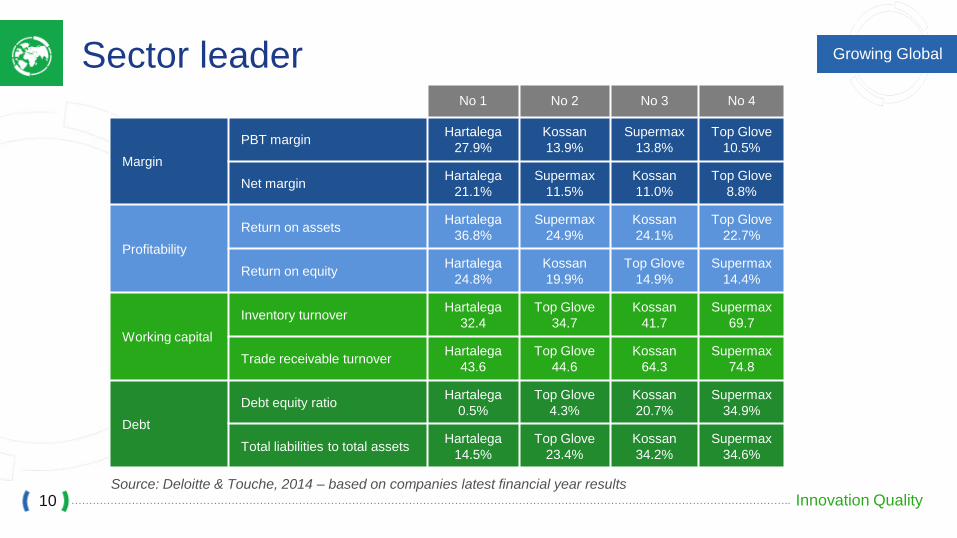
Sector leader
10
No 1 No 2 No 3 No 4
Margin
PBT margin Hartalega
27.9%
Kossan
13.9%
Supermax
13.8%
Top Glove
10.5%
Net margin Hartalega
21.1%
Supermax
11.5%
Kossan
11.0%
Top Glove
8.8%
Profitability
Return on assets Hartalega
36.8%
Supermax
24.9%
Kossan
24.1%
Top Glove
22.7%
Return on equity Hartalega
24.8%
Kossan
19.9%
Top Glove
14.9%
Supermax
14.4%
Working capital
Inventory turnover Hartalega
32.4
Top Glove
34.7
Kossan
41.7
Supermax
69.7
Trade receivable turnover Hartalega
43.6
Top Glove
44.6
Kossan
64.3
Supermax
74.8
Debt
Debt equity ratio Hartalega
0.5%
Top Glove
4.3%
Kossan
20.7%
Supermax
34.9%
Total liabilities to total assets Hartalega
14.5%
Top Glove
23.4%
Kossan
34.2%
Supermax
34.6%
Source: Deloitte & Touche, 2014 – based on companies latest financial year results
Growing Global
………………………………………………………………………………………………………………………………………………………………………………….. Innovation Quality
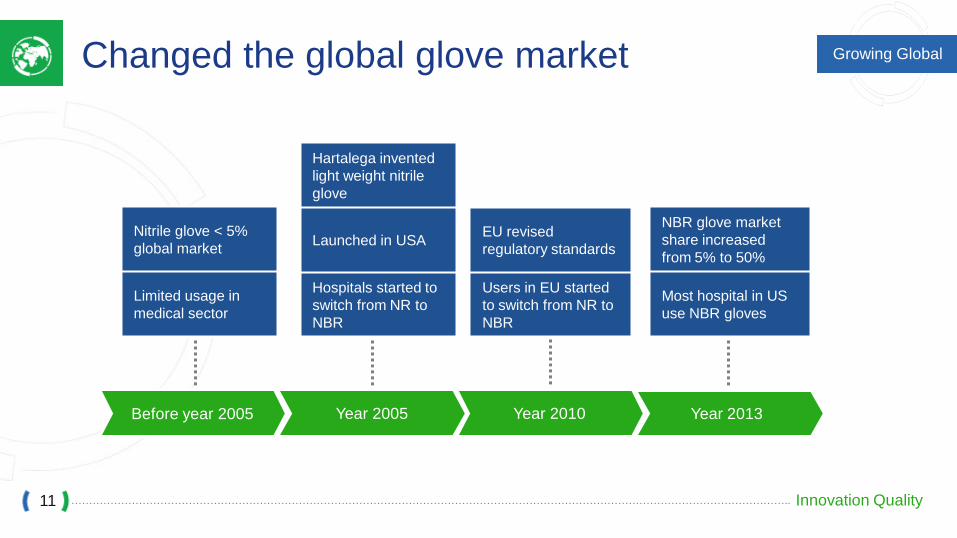
Changed the global glove market
Year 2005
11
Before year 2005 Year 2010 Year 2013
Nitrile glove < 5%
global market
Limited usage in
medical sector
Hartalega invented
light weight nitrile
glove
Launched in USA
Hospitals started to
switch from NR to
NBR
EU revised
regulatory standards
Users in EU started
to switch from NR to
NBR
NBR glove market
share increased
from 5% to 50%
Most hospital in US
use NBR gloves
Growing Global
………………………………………………………………………………………………………………………………………………………………………………….. Innovation Quality
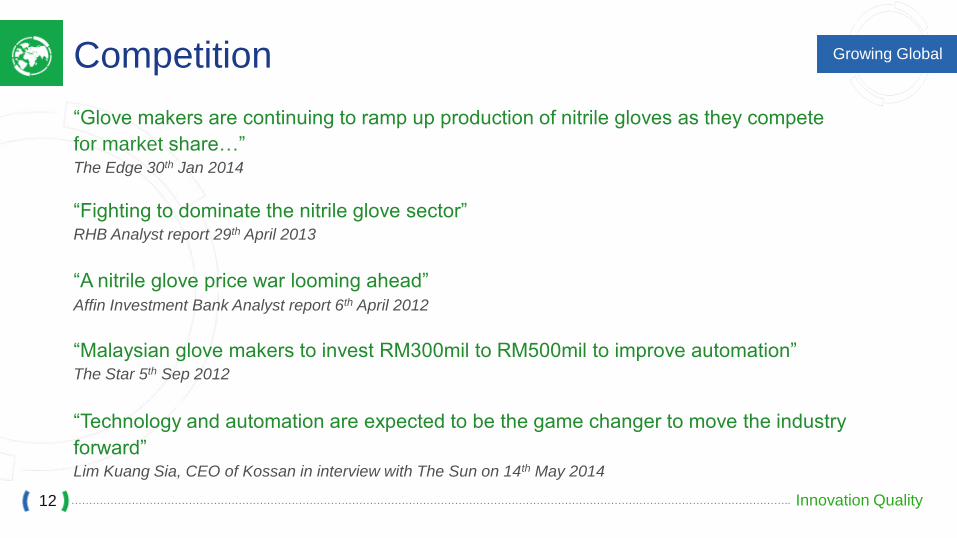
Competition
12
“Glove makers are continuing to ramp up production of nitrile gloves as they compete
for market share…” The Edge 30th Jan 2014
“Fighting to dominate the nitrile glove sector” RHB Analyst report 29th April 2013
“A nitrile glove price war looming ahead” Affin Investment Bank Analyst report 6th April 2012
“Malaysian glove makers to invest RM300mil to RM500mil to improve automation”
The Star 5th Sep 2012
“Technology and automation are expected to be the game changer to move the industry
forward” Lim Kuang Sia, CEO of Kossan in interview with The Sun on 14th May 2014
Growing Global
………………………………………………………………………………………………………………………………………………………………………………….. Innovation Quality
OUR STRATEGY
13
Growing Global
………………………………………………………………………………………………………………………………………………………………………………….. Innovation Quality
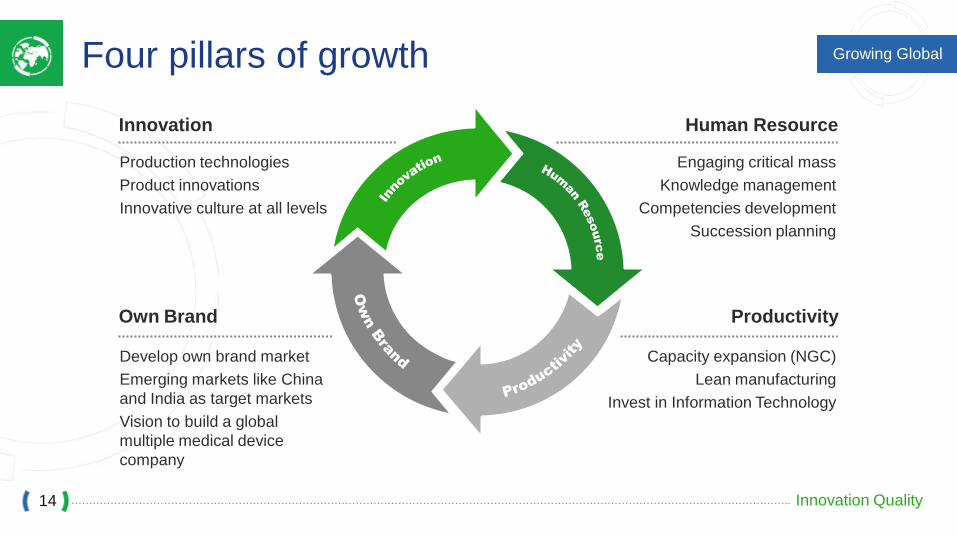
Four pillars of growth
14
Engaging critical mass
Knowledge management
Competencies development
Succession planning
Capacity expansion (NGC)
Lean manufacturing
Invest in Information Technology
Production technologies
Product innovations
Innovative culture at all levels
Develop own brand market
Emerging markets like China
and India as target markets
Vision to build a global
multiple medical device
company
Innovation
Own Brand
Human Resource
Productivity
Growing Global
………………………………………………………………………………………………………………………………………………………………………………….. Innovation Quality
Innovation – Working on 5 new major innovations
15
Blank To Protect Proprietary Value
Growing Global
………………………………………………………………………………………………………………………………………………………………………………….. Innovation Quality
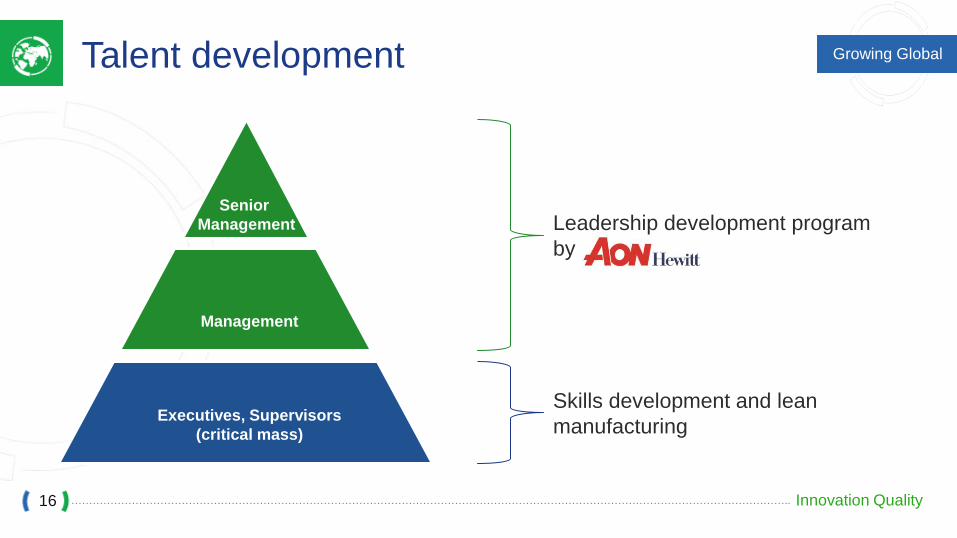
Talent development
16
Senior
Management
Management
Executives, Supervisors
(critical mass)
Leadership development program
by
Skills development and lean
manufacturing
Growing Global
………………………………………………………………………………………………………………………………………………………………………………….. Innovation Quality
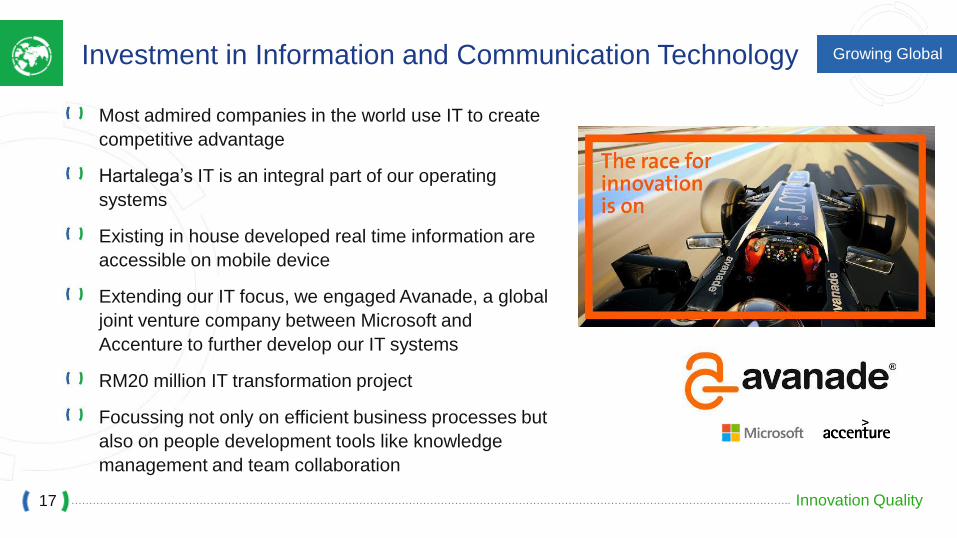
Investment in Information and Communication Technology
Most admired companies in the world use IT to create
competitive advantage
Hartalega’s IT is an integral part of our operating
systems
Existing in house developed real time information are
accessible on mobile device
Extending our IT focus, we engaged Avanade, a global
joint venture company between Microsoft and
Accenture to further develop our IT systems
RM20 million IT transformation project
Focussing not only on efficient business processes but
also on people development tools like knowledge
management and team collaboration
17
Growing Global
………………………………………………………………………………………………………………………………………………………………………………….. Innovation Quality
Our Own Brand
18
Blank To Protect Proprietary Value
Growing Global
………………………………………………………………………………………………………………………………………………………………………………….. Innovation Quality
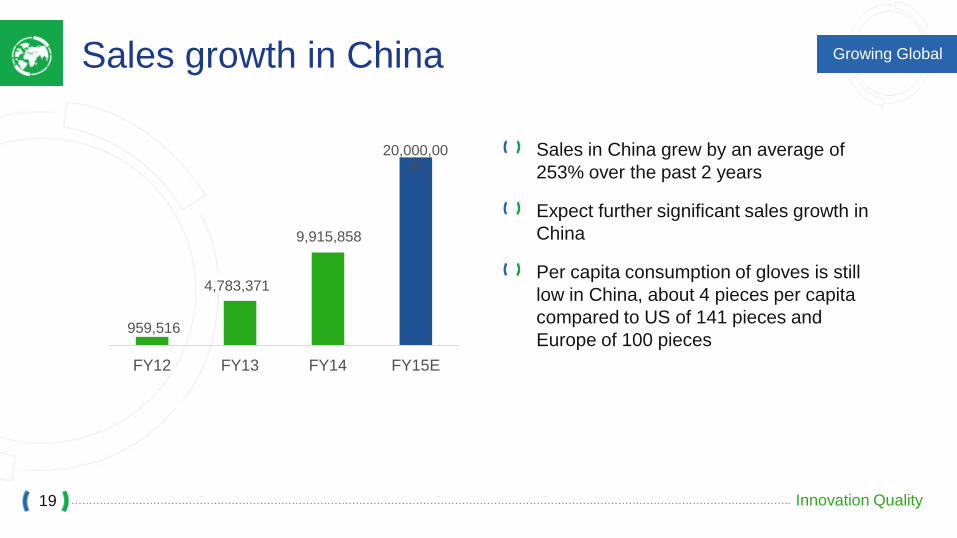
Sales growth in China
Sales in China grew by an average of
253% over the past 2 years
Expect further significant sales growth in
China
Per capita consumption of gloves is still
low in China, about 4 pieces per capita
compared to US of 141 pieces and
Europe of 100 pieces
19
959,516
4,783,371
9,915,858
20,000,00
0
FY12 FY13 FY14 FY15E
Growing Global
………………………………………………………………………………………………………………………………………………………………………………….. Innovation Quality
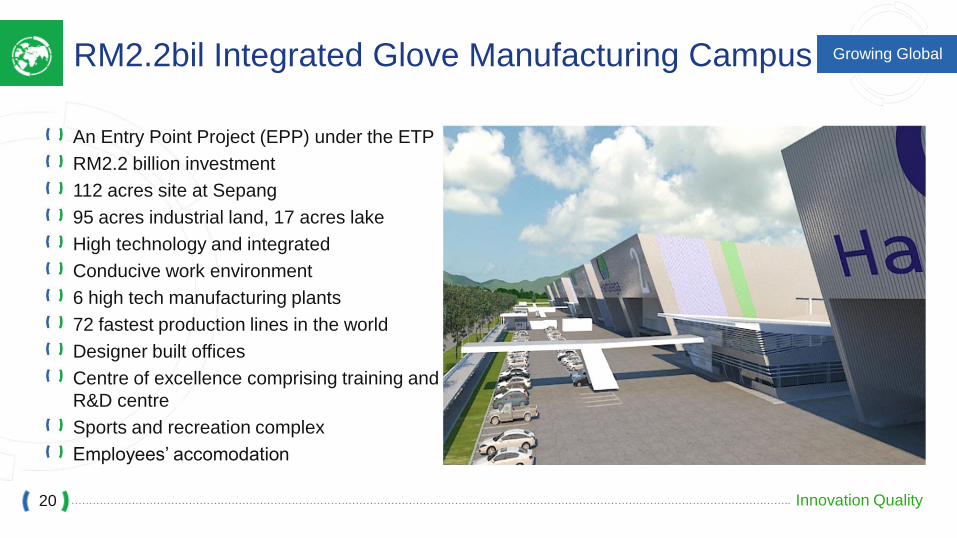
RM2.2bil Integrated Glove Manufacturing Campus
An Entry Point Project (EPP) under the ETP
RM2.2 billion investment
112 acres site at Sepang
95 acres industrial land, 17 acres lake
High technology and integrated
Conducive work environment
6 high tech manufacturing plants
72 fastest production lines in the world
Designer built offices
Centre of excellence comprising training and
R&D centre
Sports and recreation complex
Employees’ accomodation
20
Growing Global
………………………………………………………………………………………………………………………………………………………………………………….. Innovation Quality
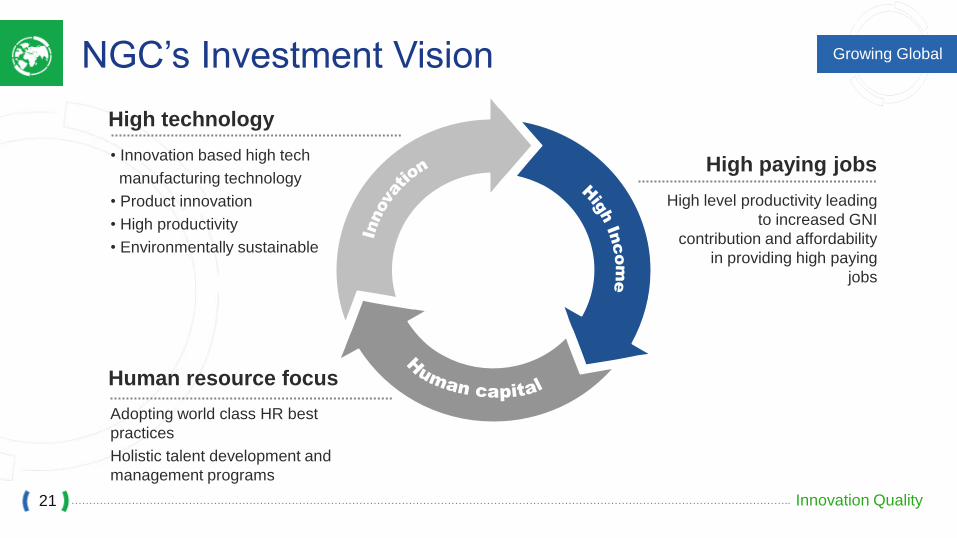
• Innovation based high tech
manufacturing technology
• Product innovation
• High productivity
• Environmentally sustainable
High level productivity leading
to increased GNI
contribution and affordability
in providing high paying
jobs
High paying jobs
Human resource focus
High technology
Adopting world class HR best
practices
Holistic talent development and
management programs
NGC’s Investment Vision
21
Growing Global
………………………………………………………………………………………………………………………………………………………………………………….. Innovation Quality
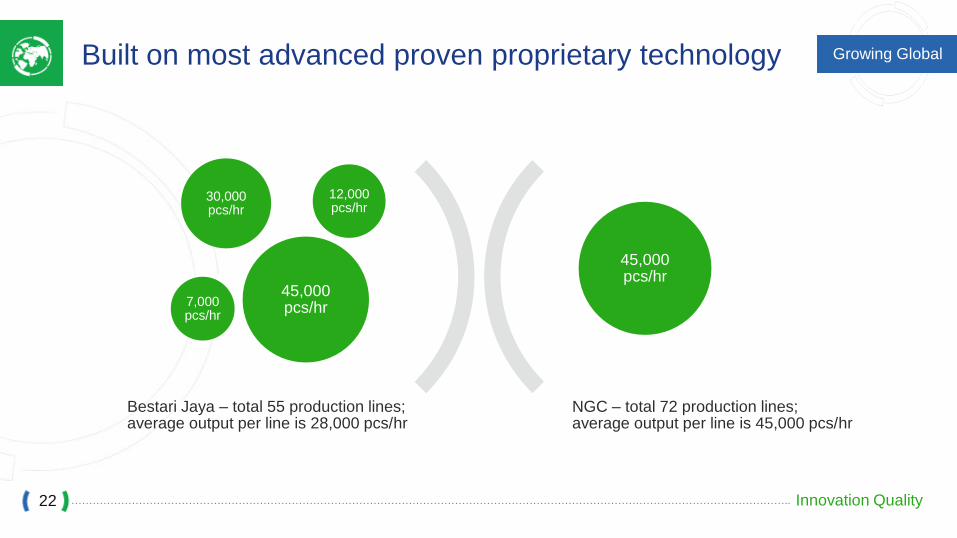
Built on most advanced proven proprietary technology
NGC – total 72 production lines; average output per line is 45,000 pcs/hr
45,000 pcs/hr
7,000 pcs/hr
12,000 pcs/hr
30,000 pcs/hr
45,000 pcs/hr
Bestari Jaya – total 55 production lines; average output per line is 28,000 pcs/hr
22
Growing Global
………………………………………………………………………………………………………………………………………………………………………………….. Innovation Quality
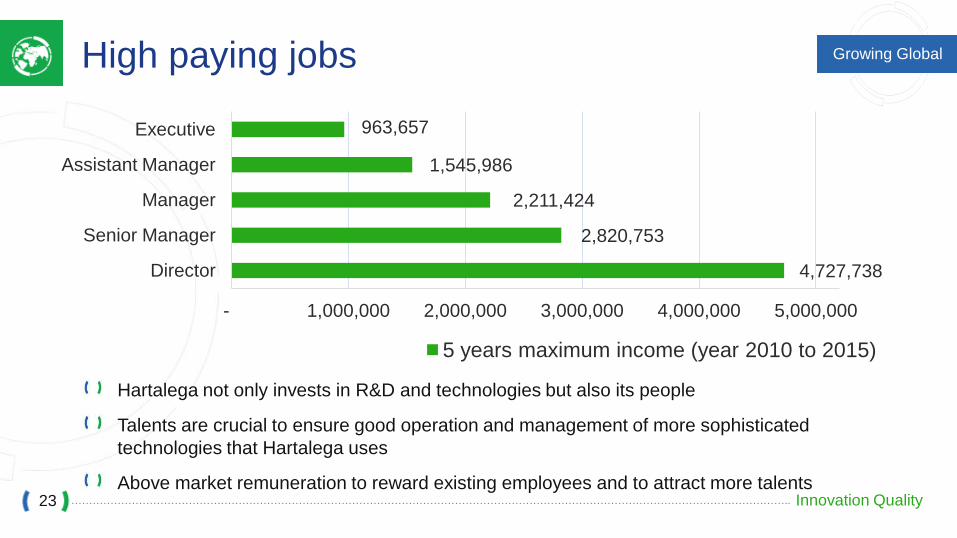
High paying jobs
Hartalega not only invests in R&D and technologies but also its people
Talents are crucial to ensure good operation and management of more sophisticated
technologies that Hartalega uses
Above market remuneration to reward existing employees and to attract more talents
4,727,738
2,820,753
2,211,424
1,545,986
963,657
- 1,000,000 2,000,000 3,000,000 4,000,000 5,000,000
Director
Senior Manager
Manager
Assistant Manager
Executive
5 years maximum income (year 2010 to 2015)
23
Growing Global
………………………………………………………………………………………………………………………………………………………………………………….. Innovation Quality
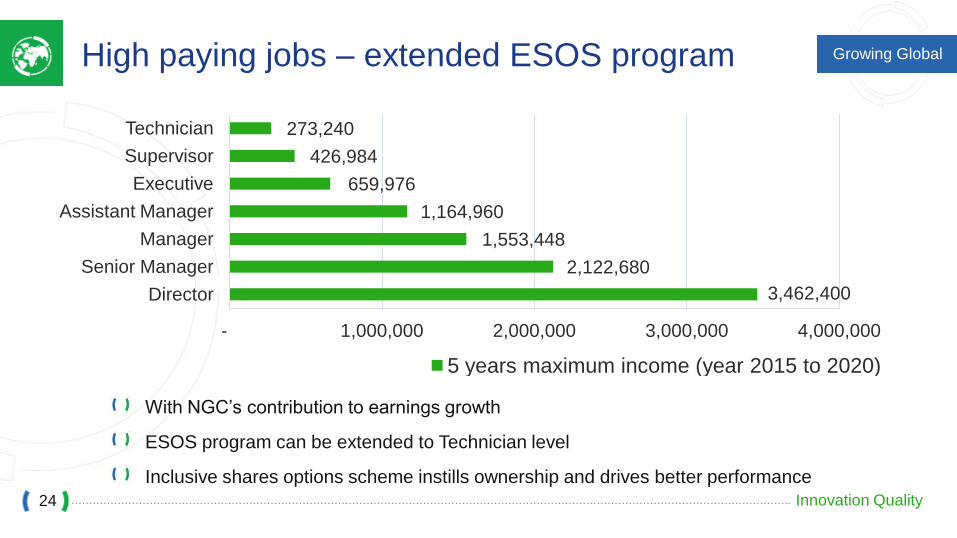
High paying jobs – extended ESOS program
With NGC’s contribution to earnings growth
ESOS program can be extended to Technician level
Inclusive shares options scheme instills ownership and drives better performance
3,462,400
2,122,680
1,553,448
1,164,960
659,976
426,984
273,240
- 1,000,000 2,000,000 3,000,000 4,000,000
Director
Senior Manager
Manager
Assistant Manager
Executive
Supervisor
Technician
5 years maximum income (year 2015 to 2020)
24
Growing Global
………………………………………………………………………………………………………………………………………………………………………………….. Innovation Quality
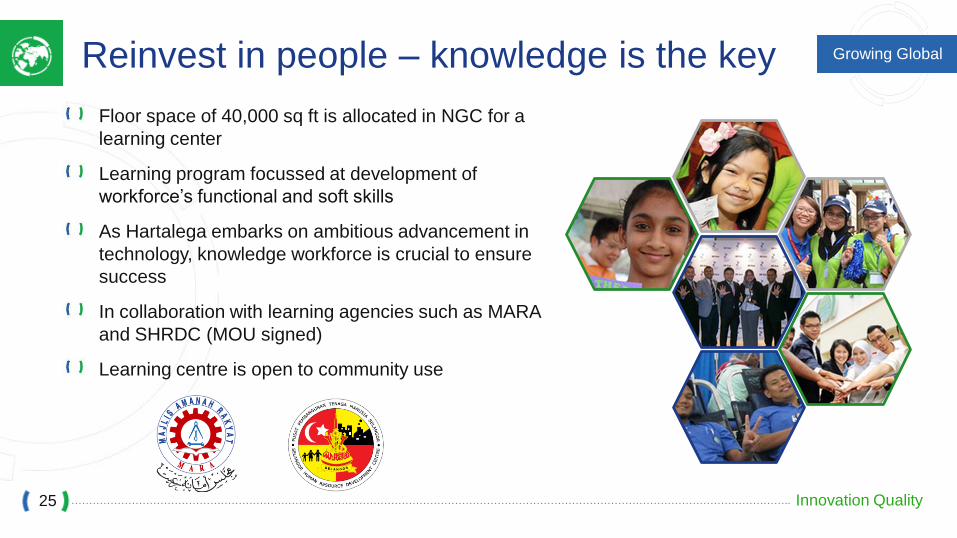
Reinvest in people – knowledge is the key
Floor space of 40,000 sq ft is allocated in NGC for a
learning center
Learning program focussed at development of
workforce’s functional and soft skills
As Hartalega embarks on ambitious advancement in
technology, knowledge workforce is crucial to ensure
success
In collaboration with learning agencies such as MARA
and SHRDC (MOU signed)
Learning centre is open to community use
25
Growing Global
………………………………………………………………………………………………………………………………………………………………………………….. Innovation Quality
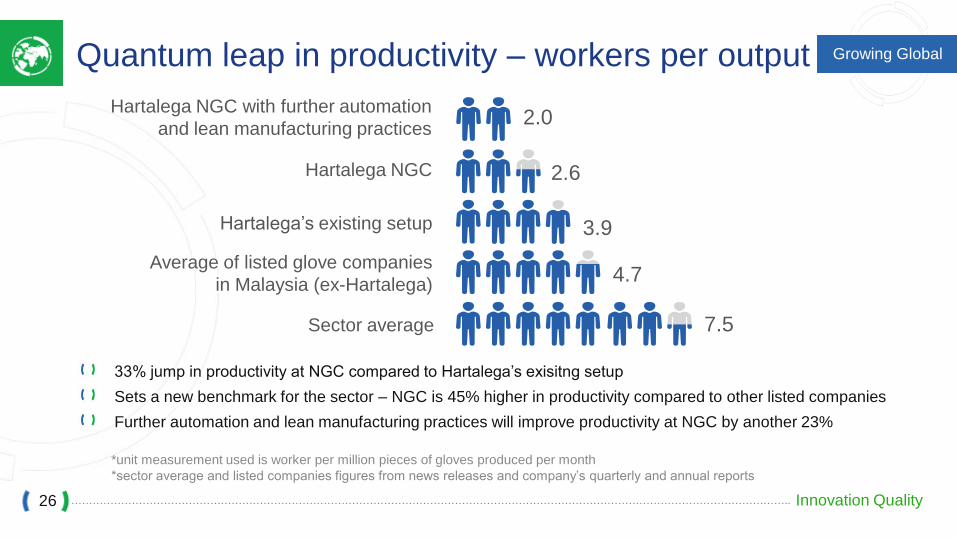
Quantum leap in productivity – workers per output
26
*unit measurement used is worker per million pieces of gloves produced per month
*sector average and listed companies figures from news releases and company’s quarterly and annual reports
33% jump in productivity at NGC compared to Hartalega’s exisitng setup
Sets a new benchmark for the sector – NGC is 45% higher in productivity compared to other listed companies
Further automation and lean manufacturing practices will improve productivity at NGC by another 23%
Hartalega NGC
Sector average
Average of listed glove companies
in Malaysia (ex-Hartalega)
Hartalega’s existing setup
7.5
4.7
3.9
2.6
Hartalega NGC with further automation
and lean manufacturing practices 2.0
Growing Global
………………………………………………………………………………………………………………………………………………………………………………….. Innovation Quality
Intensified
competition
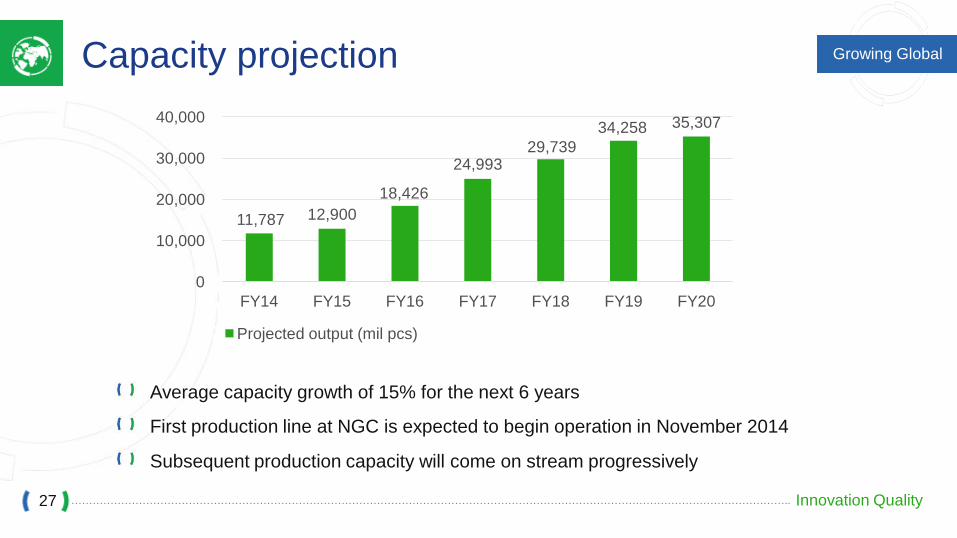
Capacity projection
Average capacity growth of 15% for the next 6 years
First production line at NGC is expected to begin operation in November 2014
Subsequent production capacity will come on stream progressively
27
11,787 12,900
18,426
24,993 29,739
34,258 35,307
0
10,000
20,000
30,000
40,000
FY14 FY15 FY16 FY17 FY18 FY19 FY20
Projected output (mil pcs)
Growing Global
………………………………………………………………………………………………………………………………………………………………………………….. Innovation Quality
MARKET OUTLOOK
28
Growing Global
………………………………………………………………………………………………………………………………………………………………………………….. Innovation Quality
Intensified
competition
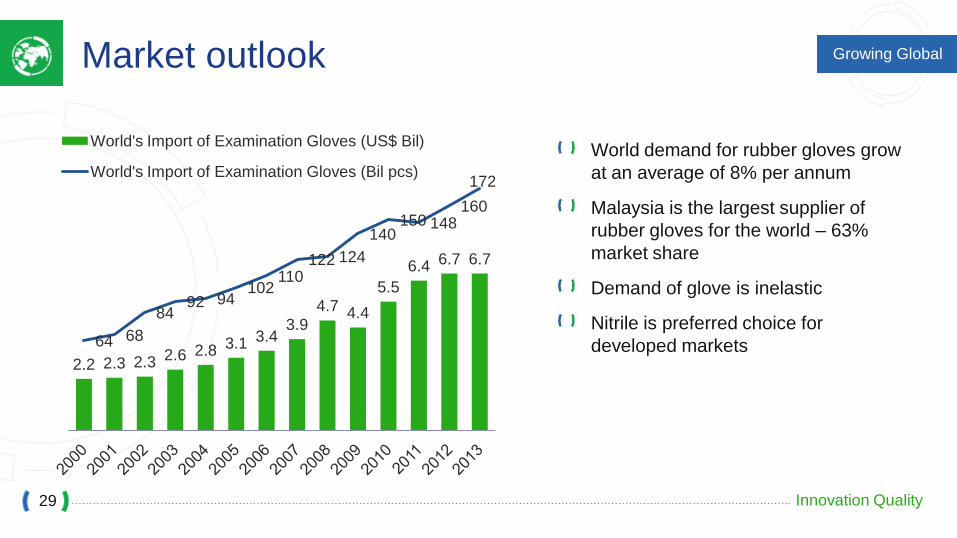
Market outlook
World demand for rubber gloves grow
at an average of 8% per annum
Malaysia is the largest supplier of
rubber gloves for the world – 63%
market share
Demand of glove is inelastic
Nitrile is preferred choice for
developed markets
29
2.2 2.3 2.3 2.6 2.8 3.1 3.4 3.9
4.7 4.4
5.5
6.4 6.7 6.7
64 68
84 92 94
102 110
122 124
140 150 148
160
172
World's Import of Examination Gloves (US$ Bil)
World's Import of Examination Gloves (Bil pcs)
Growing Global
………………………………………………………………………………………………………………………………………………………………………………….. Innovation Quality
Intensified
competition
Market outlook
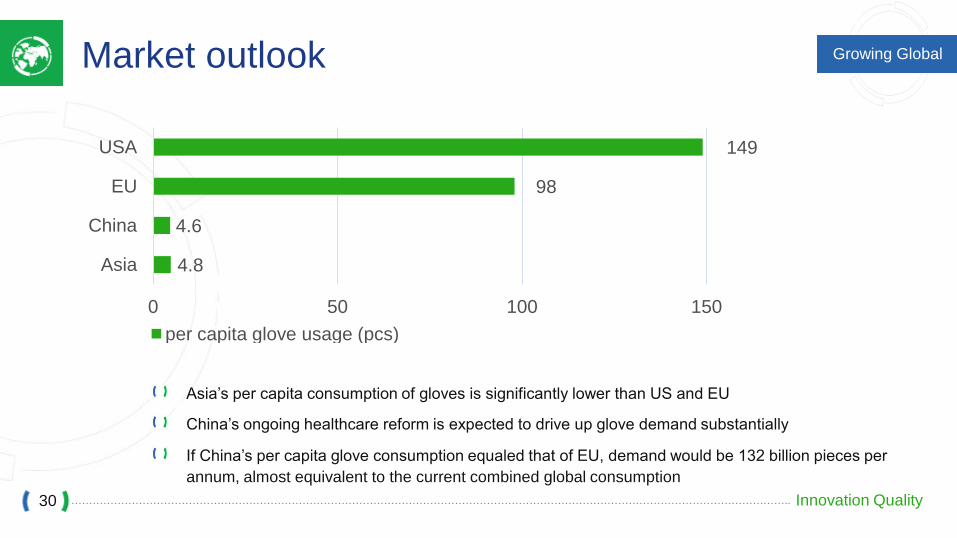
Asia’s per capita consumption of gloves is significantly lower than US and EU
China’s ongoing healthcare reform is expected to drive up glove demand substantially
If China’s per capita glove consumption equaled that of EU, demand would be 132 billion pieces per
annum, almost equivalent to the current combined global consumption
30
4.8
4.6
98
149
0 50 100 150
Asia
China
EU
USA
per capita glove usage (pcs)
Growing Global
………………………………………………………………………………………………………………………………………………………………………………….. Innovation Quality
Intensified
competition
Market outlook
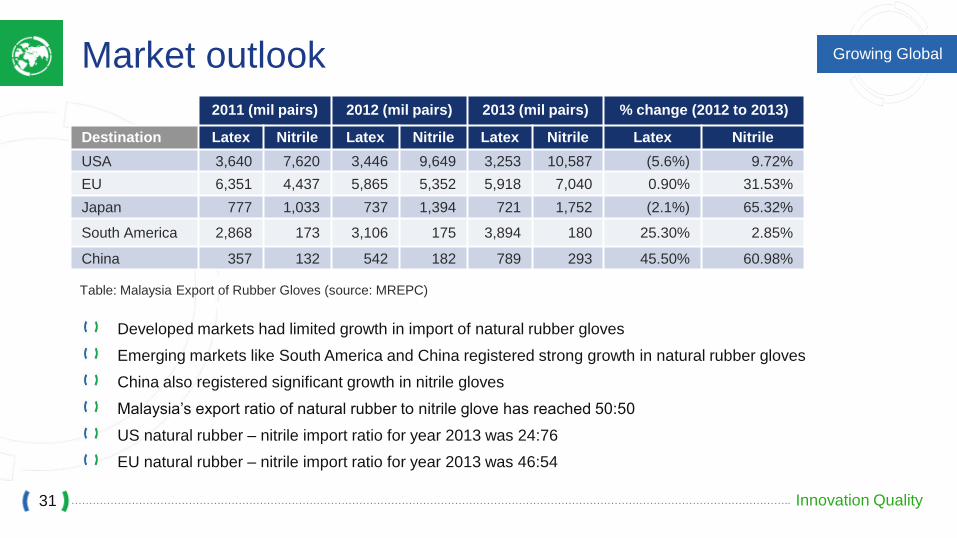
Developed markets had limited growth in import of natural rubber gloves
Emerging markets like South America and China registered strong growth in natural rubber gloves
China also registered significant growth in nitrile gloves
Malaysia’s export ratio of natural rubber to nitrile glove has reached 50:50
US natural rubber – nitrile import ratio for year 2013 was 24:76
EU natural rubber – nitrile import ratio for year 2013 was 46:54
31
2011 (mil pairs) 2012 (mil pairs) 2013 (mil pairs) % change (2012 to 2013)
Destination Latex Nitrile Latex Nitrile Latex Nitrile Latex Nitrile
USA 3,640 7,620 3,446 9,649 3,253 10,587 (5.6%) 9.72%
EU 6,351 4,437 5,865 5,352 5,918 7,040 0.90% 31.53%
Japan 777 1,033 737 1,394 721 1,752 (2.1%) 65.32%
South America 2,868 173 3,106 175 3,894 180 25.30% 2.85%
China 357 132 542 182 789 293 45.50% 60.98%
Table: Malaysia Export of Rubber Gloves (source: MREPC)
Growing Global
………………………………………………………………………………………………………………………………………………………………………………….. Innovation Quality
Market outlook
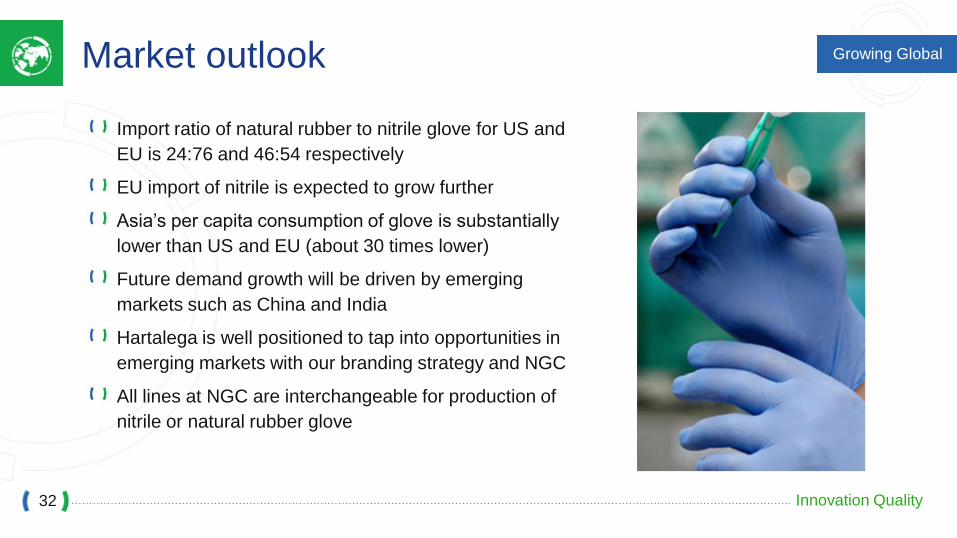
Import ratio of natural rubber to nitrile glove for US and
EU is 24:76 and 46:54 respectively
EU import of nitrile is expected to grow further
Asia’s per capita consumption of glove is substantially
lower than US and EU (about 30 times lower)
Future demand growth will be driven by emerging
markets such as China and India
Hartalega is well positioned to tap into opportunities in
emerging markets with our branding strategy and NGC
All lines at NGC are interchangeable for production of
nitrile or natural rubber glove
32