Embed Size (px)
Citation preview
Cotton Economic Outlook
National Cotton Council
Mid-Year Board Meeting
July 9-12, 2006
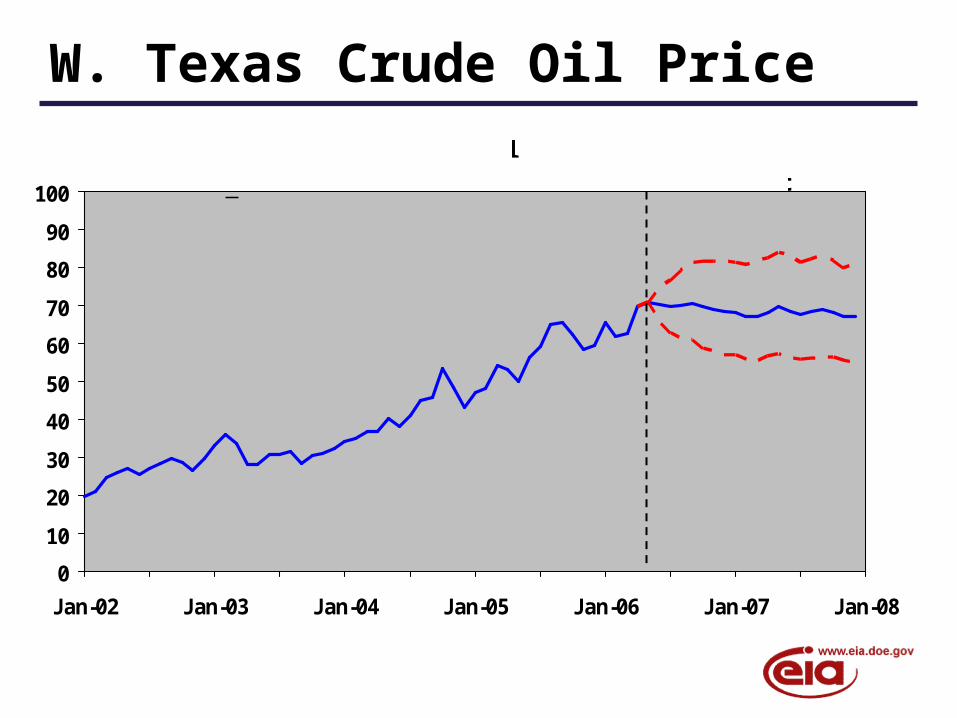
0
10
20
30
40
50
60
70
80
90
100
Jan-02 Jan-03 Jan-04 Jan-05 Jan-06 Jan-07 Jan-08
$/Barrel
Forecast
W. Texas Crude Oil Price
Global Economy
Solid performance in the first half of 2006
Weakening expected in the second half High energy prices, rising interest rates, cooling
housing market
UN currently estimating ’06 growth at 3.6% Similar to last year’s level
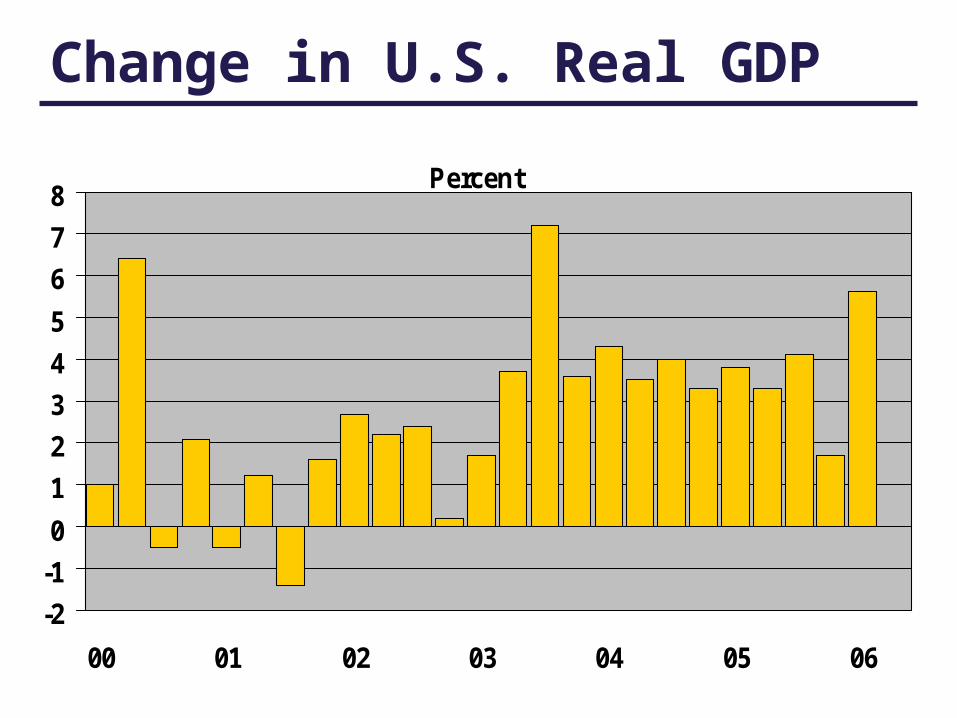
Change in U.S. Real GDP
Percent
-2
-1
0
1
2
3
4
5
6
7
8
00 01 02 03 04 05 06
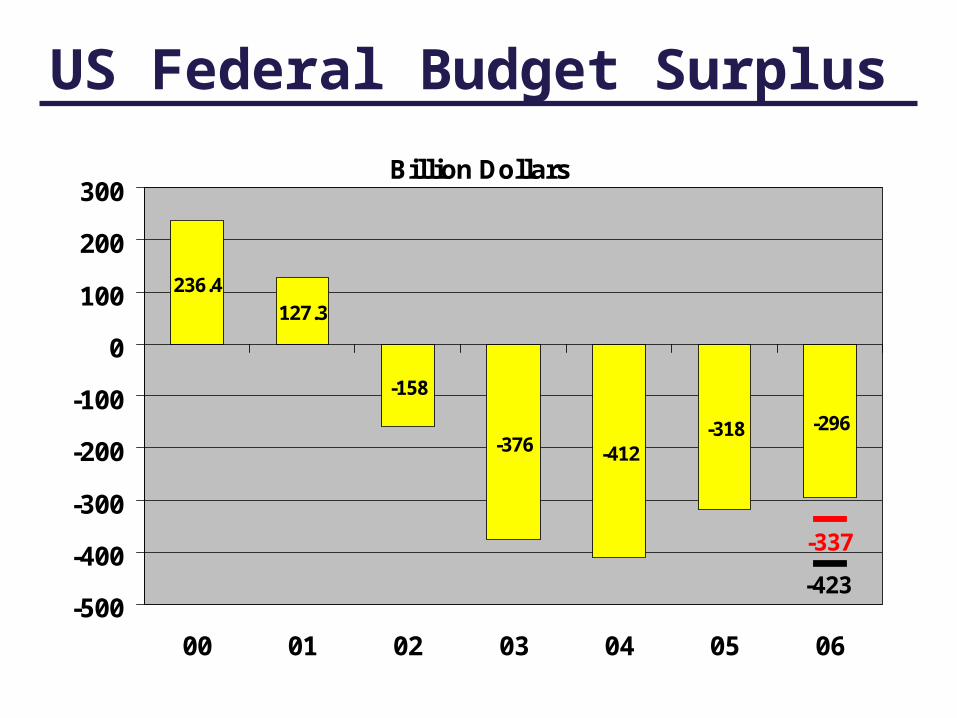
Billion Dollars
236.4
127.3
-158
-376 -412-318 -296
-337
-423-500
-400
-300
-200
-100
0
100
200
300
00 01 02 03 04 05 06
US Federal Budget Surplus
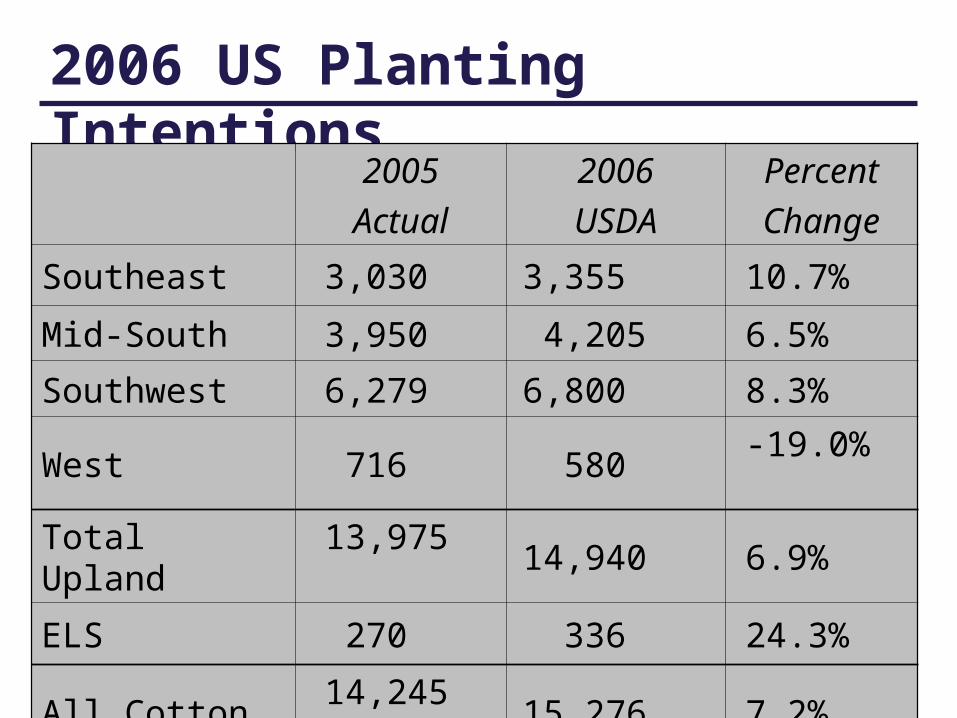
2006 US Planting Intentions
2005
Actual
2006
USDA
Percent
Change
Southeast 3,030 3,355 10.7%
Mid-South 3,950 4,205 6.5%
Southwest 6,279 6,800 8.3%
West 716 580 -19.0%
Total Upland 13,975 14,940 6.9%
ELS 270 336 24.3%
All Cotton 14,245 15,276 7.2%
50
55
60
65
70
75
80
85
Jun
-07
Jun
-14
Jun
-21
Jun
-28
Jul-
06
Jul-
12
Jul-
19
Jul-
26
Au
g-0
2
Au
g-0
9
Au
g-1
6
Au
g-2
3
Au
g-3
0
Sep
-06
Sep
-13
Sep
-20
Sep
-27
Oct
-04
Oct
-11
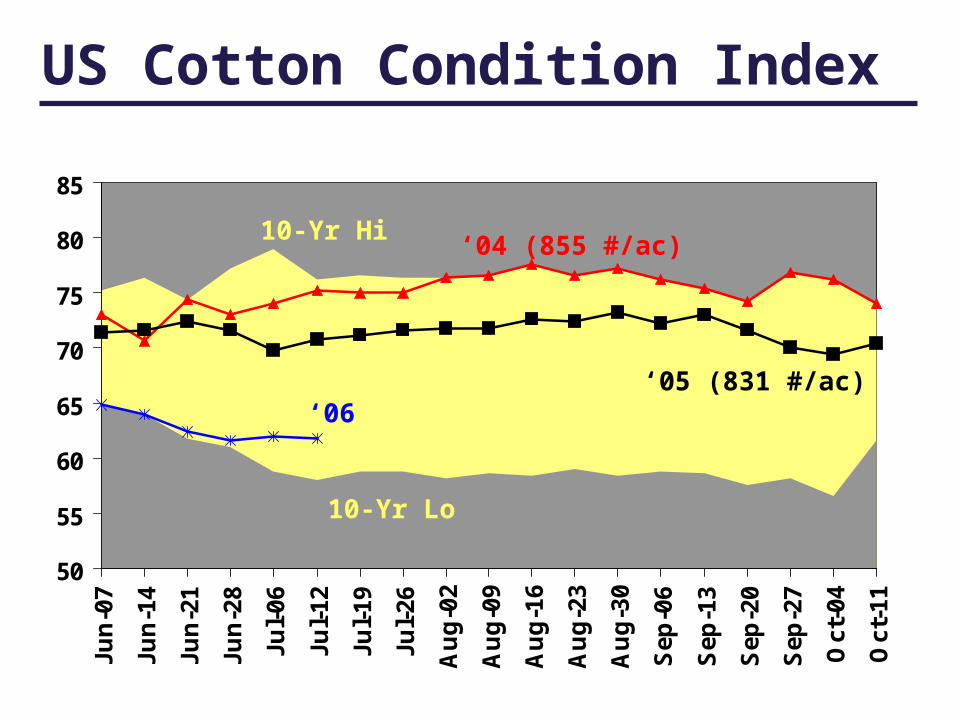
US Cotton Condition Index
10-Yr Hi
10-Yr Lo
‘04 (855 #/ac)
‘05 (831 #/ac)‘06
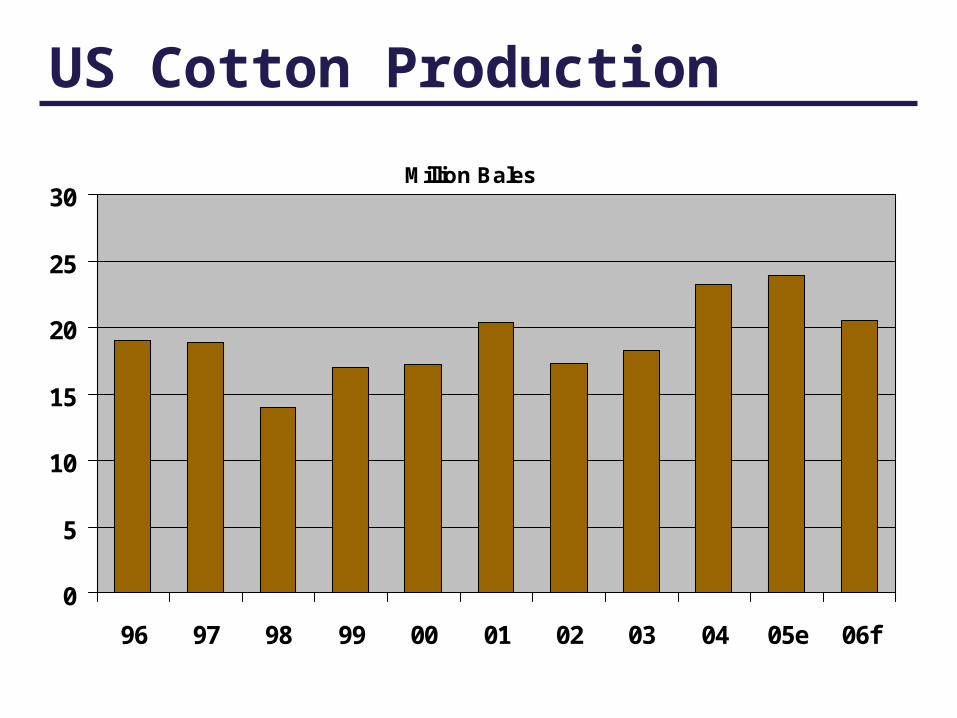
US Cotton Production
Million Bales
0
5
10
15
20
25
30
96 97 98 99 00 01 02 03 04 05e 06f
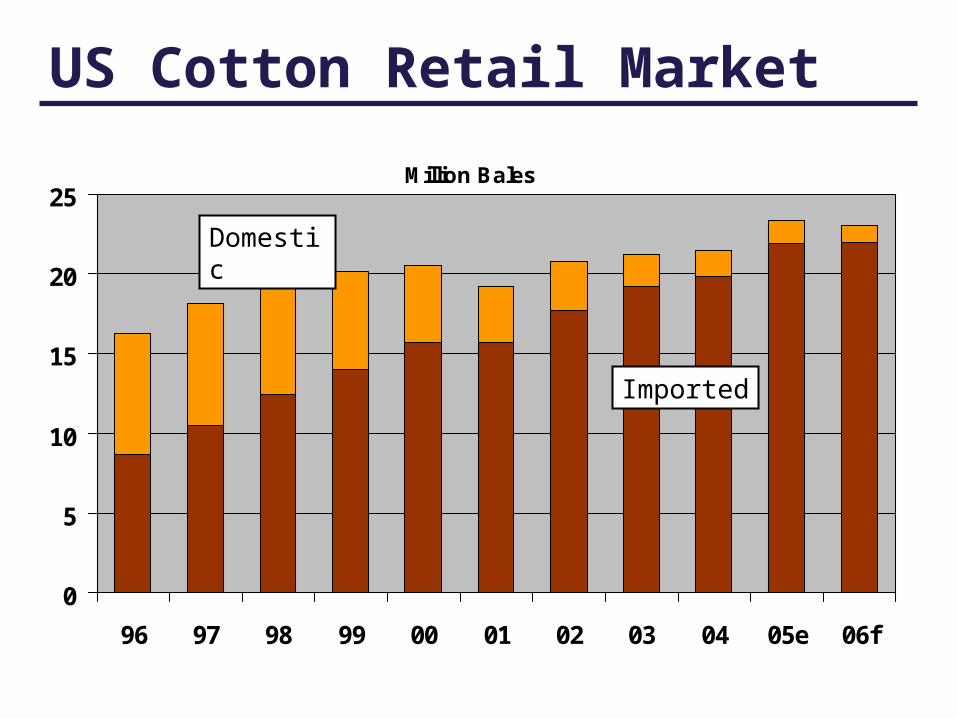
US Cotton Retail Market
Million Bales
0
5
10
15
20
25
96 97 98 99 00 01 02 03 04 05e 06f
Domestic
Imported
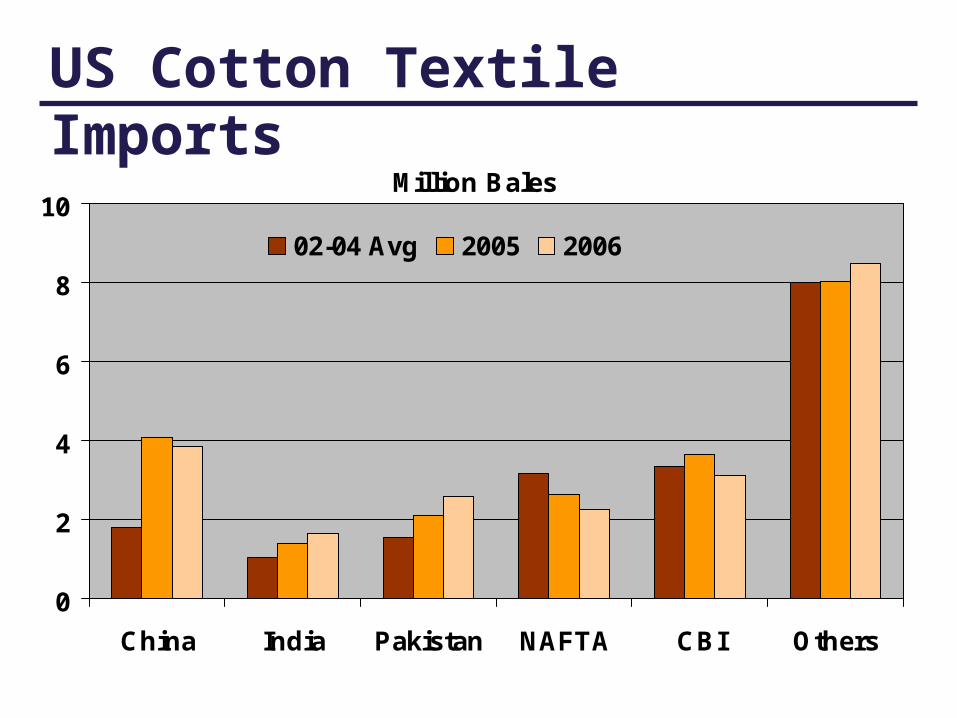
US Cotton Textile Imports
Million Bales
0
2
4
6
8
10
China India Pakistan NAFTA CBI Others
02-04 Avg 2005 2006
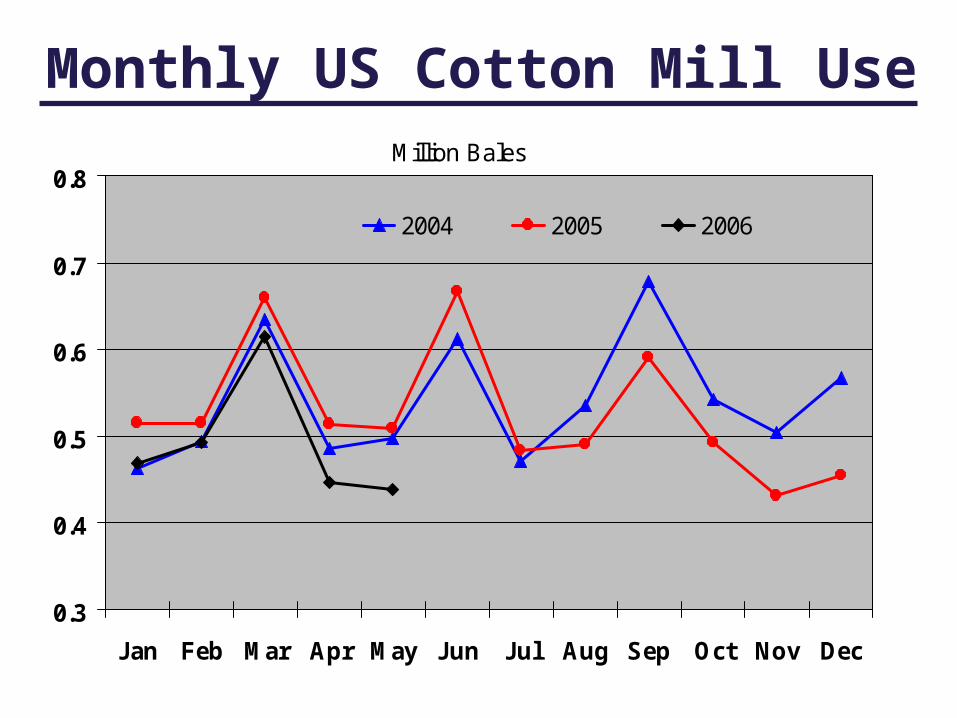
Million Bales
0.3
0.4
0.5
0.6
0.7
0.8
Jan Feb Mar Apr May Jun Jul Aug Sep Oct Nov Dec
2004 2005 2006
Monthly US Cotton Mill Use
02468
101214161820
Au
g-0
5
Se
p-0
5
Se
p-0
5
Oct
-05
No
v-0
5
De
c-0
5
Jan
-06
Fe
b-0
6
Ma
r-0
6
Ap
r-0
6
Ma
y-0
6
Jun
-06
Jul-
06
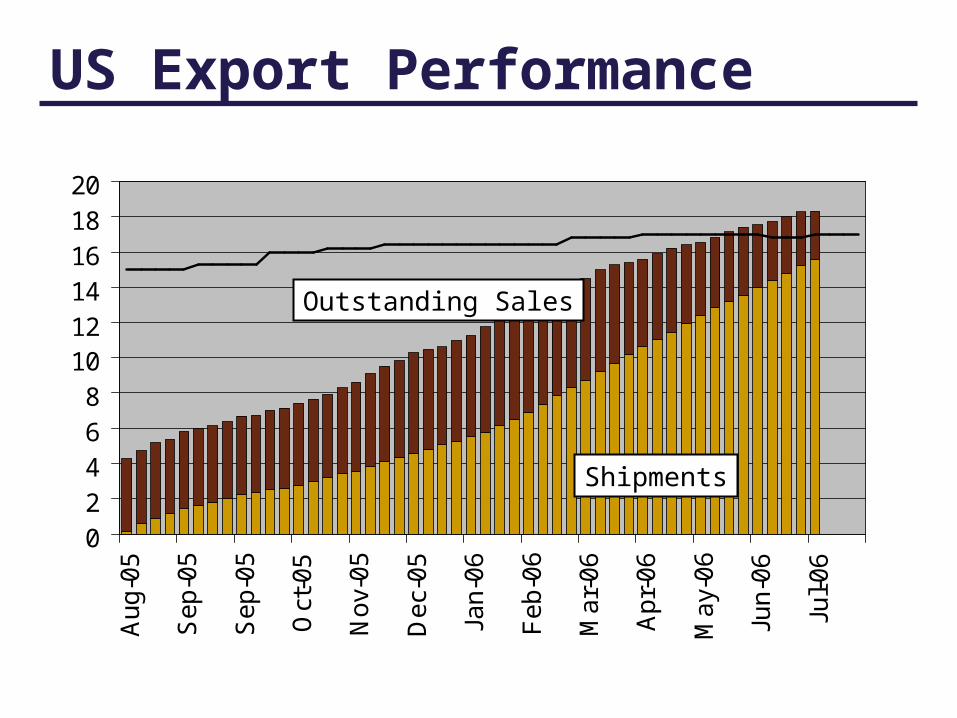
US Export Performance
Shipments
Outstanding Sales
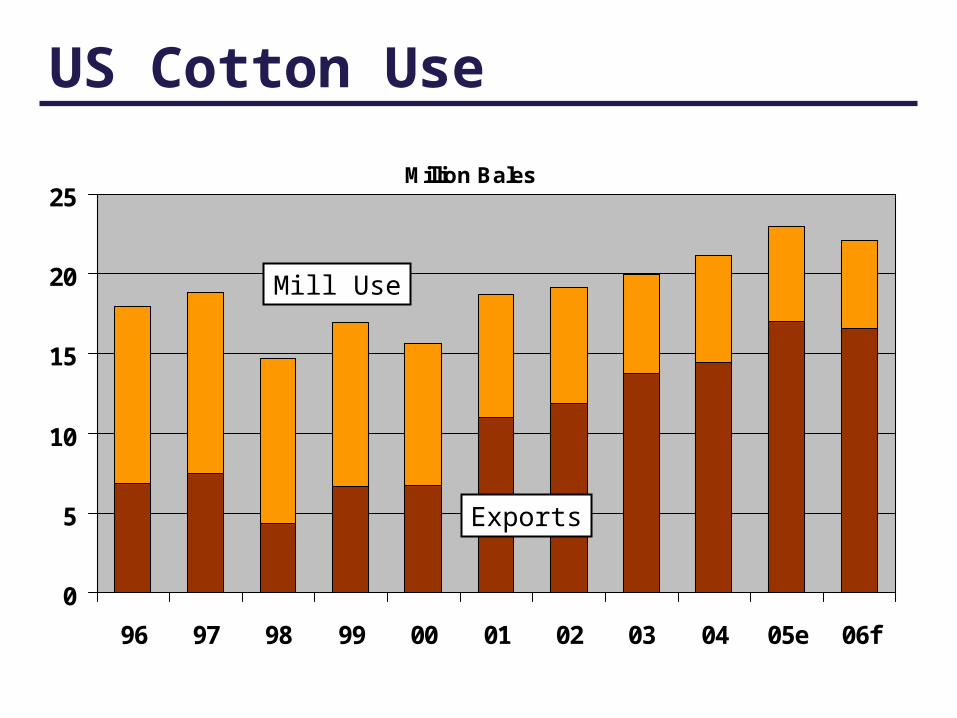
US Cotton Use
Million Bales
0
5
10
15
20
25
96 97 98 99 00 01 02 03 04 05e 06f
Mill Use
Exports
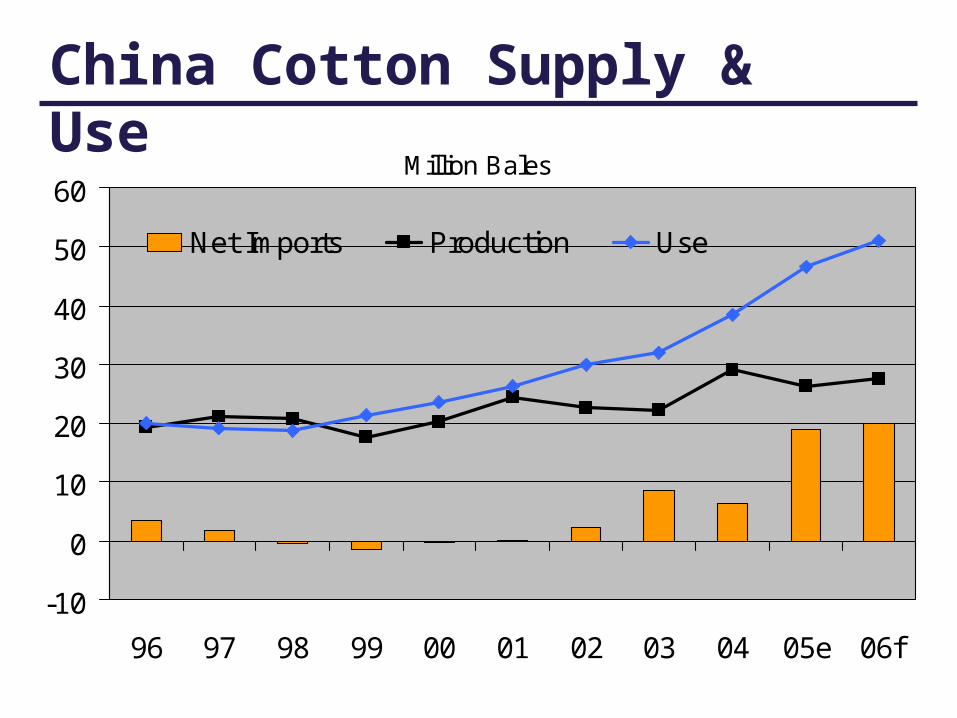
Million Bales
-10
0
10
20
30
40
50
60
96 97 98 99 00 01 02 03 04 05e 06f
Net Imports Production Use
China Cotton Supply & Use
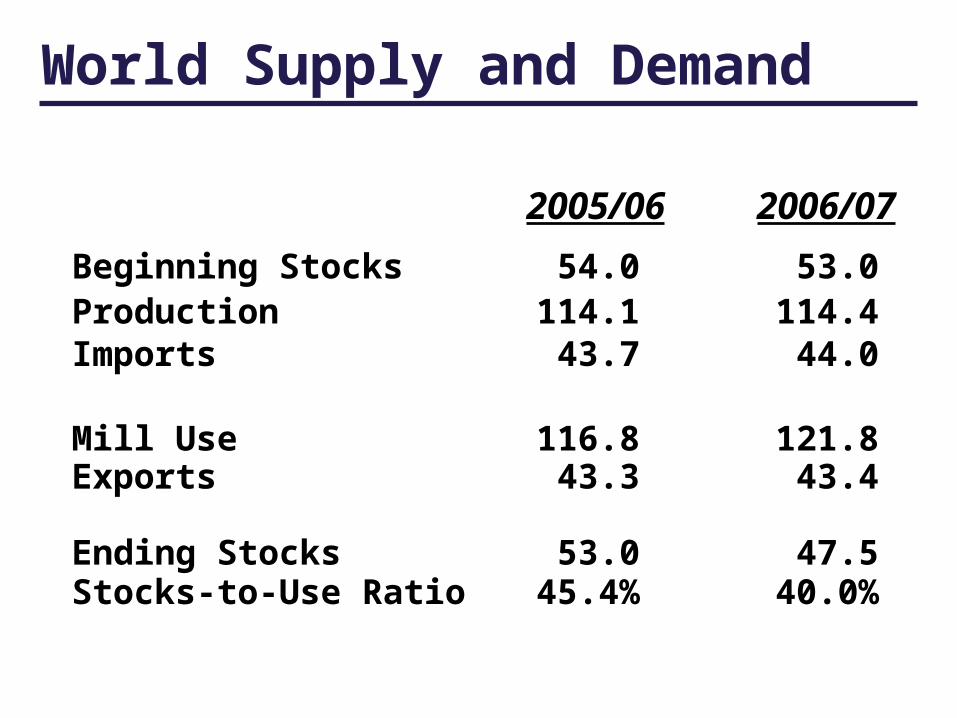
Beginning Stocks 54.0 53.0Production 114.1 114.4Imports 43.7 44.0
Mill Use 116.8 121.8Exports 43.3 43.4
Ending Stocks 53.0 47.5Stocks-to-Use Ratio 45.4% 40.0%
World Supply and Demand
2005/06 2006/07
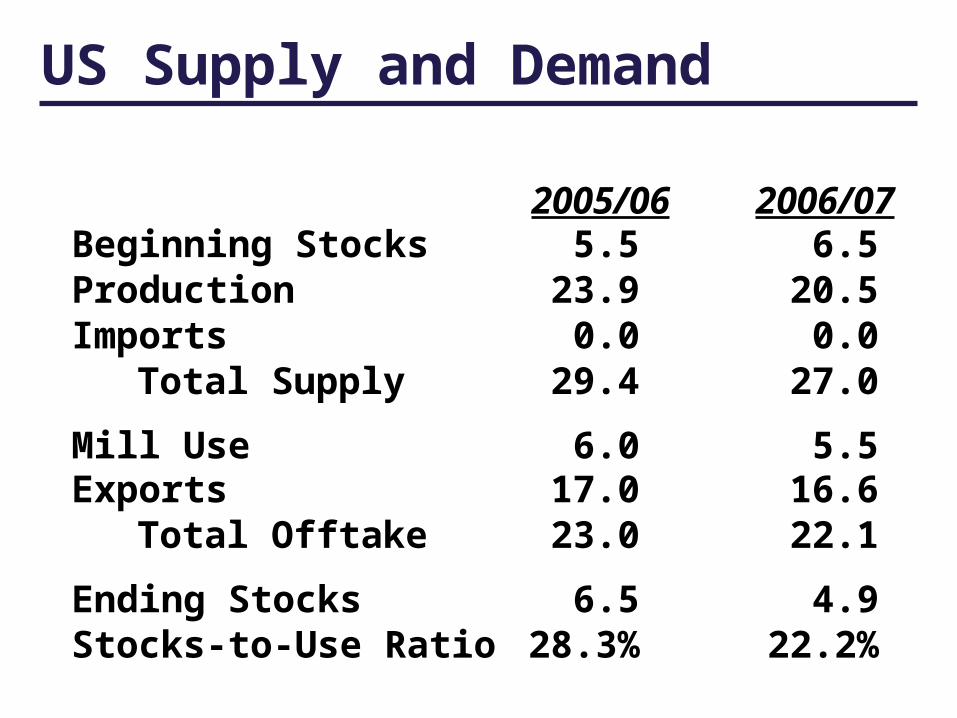
Beginning Stocks 5.5 6.5Production 23.9 20.5Imports 0.0 0.0
Total Supply 29.4 27.0
Mill Use 6.0 5.5Exports 17.0 16.6
Total Offtake 23.0 22.1
Ending Stocks 6.5 4.9Stocks-to-Use Ratio 28.3% 22.2%
US Supply and Demand
2005/06 2006/07
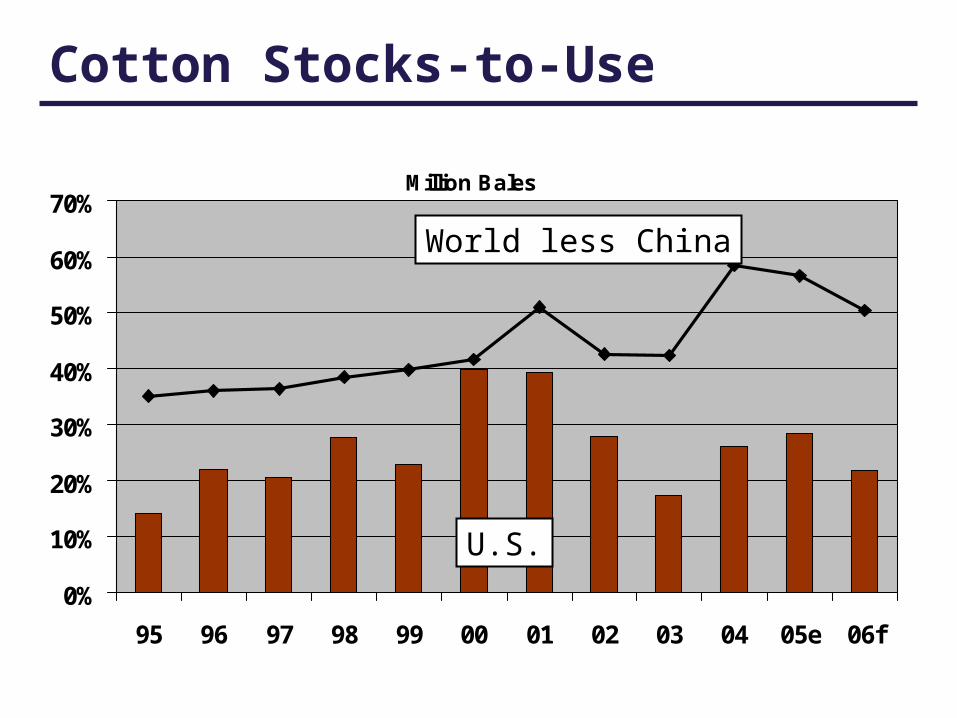
Cotton Stocks-to-Use
Million Bales
0%
10%
20%
30%
40%
50%
60%
70%
95 96 97 98 99 00 01 02 03 04 05e 06f
U.S.
World less China
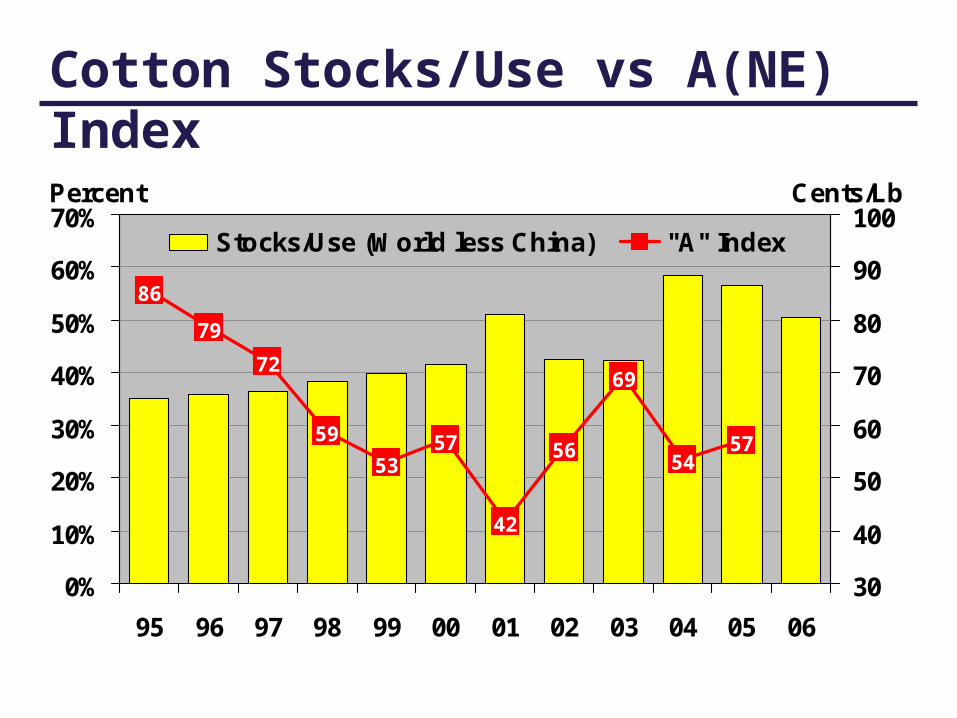
86
79
72
59
5357 56
69
5457
42
0%
10%
20%
30%
40%
50%
60%
70%
95 96 97 98 99 00 01 02 03 04 05 06
Percent
30
40
50
60
70
80
90
100Cents/Lb
Stocks/Use (World less China) "A" Index
Cotton Stocks/Use vs A(NE) Index
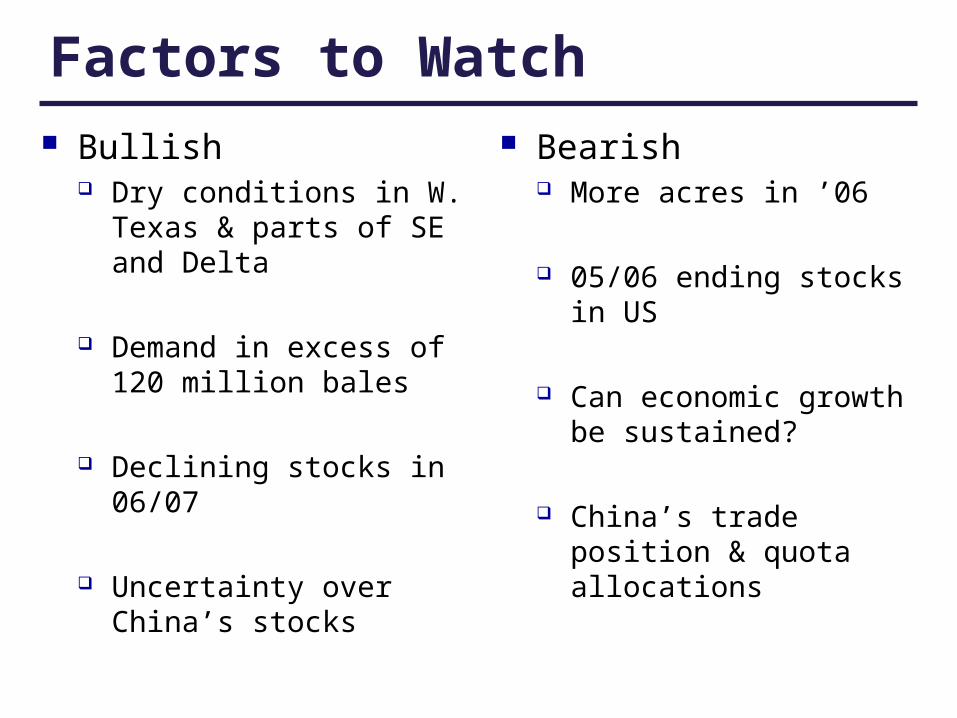
Factors to Watch Bullish
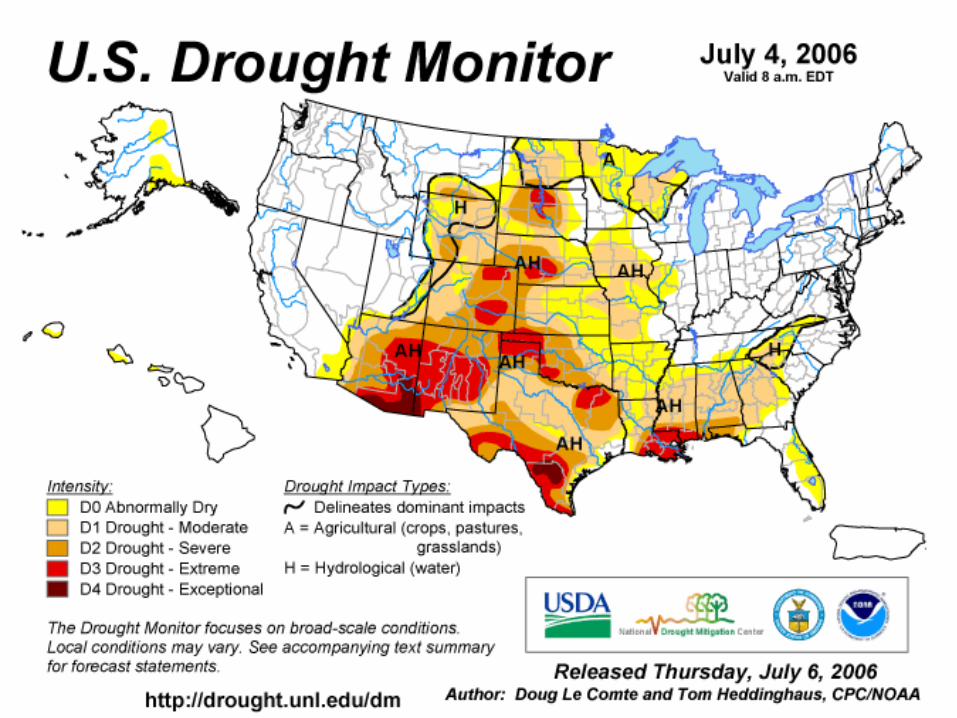
Dry conditions in W. Texas & parts of SE and Delta
Demand in excess of 120 million bales
Declining stocks in 06/07
Uncertainty over China’s stocks
Bearish More acres in ’06
05/06 ending stocks in US
Can economic growth be sustained?
China’s trade position & quota allocations
MerchantsMerchantsGinnersGinners CottonseCottonseeded
ProducerProducerss
CooperativesCooperatives
WarehousesWarehousesManufacturersManufacturers