Embed Size (px)
Citation preview

8/9/2019 CTI Sum 06 Journalfinal
http://slidepdf.com/reader/full/cti-sum-06-journalfinal 1/76

8/9/2019 CTI Sum 06 Journalfinal
http://slidepdf.com/reader/full/cti-sum-06-journalfinal 2/76
8/9/2019 CTI Sum 06 Journalfinal
http://slidepdf.com/reader/full/cti-sum-06-journalfinal 3/76
CTI Journal, Vol. 27, No. 2 1
The CTI Journal
(ISSN: 0273-3250)
PUBLISHED SEMI- ANNUALLY
Copyright 2006 by The CoolingTechnology Institute, PO Box 73383,Houston, TX 77273. Periodicals
postage paid at FORT WORTH, Texas.
MISSION STATEMENT
It is CTI’s objective to: 1) Maintain andexpand a broad base membership of
individuals and organizationsinterested in Evaporative HeatTransfer Sys tems (EHTS), 2) Identifyand address emerging and evolvingissues co ncerning EHTS, 3) Encour-age and support educationalprograms in various formats toenhance the capabilities andcompetence of the industry to realizethe maximum benefit of EHTS, 4)Encourge and support cooperativeresearch to improve EHTS Technologyand efficiency for the long-termbenefit of the environment, 5) Assureacceptable minimum quality levelsand performance of EHTS and their components by establishing standardspecifications, guidelines, and
certification programs, 6) Establishstandard testing and performanceanalysis systems and prcedures for EHTS, 7) Communicate with andinfluence governmental entitiesregarding the environmentallyresponsible technologies, benefits,and issues associated with EHTS, and8) Encourage and support forums andmethods for exchanging technicalinformation on EHTS.
LETTERS/MANUSCRIPTS
Letters to the editor and manuscriptsfor publication should be sent to: TheCooling Technology Institute, PO Box73383, Houston, TX 77273.
SUBSCRIPTIONS
The CTI Journal is published inJanuary and J une. Complimentarysubscriptions mailed to individuals inthe USA. Library subscrip tions $20/yr.Subscriptions mailed to individualsoutside the USA are $30/yr.
CHANGE OF ADDRESS
Request must be received atsubscription office eight weeks beforeeffective date. Send both old and newaddresses for the change. You mayfax your change to 281.537.1721 or email: [email protected].
PUBLICATION DISCLAIMER
CTI has compiled this publicationwith care, but CTI has not Investi-
gated, and CTI expressly disclaimsany duty to investigate, any product,service process, procedure, design,or the like that may be descri bedherein. The appearance of anytechnical data, editorial material, or advertisement in this publicationdoes not constitute endorsement,warranty, or guarantee by CTI of anyproduct, service process, procedure,design, or th e like. CTI does notwarranty that the information in thispublication is free of errors, and CTIdoes not necessarily agree with anystatement or opinion in thispublication. The entire risk of the useof any information in this publicationis assumed by the user. Copyright
2006 by the CTI Journal. All rightsreserved.
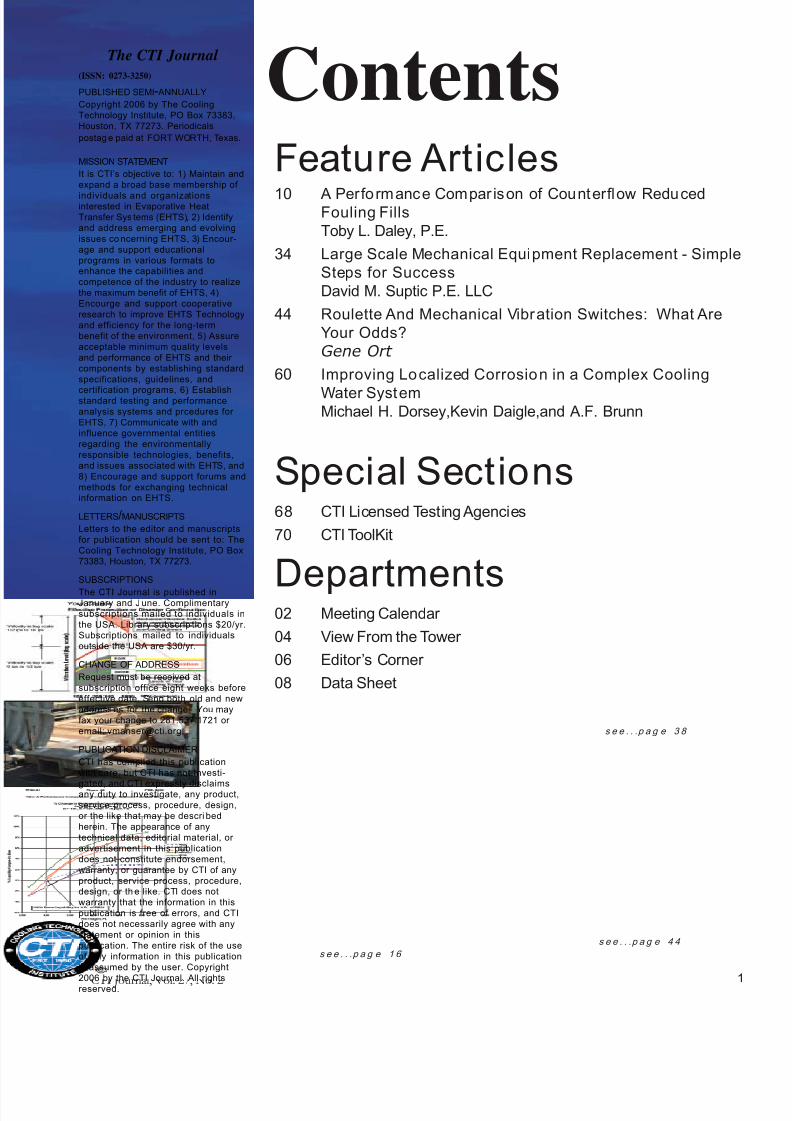
ContentsFeature Articles10 A Performance Compar ison of Counterflow Reduced
Fouling FillsToby L. Daley, P.E.
34 Large Scale Mechanical Equipment Replacement - SimpleSteps for SuccessDavid M. Suptic P.E. LLC
44 Roulette And Mechanical Vibration Switches: What AreYour Odds?Gene Ort
60 Improving Localized Corrosion in a Complex Cooling
Water SystemMichael H. Dorsey,Kevin Daigle,and A.F. Brunn
Special Sections68 CTI Licensed Testing Agencies
70 CTI ToolKit
Departments02 Meeting Calendar
04 View From the Tower
06 Editor’s Corner
08 Data Sheet
s e e . . .p a g e 4 4
s e e . . .p a g e 1 6
s e e . . .p a g e 3 8
8/9/2019 CTI Sum 06 Journalfinal
http://slidepdf.com/reader/full/cti-sum-06-journalfinal 4/76
CTI Journal, Vol. 27, No. 22
CTI Journal The Official Publication of The Cooling Technology Institute
Vol. 27 No.2 Summer 2006
Journal CommitteePaul Lindahl, Editor-in-Chief
Art Brunn, Sr. Editor Virginia Manser, Managing Editor/Adv. Manager Donna Jones, Administrative AssistantGraphics by Sarita Graphics
Board of DirectorsSteve Chaloupka, President
Thomas Bugler, Vice President
Rich Altice, Secretary
Dennis (Denny) P. Shea, Treasurer
Robert (Bob) Giammaruti, Director
Richard (Rich) Harrison, Director
James Kanuth, Director
Ken Kozelski, Director
Terry Ogburn, Director Mark Shaw, Director
Ad dr ess al l co mm un ic at io ns to :Virginia A. Manser, CTI Administrator Cooling Technology InstitutePO Box 73383Houston, Texas 77273
281.583.4087281.537.1721 (Fax)
Internet Address: http://www.cti.org
E-mail: [email protected]
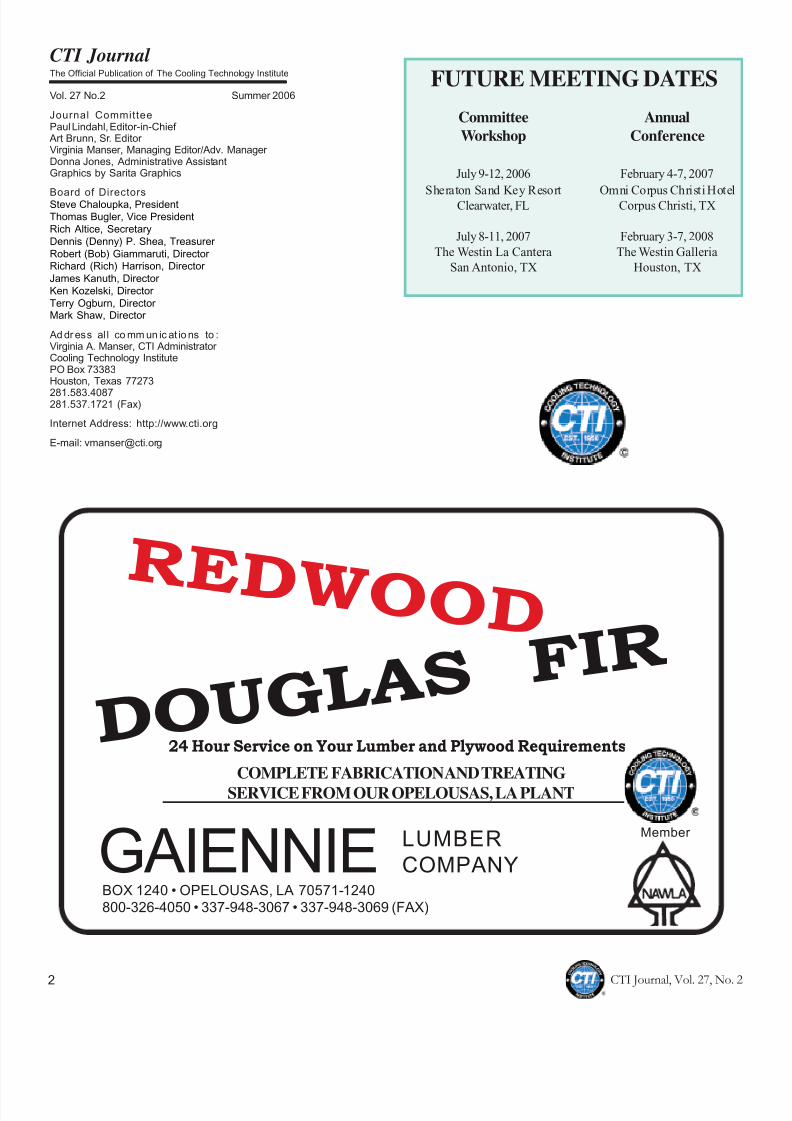
FUTURE MEETING DATES
Committee Annual
Workshop Conference
July 9-12, 2006 February 4-7, 2007
Sheraton Sand Key Resort Omni Corpus Christi HotelClearwater, FL Corpus Christi, TX
July 8-11, 2007 February 3-7, 2008
The Westin La Cantera The Westin Galleria
San Antonio, TX Houston, TX
R E D W O O D
D O UG L A S
F I R
24 Hour Service on Your Lumber and Plywood Requirements
COMPLETE FABRICATION AND TREATING
SERVICE FROM OUR OPELOUSAS, LA PLANT
GAIENNIE LUMBERCOMPANY
BOX 1240 • OPELOUSAS, LA 70571-1240800-326-4050 • 337-948-3067 • 337-948-3069 (FAX)
Member

8/9/2019 CTI Sum 06 Journalfinal
http://slidepdf.com/reader/full/cti-sum-06-journalfinal 5/76
CTI Journal, Vol. 27, No. 2 3
8/9/2019 CTI Sum 06 Journalfinal
http://slidepdf.com/reader/full/cti-sum-06-journalfinal 6/76
CTI Journal, Vol. 27, No. 24
View From The Tower
S t e v e n Ch a l o u p k a
P r e s i d e n t
I want to thank all attendees and participants to
the 2006 Annual Conference for making it the best
meeting we have had in a long time. Continuing
education, fellowship, networking, progress withstandards and codes; all accomplished at the con-
ference! When evaluating personal time spent vs.
cost of participation, I think CTI is offering a pre-
mier value to our industry.
Time flies, and if I read my calendar correctly,
July 9th is rapidly approaching. You might ask
to keep pace with technology advancements. I
hope to see you at this upcoming meeting.
Speaking of the Summer Committee Workshop
I would like to personally invite any and alowner/operators to attend this meeting. We need
your input into the CTI codes and standards
After all, these are for your ultimate benefit. If
you are not able to attend the meeting, but would
like to participate in committee work, please let
me know and I will be happy to get you con-
“What happens on July 9th?” Well, that is the beginning of
the CTI Summer Committee Workshop being held from July
9th through July 12th at the Sheraton Sand Key Resort in
Clearwater, Florida. This is the meeting in which the three
standing committees of Performance & Technology, Water Treating and Engineering Standards & Maintenance are able
to review progress on standards and codes. This is truly the
backbone of CTI and the means in which new standards
and codes are created, plus updating our existing documents
nected with the right people that match your interests and
expertise.
I want to personally welcome Cleanair Engineering, Inc. and
McHale & Associates, Inc. as our two newest CTI licensed
testing agencies. These two new additions bring the CTIofficial licensed testing agencies to four, joining existing com-
panies of Cooling Tower Technologies, Pty., Ltd. and Cooling
Tower Test Associates, Inc. I encourage all owner/opera
tors to use these CTI licensed agencies for performance and
drift code verification on any new or rebuilt cool-
ing towers. By using these licensed agencies
you are assured of accurate data for adherence
to codes and standards. Just one more way CT
can help owners and operators maximize the per-
formance of their cooling towers.
If you have any ideas, suggestions or concernsabout CTI that you would like to discuss with
me, please feel free to contact me. I would be
very interested in discussing anything that migh
improve the offerings of CTI.
Steven Chaloupka,
CTI President

8/9/2019 CTI Sum 06 Journalfinal
http://slidepdf.com/reader/full/cti-sum-06-journalfinal 7/76
CTI Journal, Vol. 27, No. 2 5

8/9/2019 CTI Sum 06 Journalfinal
http://slidepdf.com/reader/full/cti-sum-06-journalfinal 8/76

8/9/2019 CTI Sum 06 Journalfinal
http://slidepdf.com/reader/full/cti-sum-06-journalfinal 9/76
CTI Journal, Vol. 27, No. 2 7
8/9/2019 CTI Sum 06 Journalfinal
http://slidepdf.com/reader/full/cti-sum-06-journalfinal 10/76
CTI Journal, Vol. 27, No. 28
Performance and Testing Program
(Accoustical - Drift - Thermal Testing Agencies)
A hearty welcome to our two newest Multi-Agency Testing Companies, Clean Air Engineering and McHale & Associates
Inc. Here is an introductive discription for both companies to help you get acquainted with each.
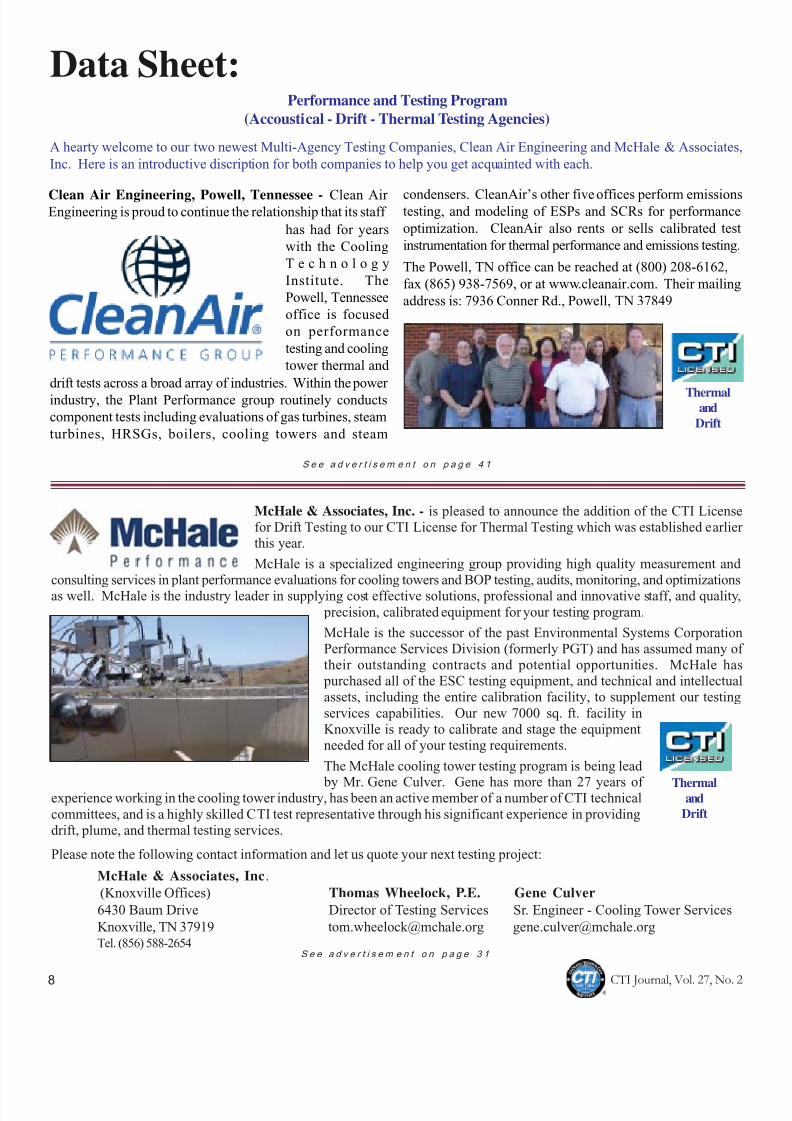
Clean Air Engineering, Powell, Tennessee - Clean Air Engineering is proud to continue the relationship that its staff
Thermaland
Drift
Data Sheet:
McHale & Associates, Inc. - is pleased to announce the addition of the CTI Licensefor Drift Testing to our CTI License for Thermal Testing which was established earlierthis year.
McHale is a specialized engineering group providing high quality measurement andconsulting services in plant performance evaluations for cooling towers and BOP testing, audits, monitoring, and optimizationsas well. McHale is the industry leader in supplying cost effective solutions, professional and innovative staff, and quality
precision, calibrated equipment for your testing program.
McHale is the successor of the past Environmental Systems CorporationPerformance Services Division (formerly PGT) and has assumed many oftheir outstanding contracts and potential opportunities. McHale has purchased all of the ESC testing equipment, and technical and intellectuaassets, including the entire calibration facility, to supplement our testingservices capabilities. Our new 7000 sq. ft. facility inKnoxville is ready to calibrate and stage the equipmentneeded for all of your testing requirements.
The McHale cooling tower testing program is being lead
by Mr. Gene Culver. Gene has more than 27 years of experience working in the cooling tower industry, has been an active member of a number of CTI technicalcommittees, and is a highly skilled CTI test representative through his significant experience in providingdrift, plume, and thermal testing services.
Please note the following contact information and let us quote your next testing project:
McHale & Associates, Inc.
(Knoxville Offices) Thomas Wheelock, P.E. Gene Culver
6430 Baum Drive Director of Testing Services Sr. Engineer - Cooling Tower Services
Knoxville, TN 37919 [email protected] [email protected]. (856) 588-2654
Thermaland
Drift
condensers. CleanAir’s other five offices perform emissionstesting, and modeling of ESPs and SCRs for performance
optimization. CleanAir also rents or sells calibrated test
instrumentation for thermal performance and emissions testing.
The Powell, TN office can be reached at (800) 208-6162,
fax (865) 938-7569, or at www.cleanair.com. Their mailing
address is: 7936 Conner Rd., Powell, TN 37849
S e e a d v e r t i s e m e n t o n p a g e 4 1
S e e a d v e r t i s e m e n t o n p a g e 3 1
has had for years
with the Cooling
T e c h n o l o g y
Institute. The
Powell, Tennessee
office is focused
on performance
testing and cooling
tower thermal and
drift tests across a broad array of industries. Within the power
industry, the Plant Performance group routinely conducts
component tests including evaluations of gas turbines, steam
turbines, HRSGs, boilers, cooling towers and steam
8/9/2019 CTI Sum 06 Journalfinal
http://slidepdf.com/reader/full/cti-sum-06-journalfinal 11/76
CTI Journal, Vol. 27, No. 2 9
8/9/2019 CTI Sum 06 Journalfinal
http://slidepdf.com/reader/full/cti-sum-06-journalfinal 12/76
CTI Journal, Vol. 27, No. 210
Toby L. Daley, P.E.T Daley & Associates, Inc
AbstractThis paper will present the recent testing results of
counterflow film and splash type reduced fouling
fill configurations. It will present a comparison of
the relative performance of the fills. This recent test-
ing program provides a today’s performance per-
spective of the most commonly used fills of this
type.
IntroductionSince the introduction of Poly Vinyl Chloride (PVC)
counterflow film fills there has been a continuing
Fill Media TestedThe fill media that were tested represent a mix o
reduced fouling fills for various water quality ap
plications.
These are:
· FB20
· FC18
· SNCS
· AAFNCS
· RF20
· DF254
· Spaced Tile
A Performance Comparison of Counterflow Reduced Fouling Fills
effort to reduce the fouling characteristics in fouling potential ap-
plications. Physical characteristics of high efficiency film fills such
as close flute spacing, cross corrugation and cross stacking of
packs are all negatives when considering their use in fouling po-
tential applications.
Early applications of these high efficiency fill media in potential
fouling applications in the 1980’s were met with failure due to a lack
of understanding of its behavior in the environment. It was not
uncommon to hear stories of towers which routinely became plugged
after a short period of service. It became accepted to repack a tower
every so many years to maintain the As-New thermal performance.
Thus, the goal of designing a new reduced fouling fill media be-
came how to reduce the fouling potential while trying to maintain
the heat transfer characteristics of a high efficiency fill media. Asthese new generations of reduced fouling fills became available it
was apparent that this goal was not going to be easily achieved. In
most applications the solution to scheduled repacking of high effi-
ciency fill media was the installation of a reduced fouling fill media
with a substantial reduction in tower performance.
However, over the last 15 years fill manufacturers have continued
to reduce the fouling potential and increase the thermal efficiency.
There is a physical limit in achieving this combination that is very
dependent upon the quality of the circulating water, water treat-
ment and environment.
This paper will present the results of recent testing of some of the
most common types of these fills. Basic thermal capability compari-sons will then be performed to provide the user with an under-
standing of fill selection impact versus performance. It is not the
intent to provide water quality guidelines for applying the fills.
There have been several quality technical papers previously pre-
sented to the industry on this subject.
An additional fill is included that is not a PVC film fill but is a
Splash-Film fill known as “Tile Fill” which was created by Ceramic
Cooling Tower in the late 1940’s. This fill has also been classified as
a non-fouling fill.
The testing was performed at the SPX Cooling Technologies De-velopment Center over a period from 2002 thru 2005. The raw tesdata was provided by SPXCT and the author performed the datareduction and analysis using custom developed software whichincludes the Cooling Technology Institute (CTI) Merkel and Psy-chrometric methods.
The configuration of the test cell and testing protocol has been previously described in the CTI Technical Paper TP88-05 “Com- parative Evaluation of Counterflow Cooling Tower Fills”, authored
by Bob Fulkerson.
Fill ConfigurationThe following table presents the fill configuration for each fill tested
Fill Nozzle Type Nozzle Nominal Fill Spray HeightSpacing, Height
inches
FB20 NS5A X 12 26 X 36 4, 6, 8 Ft. 26" C/L branch to
top of fill
FC18 NS5A X 12 26 X 36 4, 6, 8 Ft. 26" C/L branch to
top of fill
SNCS NS5A X 12 26 X 36 1, 1.5, 2 M 26" C/L branch to
top of fill
AAFNCS NS5A X 12 26 X 36 1,1.5, 2, 2.5 M 26" C/L branch to
top of fill
RF20 NS5A X 12 26 X 36 1.5, 2, 2.5 M 26" C/L branch to
top of fill
DF254 NS5A X 12 26 X 36 2.5, 5, 7.5 Ft. 26" C/L branch to
top of fill
Spaced NS5A X 12 26 X 36 3.25, 6.0 Ft. 26" C/L branch
Tile top of fill
Data AnalysisThe data was received in text file format and converted to a spread-sheet format. Using the analysis software, written by the Author, aCTI Merkel KaV/L was then determined for each test L/G, fill typeand height. A multiple regression curve fit analysis was performedto determine the coefficients and the proper equation form to math
ematically represent the L/G and KaV/L relationship.
This same analysis process was performed for each fill velocity andwater loading or Q/A (gallons per minute per square foot of fill plan
Toby L. Daley, P.E.

8/9/2019 CTI Sum 06 Journalfinal
http://slidepdf.com/reader/full/cti-sum-06-journalfinal 13/76
CTI Journal, Vol. 27, No. 2 11
8/9/2019 CTI Sum 06 Journalfinal
http://slidepdf.com/reader/full/cti-sum-06-journalfinal 14/76
CTI Journal, Vol. 27, No. 212
area) to determine the fill static pressure equation form and coeffi-cients characteristics.
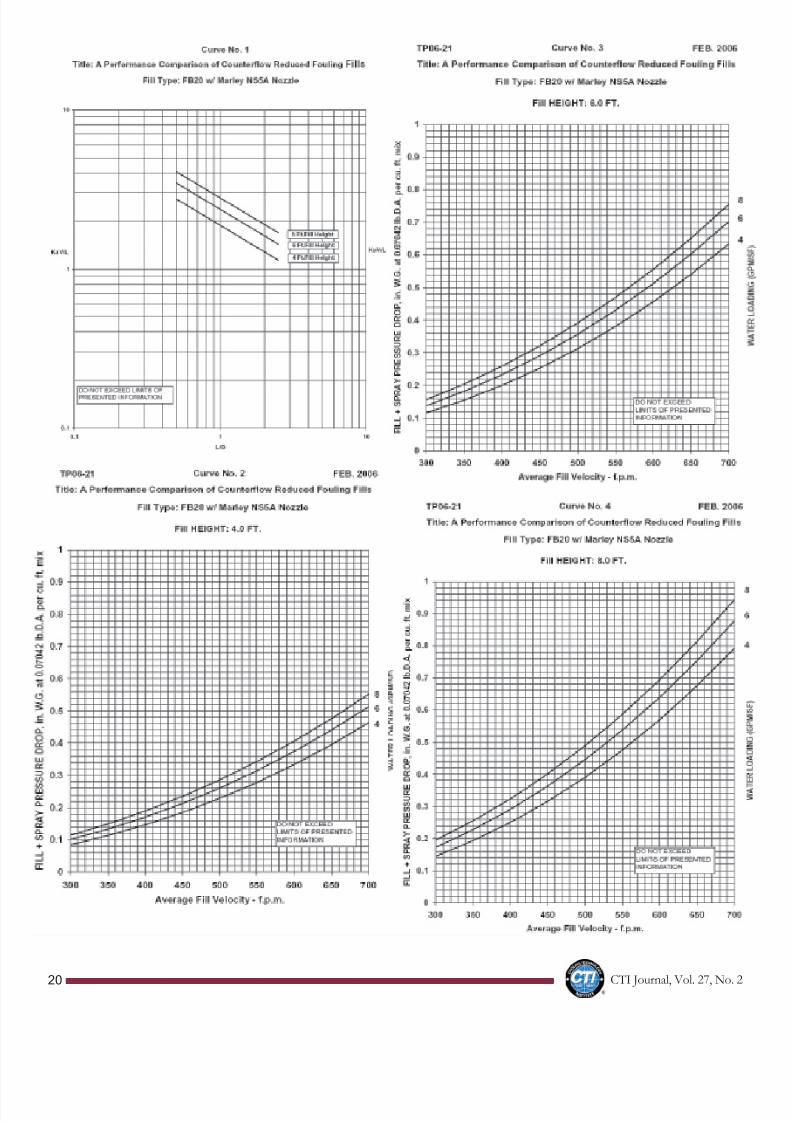
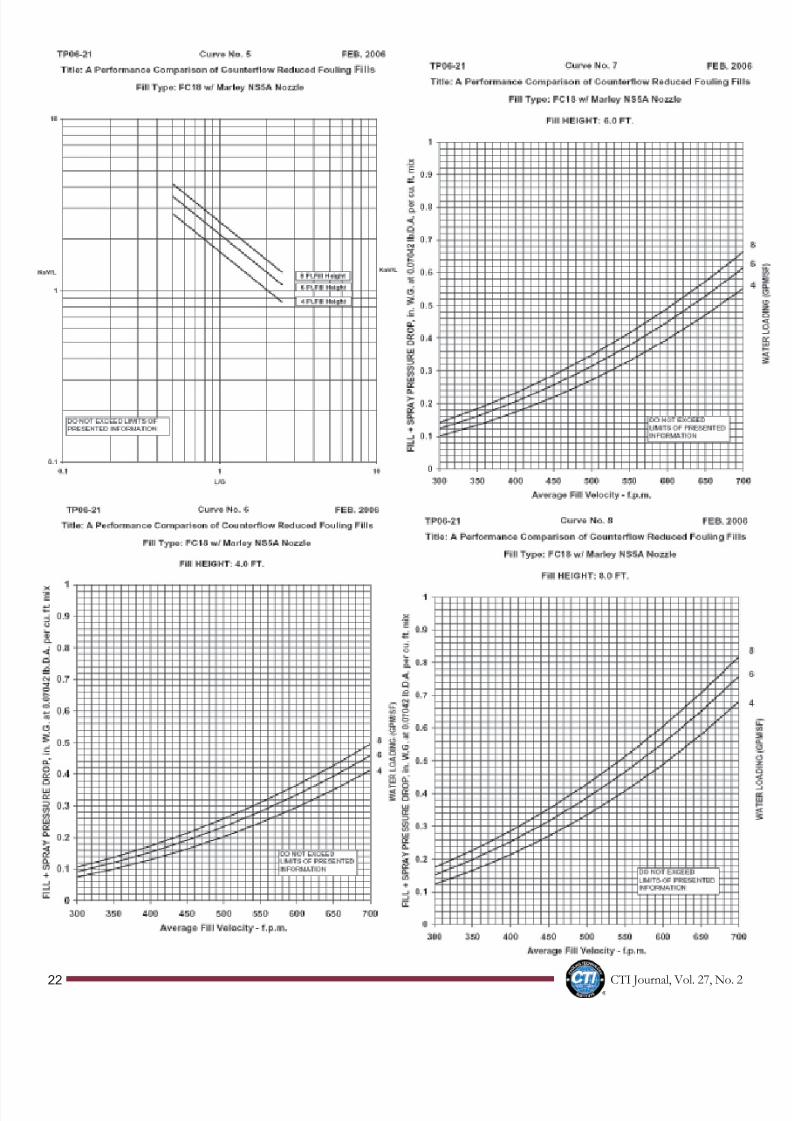
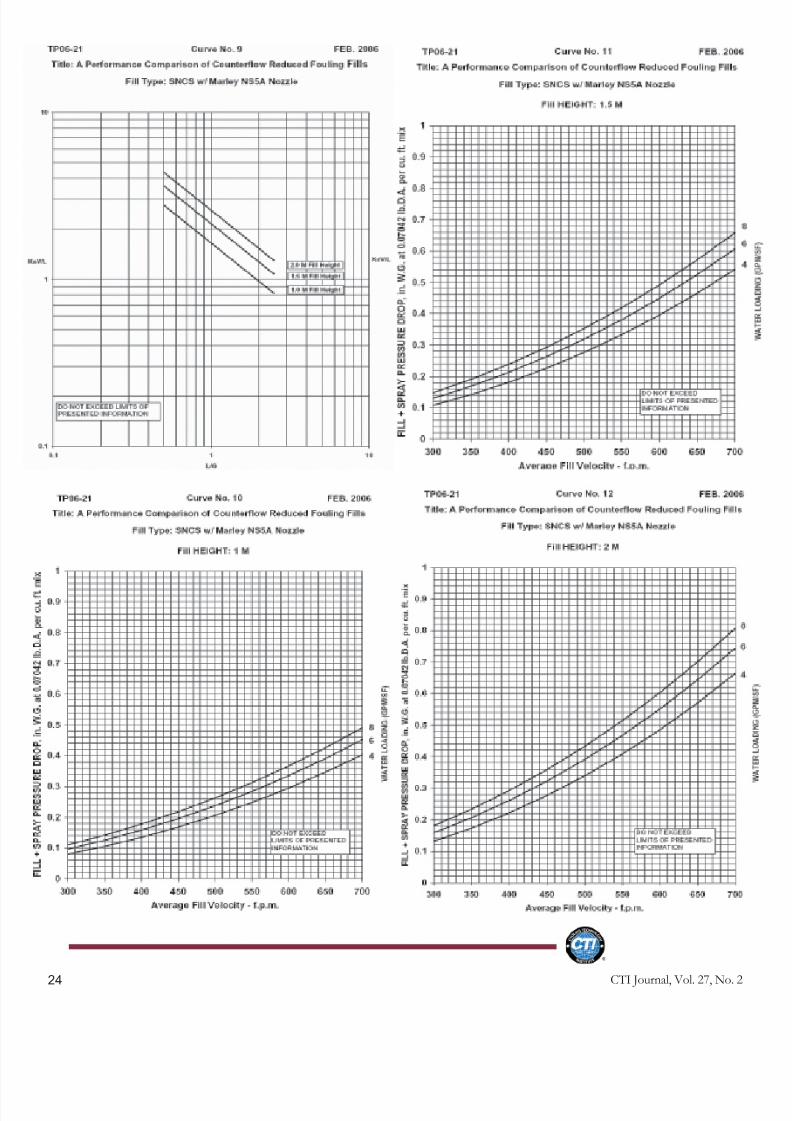
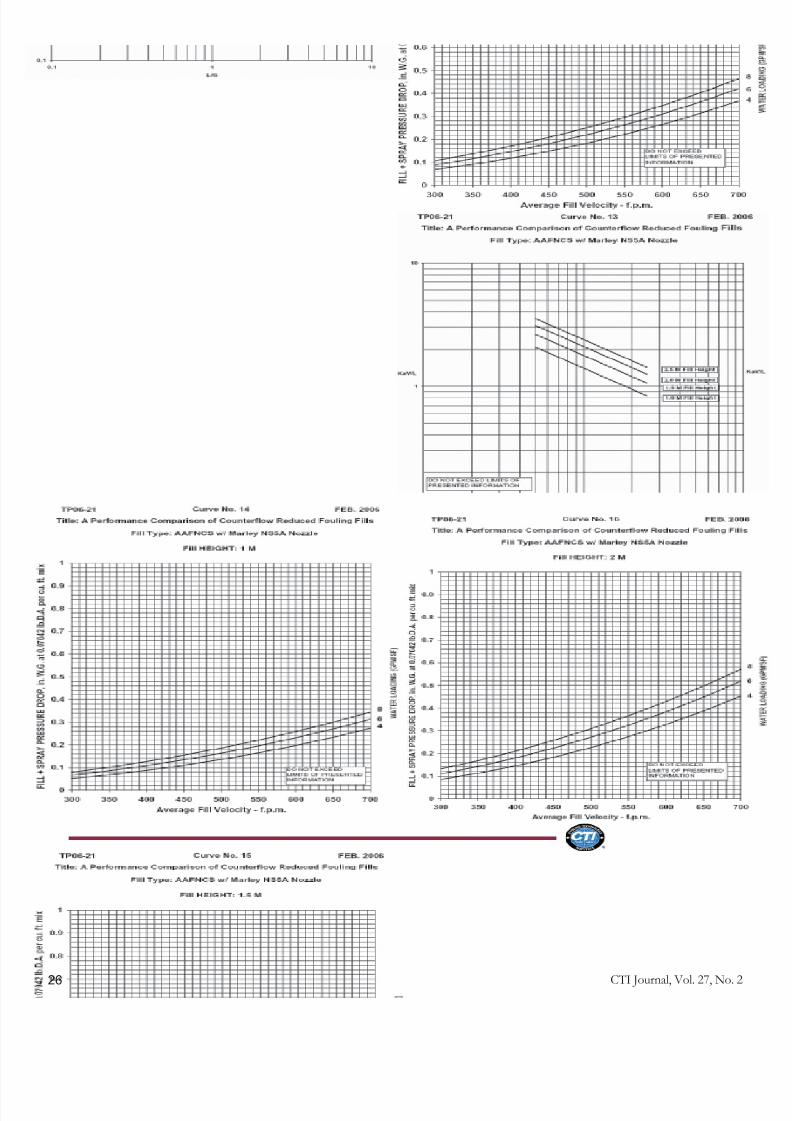
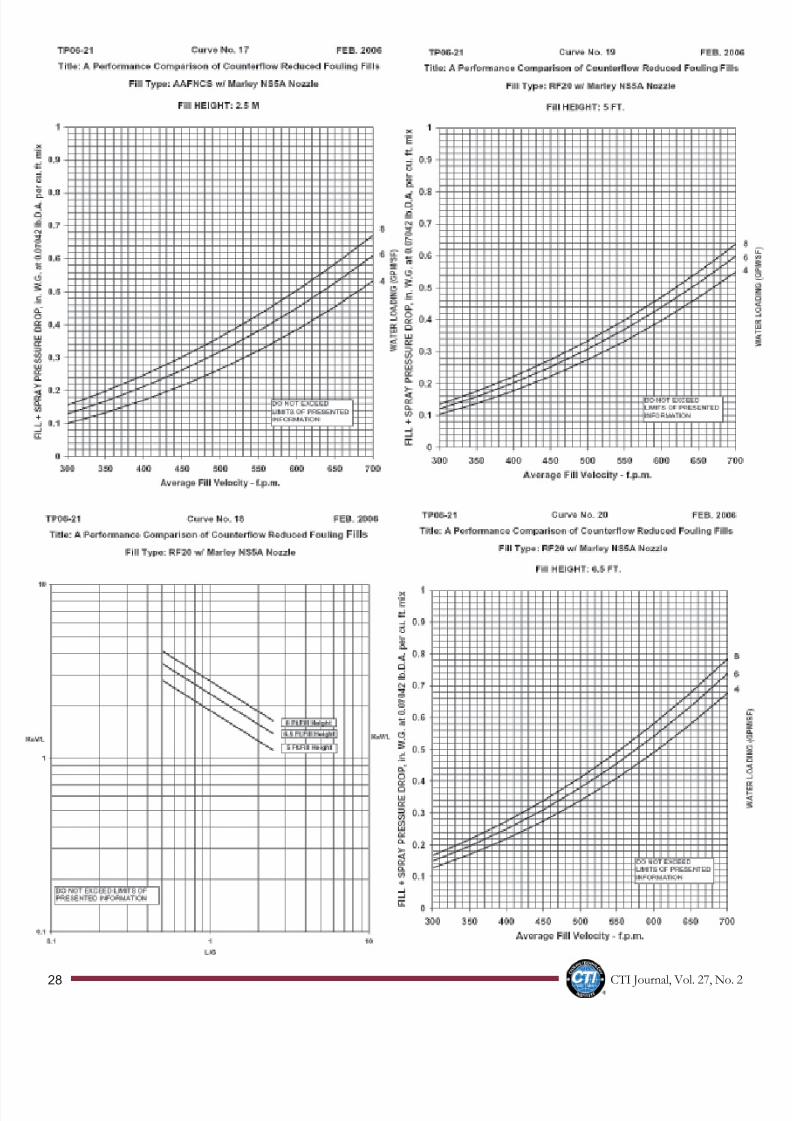
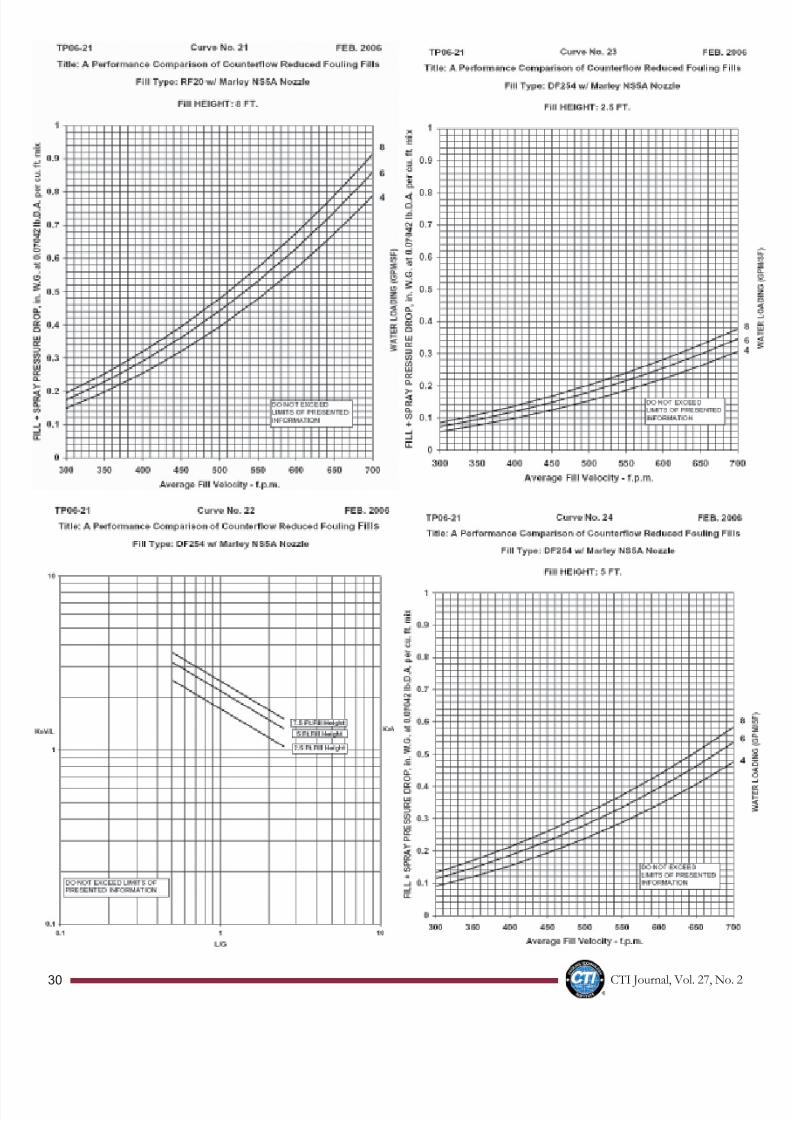
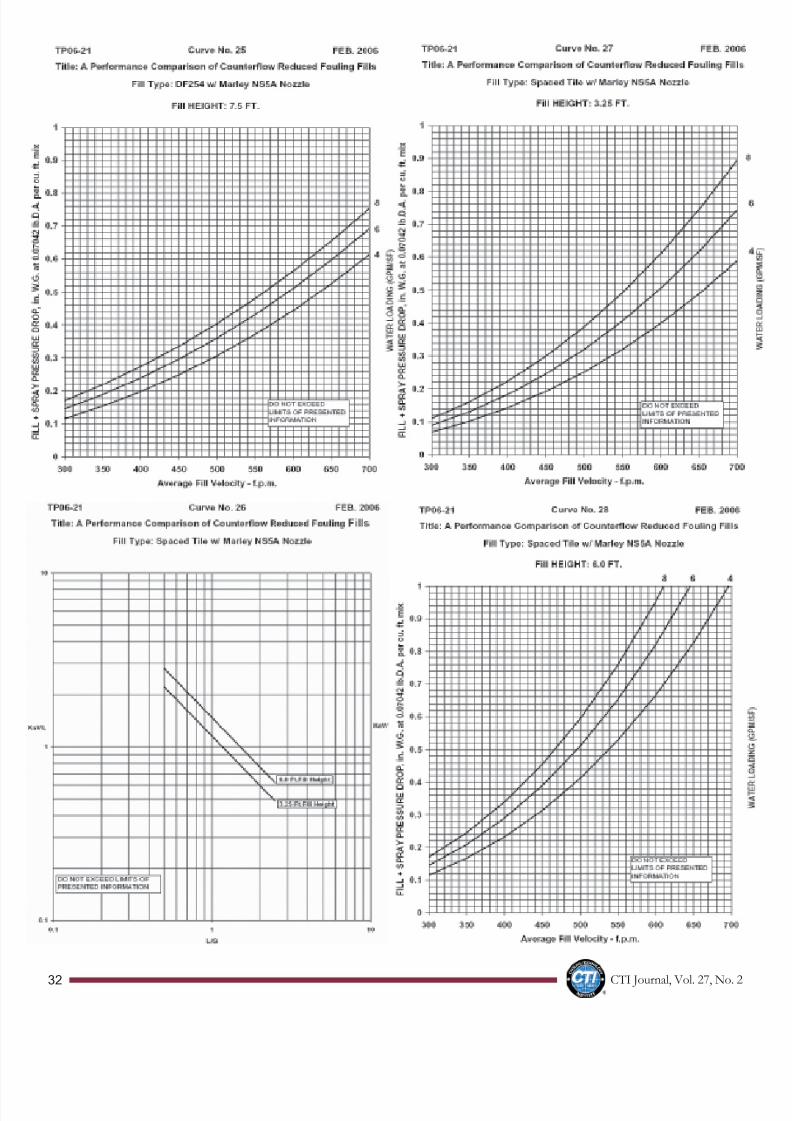
The resulting L/G vs. KaV/L characteristics and Velocity vs. StaticPressure for water loadings of Q/A = 4, 6, and 8 are presented incurve form in Appendix A. The equations and coefficients are con-sidered proprietary.
The L/G vs. KaV/L curves are presented for a hot water temperatureof 100 F.
The Velocity vs. Static Pressure curves are presented at .070 den-
sity (lb dry air/ft^3 mix).
Performance Comparison ModelsThe typical goal for a thermal selection is to determine the mostefficient and economical tower to satisfy a required thermal duty,horsepower, and space available. In clean water applications this isusually straight forward and involves a traditional high efficiencyfill. However, when an installation involves a water quality and/or environment which could interact with the fill and produce foulingthen fill selection process involves other considerations. Theseconsiderations might be hot water temperature, fill velocity, water loading per square foot, etc.
Thus, the need for thermal performance equivalence usually arises.
The following questions generally occur.
· If I leave the cell size and horsepower the same, what is the performance capability if I change to a different fill but keepthe same fill height? (Especially true in an existing tower.)
· If I change the cell size and the fill height, how much larger in plan area is required at the same horsepower?
There can be and usually are many more questions. The answer involves much more that just changing the fill selection. How doesit affect the air inlet heights, fan size, gear reducer, plenum, etc? It isnot the intent to provide these answers herein since there are varia-tions in proprietary rating systems and methodology. However, afill only performance comparison can be performed by using the fillthermal characteristics and static pressure curves.
The performance comparison models involved the following;
· Defining three thermal duties which utilize L/G’s boundingthe characteristic line. This included a varying approach,water loading, fill velocity for a WBT = 78 F.
· Creating a normalization process to reflect % change in ther-mal capability or % change in required plan area.
The following table shows the duties used to create the compari-sons.
Duty Range, F App, F Q/A
A 10.0 6.0 3.5
B 10.0 10.0 6.0
C 10.0 14.0 8.0
The normalization and comparative process consisted of the fol-lowing;
· A 4 Ft. fill height of FB20 was used as the base fill, plan area,and horsepower. All other fills were then compared to it.
· Holding the FB20 plan area constant – % of Capability wascompared.
· Holding the FB20 horsepower constant – Required % plan
area was compared on a normalized basis.
Fill velocities ranged from 300 to 700 feet per minute.
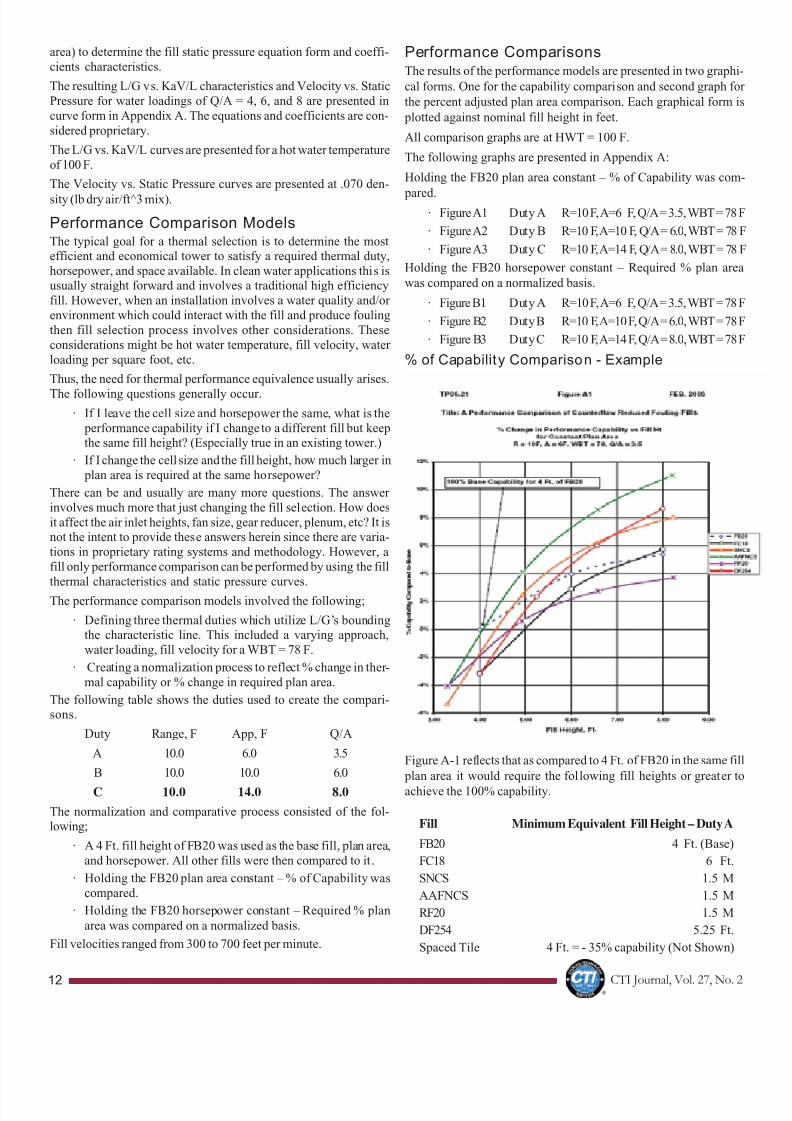
Performance ComparisonsThe results of the performance models are presented in two graphi-
cal forms. One for the capability comparison and second graph fo
the percent adjusted plan area comparison. Each graphical form is
plotted against nominal fill height in feet.
All comparison graphs are at HWT = 100 F.
The following graphs are presented in Appendix A:
Holding the FB20 plan area constant – % of Capability was com
pared.· Figure A1 Duty A R=10 F, A=6 F, Q/A = 3.5, WBT = 78 F
· Figure A2 Duty B R=10 F, A=10 F, Q/A = 6.0, WBT = 78 F
· Figure A3 Duty C R=10 F, A=14 F, Q/A = 8.0, WBT = 78 F
Holding the FB20 horsepower constant – Required % plan area
was compared on a normalized basis.
· Figure B1 Duty A R=10 F, A=6 F, Q/A = 3.5, WBT = 78 F
· Figure B2 Duty B R=10 F, A=10 F, Q/A = 6.0, WBT = 78 F
· Figure B3 Duty C R=10 F, A=14 F, Q/A = 8.0, WBT = 78 F
% of Capability Comparison - Example
Figure A-1 reflects that as compared to 4 Ft. of FB20 in the same fil
plan area it would require the following fill heights or greater to
achieve the 100% capability.
Fill Minimum Equivalent Fill Height – Duty A
FB20 4 Ft. (Base)
FC18 6 Ft.
SNCS 1.5 M
AAFNCS 1.5 M
RF20 1.5 M
DF254 5.25 Ft.
Spaced Tile 4 Ft. = - 35% capability (Not Shown)

8/9/2019 CTI Sum 06 Journalfinal
http://slidepdf.com/reader/full/cti-sum-06-journalfinal 15/76
CTI Journal, Vol. 27, No. 2 13
8/9/2019 CTI Sum 06 Journalfinal
http://slidepdf.com/reader/full/cti-sum-06-journalfinal 16/76
CTI Journal, Vol. 27, No. 214
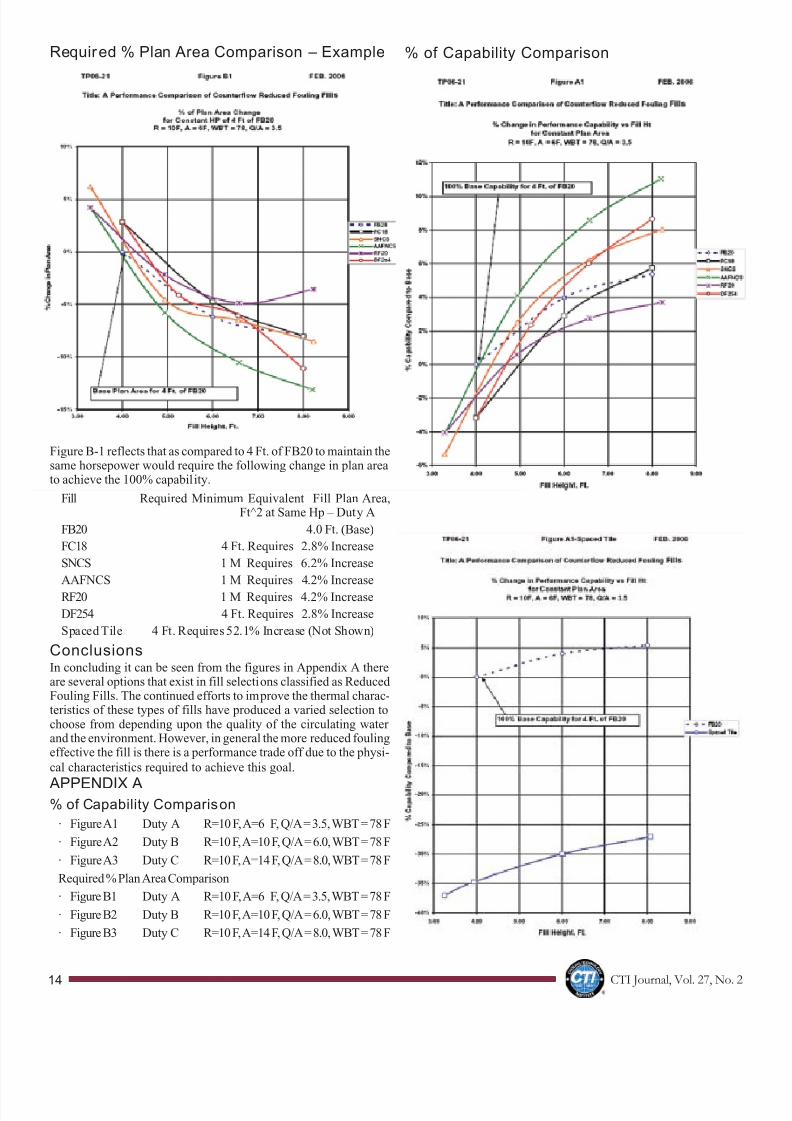
Required % Plan Area Comparison – Example
Figure B-1 reflects that as compared to 4 Ft. of FB20 to maintain thesame horsepower would require the following change in plan areato achieve the 100% capability.
Fill Required Minimum Equivalent Fill Plan Area,Ft^2 at Same Hp – Duty A
FB20 4.0 Ft. (Base)
FC18 4 Ft. Requires 2.8% Increase
SNCS 1 M Requires 6.2% Increase
AAFNCS 1 M Requires 4.2% Increase
RF20 1 M Requires 4.2% Increase
DF254 4 Ft. Requires 2.8% Increase
Spaced Tile 4 Ft. Requires 52.1% Increase (Not Shown)
ConclusionsIn concluding it can be seen from the figures in Appendix A thereare several options that exist in fill selections classified as Reduced Fouling Fills. The continued efforts to improve the thermal charac-teristics of these types of fills have produced a varied selection tochoose from depending upon the quality of the circulating water and the environment. However, in general the more reduced foulingeffective the fill is there is a performance trade off due to the physi-cal characteristics required to achieve this goal.
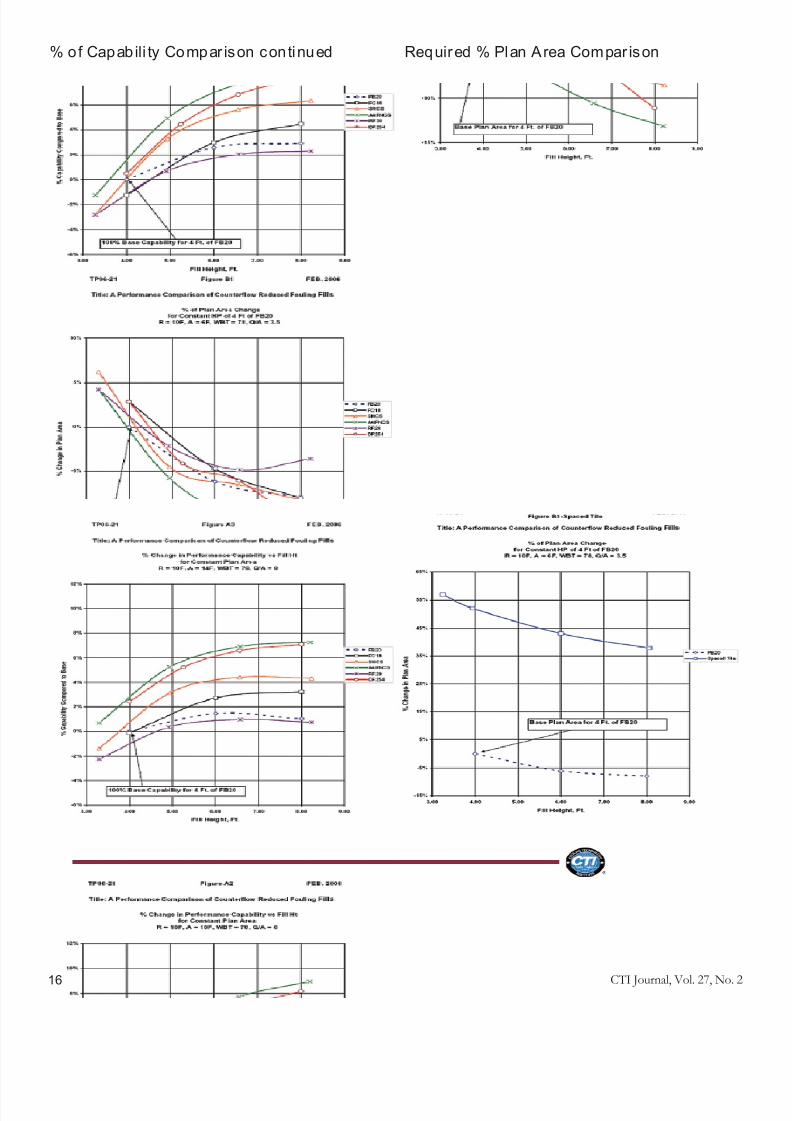
APPENDIX A% of Capability Comparison
· Figure A1 Duty A R=10 F, A=6 F, Q/A = 3.5, WBT = 78 F
· Figure A2 Duty B R=10 F, A=10 F, Q/A = 6.0, WBT = 78 F
· Figure A3 Duty C R=10 F, A=14 F, Q/A = 8.0, WBT = 78 F
Required % Plan Area Comparison
· Figure B1 Duty A R=10 F, A=6 F, Q/A = 3.5, WBT = 78 F
· Figure B2 Duty B R=10 F, A=10 F, Q/A = 6.0, WBT = 78 F
· Figure B3 Duty C R=10 F, A=14 F, Q/A = 8.0, WBT = 78 F
% of Capability Comparison

8/9/2019 CTI Sum 06 Journalfinal
http://slidepdf.com/reader/full/cti-sum-06-journalfinal 17/76
8/9/2019 CTI Sum 06 Journalfinal
http://slidepdf.com/reader/full/cti-sum-06-journalfinal 18/76
CTI Journal, Vol. 27, No. 216
% of Capabili ty Compar ison continued Required % Plan Area Compar ison

8/9/2019 CTI Sum 06 Journalfinal
http://slidepdf.com/reader/full/cti-sum-06-journalfinal 19/76
CTI Journal, Vol. 27, No. 2 17
We now offer "Direct Size Wood Replacement"profiles, featuring:
• 3 1/2" x 3 1/2" x 1/4" square tube replaces 4 x 4 lumber
• 5 1/2" x 1 1/2” x 1/4” channel replaces 2 x 6 lumber
• 3 1/2" x 1 1/2” x 3/16” channel replaces 2 x 4 lumber
• 3 1/2" x 1 1/2" x 3/16" IBeam replaces 2 x 4 lumber
• 5 1/2" x 2 1/2" x 1/4" IBeam replaces 2 x 6 lumber
• 3" x 3/8" FRP strap
Bedford Reinforced Plastics, Inc. specializes in FRP
Pultruded Products for the cooling tower market. We
have inventory located on the east and west coast and
in Houston, TX.
Ask us about our replacement fan deck.
• 24” x 1 1/2” deck
• 24” x 1 1/8” deckLiterature is available upon request.
8/9/2019 CTI Sum 06 Journalfinal
http://slidepdf.com/reader/full/cti-sum-06-journalfinal 20/76
CTI Journal, Vol. 27, No. 218
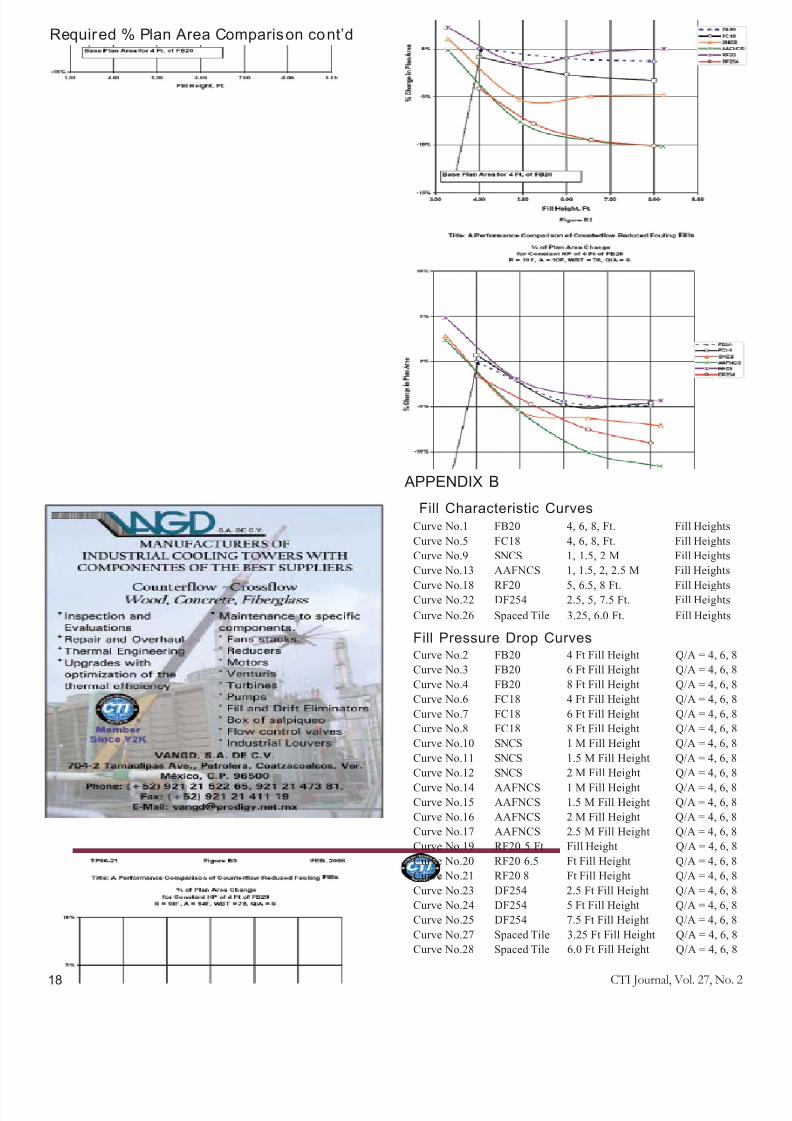
Required % Plan Area Comparison cont’d
APPENDIX B
Fill Characteristic CurvesCurve No.1 FB20 4, 6, 8, Ft. Fill Heights
Curve No.5 FC18 4, 6, 8, Ft. Fill Heights
Curve No.9 SNCS 1, 1.5, 2 M Fill Heights
Curve No.13 AAFNCS 1, 1.5, 2, 2.5 M Fill Heights
Curve No.18 RF20 5, 6.5, 8 Ft. Fill HeightsCurve No.22 DF254 2.5, 5, 7.5 Ft. Fill Heights
Curve No.26 Spaced Tile 3.25, 6.0 Ft. Fill Heights
Fill Pressure Drop CurvesCurve No.2 FB20 4 Ft Fill Height Q/A = 4, 6, 8
Curve No.3 FB20 6 Ft Fill Height Q/A = 4, 6, 8
Curve No.4 FB20 8 Ft Fill Height Q/A = 4, 6, 8
Curve No.6 FC18 4 Ft Fill Height Q/A = 4, 6, 8
Curve No.7 FC18 6 Ft Fill Height Q/A = 4, 6, 8
Curve No.8 FC18 8 Ft Fill Height Q/A = 4, 6, 8
Curve No.10 SNCS 1 M Fill Height Q/A = 4, 6, 8
Curve No.11 SNCS 1.5 M Fill Height Q/A = 4, 6, 8
Curve No.12 SNCS 2 M Fill Height Q/A = 4, 6, 8
Curve No.14 AAFNCS 1 M Fill Height Q/A = 4, 6, 8Curve No.15 AAFNCS 1.5 M Fill Height Q/A = 4, 6, 8
Curve No.16 AAFNCS 2 M Fill Height Q/A = 4, 6, 8
Curve No.17 AAFNCS 2.5 M Fill Height Q/A = 4, 6, 8
Curve No.19 RF20 5 Ft Fill Height Q/A = 4, 6, 8
Curve No.20 RF20 6.5 Ft Fill Height Q/A = 4, 6, 8
Curve No.21 RF20 8 Ft Fill Height Q/A = 4, 6, 8
Curve No.23 DF254 2.5 Ft Fill Height Q/A = 4, 6, 8
Curve No.24 DF254 5 Ft Fill Height Q/A = 4, 6, 8
Curve No.25 DF254 7.5 Ft Fill Height Q/A = 4, 6, 8
Curve No.27 Spaced Tile 3.25 Ft Fill Height Q/A = 4, 6, 8
Curve No.28 Spaced Tile 6.0 Ft Fill Height Q/A = 4, 6, 8

8/9/2019 CTI Sum 06 Journalfinal
http://slidepdf.com/reader/full/cti-sum-06-journalfinal 21/76
CTI Journal, Vol. 27, No. 2 19
8/9/2019 CTI Sum 06 Journalfinal
http://slidepdf.com/reader/full/cti-sum-06-journalfinal 22/76
CTI Journal, Vol. 27, No. 220
8/9/2019 CTI Sum 06 Journalfinal
http://slidepdf.com/reader/full/cti-sum-06-journalfinal 23/76
CTI Journal, Vol. 27, No. 2 21
8/9/2019 CTI Sum 06 Journalfinal
http://slidepdf.com/reader/full/cti-sum-06-journalfinal 24/76
CTI Journal, Vol. 27, No. 222
8/9/2019 CTI Sum 06 Journalfinal
http://slidepdf.com/reader/full/cti-sum-06-journalfinal 25/76
CTI Journal, Vol. 27, No. 2 23
8/9/2019 CTI Sum 06 Journalfinal
http://slidepdf.com/reader/full/cti-sum-06-journalfinal 26/76
CTI Journal, Vol. 27, No. 224

8/9/2019 CTI Sum 06 Journalfinal
http://slidepdf.com/reader/full/cti-sum-06-journalfinal 27/76
CTI Journal, Vol. 27, No. 2 25
8/9/2019 CTI Sum 06 Journalfinal
http://slidepdf.com/reader/full/cti-sum-06-journalfinal 28/76
CTI Journal, Vol. 27, No. 226
8/9/2019 CTI Sum 06 Journalfinal
http://slidepdf.com/reader/full/cti-sum-06-journalfinal 29/76
CTI Journal, Vol. 27, No. 2 27
8/9/2019 CTI Sum 06 Journalfinal
http://slidepdf.com/reader/full/cti-sum-06-journalfinal 30/76
CTI Journal, Vol. 27, No. 228
8/9/2019 CTI Sum 06 Journalfinal
http://slidepdf.com/reader/full/cti-sum-06-journalfinal 31/76
CTI Journal, Vol. 27, No. 2 29
8/9/2019 CTI Sum 06 Journalfinal
http://slidepdf.com/reader/full/cti-sum-06-journalfinal 32/76
CTI Journal, Vol. 27, No. 230

8/9/2019 CTI Sum 06 Journalfinal
http://slidepdf.com/reader/full/cti-sum-06-journalfinal 33/76
CTI Journal, Vol. 27, No. 2 31
8/9/2019 CTI Sum 06 Journalfinal
http://slidepdf.com/reader/full/cti-sum-06-journalfinal 34/76
CTI Journal, Vol. 27, No. 232

8/9/2019 CTI Sum 06 Journalfinal
http://slidepdf.com/reader/full/cti-sum-06-journalfinal 35/76
CTI Journal, Vol. 27, No. 2 33
8/9/2019 CTI Sum 06 Journalfinal
http://slidepdf.com/reader/full/cti-sum-06-journalfinal 36/76
CTI Journal, Vol. 27, No. 234
David M. Suptic P.E. LLC
Abstract :Faced with multiple gear reducer
failures on two large cooling tow-
ers, an international power genera-
tion facility replaced 28 sets of rear
reduction drives and supporting
structure with new, upgraded equip-
ment. A description of the unique
nature of this large scale equipment
replacement project provides the
reader with several key steps to
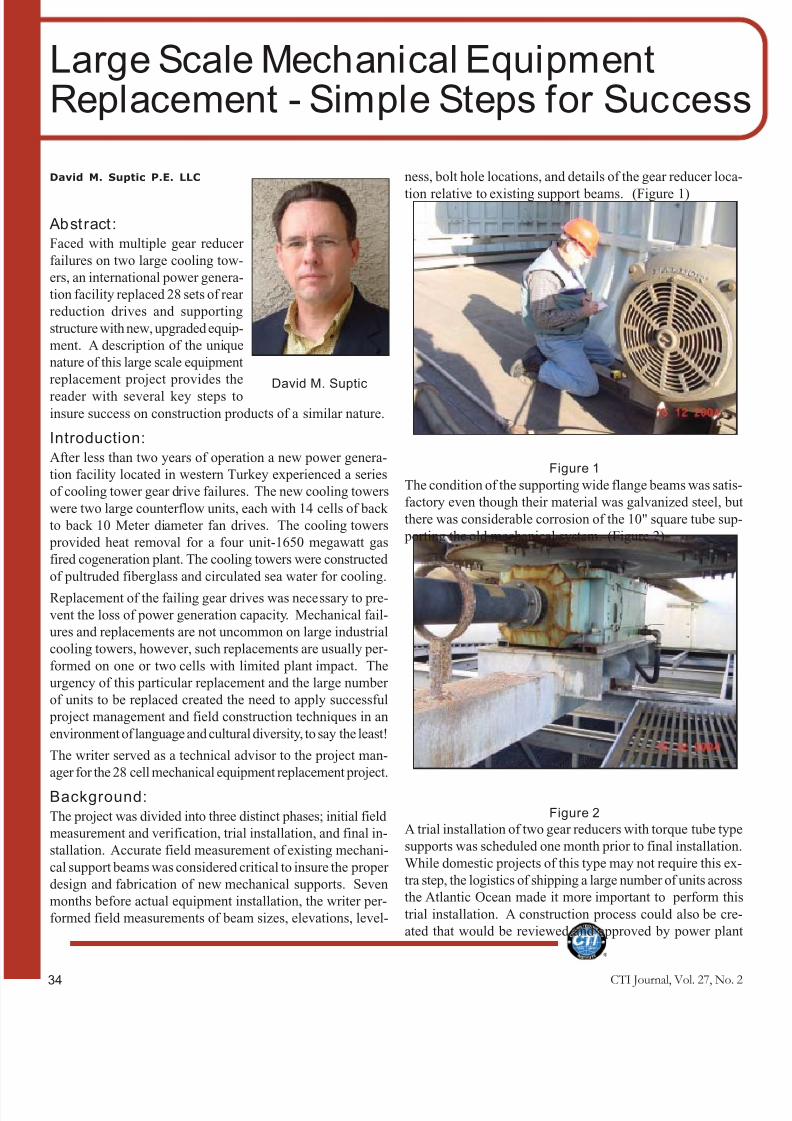
ness, bolt hole locations, and details of the gear reducer loca-
tion relative to existing support beams. (Figure 1)
Large Scale Mechanical EquipmentReplacement - Simple Steps for Success
insure success on construction products of a similar nature.
Introduction:After less than two years of operation a new power genera-
tion facility located in western Turkey experienced a series
of cooling tower gear drive failures. The new cooling towers
were two large counterflow units, each with 14 cells of back
to back 10 Meter diameter fan drives. The cooling towers
provided heat removal for a four unit-1650 megawatt gas
fired cogeneration plant. The cooling towers were constructed
of pultruded fiberglass and circulated sea water for cooling.
Replacement of the failing gear drives was necessary to pre-
vent the loss of power generation capacity. Mechanical fail-
ures and replacements are not uncommon on large industrial
cooling towers, however, such replacements are usually per-
formed on one or two cells with limited plant impact. The
urgency of this particular replacement and the large number
of units to be replaced created the need to apply successful
project management and field construction techniques in an
environment of language and cultural diversity, to say the least!
The writer served as a technical advisor to the project man-
ager for the 28 cell mechanical equipment replacement project.
Background:The project was divided into three distinct phases; initial field
measurement and verification, trial installation, and final in-
stallation. Accurate field measurement of existing mechani-
cal support beams was considered critical to insure the proper
design and fabrication of new mechanical supports. Seven
months before actual equipment installation, the writer per-
formed field measurements of beam sizes, elevations, level-
Figure 1
The condition of the supporting wide flange beams was satis-
factory even though their material was galvanized steel, bu
there was considerable corrosion of the 10" square tube sup-
porting the old mechanical system. (Figure 2)
Figure 2
A trial installation of two gear reducers with torque tube type
supports was scheduled one month prior to final installation
While domestic projects of this type may not require this ex-
tra step, the logistics of shipping a large number of units across
the Atlantic Ocean made it more important to perform this
trial installation. A construction process could also be cre
ated that would be reviewed and approved by power plan
David M. Suptic

8/9/2019 CTI Sum 06 Journalfinal
http://slidepdf.com/reader/full/cti-sum-06-journalfinal 37/76
CTI Journal, Vol. 27, No. 2 35

8/9/2019 CTI Sum 06 Journalfinal
http://slidepdf.com/reader/full/cti-sum-06-journalfinal 38/76
CTI Journal, Vol. 27, No. 236
8/9/2019 CTI Sum 06 Journalfinal
http://slidepdf.com/reader/full/cti-sum-06-journalfinal 39/76
CTI Journal, Vol. 27, No. 2 37
8/9/2019 CTI Sum 06 Journalfinal
http://slidepdf.com/reader/full/cti-sum-06-journalfinal 40/76
CTI Journal, Vol. 27, No. 238
managers. The local workers would also have an opportunity
to learn the process of cooling tower construction before full
scale installation.
Final installation was planned for July 2005. Unfortunately
the weather during July in western Turkey is very hot, up to
40 degrees C (104 degrees F). This hot temperature would
impact the construction schedule but worker safety was very
important. The work crew consisted of 17 Turkish carpen-
ters and one construction foreman who was experienced with power plant construction. None of the workers spoke En-
glish or were able to read drawings. The foreman spoke
broken English and was able to instruct workers on the proper
cooling tower construction methods. Two plant engineers
assisted with communication and coordination with plant op-
erations personnel. The engineers spoke fluent English.
Two 50 Ton cranes were used in the final construction phase,
one at each cooling tower. The work crews were split evenly
between the two towers. Only one cell on each tower could
be shut down at a time to keep the plant on line. Work was
initially scheduled for 12 hours per day, six days per week.
The high heat forced the schedule be relaxed to nine hour
days. The project manager believed the total project could be
completed within 18 working days. A construction process
was needed that would produce a safe job with a minimum of
delays.
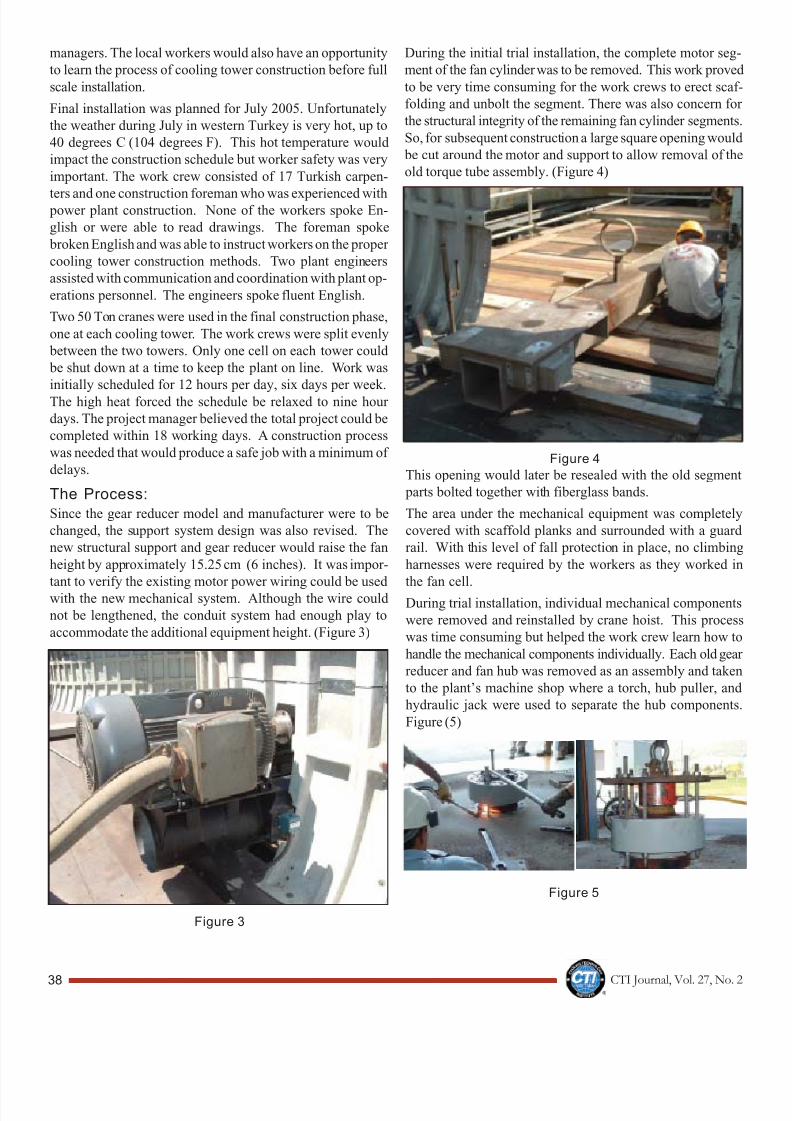
The Process:Since the gear reducer model and manufacturer were to be
changed, the support system design was also revised. The
new structural support and gear reducer would raise the fan
height by approximately 15.25 cm (6 inches). It was impor-
tant to verify the existing motor power wiring could be used
with the new mechanical system. Although the wire could
not be lengthened, the conduit system had enough play to
accommodate the additional equipment height. (Figure 3)
Figure 3
During the initial trial installation, the complete motor seg-
ment of the fan cylinder was to be removed. This work proved
to be very time consuming for the work crews to erect scaf-
folding and unbolt the segment. There was also concern for
the structural integrity of the remaining fan cylinder segments
So, for subsequent construction a large square opening would
be cut around the motor and support to allow removal of the
old torque tube assembly. (Figure 4)
Figure 4
This opening would later be resealed with the old segment
parts bolted together with fiberglass bands.
The area under the mechanical equipment was completely
covered with scaffold planks and surrounded with a guard
rail. With this level of fall protection in place, no climbing
harnesses were required by the workers as they worked in
the fan cell.
During trial installation, individual mechanical components
were removed and reinstalled by crane hoist. This process
was time consuming but helped the work crew learn how to
handle the mechanical components individually. Each old gear
reducer and fan hub was removed as an assembly and taken
to the plant’s machine shop where a torch, hub puller, and
hydraulic jack were used to separate the hub components
Figure (5)
Figure 5
8/9/2019 CTI Sum 06 Journalfinal
http://slidepdf.com/reader/full/cti-sum-06-journalfinal 41/76
CTI Journal, Vol. 27, No. 2 39
8/9/2019 CTI Sum 06 Journalfinal
http://slidepdf.com/reader/full/cti-sum-06-journalfinal 42/76
CTI Journal, Vol. 27, No. 240
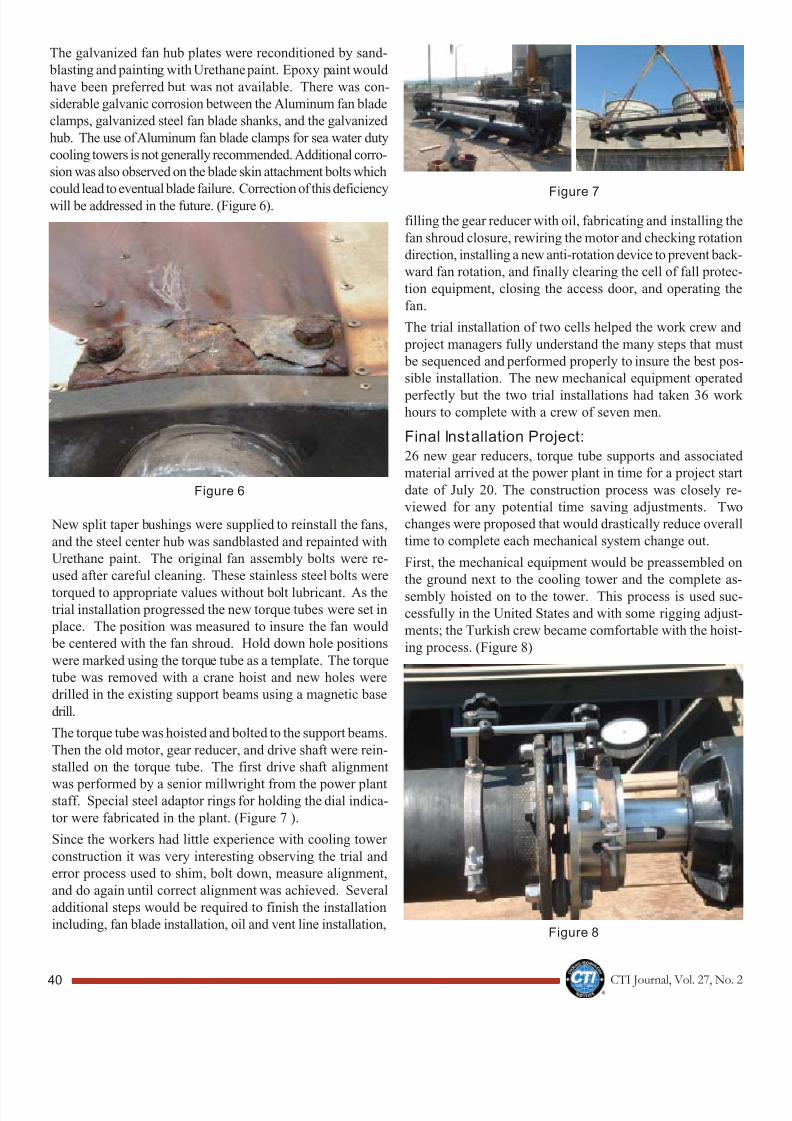
The galvanized fan hub plates were reconditioned by sand-
blasting and painting with Urethane paint. Epoxy paint would
have been preferred but was not available. There was con-
siderable galvanic corrosion between the Aluminum fan blade
clamps, galvanized steel fan blade shanks, and the galvanized
hub. The use of Aluminum fan blade clamps for sea water duty
cooling towers is not generally recommended. Additional corro-
sion was also observed on the blade skin attachment bolts which
could lead to eventual blade failure. Correction of this deficiency
will be addressed in the future. (Figure 6).filling the gear reducer with oil, fabricating and installing the
fan shroud closure, rewiring the motor and checking rotation
direction, installing a new anti-rotation device to prevent back-
ward fan rotation, and finally clearing the cell of fall protec-
tion equipment, closing the access door, and operating the
fan.
The trial installation of two cells helped the work crew and
project managers fully understand the many steps that mus
be sequenced and performed properly to insure the best pos
sible installation. The new mechanical equipment operated
perfectly but the two trial installations had taken 36 workhours to complete with a crew of seven men.
Final Installation Project:26 new gear reducers, torque tube supports and associated
material arrived at the power plant in time for a project start
date of July 20. The construction process was closely re-
viewed for any potential time saving adjustments. Two
changes were proposed that would drastically reduce overal
time to complete each mechanical system change out.
First, the mechanical equipment would be preassembled on
the ground next to the cooling tower and the complete as-
sembly hoisted on to the tower. This process is used suc-
cessfully in the United States and with some rigging adjust
ments; the Turkish crew became comfortable with the hoist-
ing process. (Figure 8)
Figure 7
Figure 6
New split taper bushings were supplied to reinstall the fans,
and the steel center hub was sandblasted and repainted with
Urethane paint. The original fan assembly bolts were re-
used after careful cleaning. These stainless steel bolts were
torqued to appropriate values without bolt lubricant. As thetrial installation progressed the new torque tubes were set in
place. The position was measured to insure the fan would
be centered with the fan shroud. Hold down hole positions
were marked using the torque tube as a template. The torque
tube was removed with a crane hoist and new holes were
drilled in the existing support beams using a magnetic base
drill.
The torque tube was hoisted and bolted to the support beams.
Then the old motor, gear reducer, and drive shaft were rein-
stalled on the torque tube. The first drive shaft alignment
was performed by a senior millwright from the power plantstaff. Special steel adaptor rings for holding the dial indica-
tor were fabricated in the plant. (Figure 7 ).
Since the workers had little experience with cooling tower
construction it was very interesting observing the trial and
error process used to shim, bolt down, measure alignment,
and do again until correct alignment was achieved. Several
additional steps would be required to finish the installation
including, fan blade installation, oil and vent line installation,Figure 8

8/9/2019 CTI Sum 06 Journalfinal
http://slidepdf.com/reader/full/cti-sum-06-journalfinal 43/76
CTI Journal, Vol. 27, No. 2 41
8/9/2019 CTI Sum 06 Journalfinal
http://slidepdf.com/reader/full/cti-sum-06-journalfinal 44/76
CTI Journal, Vol. 27, No. 242
By hoisting the completed “power-pack” all the new gear
reducers could be pre mounted to the torque tubes at ground
level. The, as each old motor and drive shaft became avail-
able during the disassembly phase, the power pack assembly
could be completed including initial drive shaft alignment.
One key to success when replacing multiple sets of mechani-
cal equipment is to perform as much work as possible on the
ground. This is especially valid in hot weather because the
work is much more difficult inside the fan shroud with 100%cooling tower humidity surrounding the workers. Workers
inside the fan cell required frequent breaks to prevent heat
exhaustion.
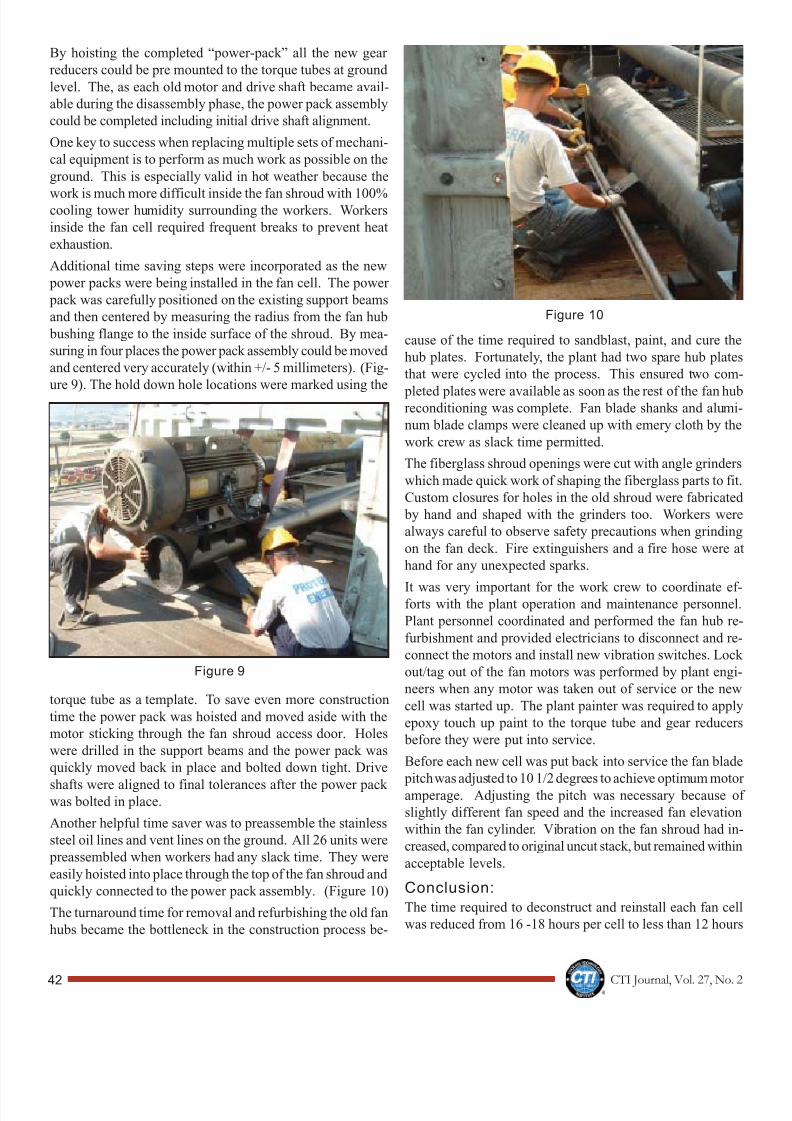
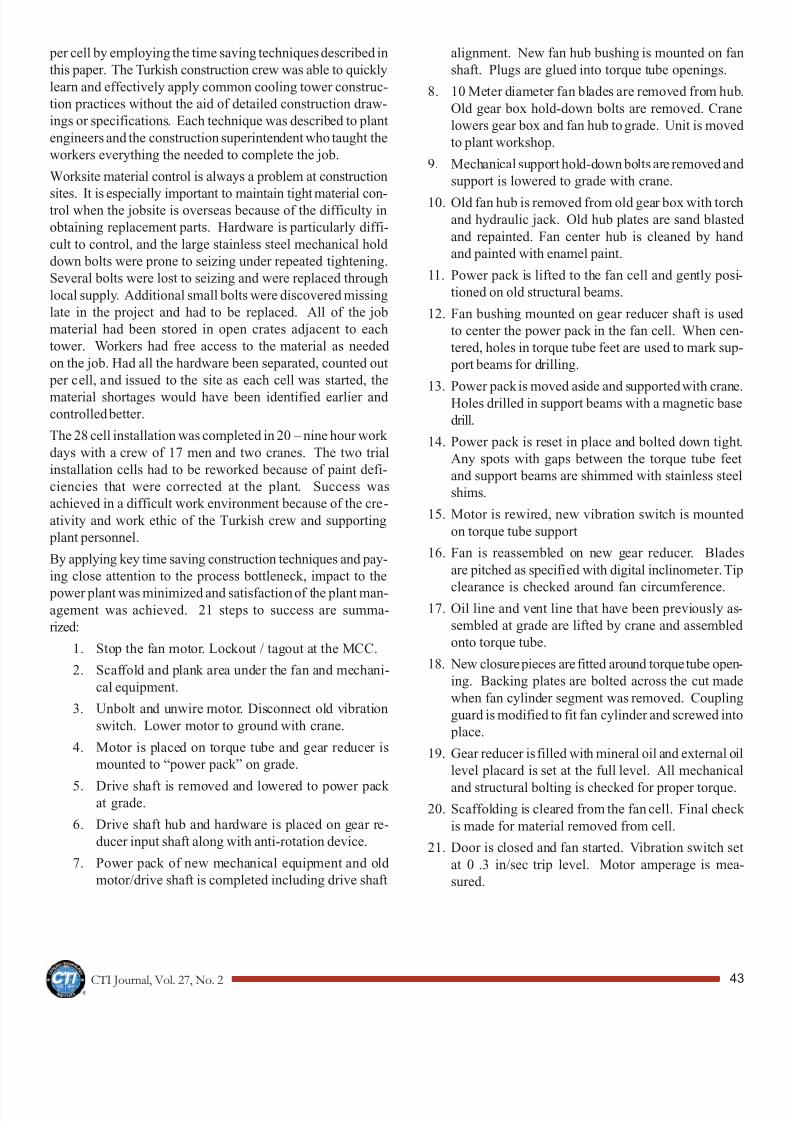
Additional time saving steps were incorporated as the new
power packs were being installed in the fan cell. The power
pack was carefully positioned on the existing support beams
and then centered by measuring the radius from the fan hub
bushing flange to the inside surface of the shroud. By mea-
suring in four places the power pack assembly could be moved
and centered very accurately (within +/- 5 millimeters). (Fig-
ure 9). The hold down hole locations were marked using the
cause of the time required to sandblast, paint, and cure the
hub plates. Fortunately, the plant had two spare hub plates
that were cycled into the process. This ensured two com
pleted plates were available as soon as the rest of the fan hubreconditioning was complete. Fan blade shanks and alumi-
num blade clamps were cleaned up with emery cloth by the
work crew as slack time permitted.
The fiberglass shroud openings were cut with angle grinders
which made quick work of shaping the fiberglass parts to fit
Custom closures for holes in the old shroud were fabricated
by hand and shaped with the grinders too. Workers were
always careful to observe safety precautions when grinding
on the fan deck. Fire extinguishers and a fire hose were a
hand for any unexpected sparks.
It was very important for the work crew to coordinate ef-forts with the plant operation and maintenance personnel
Plant personnel coordinated and performed the fan hub re
furbishment and provided electricians to disconnect and re-
connect the motors and install new vibration switches. Lock
out/tag out of the fan motors was performed by plant engi-
neers when any motor was taken out of service or the new
cell was started up. The plant painter was required to apply
epoxy touch up paint to the torque tube and gear reducers
before they were put into service.
Before each new cell was put back into service the fan blade
pitch was adjusted to 10 1/2 degrees to achieve optimum moto
amperage. Adjusting the pitch was necessary because o
slightly different fan speed and the increased fan elevation
within the fan cylinder. Vibration on the fan shroud had in
creased, compared to original uncut stack, but remained within
acceptable levels.
Conclusion:The time required to deconstruct and reinstall each fan cel
was reduced from 16 -18 hours per cell to less than 12 hours
Figure 10
Figure 9
torque tube as a template. To save even more construction
time the power pack was hoisted and moved aside with the
motor sticking through the fan shroud access door. Holes
were drilled in the support beams and the power pack was
quickly moved back in place and bolted down tight. Drive
shafts were aligned to final tolerances after the power pack was bolted in place.
Another helpful time saver was to preassemble the stainless
steel oil lines and vent lines on the ground. All 26 units were
preassembled when workers had any slack time. They were
easily hoisted into place through the top of the fan shroud and
quickly connected to the power pack assembly. (Figure 10)
The turnaround time for removal and refurbishing the old fan
hubs became the bottleneck in the construction process be-
8/9/2019 CTI Sum 06 Journalfinal
http://slidepdf.com/reader/full/cti-sum-06-journalfinal 45/76
8/9/2019 CTI Sum 06 Journalfinal
http://slidepdf.com/reader/full/cti-sum-06-journalfinal 46/76
CTI Journal, Vol. 27, No. 244
By Gene Ort, Internet Marketing JV
AbstractYou have a better chance of winning at roulette
than protecting your cooling towers with mechani-
cal vibration switches. The odds at roulette are
relatively straight forward. There are 36 numbers
with which you might win plus two sure-loss
“house numbers”: 0 & 00. If you play just num-
bers with a payoff of 35 to 1 for a win, long-term,
you probably lose 5.26% of your money. That’s
like a mortgage without the house.
The odds of protecting your cooling towers with
mechanical vibration switches from excessive vi-
bration are more difficult to calculate. But they
are so poor, precision isn’t necessary to make the point. It is tempting to para-phrase the old say-
It’s the old 80-20 rule but in reverse: 80% of the
switches handle 20% of the problems. The resof the time, they are clueless. Why do you
think we call them “earthquake switches”?
The Nature of the ProblemIn many plants, cooling towers are still consid
ered BOP (Balance of Plant) meaning they de-
serve less investment and attention than more
critical machines: a legacy from the times of
less plant efficiency and substantial excess
cooling capacity. Now, there is greater produc
tion efficiency and less capital spent on cool-
ing towers. Excess cooling capacity has dimin
ished. In many plants, if you lose a cooling
Roulette And Mechanical VibrationSwitches: What Are Your Odds?
ing, “Close only counts in horseshoes, hand grenades, and me-
chanical vibration switches”, but that does a disservice to horse-
shoes.
In many plants, cooling towers are no longer balance of plant (BOP)
equipment worthy of only “symbolic”, minimal, or lowest cost pro-
tection from excessive vibration. Losing a cell in the heat of sum-
mer can reduce production throughput. With their increasing sig-
nificance, cooling towers require better protection than afforded
by mechanical vibration switches. With any reasonable definition
of “protection”, a case will be made that mechanical vibration
switches, called “earthquake switches” in the trade, may offer no protection at all from the excessive vibration of the rotating equip-
ment in your cooling towers. Mechanical vibration switches do
sense shock. They sense vibration at very high levels or high rpm
and may give notice that a disastrous failure has just occurred.
Better solutions will be listed with pros and cons.
Introduction: It’s Your Choice- Effective Cooling Tower Protection
or Disaster Confirmation
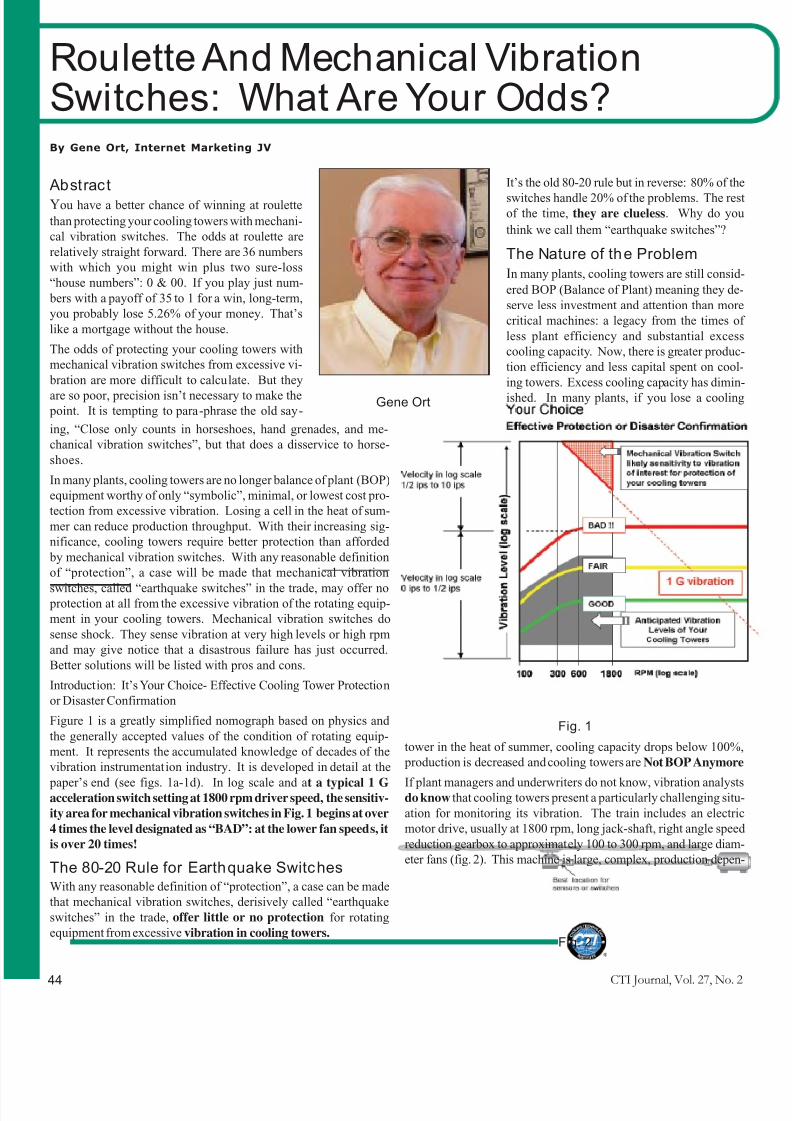
Figure 1 is a greatly simplified nomograph based on physics and
the generally accepted values of the condition of rotating equip-
ment. It represents the accumulated knowledge of decades of the
vibration instrumentation industry. It is developed in detail at the
paper’s end (see figs. 1a-1d). In log scale and at a typical 1 Gacceleration switch setting at 1800 rpm driver speed, the sensitiv-
ity area for mechanical vibration switches in Fig. 1 begins at over
4 times the level designated as “BAD”: at the lower fan speeds, it
is over 20 times!
The 80-20 Rule for Earthquake SwitchesWith any reasonable definition of “protection”, a case can be made
that mechanical vibration switches, derisively called “earthquake
switches” in the trade, offer little or no protection for rotating
equipment from excessive vibration in cooling towers.
Fig. 1
tower in the heat of summer, cooling capacity drops below 100%
production is decreased and cooling towers are Not BOP Anymore
If plant managers and underwriters do not know, vibration analystsdo know that cooling towers present a particularly challenging situ
ation for monitoring its vibration. The train includes an electric
motor drive, usually at 1800 rpm, long jack-shaft, right angle speed
reduction gearbox to approximately 100 to 300 rpm, and large diam
eter fans (fig. 2). This machine is large, complex, production depen
Gene Ort
Fig. 2
8/9/2019 CTI Sum 06 Journalfinal
http://slidepdf.com/reader/full/cti-sum-06-journalfinal 47/76
CTI Journal, Vol. 27, No. 2 45
8/9/2019 CTI Sum 06 Journalfinal
http://slidepdf.com/reader/full/cti-sum-06-journalfinal 48/76
CTI Journal, Vol. 27, No. 246
dant and may be the last machine in your plant on which you want
a mechanical vibration switch. But 15,000 to 20,000 mechanical
vibration switches go into service every year: most on cooling tow-
ers.
The Scope of the ProblemThere could be over a quarter-million mechanical vibration switches
out there. There are three major manufacturers of mechanical vibra-
tion switches which are typically sold to cooling tower manufactur-
ers (OEMs) in substantial volume. One switch manufacturer claimed on their web site that 125,000 switches have been installed. There
are likely over 15-20,000 new switches going into service every
year. In addition, there is also a switch that uses a pedestal and ball
with a chain to a switch. If the tower shakes enough, the ball falls
off the pedestal to initiate the switch action, to be reset by hand.
TerminologyIn the development of figure 1 and the basic vibration information
that follows, four terms are used:
1. frequency (in cpm= cycles per minute or RPM = cycles at
running speed)
2. acceleration (in Gs)
3. velocity (in ips = inches per second)
4. displacement (in mils peak to peak)
They refer to the movement of points on the machine and are re-
lated by physics. Given frequency and one point, the other two can
be calculated and shown on the graph.
Accepted Use of These TermsBy their design, mechanical vibration switches are sensitive to ac-
celeration only. There is no signal from which to generate more
meaningful information about a machine’s operating condition and
generate meaningful alarm levels.
Electronic switches and monitors use an accelerometer to produce
a “dynamic signal” containing all the significant contributors of interest. This signal can be used with instrumentation to:
1. Develop overall vibration (not shock values)
a. In terms of acceleration
b. Be integrated to show overall vibration in velocity
c. Be integrated again to show overall vibration in
displacement (not recommended)
2. Use the “waveform” (complex signal) for analysis
3. Develop spectra of the various contributors to vibration
for analysis.
Debunking Eight MythsBy misusing the terminology above, some myths developed over
the years about the design, suitability for the purpose and accuracy
of mechanical vibration switches, especially as they relate to cool-
ing tower protection.
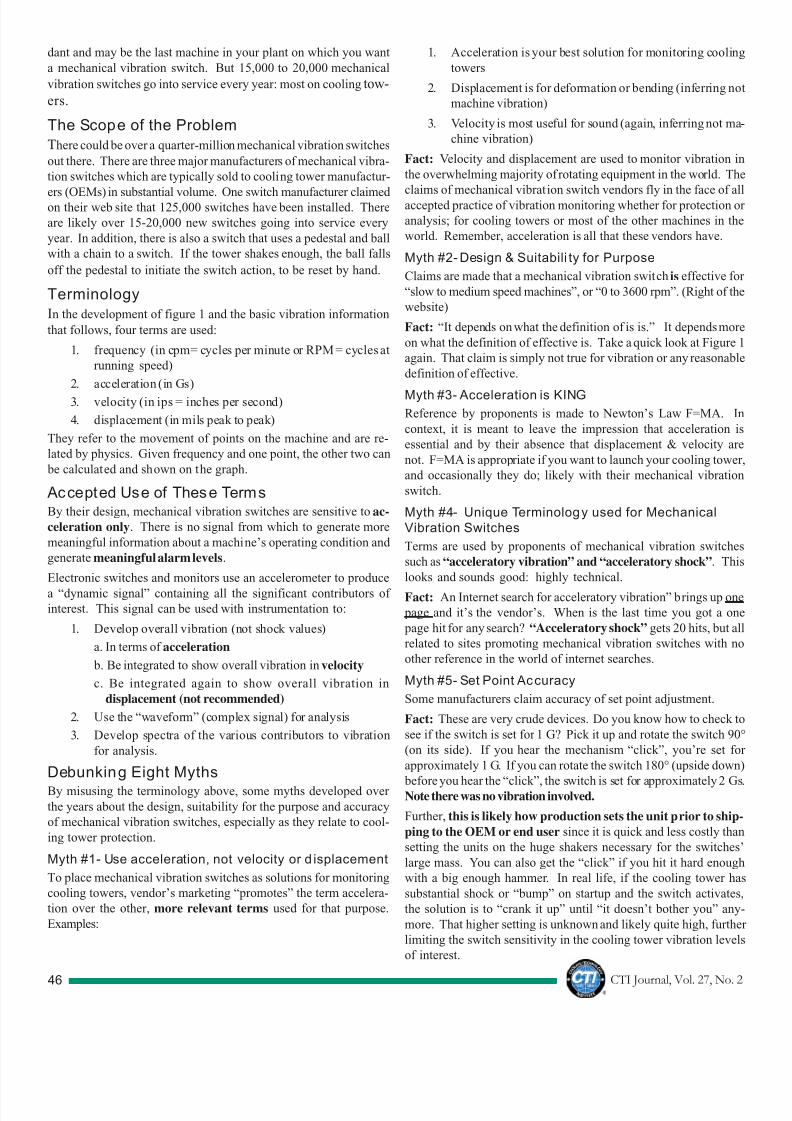
Myth #1- Use acceleration, not velocity or d isplacement
To place mechanical vibration switches as solutions for monitoring
cooling towers, vendor’s marketing “promotes” the term accelera-
tion over the other, more relevant terms used for that purpose.
Examples:
1. Acceleration is your best solution for monitoring cooling
towers
2. Displacement is for deformation or bending (inferring no
machine vibration)
3. Velocity is most useful for sound (again, inferring not ma
chine vibration)
Fact: Velocity and displacement are used to monitor vibration in
the overwhelming majority of rotating equipment in the world. The
claims of mechanical vibration switch vendors fly in the face of alaccepted practice of vibration monitoring whether for protection or
analysis; for cooling towers or most of the other machines in the
world. Remember, acceleration is all that these vendors have.
Myth #2- Design & Suitabili ty for Purpose
Claims are made that a mechanical vibration switch is effective for
“slow to medium speed machines”, or “0 to 3600 rpm”. (Right of the
website)
Fact: “It depends on what the definition of is is.” It depends more
on what the definition of effective is. Take a quick look at Figure 1
again. That claim is simply not true for vibration or any reasonable
definition of effective.
Myth #3- Acceleration is KINGReference by proponents is made to Newton’s Law F=MA. In
context, it is meant to leave the impression that acceleration is
essential and by their absence that displacement & velocity are
not. F=MA is appropriate if you want to launch your cooling tower
and occasionally they do; likely with their mechanical vibration
switch.
Myth #4- Unique Terminology used for MechanicalVibration Switches
Terms are used by proponents of mechanical vibration switches
such as “acceleratory vibration” and “acceleratory shock”. This
looks and sounds good: highly technical.
Fact: An Internet search for acceleratory vibration” brings up one
page and it’s the vendor’s. When is the last time you got a one
page hit for any search? “Acceleratory shock” gets 20 hits, but al
related to sites promoting mechanical vibration switches with no
other reference in the world of internet searches.
Myth #5- Set Point Accuracy
Some manufacturers claim accuracy of set point adjustment.
Fact: These are very crude devices. Do you know how to check to
see if the switch is set for 1 G? Pick it up and rotate the switch 90°
(on its side). If you hear the mechanism “click”, you’re set fo
approximately 1 G. If you can rotate the switch 180° (upside down)
before you hear the “click”, the switch is set for approximately 2 GsNote there was no vibration involved.
Further, this is likely how production sets the unit prior to ship
ping to the OEM or end user since it is quick and less costly than
setting the units on the huge shakers necessary for the switches
large mass. You can also get the “click” if you hit it hard enough
with a big enough hammer. In real life, if the cooling tower ha
substantial shock or “bump” on startup and the switch activates
the solution is to “crank it up” until “it doesn’t bother you” any-
more. That higher setting is unknown and likely quite high, furthe
limiting the switch sensitivity in the cooling tower vibration levels
of interest.
8/9/2019 CTI Sum 06 Journalfinal
http://slidepdf.com/reader/full/cti-sum-06-journalfinal 49/76
CTI Journal, Vol. 27, No. 2 47
8/9/2019 CTI Sum 06 Journalfinal
http://slidepdf.com/reader/full/cti-sum-06-journalfinal 50/76
CTI Journal, Vol. 27, No. 248
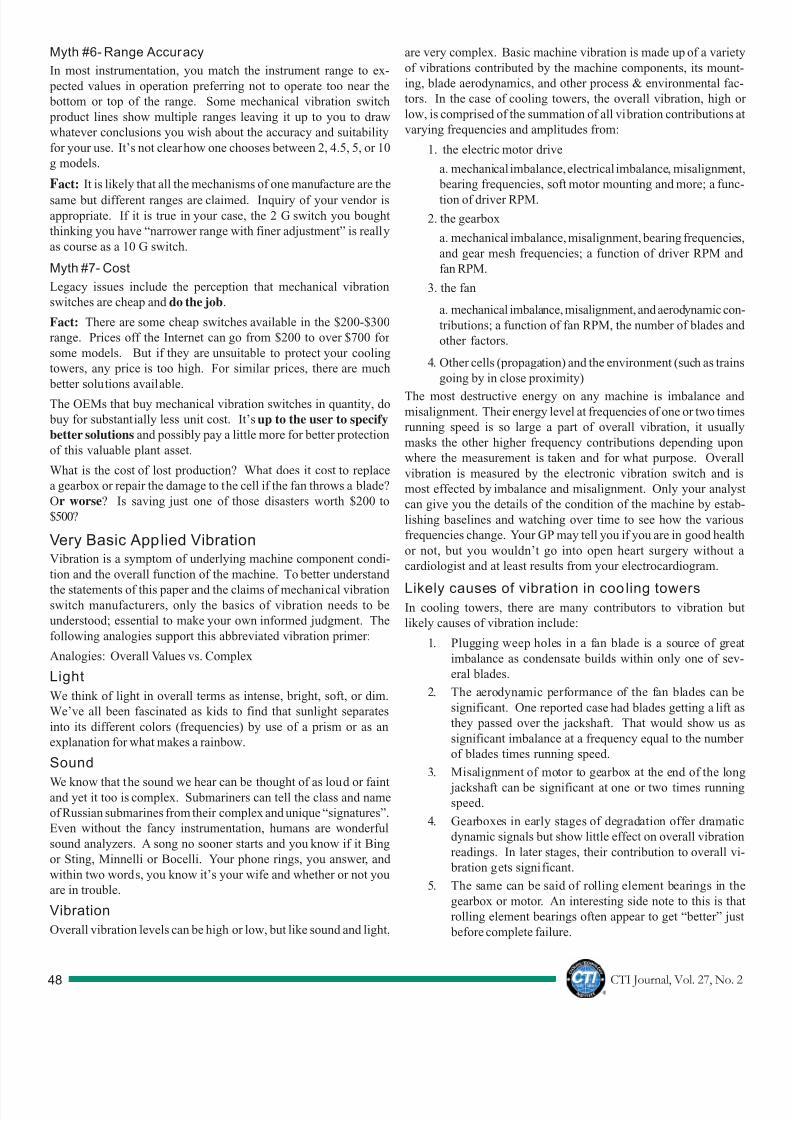
Myth #6- Range Accuracy
In most instrumentation, you match the instrument range to ex-
pected values in operation preferring not to operate too near the
bottom or top of the range. Some mechanical vibration switch
product lines show multiple ranges leaving it up to you to draw
whatever conclusions you wish about the accuracy and suitability
for your use. It’s not clear how one chooses between 2, 4.5, 5, or 10
g models.
Fact: It is likely that all the mechanisms of one manufacture are the
same but different ranges are claimed. Inquiry of your vendor isappropriate. If it is true in your case, the 2 G switch you bought
thinking you have “narrower range with finer adjustment” is really
as course as a 10 G switch.
Myth #7- Cost
Legacy issues include the perception that mechanical vibration
switches are cheap and do the job.
Fact: There are some cheap switches available in the $200-$300
range. Prices off the Internet can go from $200 to over $700 for
some models. But if they are unsuitable to protect your cooling
towers, any price is too high. For similar prices, there are much
better solutions available.
The OEMs that buy mechanical vibration switches in quantity, do
buy for substantially less unit cost. It’s up to the user to specify
better solutions and possibly pay a little more for better protection
of this valuable plant asset.
What is the cost of lost production? What does it cost to replace
a gearbox or repair the damage to the cell if the fan throws a blade?
Or worse? Is saving just one of those disasters worth $200 to
$500?
Very Basic Applied VibrationVibration is a symptom of underlying machine component condi-
tion and the overall function of the machine. To better understand
the statements of this paper and the claims of mechanical vibrationswitch manufacturers, only the basics of vibration needs to be
understood; essential to make your own informed judgment. The
following analogies support this abbreviated vibration primer:
Analogies: Overall Values vs. Complex
Light
We think of light in overall terms as intense, bright, soft, or dim.
We’ve all been fascinated as kids to find that sunlight separates
into its different colors (frequencies) by use of a prism or as an
explanation for what makes a rainbow.
Sound
We know that the sound we hear can be thought of as loud or faintand yet it too is complex. Submariners can tell the class and name
of Russian submarines from their complex and unique “signatures”.
Even without the fancy instrumentation, humans are wonderful
sound analyzers. A song no sooner starts and you know if it Bing
or Sting, Minnelli or Bocelli. Your phone rings, you answer, and
within two words, you know it’s your wife and whether or not you
are in trouble.
Vibration
Overall vibration levels can be high or low, but like sound and light,
are very complex. Basic machine vibration is made up of a variety
of vibrations contributed by the machine components, its mount-
ing, blade aerodynamics, and other process & environmental fac-
tors. In the case of cooling towers, the overall vibration, high o
low, is comprised of the summation of all vibration contributions a
varying frequencies and amplitudes from:
1. the electric motor drive
a. mechanical imbalance, electrical imbalance, misalignment
bearing frequencies, soft motor mounting and more; a func
tion of driver RPM.
2. the gearbox
a. mechanical imbalance, misalignment, bearing frequencies
and gear mesh frequencies; a function of driver RPM and
fan RPM.
3. the fan
a. mechanical imbalance, misalignment, and aerodynamic con
tributions; a function of fan RPM, the number of blades and
other factors.
4. Other cells (propagation) and the environment (such as trains
going by in close proximity)
The most destructive energy on any machine is imbalance andmisalignment. Their energy level at frequencies of one or two times
running speed is so large a part of overall vibration, it usually
masks the other higher frequency contributions depending upon
where the measurement is taken and for what purpose. Overal
vibration is measured by the electronic vibration switch and is
most effected by imbalance and misalignment. Only your analys
can give you the details of the condition of the machine by estab
lishing baselines and watching over time to see how the various
frequencies change. Your GP may tell you if you are in good health
or not, but you wouldn’t go into open heart surgery without a
cardiologist and at least results from your electrocardiogram.
Likely causes of vibration in coo ling towersIn cooling towers, there are many contributors to vibration bu
likely causes of vibration include:
1. Plugging weep holes in a fan blade is a source of grea
imbalance as condensate builds within only one of sev-
eral blades.
2. The aerodynamic performance of the fan blades can be
significant. One reported case had blades getting a lift as
they passed over the jackshaft. That would show us a
significant imbalance at a frequency equal to the number
of blades times running speed.
3. Misalignment of motor to gearbox at the end of the long
jackshaft can be significant at one or two times runningspeed.
4. Gearboxes in early stages of degradation offer dramatic
dynamic signals but show little effect on overall vibration
readings. In later stages, their contribution to overall vi
bration gets significant.
5. The same can be said of rolling element bearings in the
gearbox or motor. An interesting side note to this is tha
rolling element bearings often appear to get “better” jus
before complete failure.

8/9/2019 CTI Sum 06 Journalfinal
http://slidepdf.com/reader/full/cti-sum-06-journalfinal 51/76
CTI Journal, Vol. 27, No. 2 49
8/9/2019 CTI Sum 06 Journalfinal
http://slidepdf.com/reader/full/cti-sum-06-journalfinal 52/76

8/9/2019 CTI Sum 06 Journalfinal
http://slidepdf.com/reader/full/cti-sum-06-journalfinal 53/76
CTI Journal, Vol. 27, No. 2 51
8/9/2019 CTI Sum 06 Journalfinal
http://slidepdf.com/reader/full/cti-sum-06-journalfinal 54/76
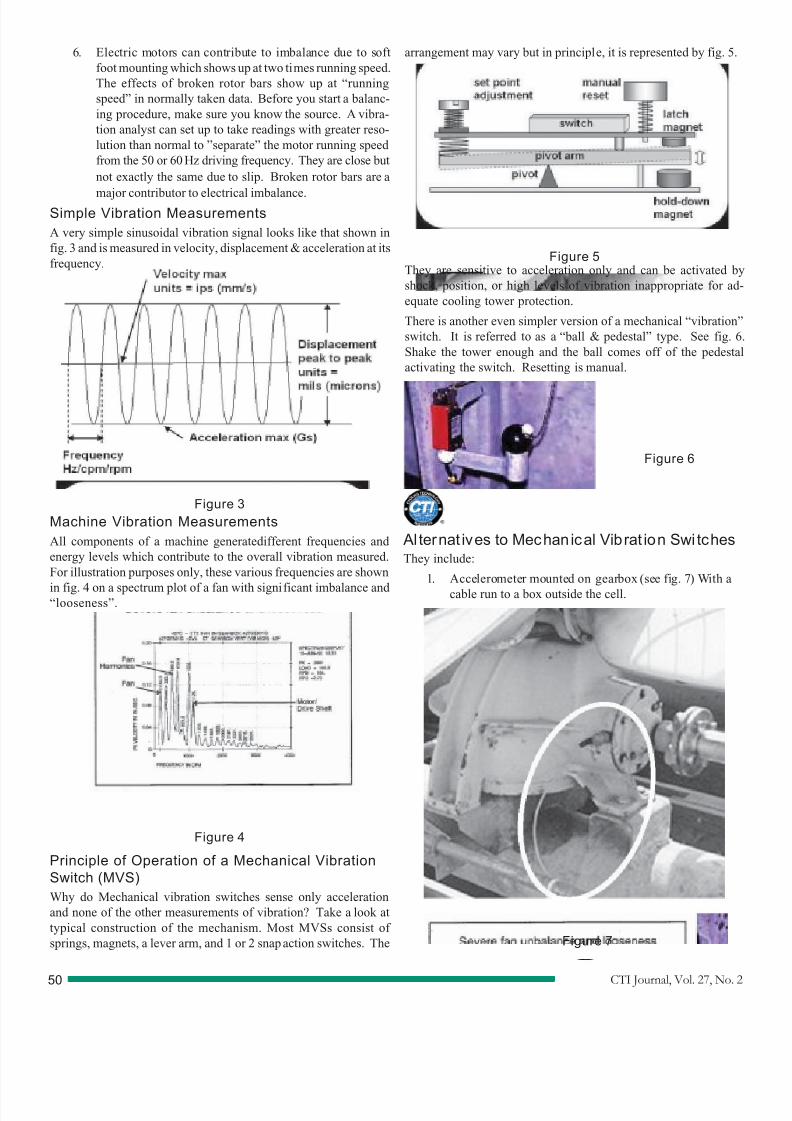
CTI Journal, Vol. 27, No. 252
This is not protection 24/7 but a complement to an
installed vibration switch.
2. Electronic vibration switch mounted on the gearbox
3. Vibration transmitter mounted on the gearbox
4. Single channel monitor mounted outside the cell using an
accelerometer on the gearbox.
5. Dual path monitor using a single installed accelerometer
6. A multi-channel monitor with single or double accelerom-
eters installed per machine train.
Alternatives 2 through 6 offer a substantially superior solution
for protecting cooling towers than do mechanical vibration
switches. They share one thing in common: they use an acceler-
ometer and electronic circuitry to capture the relative dynamic vi-
bration signal and process it to meaningful & useful overall vibra-
tion levels or for analysis when needed.
The electronic switch uses an internal accelerometer and is installed
as a unit. The monitor solutions use external accelerometers mounted
on the gearbox with instrumentation outside the cell.
Are there advantages of electronic switches over mechanical vi-
brations switches? Yes. As standard or optional features, you get:
1. Accurate sensing of the vibration found in the rotatingequipment in cooling towers
2. More precise and relevant alarm and shutdown set-point
adjustability
3. Adjustable time delay to ride through transient events
eliminating the need to run at set points higher than those
needed for prudent protection levels
4. Smaller size that is more appropriate for mounting on the
gearbox directly
5. Easy access to the dynamic signal needed for analysis
and quicker turn around on repairs
6. Valuable cooling tower information to trend and display
on your DCS operator interface.
Important Notes:a. REPLACEMENT OF MVS: If you are going to replace a
mechanical vibration switch, do not remove or disconnect
it before your alternative solution is installed and opera-
tional.
b. LEAVE THE MVS INSTALLED: Consider leaving the me-
chanical vibration switch installed in a “belt and suspend-
ers” approach to protecting a cooling tower: you have
already paid for it. Mechanical switches do sense shock
whereas electronic vibration switches sense vibration and
should have adjustable 3 to 5 second time delays built in
to override short-term episodes. Failure of some compo-nent might occur without vibration being a precursor.
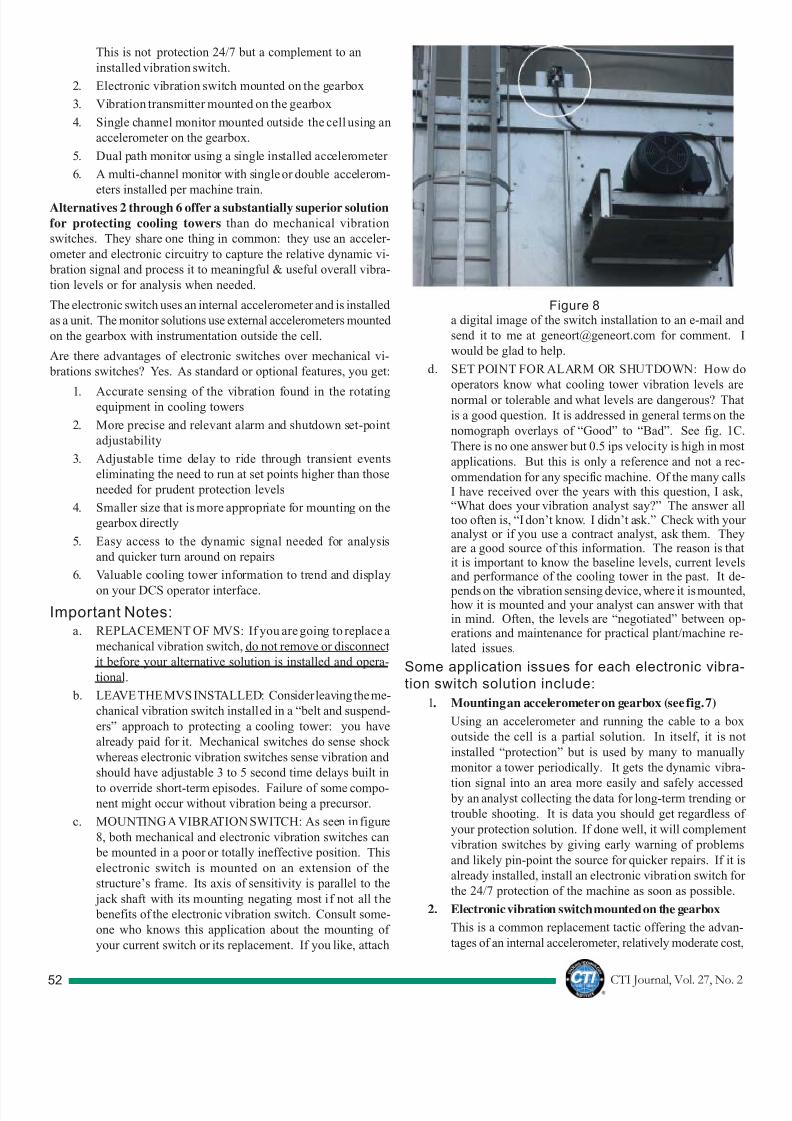
c. MOUNTING A VIBRATION SWITCH: As seen in figure
8, both mechanical and electronic vibration switches can
be mounted in a poor or totally ineffective position. This
electronic switch is mounted on an extension of the
structure’s frame. Its axis of sensitivity is parallel to the
jack shaft with its mounting negating most if not all the
benefits of the electronic vibration switch. Consult some-
one who knows this application about the mounting of
your current switch or its replacement. If you like, attach
a digital image of the switch installation to an e-mail and
send it to me at [email protected] for comment.
would be glad to help.
d. SET POINT FOR ALARM OR SHUTDOWN: How do
operators know what cooling tower vibration levels are
normal or tolerable and what levels are dangerous? Tha
is a good question. It is addressed in general terms on the
nomograph overlays of “Good” to “Bad”. See fig. 1C
There is no one answer but 0.5 ips velocity is high in most
applications. But this is only a reference and not a rec
ommendation for any specific machine. Of the many callI have received over the years with this question, I ask“What does your vibration analyst say?” The answer altoo often is, “I don’t know. I didn’t ask.” Check with youanalyst or if you use a contract analyst, ask them. Theyare a good source of this information. The reason is thait is important to know the baseline levels, current levelsand performance of the cooling tower in the past. It de
pends on the vibration sensing device, where it is mountedhow it is mounted and your analyst can answer with thatin mind. Often, the levels are “negotiated” between operations and maintenance for practical plant/machine re-lated issues.
Some application issues for each electronic vibra-tion switch solution include:
1. Mounting an accelerometer on gearbox (see fig. 7)
Using an accelerometer and running the cable to a box
outside the cell is a partial solution. In itself, it is no
installed “protection” but is used by many to manually
monitor a tower periodically. It gets the dynamic vibra
tion signal into an area more easily and safely accessed by an analyst collecting the data for long-term trending o
trouble shooting. It is data you should get regardless o
your protection solution. If done well, it will complemen
vibration switches by giving early warning of problems
and likely pin-point the source for quicker repairs. If it i
already installed, install an electronic vibration switch for
the 24/7 protection of the machine as soon as possible.
2. Electronic vibration switch mounted on the gearbox
This is a common replacement tactic offering the advan-
tages of an internal accelerometer, relatively moderate cost
Figure 8

8/9/2019 CTI Sum 06 Journalfinal
http://slidepdf.com/reader/full/cti-sum-06-journalfinal 55/76
CTI Journal, Vol. 27, No. 2 53
8/9/2019 CTI Sum 06 Journalfinal
http://slidepdf.com/reader/full/cti-sum-06-journalfinal 56/76
CTI Journal, Vol. 27, No. 254
but if replacing a mechanical vibration switch, requires
power be run to the unit and with some added cost. If the
switch is mounted on the gearbox, it still leaves the ques-
tion of getting that important dynamic signal out to the
vibration specialist.
ADVANCED NOTICE: By the time this paper is distrib-
uted, there will be on the market (or soon to be on the
market) an inexpensive two-wire electronic switch de-
signed specifically to replace mechanical vibration switches
without the sometimes high cost of running added power lines to new powered electronic vibration switches. Just
pull the mechanical switch and install the electronic switch.
It will run off of the same line and you get all the benefits
of an electronic switch.
3. Vibration transmitter mounted on the gearbox
While not common in use on cooling towers, a vibration
transmitter mounted on the gearbox, can be used in con-
junction with a PLC or DCS trending the 4-20mA signal
and giving relay action based on preset alarm and shut-
down levels. Some offer 4-20 mA signal and the dynamic
signal which can be run to a box with a BNC jack for the
analyst although the full range of frequencies for appro-
priate analysis may not be available to the analyst. Cau-
tion is suggested.
4. Single channel monitor mounted outside the cell
Using an existing installed accelerometer or install one
and add a single channel monitor outside the cell. Make
sure the dynamic signal is available for the vibration ana-
lyst. Note the terminology in the industry: A single chan-
nel monitor may be called an electronic vibration switch
with a remote accelerometer. The terms are interchange-
able. The device does the same job.
5. Dual path monitor
This is a solution using a single installed accelerometer
to a monitor that splits the signal and processes it for
both velocity (for the driver speed) and displacement
(for the low speed fan). At 1800 rpm, velocity is the best
choice. For 100 to 600 rpm, displacement is a better
choice. The problem with this solution is that the signal
from the accelerometer is integrated once to get velocity
which is standard industry practice. Double integration
of the signal is required to get displacement and this
gives signals with high noise to signal ratios. This can
be problematic so caution is advised. Worst case: if
tried and problems arise, you can ignore displacement
and still have a full functioning electronic vibration
switch with all of the advantages over mechanicalvibration switches.
6. Multi-channel monitor
Given that multiple cooling tower cells are in a common
structure, there can be advantage to running the signals
from installed accelerometers to a common instrument for
processing. This depends on a comparison of total in-
stalled costs.
Some Notes About Vendors
There are many vendors of electronic vibration switches with good
products that will outperform mechanical vibration switches. Those
who supply both may have compromised their credibility in the
manner in which they market their mechanical offerings. That judg
ment is yours to make. You are welcomed to contact me a
[email protected] or call my cell at 979-739-7279 to find ou
more about products and services available to meet your cooling
tower monitoring needs.
Bio: Gene Ort is a thirty year resident of southeast Texas with amechanical engineering degree & holds two patents. Employmen
history includes working for a major gas turbine and AC motor
manufacturer, and major manufacturers of instrumentation for vi-
bration monitoring of rotating equipment including cooling towers
He has had the training for vibration analyst. Gene successfully
led a project that outfitted an entire grassroots refinery in Thailand
with all of the installed vibration monitoring instrumentation as
well as the portable vibration data-loggers and analysis software
He has spoken to many audiences interested in the protection of
rotating equipment including the Saudi Arabian Chapter of the Vi
bration Institute.
Vibration Nomograph SimplifiedThe “vibration nomograph” referred to in figure 1 at the papers
beginning, is a standard representation of the relationship among
frequency, acceleration, velocity and displacement. It is based
upon physics and I have used it since the early seventies. It is
used in vibration analysis courses as well as by most vibration
instrument manufacturers for the practical application of their prod-
ucts. The only arbitrary data shown are the superimposed lines
labeled from “Good” to “Bad”. This represents the accumulated
knowledge and consensus of what constitutes acceptable vibra-
tion levels for most machines. Example of the conservative nature
of these values. “Bad” is over 0.5 inches/second (ips) velocity.
For the purpose of this paper and its relatively narrower scope, thegraph is simplified in steps illustrated in figures 1a through 1d tha
follow. If you are familiar with the subject, reading further on is no
necessary. If you are not familiar with the subject, it does not take
great study to see the logic of the argument.
Co n t i n u e d o n p a g e 5 6
8/9/2019 CTI Sum 06 Journalfinal
http://slidepdf.com/reader/full/cti-sum-06-journalfinal 57/76
CTI Journal, Vol. 27, No. 2 55
8/9/2019 CTI Sum 06 Journalfinal
http://slidepdf.com/reader/full/cti-sum-06-journalfinal 58/76
CTI Journal, Vol. 27, No. 256
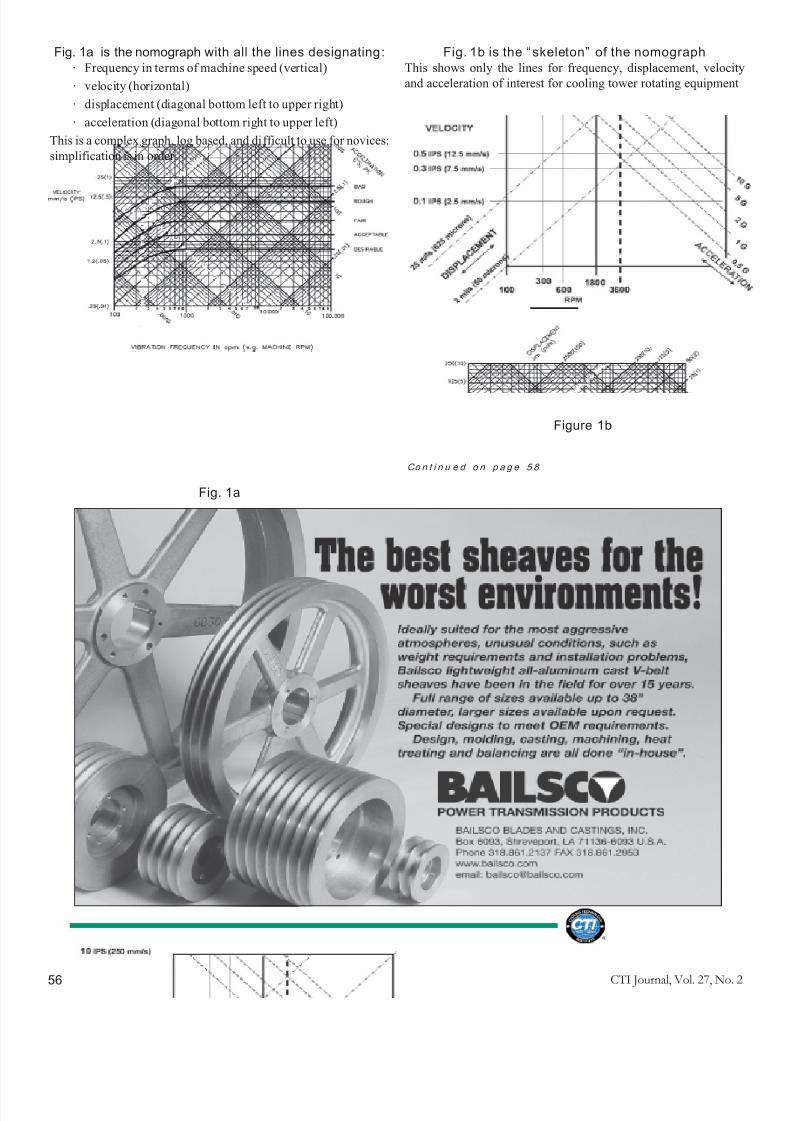
Fig. 1a is the nomograph with all the lines designating :
· Frequency in terms of machine speed (vertical)
· velocity (horizontal)
· displacement (diagonal bottom left to upper right)
· acceleration (diagonal bottom right to upper left)
This is a complex graph, log based, and difficult to use for novices:
simplification is in order.
Fig. 1b is the “ skeleton” of the nomographThis shows only the lines for frequency, displacement, velocity
and acceleration of interest for cooling tower rotating equipment
Fig. 1a
Figure 1b
Co n t i n u e d o n p a g e 5 8
8/9/2019 CTI Sum 06 Journalfinal
http://slidepdf.com/reader/full/cti-sum-06-journalfinal 59/76
CTI Journal, Vol. 27, No. 2 57

8/9/2019 CTI Sum 06 Journalfinal
http://slidepdf.com/reader/full/cti-sum-06-journalfinal 60/76
CTI Journal, Vol. 27, No. 258
Fig. 1c shows the superimposed values of Good to BadThese are the commonly accepted vibration levels for machines
running at various speeds.
Figure 1c
Fig. 1d is fi gure 1 at the paper’s beginning with the 1 Glevel added for reference
Greatly simplified, it assumes likely set-points for mechanical vibra-tion switches at 1 G (though likely higher), cooling tower drive at1800 rpm, and accepted vibration levels of a cooling tower.
8/9/2019 CTI Sum 06 Journalfinal
http://slidepdf.com/reader/full/cti-sum-06-journalfinal 61/76
CTI Journal, Vol. 27, No. 2 59
8/9/2019 CTI Sum 06 Journalfinal
http://slidepdf.com/reader/full/cti-sum-06-journalfinal 62/76
CTI Journal, Vol. 27, No. 260
IntroductionHistorically, water systems in industry have not
received the same attention as process systems.
Until a problem or failure occurred, water sys-
tems were typically considered a cost center
whereas the process systems were a profit
center. As a result, many water systems
evolved into applications that in today’s stan-
dards would not be considered a viable option
for new construction. One such system exists
at DuPont Sabine in Orange, Texas. The pur-
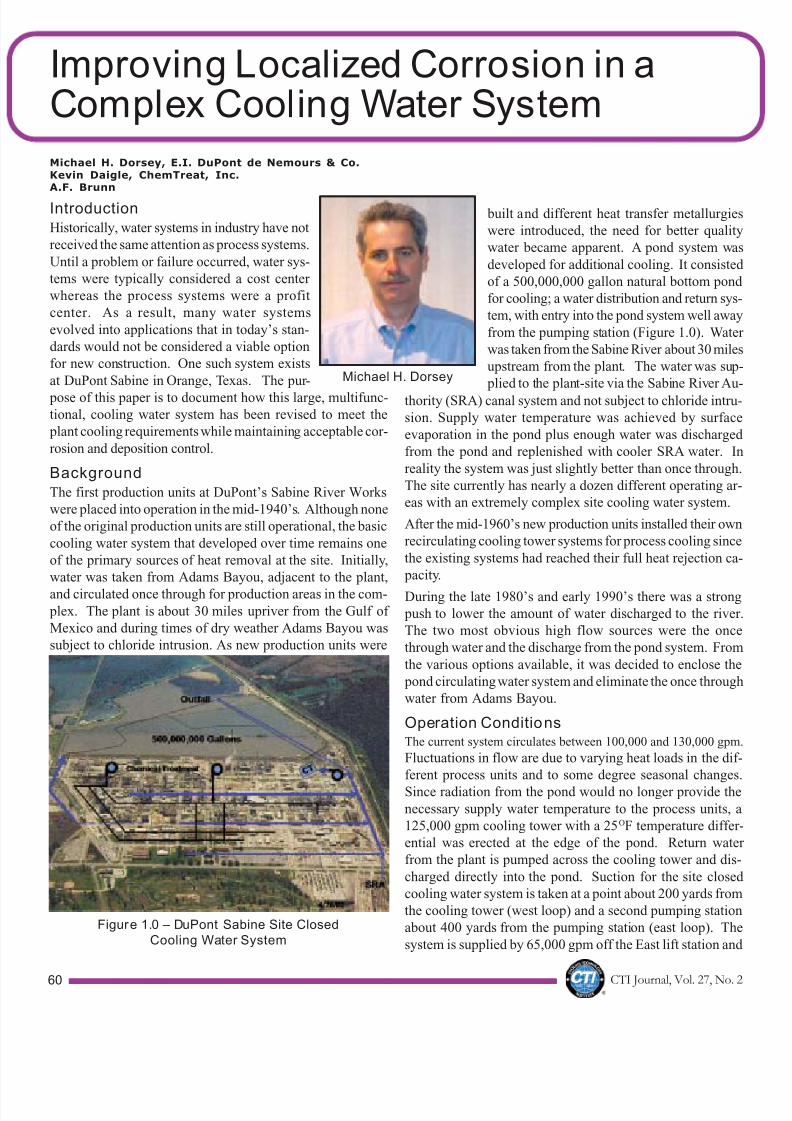
built and different heat transfer metallurgies
were introduced, the need for better quality
water became apparent. A pond system was
developed for additional cooling. It consisted
of a 500,000,000 gallon natural bottom pond
for cooling; a water distribution and return sys-
tem, with entry into the pond system well away
from the pumping station (Figure 1.0). Water
was taken from the Sabine River about 30 miles
upstream from the plant. The water was sup-
plied to the plant-site via the Sabine River Au
Improving Localized Corrosion in aComplex Cooling Water System
Michael H. Dorsey, E.I. DuPont de Nemours & Co.Kevin Daigle, ChemTreat, Inc.A.F. Brunn
pose of this paper is to document how this large, multifunc-tional, cooling water system has been revised to meet the
plant cooling requirements while maintaining acceptable cor-
rosion and deposition control.
BackgroundThe first production units at DuPont’s Sabine River Works
were placed into operation in the mid-1940’s. Although none
of the original production units are still operational, the basic
cooling water system that developed over time remains one
of the primary sources of heat removal at the site. Initially,
water was taken from Adams Bayou, adjacent to the plant,
and circulated once through for production areas in the com- plex. The plant is about 30 miles upriver from the Gulf of
Mexico and during times of dry weather Adams Bayou was
subject to chloride intrusion. As new production units were
thority (SRA) canal system and not subject to chloride intru-
sion. Supply water temperature was achieved by surface
evaporation in the pond plus enough water was discharged
from the pond and replenished with cooler SRA water. In
reality the system was just slightly better than once through
The site currently has nearly a dozen different operating ar-
eas with an extremely complex site cooling water system.
After the mid-1960’s new production units installed their own
recirculating cooling tower systems for process cooling since
the existing systems had reached their full heat rejection ca
pacity.
During the late 1980’s and early 1990’s there was a strong
push to lower the amount of water discharged to the river
The two most obvious high flow sources were the once
through water and the discharge from the pond system. From
the various options available, it was decided to enclose the
pond circulating water system and eliminate the once through
water from Adams Bayou.
Operation ConditionsThe current system circulates between 100,000 and 130,000 gpm
Fluctuations in flow are due to varying heat loads in the dif-
ferent process units and to some degree seasonal changes
Since radiation from the pond would no longer provide the
necessary supply water temperature to the process units, a
125,000 gpm cooling tower with a 25OF temperature differ-
ential was erected at the edge of the pond. Return water
from the plant is pumped across the cooling tower and dis-
charged directly into the pond. Suction for the site closed
cooling water system is taken at a point about 200 yards from
the cooling tower (west loop) and a second pumping station
about 400 yards from the pumping station (east loop). The
system is supplied by 65,000 gpm off the East lift station and
Michael H. Dorsey
Figure 1.0 – DuPont Sabine Site ClosedCooling Water System

8/9/2019 CTI Sum 06 Journalfinal
http://slidepdf.com/reader/full/cti-sum-06-journalfinal 63/76
CTI Journal, Vol. 27, No. 2 61
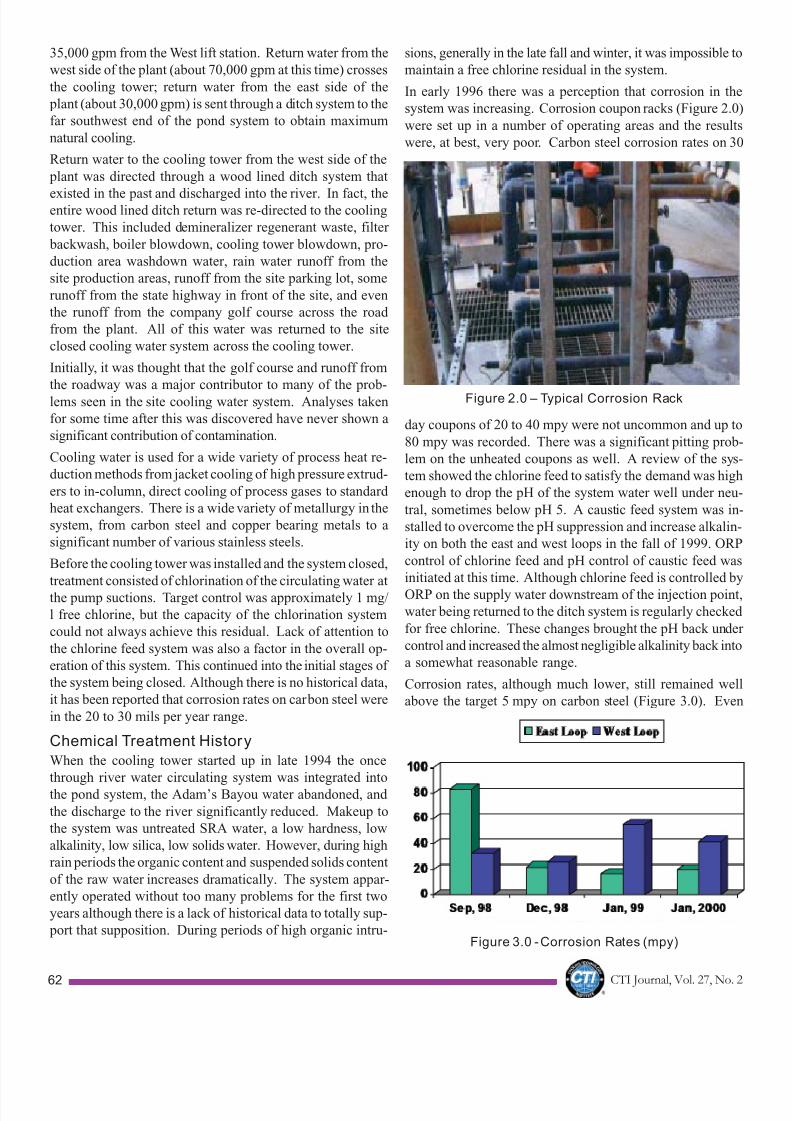
8/9/2019 CTI Sum 06 Journalfinal
http://slidepdf.com/reader/full/cti-sum-06-journalfinal 64/76
CTI Journal, Vol. 27, No. 262
35,000 gpm from the West lift station. Return water from the
west side of the plant (about 70,000 gpm at this time) crosses
the cooling tower; return water from the east side of the
plant (about 30,000 gpm) is sent through a ditch system to the
far southwest end of the pond system to obtain maximum
natural cooling.
Return water to the cooling tower from the west side of the
plant was directed through a wood lined ditch system that
existed in the past and discharged into the river. In fact, theentire wood lined ditch return was re-directed to the cooling
tower. This included demineralizer regenerant waste, filter
backwash, boiler blowdown, cooling tower blowdown, pro-
duction area washdown water, rain water runoff from the
site production areas, runoff from the site parking lot, some
runoff from the state highway in front of the site, and even
the runoff from the company golf course across the road
from the plant. All of this water was returned to the site
closed cooling water system across the cooling tower.
Initially, it was thought that the golf course and runoff from
the roadway was a major contributor to many of the prob-
lems seen in the site cooling water system. Analyses taken
for some time after this was discovered have never shown a
significant contribution of contamination.
Cooling water is used for a wide variety of process heat re-
duction methods from jacket cooling of high pressure extrud-
ers to in-column, direct cooling of process gases to standard
heat exchangers. There is a wide variety of metallurgy in the
system, from carbon steel and copper bearing metals to a
significant number of various stainless steels.
Before the cooling tower was installed and the system closed,
treatment consisted of chlorination of the circulating water at
the pump suctions. Target control was approximately 1 mg/
l free chlorine, but the capacity of the chlorination system
could not always achieve this residual. Lack of attention to
the chlorine feed system was also a factor in the overall op-
eration of this system. This continued into the initial stages of
the system being closed. Although there is no historical data,
it has been reported that corrosion rates on carbon steel were
in the 20 to 30 mils per year range.
Chemical Treatment HistoryWhen the cooling tower started up in late 1994 the once
through river water circulating system was integrated into
the pond system, the Adam’s Bayou water abandoned, and
the discharge to the river significantly reduced. Makeup to
the system was untreated SRA water, a low hardness, low
alkalinity, low silica, low solids water. However, during high
rain periods the organic content and suspended solids content
of the raw water increases dramatically. The system appar-
ently operated without too many problems for the first two
years although there is a lack of historical data to totally sup-
port that supposition. During periods of high organic intru-
sions, generally in the late fall and winter, it was impossible to
maintain a free chlorine residual in the system.
In early 1996 there was a perception that corrosion in the
system was increasing. Corrosion coupon racks (Figure 2.0
were set up in a number of operating areas and the results
were, at best, very poor. Carbon steel corrosion rates on 30
Figure 2.0 – Typical Corrosion Rack
day coupons of 20 to 40 mpy were not uncommon and up to
80 mpy was recorded. There was a significant pitting prob
lem on the unheated coupons as well. A review of the sys-
tem showed the chlorine feed to satisfy the demand was high
enough to drop the pH of the system water well under neu-
tral, sometimes below pH 5. A caustic feed system was in
stalled to overcome the pH suppression and increase alkalin-
ity on both the east and west loops in the fall of 1999. ORP
control of chlorine feed and pH control of caustic feed was
initiated at this time. Although chlorine feed is controlled by
ORP on the supply water downstream of the injection pointwater being returned to the ditch system is regularly checked
for free chlorine. These changes brought the pH back under
control and increased the almost negligible alkalinity back into
a somewhat reasonable range.
Corrosion rates, although much lower, still remained wel
above the target 5 mpy on carbon steel (Figure 3.0). Even
Figure 3.0 - Corrosion Rates (mpy)
8/9/2019 CTI Sum 06 Journalfinal
http://slidepdf.com/reader/full/cti-sum-06-journalfinal 65/76
CTI Journal, Vol. 27, No. 2 63
with the lower corrosion rates, the pitting of
carbon steel continued at a higher than desir-
able rate. In addition, under deposit corrosion
on 304L and 316L stainless steel tubing oc-
curred in a number of exchangers resulting in
equipment failure and unplanned production
area shutdowns.
Other 304L and 316L stainless exchangers have
operated without significant problems since thecooling water system was closed in 1994. Stain-
less steel corrosion coupons in the system gener-
ally showed excellent corrosion rates, usually less
than 0.01 mpy and little to no pitting on the cou-
pons, although there has been an occasional cou-
pon that did show pitting and indication of mi-
crobiologically influenced corrosion (MIC). The
failed tubing was replaced and inspected for pos-
sible feeling that MIC had been the cause of the
tubing failures. Some analyses of deposits from
the failed tubes showed the presence of manga-
nese and there has never been a consensus as to
the exact cause of the failures.In early 2000 a program was established to
determine microbiological activity both by as-
sessing the sessile and planktonic bacteria
counts in various locations served by the
closed cooling water system. In general,
counts of both were very low when chlorina-
tion was maintained properly. These counts
ran between 102 and 104 with averages around
103. There has been an inherent problem with
the chlorination in the summer months. There
have been many times when the demand ex-ceeds the capacity of the chlorine delivery
system to provide sufficient chlorine to main-
tain the desired residual. This situation is be-
ing addressed with a proposed project to in-
crease the pressure of the motive water by
adding booster pumps in the chlorination educ-
tion system.
The plant also started a formal chemical treat-
ment program is early 2000. Because of en-vironmental concerns, several treatment chemistries were not
considered an option. Use of zinc as a cationic inhibitor was
recommended, but site environmental concerns precluded theuse of zinc until all other avenues were investigated. Using
water from the pond system, laboratory spinner bath studies
were performed to determine which treatment program would
provide the best return for the chemical investment.
The initial program consisted of an ortho phosphate, organic
phosphate, and a dispersant (Figure 4.0). It took nearly two
months for the system to stabilize because of its large size
and mud bottom in the pond. In June of 2000, sodium
hexametaphosphate was added to the system to evaluate the
benefits of polyphosphate. In July, 2001, due to a pH of ove
8.0 and sometimes approaching 8.5, the oxidizing biocide treat-
ment was modified to include a bromine component. The
addition of bromide was justified based on the high system
pH. Tripol yp ot as si um phos ph at e fe ed repl ac ed the
hexametaphosphate in an attempt to reduce reversion to or-
thophosphate and maintain a higher polyphosphate residual in
the system. Treatment modifications each resulted in sligh
improvement of carbon steel corrosion rates, but the success
was always questionable due to inconsistencies in the newer
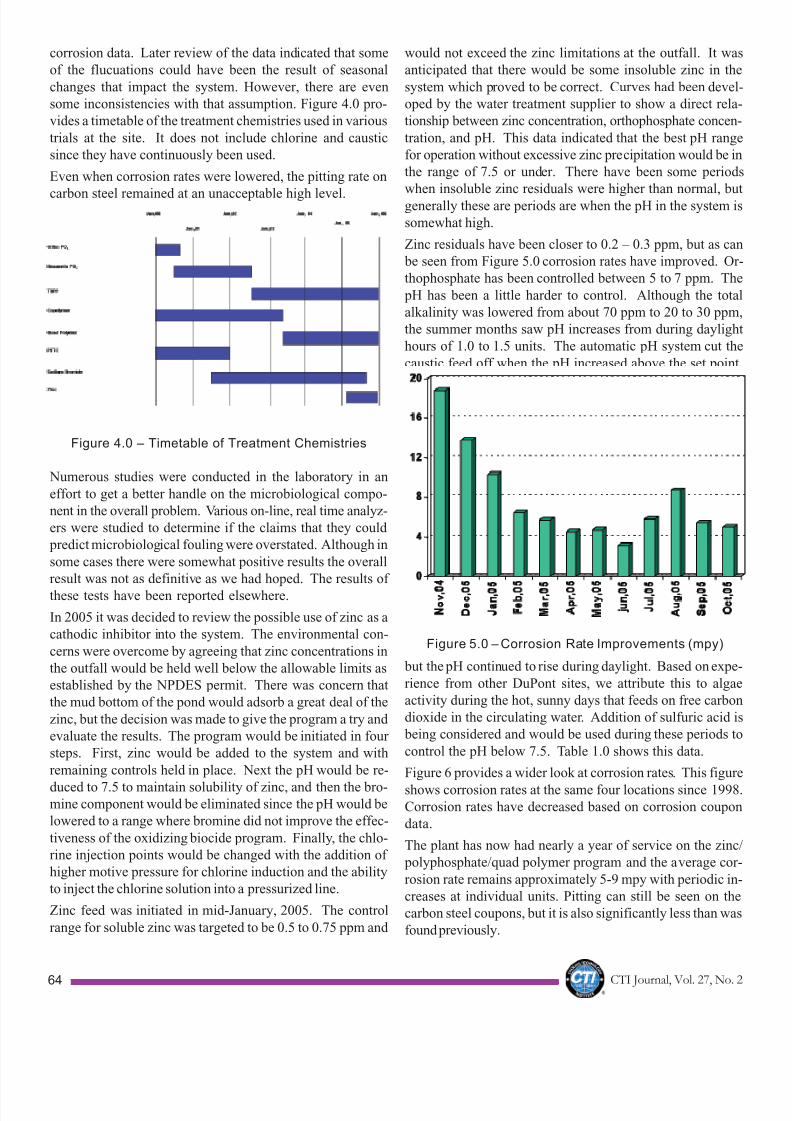
8/9/2019 CTI Sum 06 Journalfinal
http://slidepdf.com/reader/full/cti-sum-06-journalfinal 66/76
CTI Journal, Vol. 27, No. 264
corrosion data. Later review of the data indicated that some
of the flucuations could have been the result of seasonal
changes that impact the system. However, there are even
some inconsistencies with that assumption. Figure 4.0 pro-
vides a timetable of the treatment chemistries used in various
trials at the site. It does not include chlorine and caustic
since they have continuously been used.
Even when corrosion rates were lowered, the pitting rate on
carbon steel remained at an unacceptable high level.
would not exceed the zinc limitations at the outfall. It was
anticipated that there would be some insoluble zinc in the
system which proved to be correct. Curves had been devel
oped by the water treatment supplier to show a direct rela-
tionship between zinc concentration, orthophosphate concen-
tration, and pH. This data indicated that the best pH range
for operation without excessive zinc precipitation would be in
the range of 7.5 or under. There have been some periods
when insoluble zinc residuals were higher than normal, bu
generally these are periods are when the pH in the system is
somewhat high.
Zinc residuals have been closer to 0.2 – 0.3 ppm, but as can
be seen from Figure 5.0 corrosion rates have improved. Or-
thophosphate has been controlled between 5 to 7 ppm. The
pH has been a little harder to control. Although the tota
alkalinity was lowered from about 70 ppm to 20 to 30 ppm
the summer months saw pH increases from during dayligh
hours of 1.0 to 1.5 units. The automatic pH system cut the
caustic feed off when the pH increased above the set point
Figure 4.0 – Timetable of Treatment Chemistries
Numerous studies were conducted in the laboratory in an
effort to get a better handle on the microbiological compo-
nent in the overall problem. Various on-line, real time analyz-
ers were studied to determine if the claims that they could
predict microbiological fouling were overstated. Although in
some cases there were somewhat positive results the overall
result was not as definitive as we had hoped. The results of
these tests have been reported elsewhere.
In 2005 it was decided to review the possible use of zinc as a
cathodic inhibitor into the system. The environmental con-
cerns were overcome by agreeing that zinc concentrations in
the outfall would be held well below the allowable limits as
established by the NPDES permit. There was concern that
the mud bottom of the pond would adsorb a great deal of the
zinc, but the decision was made to give the program a try and
evaluate the results. The program would be initiated in four
steps. First, zinc would be added to the system and with
remaining controls held in place. Next the pH would be re-
duced to 7.5 to maintain solubility of zinc, and then the bro-mine component would be eliminated since the pH would be
lowered to a range where bromine did not improve the effec-
tiveness of the oxidizing biocide program. Finally, the chlo-
rine injection points would be changed with the addition of
higher motive pressure for chlorine induction and the ability
to inject the chlorine solution into a pressurized line.
Zinc feed was initiated in mid-January, 2005. The control
range for soluble zinc was targeted to be 0.5 to 0.75 ppm and
Figure 5.0 – Corrosion Rate Improvements (mpy)
but the pH continued to rise during daylight. Based on expe-
rience from other DuPont sites, we attribute this to algae
activity during the hot, sunny days that feeds on free carbon
dioxide in the circulating water. Addition of sulfuric acid i
being considered and would be used during these periods to
control the pH below 7.5. Table 1.0 shows this data.
Figure 6 provides a wider look at corrosion rates. This figure
shows corrosion rates at the same four locations since 1998Corrosion rates have decreased based on corrosion coupon
data.
The plant has now had nearly a year of service on the zinc/
polyphosphate/quad polymer program and the average cor-
rosion rate remains approximately 5-9 mpy with periodic in-
creases at individual units. Pitting can still be seen on the
carbon steel coupons, but it is also significantly less than was
found previously.
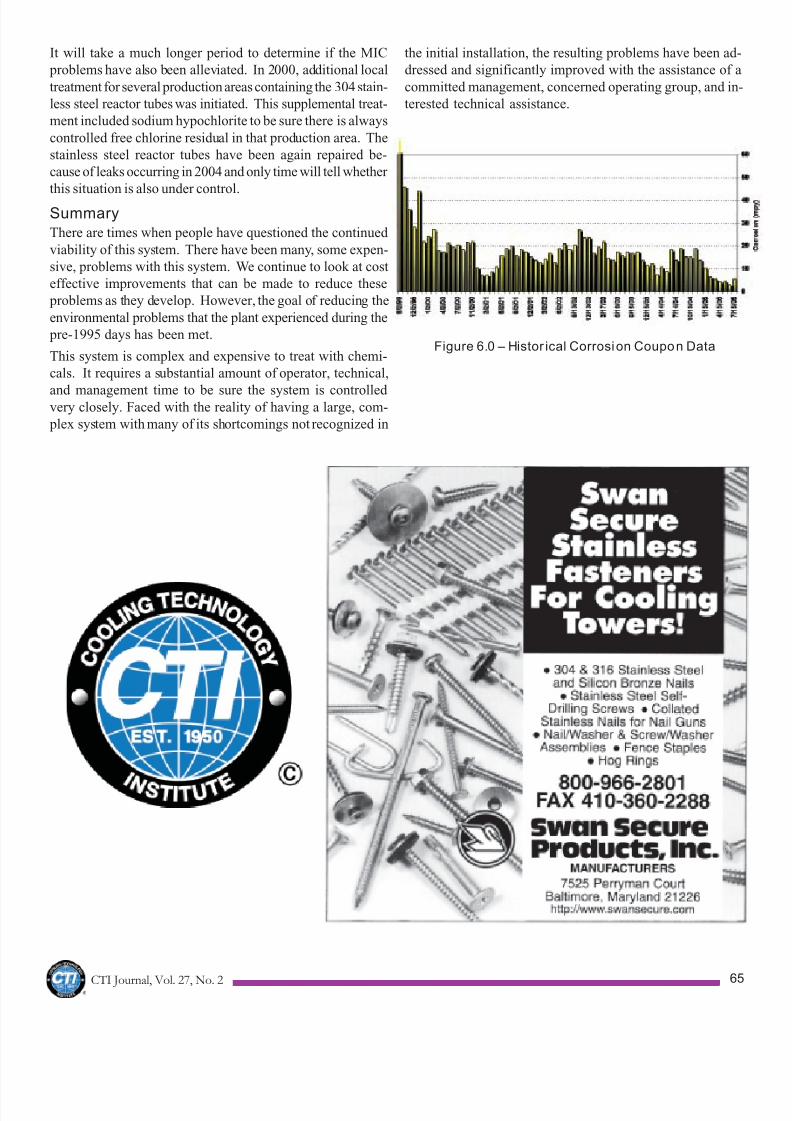
8/9/2019 CTI Sum 06 Journalfinal
http://slidepdf.com/reader/full/cti-sum-06-journalfinal 67/76
CTI Journal, Vol. 27, No. 2 65
It will take a much longer period to determine if the MIC
problems have also been alleviated. In 2000, additional local
treatment for several production areas containing the 304 stain-
less steel reactor tubes was initiated. This supplemental treat-
ment included sodium hypochlorite to be sure there is always
controlled free chlorine residual in that production area. The
stainless steel reactor tubes have been again repaired be-
cause of leaks occurring in 2004 and only time will tell whether
this situation is also under control.
SummaryThere are times when people have questioned the continued
viability of this system. There have been many, some expen-
sive, problems with this system. We continue to look at cost
effective improvements that can be made to reduce these
problems as they develop. However, the goal of reducing the
environmental problems that the plant experienced during the
pre-1995 days has been met.
This system is complex and expensive to treat with chemi-
cals. It requires a substantial amount of operator, technical,
and management time to be sure the system is controlled very closely. Faced with the reality of having a large, com-
plex system with many of its shortcomings not recognized in
Figure 6.0 – Histor ical Corrosion Coupon Data
the initial installation, the resulting problems have been ad-
dressed and significantly improved with the assistance of a
committed management, concerned operating group, and in-
terested technical assistance.
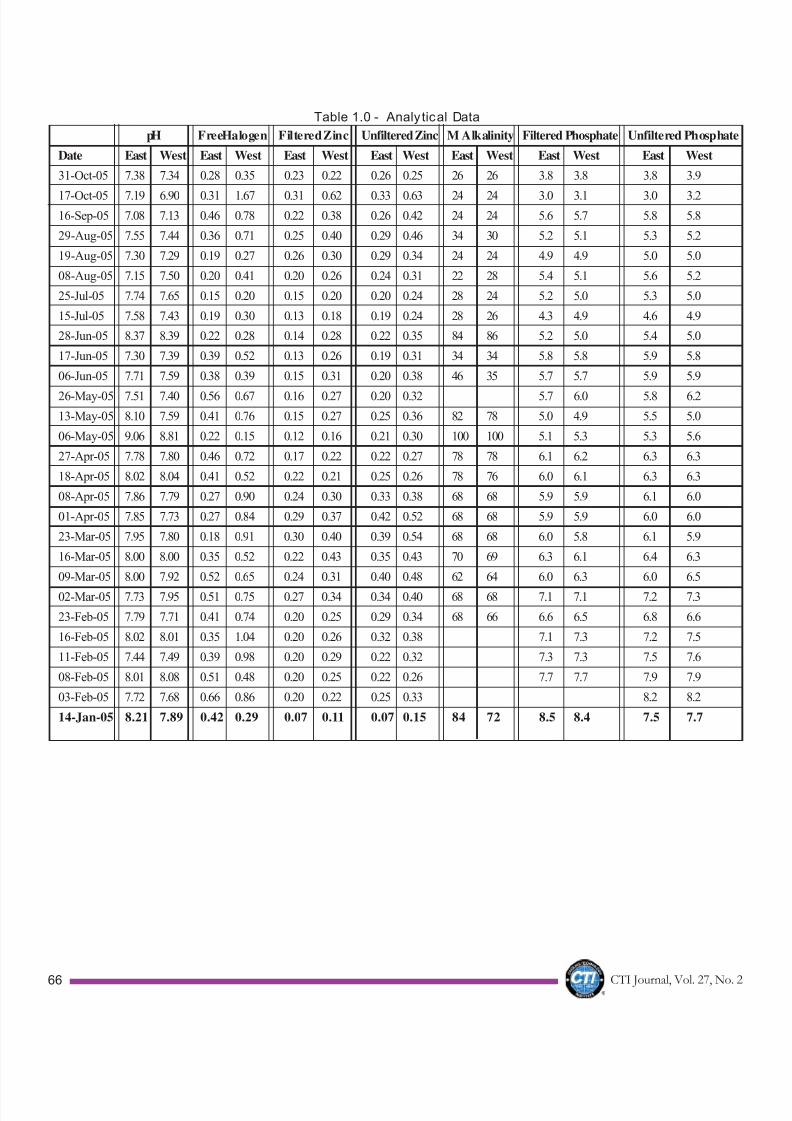
8/9/2019 CTI Sum 06 Journalfinal
http://slidepdf.com/reader/full/cti-sum-06-journalfinal 68/76
CTI Journal, Vol. 27, No. 266
Table 1.0 - Analytical Data
pH FreeHalogen Filtered Zinc Unfiltered Zinc M Alkalinity Filtered Phosphate Unfiltered Phosphate
Date East West East West East West East West East West East West East West
31-Oct-05 7.38 7.34 0.28 0.35 0.23 0.22 0.26 0.25 26 26 3.8 3.8 3.8 3.9
17-Oct-05 7.19 6.90 0.31 1.67 0.31 0.62 0.33 0.63 24 24 3.0 3.1 3.0 3.216-Sep-05 7.08 7.13 0.46 0.78 0.22 0.38 0.26 0.42 24 24 5.6 5.7 5.8 5.8
29-Aug-05 7.55 7.44 0.36 0.71 0.25 0.40 0.29 0.46 34 30 5.2 5.1 5.3 5.2
19-Aug-05 7.30 7.29 0.19 0.27 0.26 0.30 0.29 0.34 24 24 4.9 4.9 5.0 5.0
08-Aug-05 7.15 7.50 0.20 0.41 0.20 0.26 0.24 0.31 22 28 5.4 5.1 5.6 5.2
25-Jul-05 7.74 7.65 0.15 0.20 0.15 0.20 0.20 0.24 28 24 5.2 5.0 5.3 5.0
15-Jul-05 7.58 7.43 0.19 0.30 0.13 0.18 0.19 0.24 28 26 4.3 4.9 4.6 4.9
28-Jun-05 8.37 8.39 0.22 0.28 0.14 0.28 0.22 0.35 84 86 5.2 5.0 5.4 5.0
17-Jun-05 7.30 7.39 0.39 0.52 0.13 0.26 0.19 0.31 34 34 5.8 5.8 5.9 5.8
06-Jun-05 7.71 7.59 0.38 0.39 0.15 0.31 0.20 0.38 46 35 5.7 5.7 5.9 5.9
26-May-05 7.51 7.40 0.56 0.67 0.16 0.27 0.20 0.32 5.7 6.0 5.8 6.2
13-May-05 8.10 7.59 0.41 0.76 0.15 0.27 0.25 0.36 82 78 5.0 4.9 5.5 5.0
06-May-05 9.06 8.81 0.22 0.15 0.12 0.16 0.21 0.30 100 100 5.1 5.3 5.3 5.6
27-Apr-05 7.78 7.80 0.46 0.72 0.17 0.22 0.22 0.27 78 78 6.1 6.2 6.3 6.3
18-Apr-05 8.02 8.04 0.41 0.52 0.22 0.21 0.25 0.26 78 76 6.0 6.1 6.3 6.3
08-Apr-05 7.86 7.79 0.27 0.90 0.24 0.30 0.33 0.38 68 68 5.9 5.9 6.1 6.0
01-Apr-05 7.85 7.73 0.27 0.84 0.29 0.37 0.42 0.52 68 68 5.9 5.9 6.0 6.0
23-Mar-05 7.95 7.80 0.18 0.91 0.30 0.40 0.39 0.54 68 68 6.0 5.8 6.1 5.9
16-Mar-05 8.00 8.00 0.35 0.52 0.22 0.43 0.35 0.43 70 69 6.3 6.1 6.4 6.3
09-Mar-05 8.00 7.92 0.52 0.65 0.24 0.31 0.40 0.48 62 64 6.0 6.3 6.0 6.5
02-Mar-05 7.73 7.95 0.51 0.75 0.27 0.34 0.34 0.40 68 68 7.1 7.1 7.2 7.3
23-Feb-05 7.79 7.71 0.41 0.74 0.20 0.25 0.29 0.34 68 66 6.6 6.5 6.8 6.6
16-Feb-05 8.02 8.01 0.35 1.04 0.20 0.26 0.32 0.38 7.1 7.3 7.2 7.5
11-Feb-05 7.44 7.49 0.39 0.98 0.20 0.29 0.22 0.32 7.3 7.3 7.5 7.6
08-Feb-05 8.01 8.08 0.51 0.48 0.20 0.25 0.22 0.26 7.7 7.7 7.9 7.9
03-Feb-05 7.72 7.68 0.66 0.86 0.20 0.22 0.25 0.33 8.2 8.2
14-Jan-05 8.21 7.89 0.42 0.29 0.07 0.11 0.07 0.15 84 72 8.5 8.4 7.5 7.7

8/9/2019 CTI Sum 06 Journalfinal
http://slidepdf.com/reader/full/cti-sum-06-journalfinal 69/76
CTI Journal, Vol. 27, No. 2 67

8/9/2019 CTI Sum 06 Journalfinal
http://slidepdf.com/reader/full/cti-sum-06-journalfinal 70/76
CTI Journal, Vol. 27, No. 268
Cooling Technology Institute
Licensed Testing AgenciesFor nearly thirty years, the Cooling Technology Institute has
provided a truly independent, third party, thermal performance
testing service to the cooling tower industry. In 1995, the CTI
also began providing an independent, third party, drift
performance testing service aswell. Both these services are
administered through the CTI
Multi-Agency Tower Perfor-
mance Test Program and provide
comparisons of the actual operat-
ing performance of a specific
tower installation to the design
performance. By providing such
information on a specific tower
installation, the CTI Multi-
Agency Testing Program stands
in contrast to the CTI Cooling
Tower Certification Programwhich certifies all models of a
specific manufacturer's line of cooling towers perform in
accordance with their published thermal ratings.
To be licensed as a CTI Cooling Tower Performance Test
Licensed CTI Thermal Testing Agencies
License Agency Name Contact Person Telephone
Type* Address Website / Email Fax
A,B Clean Air Engineering Kenneth Hennon 800.208.6162
7936 Conner Rd www.cleanair.com 865.938.7569
Powell, TN 37849 [email protected]
A, B Cooling Tower Technologies Pty Ltd Ronald Rayner 61 2 9789 5900
PO Box N157 [email protected] 61 2 9789 5922
Bexley North, NSW 2207
AUSTRALIA
A,B Cooling Tower Test Associates, Inc. Thomas E. Weast 913.681.0027
15325 Melrose Dr. www.cttai.com 913.681.0039
Stanley, KS 66221-9720 [email protected]
A, B McHale & Associates, Inc Thomas Wheelock 865.588.2654
6430 Baum Drive www.mchale.org 425.557.8377
Knoxville, TN 37919 [email protected]
* Type A license is for the use of mercury in glass thermometers typically used for smaller towers.
Type B license is for the use of remote data acquisition devices which can accommodate multiple measurement locations required by larger towers.
Licensed CTI Drift Testing Agencies
Agency Name Contact Person Telephone
Address Website / Email Fax
Clean Air Engineering Kenneth Hennon 800.208.6162
7936 Conner Rd www.cleanair.com 865.938.7569
Powell, TN 37849 [email protected]
McHale & Associates, Inc. Thomas Wheelock 865.588.2654
6430 Baum Drive www.mchale.org 425.557.8377
Knoxville, TN 37919 [email protected]
Agency, the agency must pass a rigorous screening process and
demonstrate a high level of technical expertise. Additionally, it
must have a sufficient number of test instruments, all meeting
rigid requirements for accuracy and calibration.
Once licensed, the Test Agenciesfor both thermal and drift testing
must operate in full compliance
with the provisions of the CTI
License Agreements and Testing
Manuals which were developed
by a panel of testing experts
specifically for this program. In-
cluded in these requirements are
strict guidelines regarding conflict
of interest to insure CTI Tests are
conducted in a fair, unbiased
manner.
Cooling tower owners and manu-facturers are strongly encouraged
to utilize the services of the licensed CTI Cooling Tower
Performance Test Agencies. The currently licensed agencies are
listed below.
8/9/2019 CTI Sum 06 Journalfinal
http://slidepdf.com/reader/full/cti-sum-06-journalfinal 71/76
CTI Journal, Vol. 27, No. 2 69
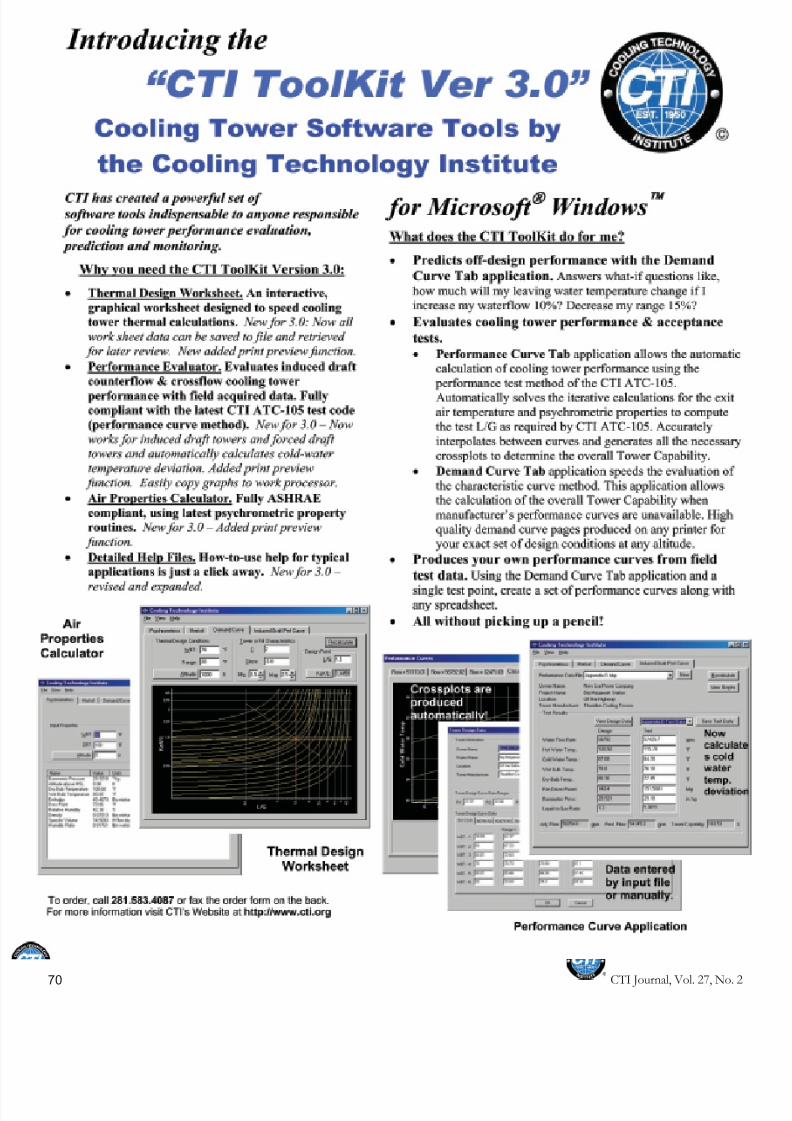
8/9/2019 CTI Sum 06 Journalfinal
http://slidepdf.com/reader/full/cti-sum-06-journalfinal 72/76
CTI Journal, Vol. 27, No. 270
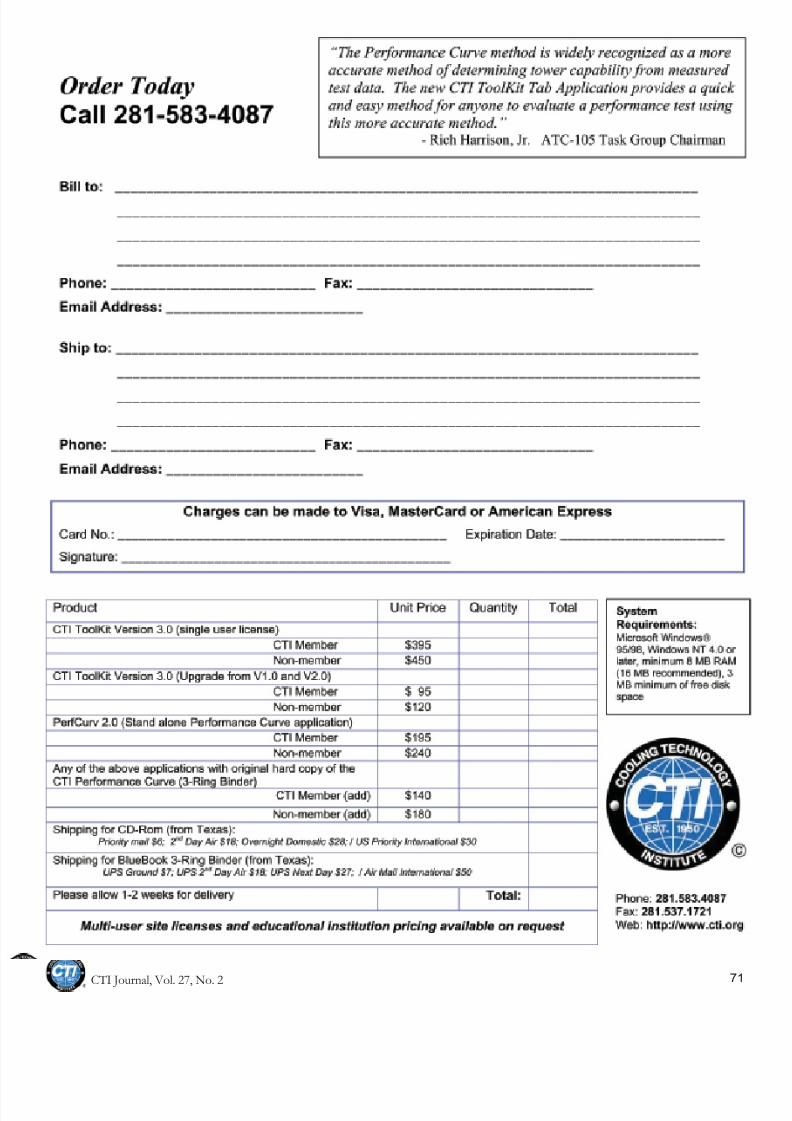
8/9/2019 CTI Sum 06 Journalfinal
http://slidepdf.com/reader/full/cti-sum-06-journalfinal 73/76
CTI Journal, Vol. 27, No. 2 71
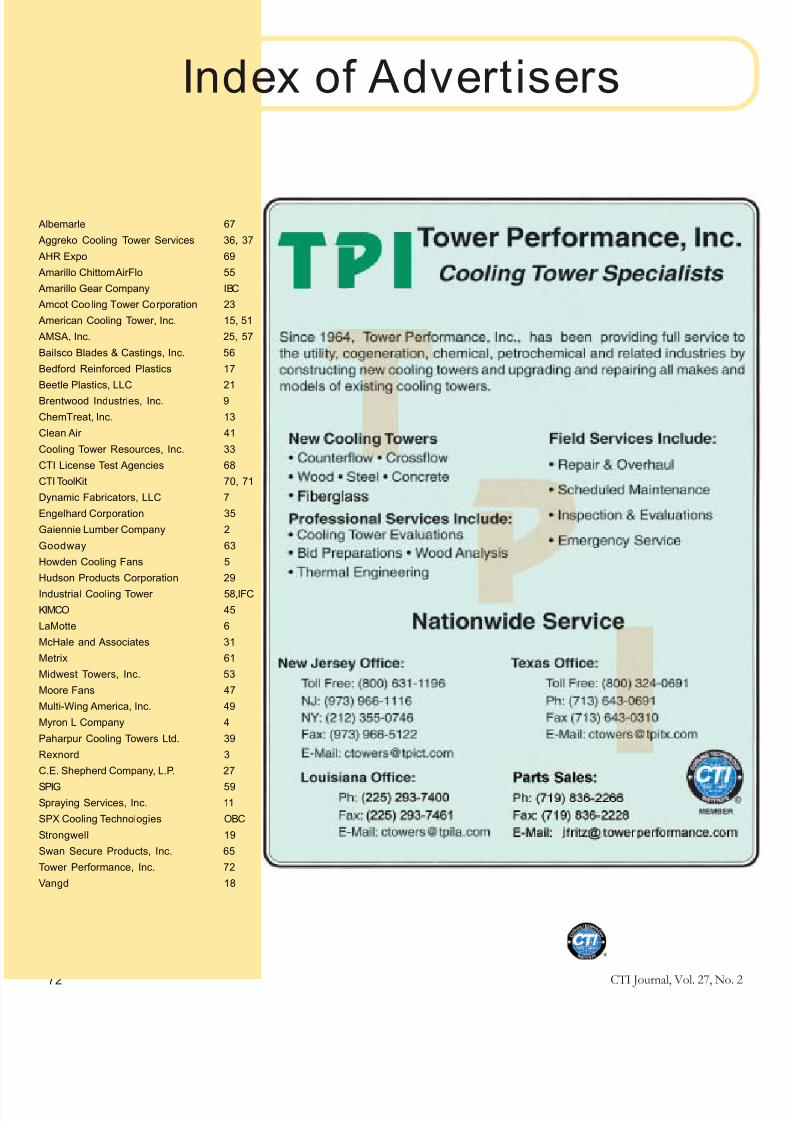
8/9/2019 CTI Sum 06 Journalfinal
http://slidepdf.com/reader/full/cti-sum-06-journalfinal 74/76
CTI Journal, Vol. 27, No. 272
Albemarle 67
Aggreko Cooling Tower Services 36, 37
AHR Expo 69
Amarillo Chittom AirFlo 55
Amarillo Gear Company IBC
Amcot Cooling Tower Corporation 23
American Cooling Tower, Inc. 15, 51
AMSA, Inc. 25, 57
Bailsco Blades & Castings, Inc. 56
Bedford Reinforced Plastics 17
Beetle Plastics, LLC 21
Brentwood Industries, Inc. 9
ChemTreat, Inc. 13
Clean Air 41
Cooling Tower Resources, Inc. 33
CTI License Test Agencies 68
CTI ToolKit 70, 71
Dynamic Fabricators, LLC 7
Engelhard Corporation 35
Gaiennie Lumber Company 2
Goodway 63
Howden Cooling Fans 5
Hudson Products Corporation 29
Industrial Cooling Tower 58,IFC
KIMCO 45
LaMotte 6
McHale and Associates 31
Metrix 61
Midwest Towers, Inc. 53
Moore Fans 47
Multi-Wing America, Inc. 49
Myron L Company 4
Paharpur Cooling Towers Ltd. 39
Rexnord 3
C.E. Shepherd Company, L.P. 27
SPIG 59
Spraying Services, Inc. 11
SPX Cooling Technologies OBC
Strongwell 19
Swan Secure Products, Inc. 65
Tower Performance, Inc. 72
Vangd 18
Index of Advertisers
8/9/2019 CTI Sum 06 Journalfinal
http://slidepdf.com/reader/full/cti-sum-06-journalfinal 75/76

8/9/2019 CTI Sum 06 Journalfinal
http://slidepdf.com/reader/full/cti-sum-06-journalfinal 76/76