Embed Size (px)
Citation preview

Health Care Finance and Administration FY 2015 Budget Presentation
Darin Gordon Dr. Wendy Long Casey Dungan
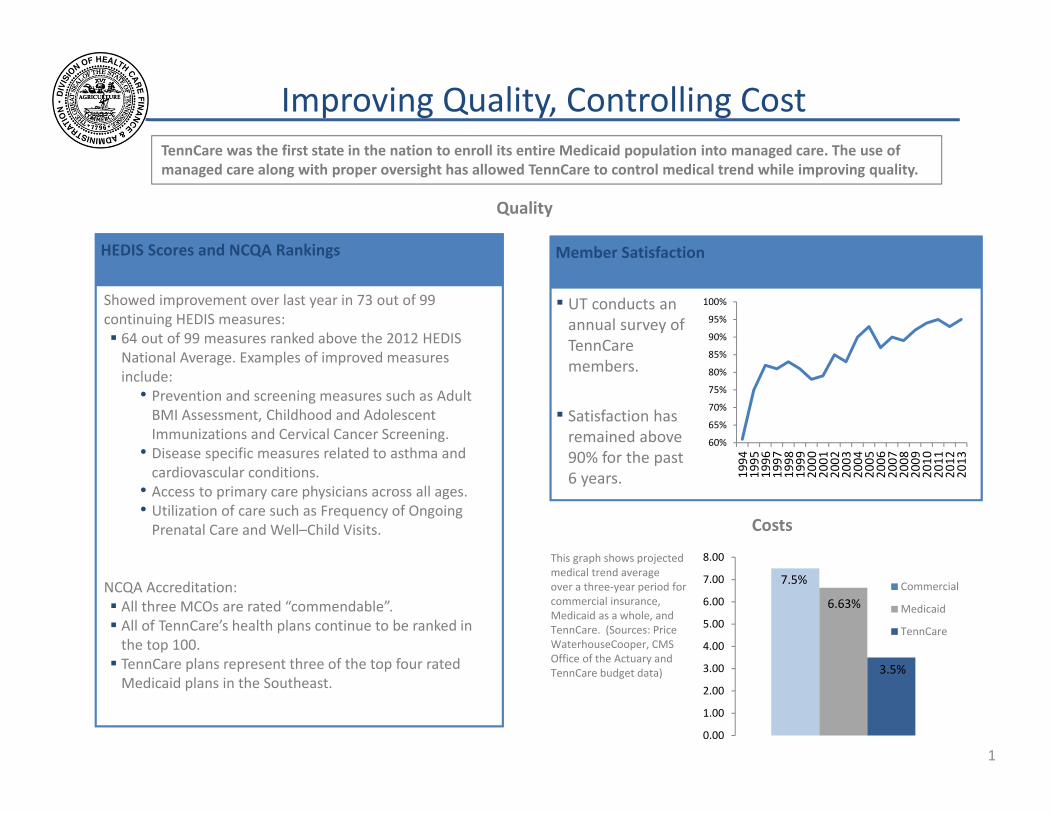
Improving Quality, Controlling Cost TennCare was the first state in the nation to enroll its entire Medicaid population into managed care. The use of managed care along with proper oversight has allowed TennCare to control medical trend while improving quality.
Quality
HEDIS Scores and NCQA Rankings
Showed improvement over last year in 73 out of 99 continuing HEDIS measures: 64 out of 99 measures ranked above the 2012 HEDIS National Average. Examples of improved measures include:
• Prevention and screening measures such as Adult BMI Assessment, Childhood and Adolescent Immunizations and Cervical Cancer Screening.
• Disease specific measures related to asthma and cardiovascular conditions.
• Access to primary care physicians across all ages. • Utilization of care such as Frequency of Ongoing Prenatal Care and Well–Child Visits.
NCQA Accreditation: All three MCOs are rated “commendable”. All of TennCare’s health plans continue to be ranked in the top 100. TennCare plans represent three of the top four rated Medicaid plans in the Southeast.
Member Satisfaction
▪ UT conducts an annual survey of TennCare members.
▪ Satisfaction has remained above 90% for the past 6 years.
60%
65%
70%
75%
80%
85%
90%
95%
100%
1994
1995
1996
1997
1998
1999
2000
2001
2002
2003
2004
2005
2006
2007
2008
2009
2010
2011
2012
2013
This graph shows projected medical trend average over a three‐year period for commercial insurance, Medicaid as a whole, and TennCare. (Sources: Price WaterhouseCooper, CMS Office of the Actuary and TennCare budget data)
Costs
8.00
7.00 7.5% Commercial 6.00 6.63% Medicaid 5.00
TennCare 4.00
3.00
2.00
1.00
0.00
3.5%
1
Data‐Driven Decision Making
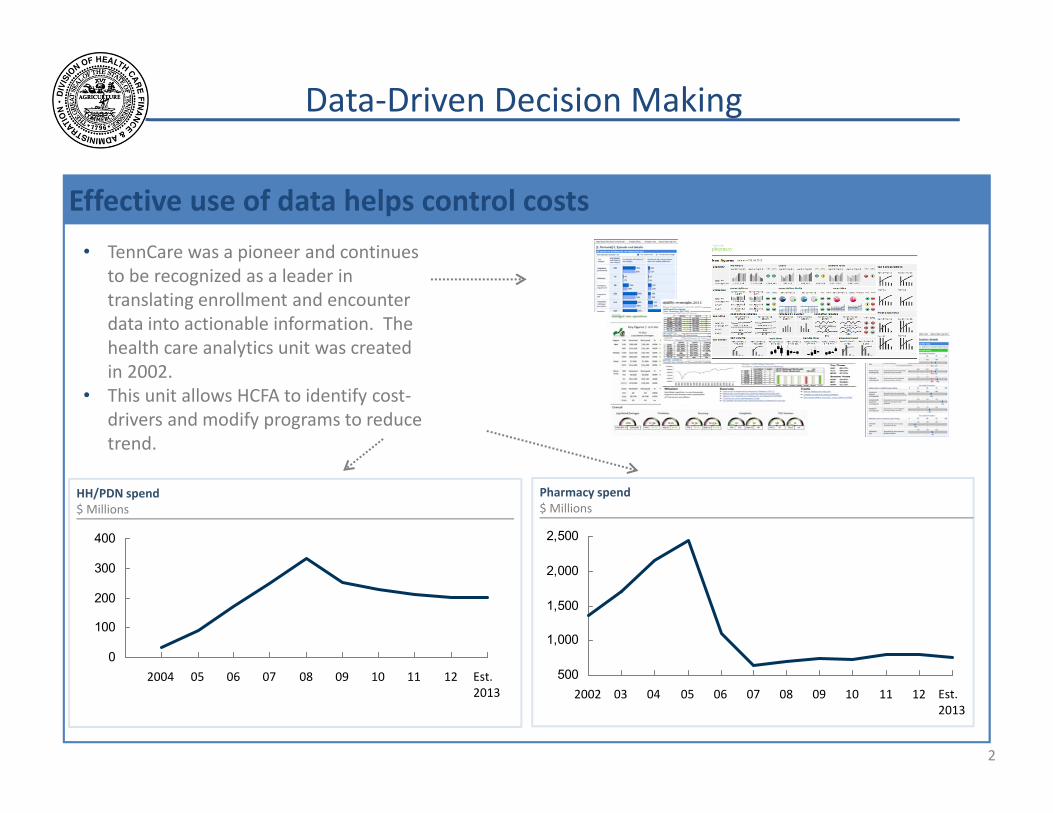
Effective use of data helps control costs • TennCare was a pioneer and continues
to be recognized as a leader in translating enrollment and encounter data into actionable information. The health care analytics unit was created in 2002.
• This unit allows HCFA to identify cost‐drivers and modify programs to reduce trend.
HH/PDN spend $ Millions
0
100
200
300
400
Est. 2013
12111009080706052004 500
1,000
1,500
2,000
2,500
Est. 2013
121110090807060504032002
Pharmacy spend $ Millions
2
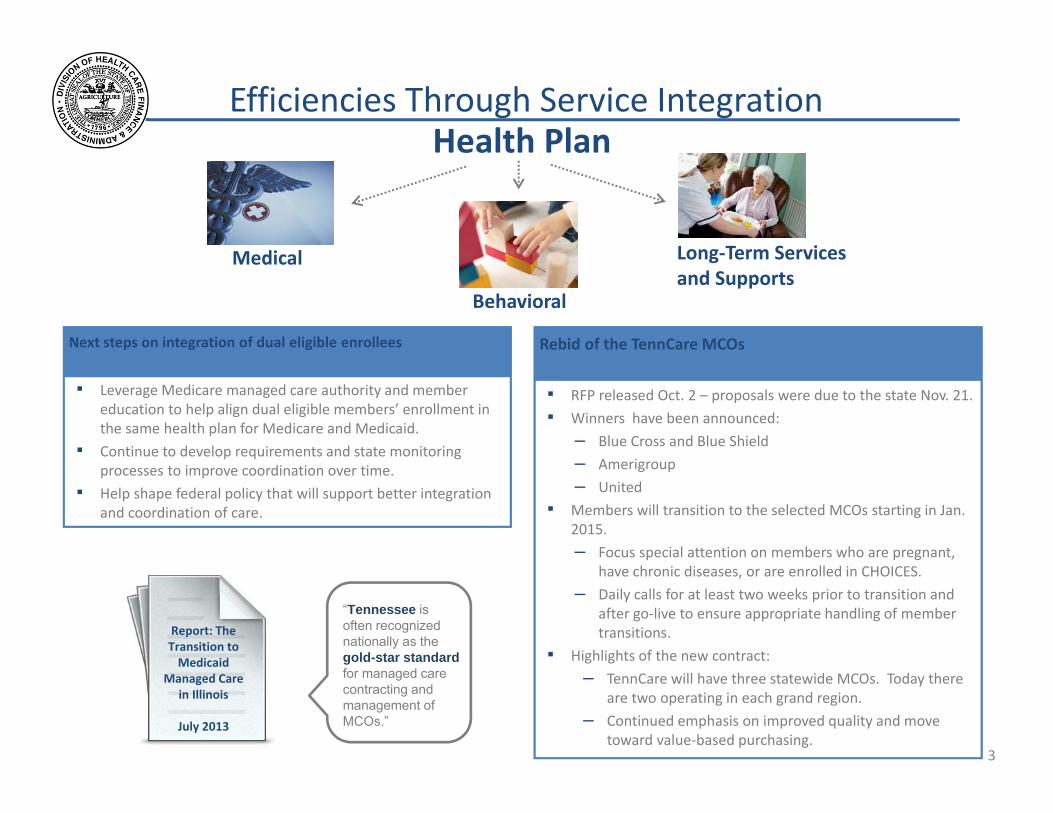
Efficiencies Through Service Integration Health Plan
Long‐Term Services Medical and Supports
Behavioral
“Tennessee is often recognized nationally as the gold-star standard for managed care contracting and management of MCOs.”
▪ RFP released Oct. 2 – proposals were due to the state Nov. 21. ▪ Winners have been announced:
– Blue Cross and Blue Shield
– Amerigroup
– United
▪ Members will transition to the selected MCOs starting in Jan. 2015. – Focus special attention on members who are pregnant,
have chronic diseases, or are enrolled in CHOICES. – Daily calls for at least two weeks prior to transition and
after go‐live to ensure appropriate handling of member transitions.
▪ Highlights of the new contract: – TennCare will have three statewide MCOs. Today there
are two operating in each grand region. – Continued emphasis on improved quality and move
toward value‐based purchasing.
Rebid of the TennCare MCOs Next steps on integration of dual eligible enrollees
▪ Leverage Medicare managed care authority and member education to help align dual eligible members’ enrollment in the same health plan for Medicare and Medicaid.
▪ Continue to develop requirements and state monitoring processes to improve coordination over time.
▪ Help shape federal policy that will support better integration and coordination of care.
Report: The Transition to Medicaid
Managed Care in Illinois
July 2013
3
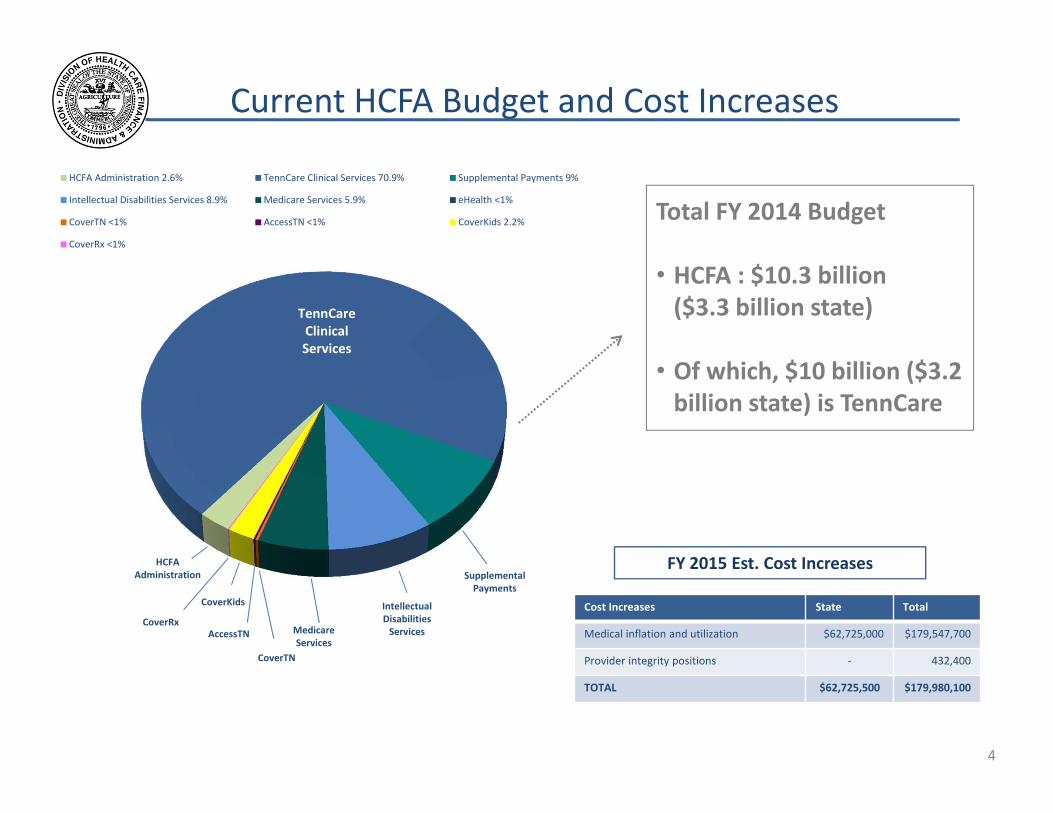
Current HCFA Budget and Cost Increases
HCFA Administration 2.6% TennCare Clinical Services 70.9% Supplemental Payments 9%
Intellectual Disabilities Services 8.9% Medicare Services 5.9% eHealth <1%
CoverTN <1% AccessTN <1% CoverKids 2.2%
CoverRx <1%
TennCare Clinical Services
HCFA Administration
CoverKids
Medicare Services
Intellectual Disabilities Services
CoverTN
CoverRx
Supplemental Payments
AccessTN
Total FY 2014 Budget
• HCFA : $10.3 billion ($3.3 billion state)
• Of which, $10 billion ($3.2 billion state) is TennCare
FY 2015 Est. Cost Increases
Cost Increases State Total
Medical inflation and utilization $62,725,000 $179,547,700
Provider integrity positions ‐ 432,400
TOTAL $62,725,500 $179,980,100
4
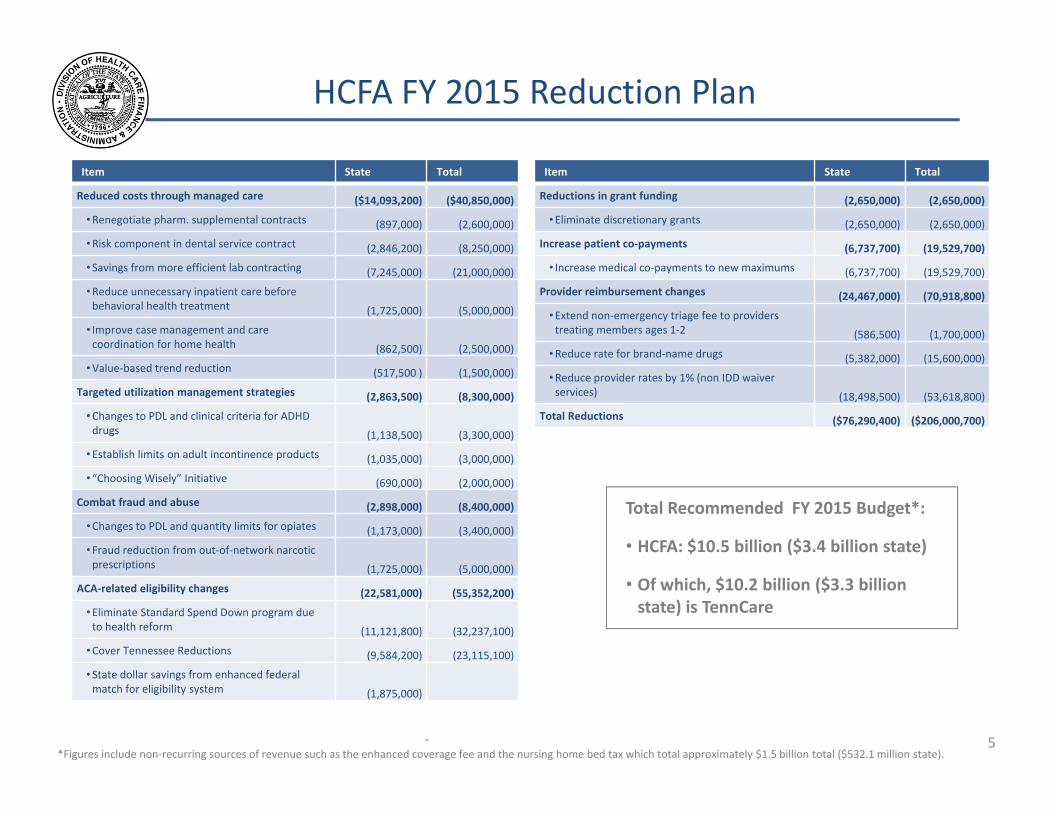
HCFA FY 2015 Reduction Plan
Item State Total
Reduced costs through managed care ($14,093,200) ($40,850,000)
• Renegotiate pharm. supplemental contracts (897,000) (2,600,000)
• Risk component in dental service contract (2,846,200) (8,250,000)
• Savings from more efficient lab contracting (7,245,000) (21,000,000)
• Reduce unnecessary inpatient care before behavioral health treatment (1,725,000) (5,000,000)
• Improve case management and care coordination for home health (862,500) (2,500,000)
• Value‐based trend reduction (517,500 ) (1,500,000)
Targeted utilization management strategies (2,863,500) (8,300,000)
• Changes to PDL and clinical criteria for ADHD drugs (1,138,500) (3,300,000)
• Establish limits on adult incontinence products (1,035,000) (3,000,000)
• “Choosing Wisely” Initiative (690,000) (2,000,000)
Combat fraud and abuse (2,898,000) (8,400,000)
• Changes to PDL and quantity limits for opiates (1,173,000) (3,400,000)
• Fraud reduction from out‐of‐network narcotic prescriptions (1,725,000) (5,000,000)
ACA‐related eligibility changes (22,581,000) (55,352,200)
• Eliminate Standard Spend Down program due to health reform (11,121,800) (32,237,100)
• Cover Tennessee Reductions (9,584,200) (23,115,100)
• State dollar savings from enhanced federal match for eligibility system (1,875,000)
‐
Item State Total
Reductions in grant funding (2,650,000) (2,650,000)
• Eliminate discretionary grants (2,650,000) (2,650,000)
Increase patient co‐payments (6,737,700) (19,529,700)
• Increase medical co‐payments to new maximums (6,737,700) (19,529,700)
Provider reimbursement changes (24,467,000) (70,918,800)
• Extend non‐emergency triage fee to providers treating members ages 1‐2 (586,500) (1,700,000)
• Reduce rate for brand‐name drugs (5,382,000) (15,600,000)
• Reduce provider rates by 1% (non IDD waiver services) (18,498,500) (53,618,800)
Total Reductions ($76,290,400) ($206,000,700)
Total Recommended FY 2015 Budget*:
• HCFA: $10.5 billion ($3.4 billion state)
• Of which, $10.2 billion ($3.3 billion state) is TennCare
*Figures include non‐recurring sources of revenue such as the enhanced coverage fee and the nursing home bed tax which total approximately $1.5 billion total ($532.1 million state). 5
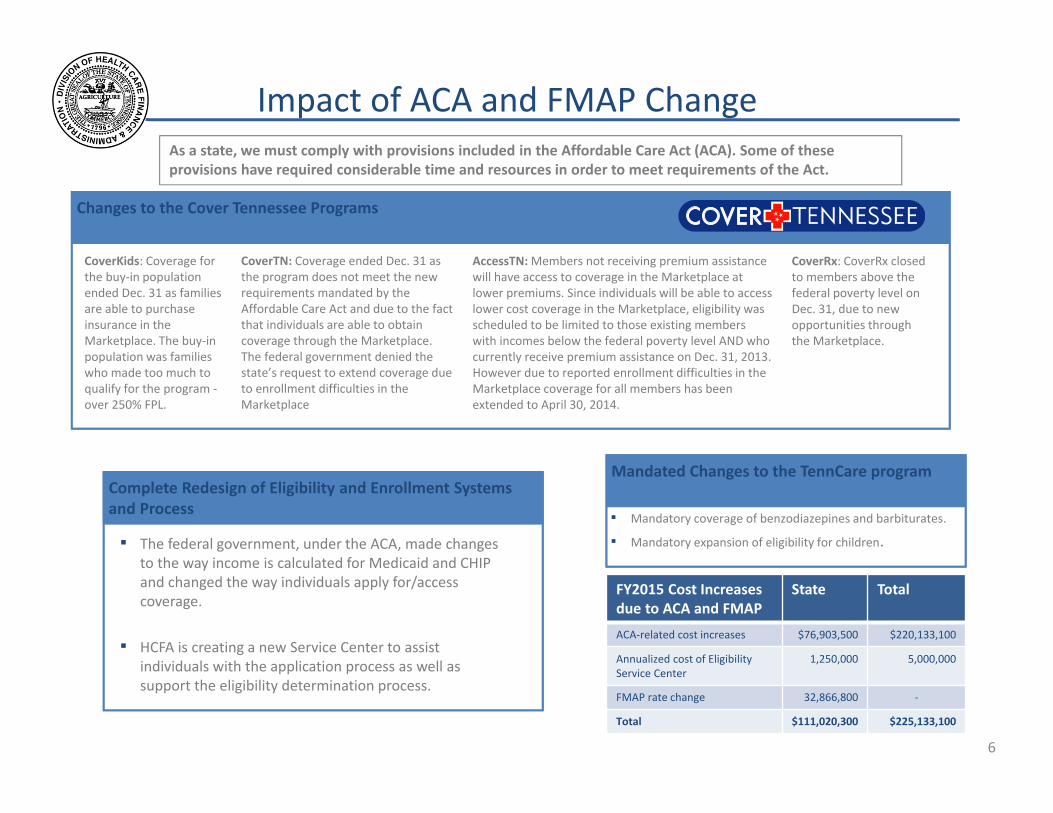
Impact of ACA and FMAP Change As a state, we must comply with provisions included in the Affordable Care Act (ACA). Some of these provisions have required considerable time and resources in order to meet requirements of the Act.
Changes to the Cover Tennessee Programs
CoverTN: Coverage ended Dec. 31 as the program does not meet the new requirements mandated by the Affordable Care Act and due to the fact that individuals are able to obtain coverage through the Marketplace. The federal government denied the state’s request to extend coverage due to enrollment difficulties in the Marketplace
CoverKids: Coverage for the buy‐in population ended Dec. 31 as families are able to purchase insurance in the Marketplace. The buy‐in population was families who made too much to qualify for the program ‐over 250% FPL.
AccessTN: Members not receiving premium assistance will have access to coverage in the Marketplace at lower premiums. Since individuals will be able to access lower cost coverage in the Marketplace, eligibility was scheduled to be limited to those existing members with incomes below the federal poverty level AND who currently receive premium assistance on Dec. 31, 2013. However due to reported enrollment difficulties in the Marketplace coverage for all members has been extended to April 30, 2014.
CoverRx: CoverRx closed to members above the federal poverty level on Dec. 31, due to new opportunities through the Marketplace.
Complete Redesign of Eligibility and Enrollment Systems and Process
▪ The federal government, under the ACA, made changes to the way income is calculated for Medicaid and CHIP and changed the way individuals apply for/access coverage.
▪ HCFA is creating a new Service Center to assist individuals with the application process as well as support the eligibility determination process.
Mandated Changes to the TennCare program
▪ Mandatory coverage of benzodiazepines and barbiturates.
▪ Mandatory expansion of eligibility for children.
FY2015 Cost Increases due to ACA and FMAP
State Total
ACA‐related cost increases $76,903,500 $220,133,100
Annualized cost of Eligibility 1,250,000 5,000,000 Service Center
FMAP rate change 32,866,800 ‐
Total $111,020,300 $225,133,100
6
Delivery System Transformation
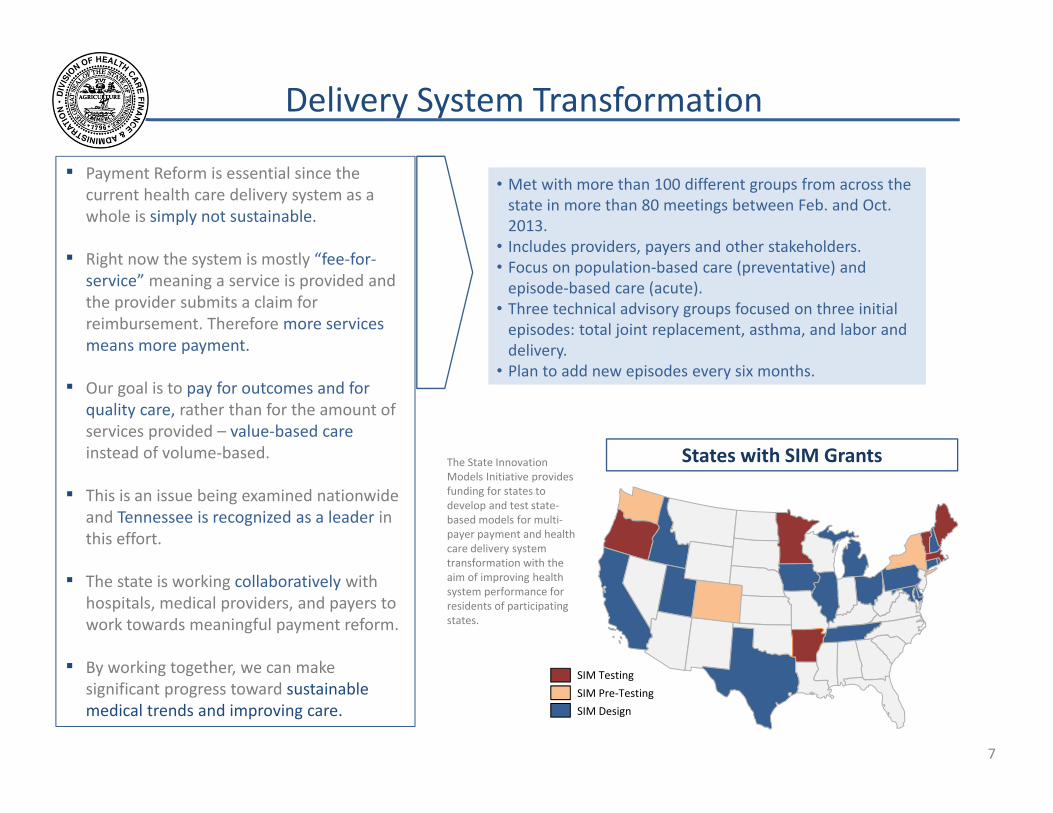
▪ Payment Reform is essential since the current health care delivery system as a whole is simply not sustainable.
▪ Right now the system is mostly “fee‐for‐service” meaning a service is provided and the provider submits a claim for reimbursement. Therefore more services means more payment.
▪ Our goal is to pay for outcomes and for quality care, rather than for the amount of services provided – value‐based care instead of volume‐based.
▪ This is an issue being examined nationwide and Tennessee is recognized as a leader in this effort.
▪ The state is working collaboratively with hospitals, medical providers, and payers to work towards meaningful payment reform.
▪ By working together, we can make significant progress toward sustainable medical trends and improving care.
• Met with more than 100 different groups from across the state in more than 80 meetings between Feb. and Oct. 2013.
• Includes providers, payers and other stakeholders. • Focus on population‐based care (preventative) and episode‐based care (acute).
• Three technical advisory groups focused on three initial episodes: total joint replacement, asthma, and labor and delivery.
• Plan to add new episodes every six months.
The State Innovation Models Initiative provides funding for states to develop and test state‐based models for multi‐payer payment and health care delivery system transformation with the aim of improving health system performance for residents of participating states.
SIM Testing
SIM Pre‐Testing
SIM Design
States with SIM Grants
7
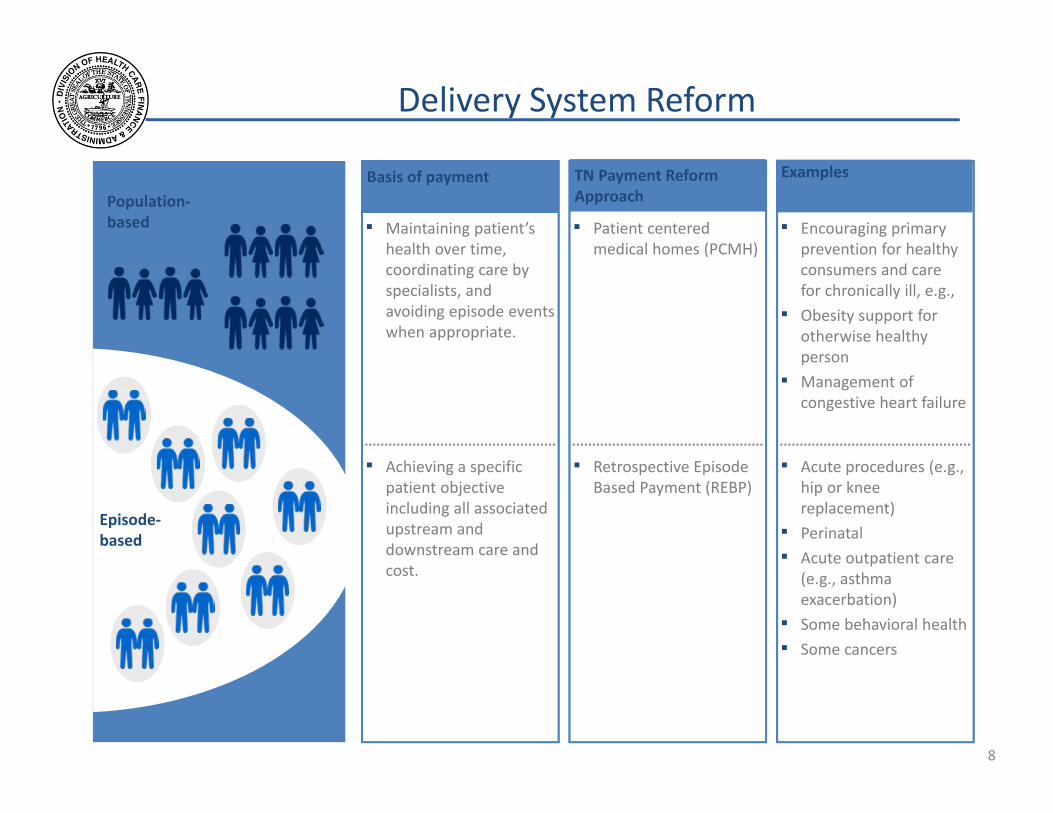
Delivery System Reform
Examples Basis of payment Population‐based
Episode‐based
▪ Maintaining patient’s health over time, coordinating care by specialists, and avoiding episode events when appropriate.
▪ Encouraging primary prevention for healthy consumers and care for chronically ill, e.g., ▪ Obesity support for
otherwise healthy person
▪ Management of congestive heart failure
▪ Acute procedures (e.g., hip or knee replacement) ▪ Perinatal ▪ Acute outpatient care
(e.g., asthma exacerbation) ▪ Some behavioral health
▪ Some cancers
▪ Achieving a specific patient objective including all associated upstream and downstream care and cost.
TN Payment Reform Approach
▪ Patient centered medical homes (PCMH)
▪ Retrospective Episode Based Payment (REBP)
8
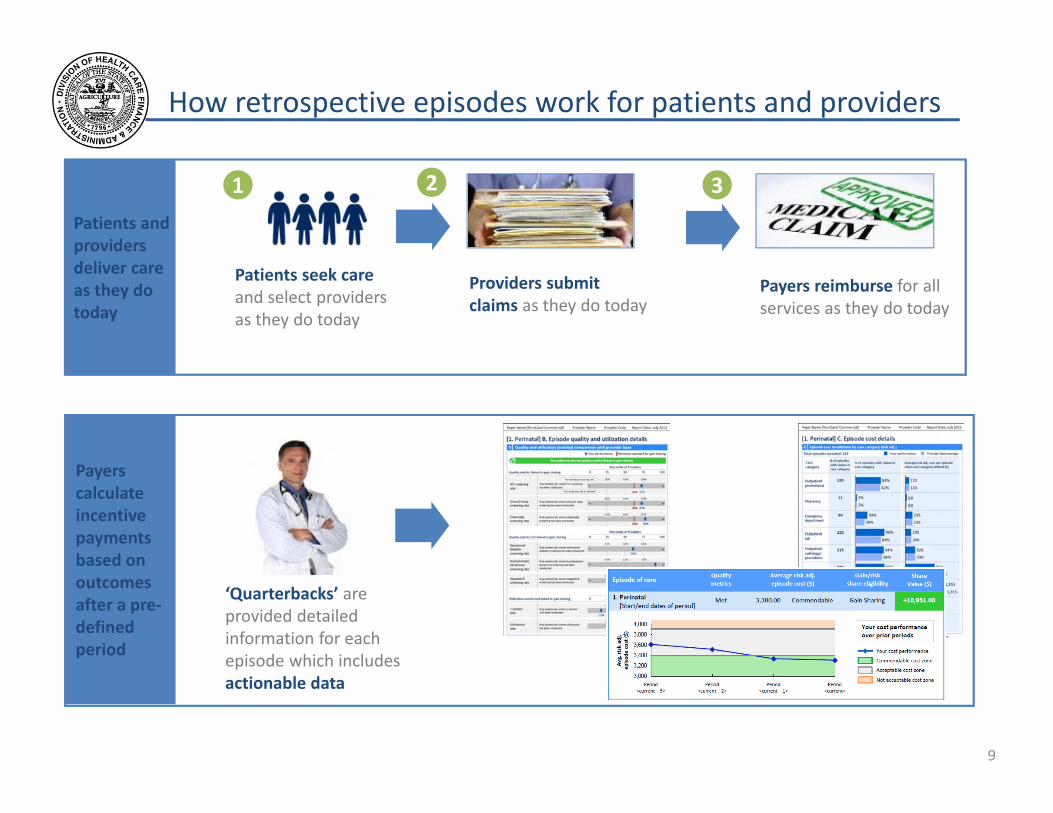
How retrospective episodes work for patients and providers
Payers reimburse for all services as they do today
Patients seek care and select providers as they do today
1 2 3
Providers submit claims as they do today
‘Quarterbacks’ are provided detailed information for each episode which includes actionable data
Patients and providers deliver care as they do today
Payers calculate incentive payments based on outcomes after a pre‐defined period
9
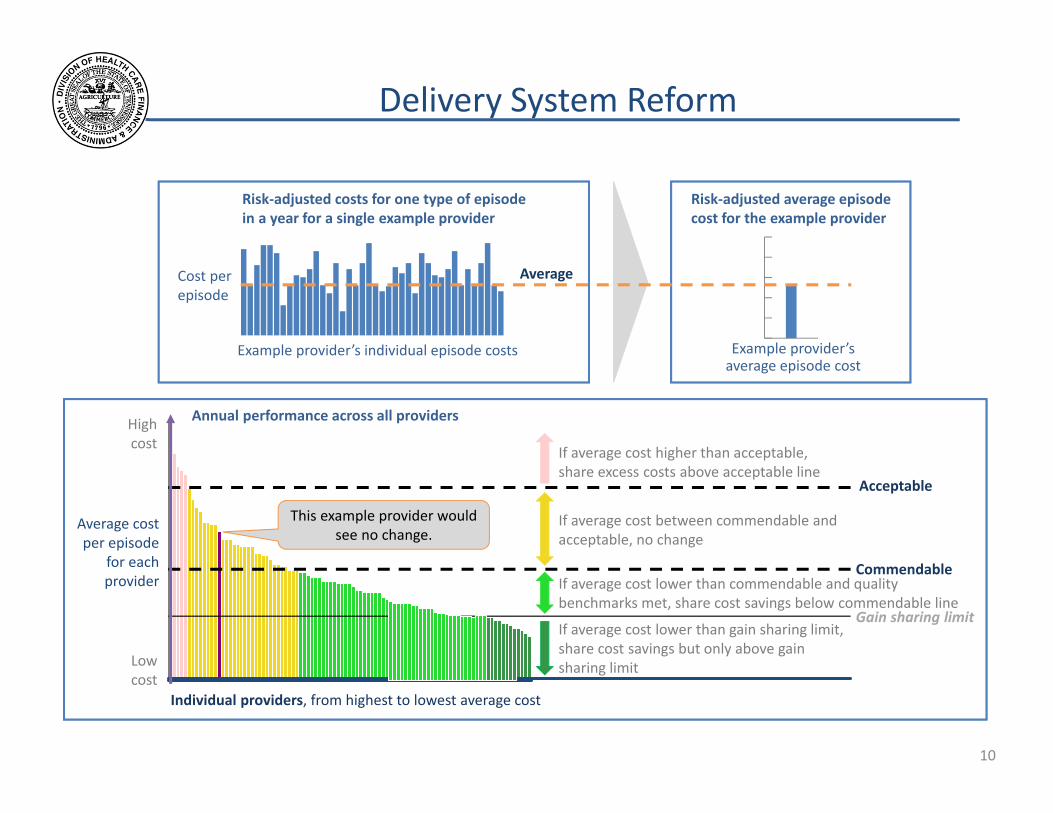
Delivery System Reform
Cost per episode
Example provider’s individual episode costs
Risk‐adjusted average episode cost for the example provider
Example provider’s average episode cost
Average
Risk‐adjusted costs for one type of episode in a year for a single example provider
Annual performance across all providers High cost
This example provider would see no change.
If average cost lower than commendable and benchmarks met, share cost savings below co
If average cost higher than acceptable, share excess costs above acceptable line
If average cost between commendable and acceptable, no change
If average cost lower than gain sharing limit, share cost savings but only above gain sharing limit
quality mmendable line
Acceptable
Average cost per episode
for each Commendableprovider
Gain sharing limit
Low cost
Individual providers, from highest to lowest average cost
10
PCP
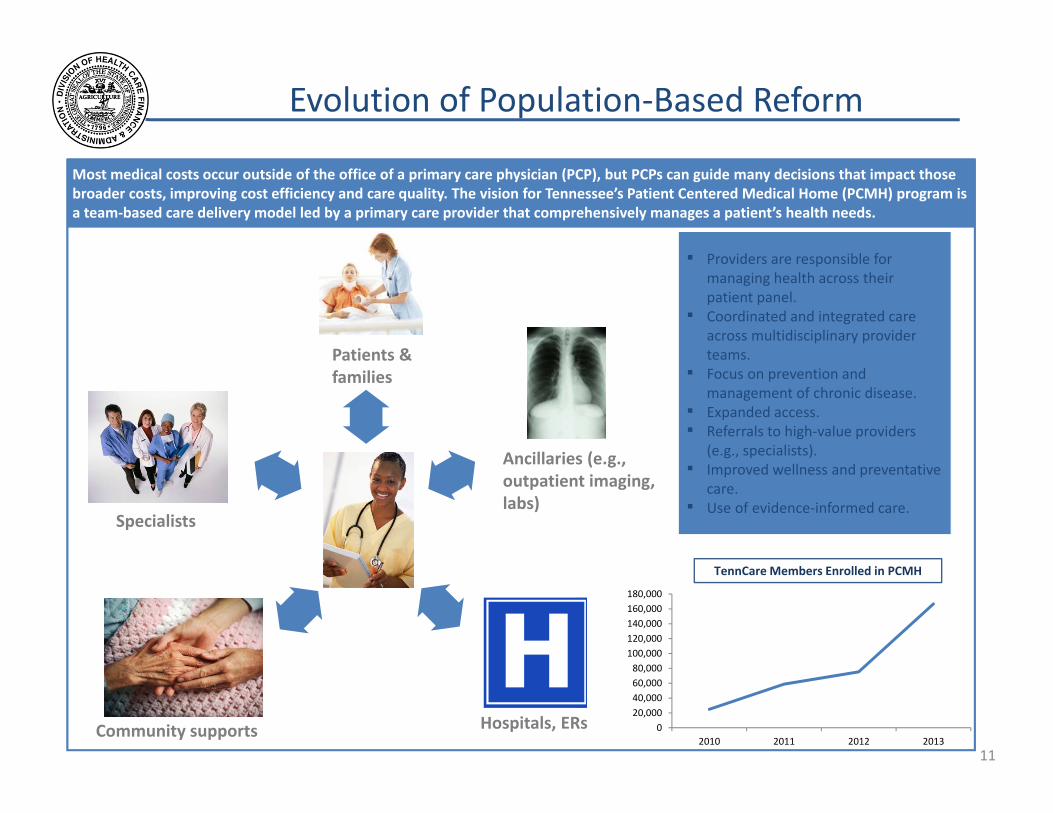
Evolution of Population‐Based Reform
Most medical costs occur outside of the office of a primary care physician (PCP), but PCPs can guide many decisions that impact those broader costs, improving cost efficiency and care quality. The vision for Tennessee’s Patient Centered Medical Home (PCMH) program is a team‐based care delivery model led by a primary care provider that comprehensively manages a patient’s health needs.
Specialists
Patients & families
Hospitals, ERs Community supports
Ancillaries (e.g., outpatient imaging, labs)
▪ Providers are responsible for managing health across their patient panel.
▪ Coordinated and integrated care across multidisciplinary provider teams.
▪ Focus on prevention and management of chronic disease.
▪ Expanded access. ▪ Referrals to high‐value providers
(e.g., specialists). ▪ Improved wellness and preventative
care. ▪ Use of evidence‐informed care.
0
20,000
40,000
60,000
80,000
100,000
120,000
140,000
160,000
180,000
2010 2011 2012 2013
TennCare Members Enrolled in PCMH
11
Conclusion
• Continued leadership – managed care, integration, improving quality, controlling trend.
• Health care reform continues to put financial pressure on the program and the state of Tennessee.
• Persistent cost pressures apart from health care reform.
• Must remain constantly vigilant to effectively manage health care programs.
12