Embed Size (px)
DESCRIPTION
Data processing (Making figures and tables) 陳舜華 Shun-Hua Chen Dept. Microbiology and Immunology College of Medicine National Cheng Kung University Room: 82-1119 Tel: +886-6-2353535 ext. 5633 E-mail: [email protected]. Examples of tables. - PowerPoint PPT Presentation
Citation preview

1
Data processing (Making figures and tables)
陳舜華 Shun-Hua Chen
Dept. Microbiology and ImmunologyCollege of Medicine National Cheng Kung University
Room: 82-1119Tel: +886-6-2353535 ext. 5633E-mail: [email protected]

2
1. Tables are preferred for presenting repetitive data and exact numbers.
2. Tables contain headings that are sufficiently clear so that the meaning of the data is understandable without reference to the text. (A sentence in present or past tense or a term).
3. Tables contain explanatory footnotes that are to explain the meaning of data, not the details for repeating the experiments.
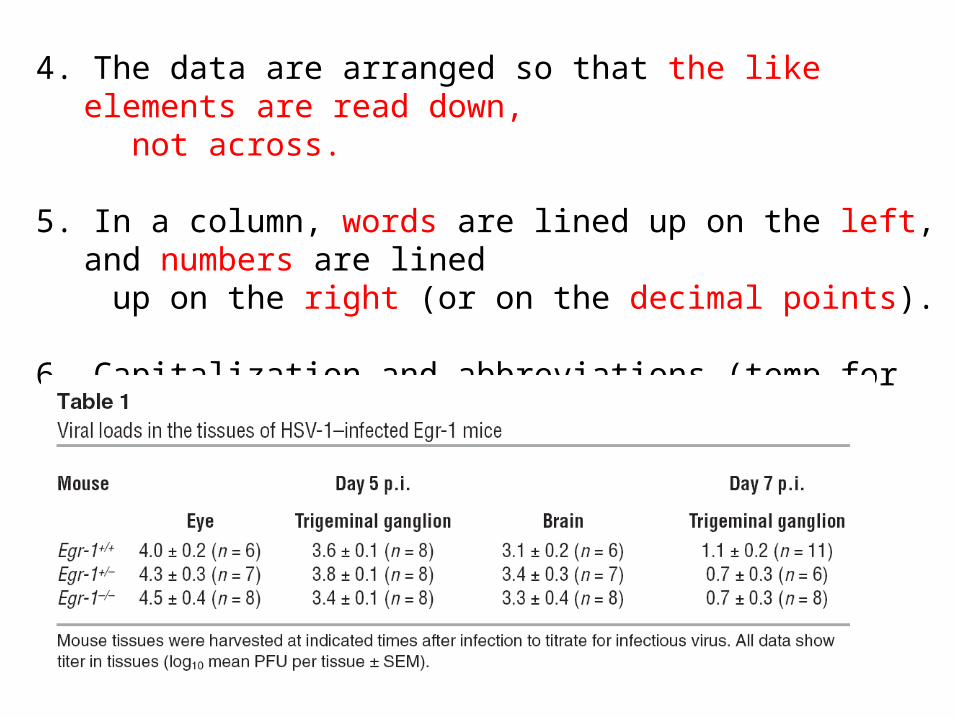
The number of samples tested is shown in
the parentheses.
Examples of tables
3
OrganismOptimal growth
temp (˚C)Color of
myceliumAntibiotic produced
Yield of antibiotic (mg/ml)
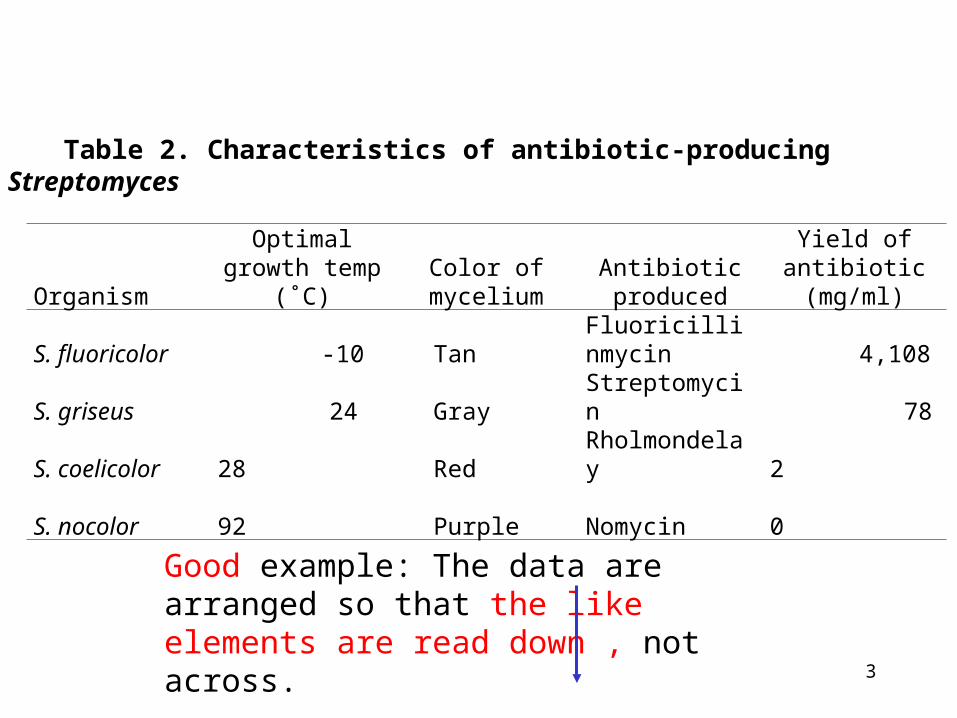
S. fluoricolor -10 Tan Fluoricillinmycin 4,108S. griseus 24 Gray Streptomycin 78S. coelicolor 28 Red Rholmondelay 2S. nocolor 92 Purple Nomycin 0
Table 2. Characteristics of antibiotic-producing Streptomyces
Good example: The data are arranged so that the like elements are read down , not across.

4
Determination S. fluoricolor S. griseus S. coelicolor S. nocolorOptimal growth temp (˚C)
-10 24 28 92
Color of mycelium
Tan Gray Red Purple
Antibiotic produced
Fluoricillinmycin Streptomycin Rholmondelay Nomycin
Yield of antibiotic (mg/ml)
4,108 78 2 0
Table 3. Characteristics of antibiotic-producing Streptomyces
Bad example: The data are arranged in a way that the like elements are read across.
5
4. The data are arranged so that the like elements are read down, not across.
5. In a column, words are lined up on the left, and numbers are lined up on the right (or on the decimal points).
6. Capitalization and abbreviations (temp for temperature and No. for number).

6
Are following tables good or bad? Why?
Temp (˚C) No. of exp. Aeration of growth medium
Growtha
24 5 +b 7824 5 - 0
Table 4. Effect of aeration on growth Streptomyces coelicolor
a As determined by optical density.b Aeration was provided by blowing air into culture bottles.
Bad: too few data points (at least 6 data points)
You can describe the data of this table in text. (The growth of bacterium needs oxygen.)

7
Table 5. Bacteriological failure rates
Nocillin K Penicillin5/35 (14)a 9/34 (26)
a Results expressed as number of failures/total, which is then converted to a percentage (within parentheses). P = 0.21

8
Table 6. Effect of temperature on growth of oak (Quercus) seedlings
Temp (˚C) Growth in 48 h (mm)-50 0-40 0-30 0-20 0-10 0 0 010 020 730 840 150 060 070 080 090 0
100 0
Bad: this table is not necessary
You can describe the data of this table in text. (The growth temperature for the bacterium was from 20-40 ˚C.)
9
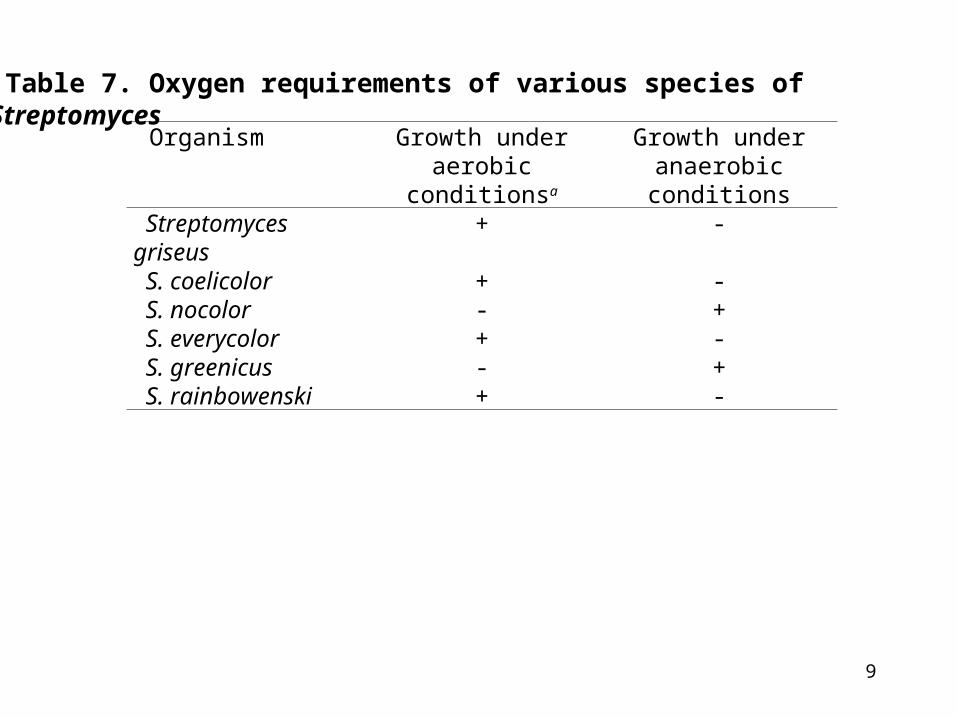
Organism Growth under aerobic conditionsa
Growth under anaerobic conditions
Streptomyces griseus + - S. coelicolor + - S. nocolor - + S. everycolor + - S. greenicus - + S. rainbowenski + -
Table 7. Oxygen requirements of various species of Streptomyces

10
No. of patients Side effect 14 Diarrhea
5 Eosinophilia ( 5 eos/mm≧ 3)2 Metallic tastea
1 Yeast vaginitisb
1 Mild rise in urea nitrogen1 Hematuria (8-10 rbc/hpf)
Table 8. Adverse effects of nicklecillin in 24 adult patients

11
Tables
• must be submitted in an acceptable format by the journal (with horizontal lines only or both horizontal and vertical lines).
• are preferred to be generated by a word program like Microsoft Word. (A straight Excel file is not currently an acceptable format.)
• are typed on a separate page (1 table per page) and assembled in the back of MS (after “References” and before or after “Figure legends”).

12
Figures, graphs, and charts
1. They are preferred for presenting a picture of the trend.2. There are no definite formats (can be presented as bar, pie, and line graphs) or soft wares for making them.3. Large and readable letter size, standard symbols, and thick lines should be used. 4. Appropriate ordinates (top and bottom space) should be used.5. They are often combined in a “over and under” rather than “side by side” way. 7. All legends are typed together on separate pages and placed
before figures. Legends and figures (1 figure per page) are assembled in the end of MS.
Taiwan students should spend effort on figure legends.

13
Heading Figure 2Egr-1 increases HSV-1 replication. Growth of strain KOS in SK-N-SH cells transfected with an antisense or scramble oligomer to Egr-1 (A) or in embryonic fibroblasts (B) and brain slices (C) prepared from Egr-1+/+ or Egr-1–/– mice. Data show mean + SE values (error bars) from 2 independent experiments, each done in duplicate. *P < 0.05, Student’s t test.

14
Figure 3. Reduction of the mortality and subsequent paralysis sequelae of EV71-infected mice by ribavirin, via reduction of viral loads in tissues. Infected mice were treated with PBS (white symbols; n = 11) or ribavirin (black symbols; n = 10). The survival rates (A) and clinical scores (B) of mice were recorded. C, In separate experiments, the indicated organs of infected mice treated with PBS (n = 6) or ribavirin (n = 6) were collected on day 5 after infection to determine viral titers. Data shown in B and C are mean + SE values. *P < 0.05, by log-rank test (A), Wilcoxon test (B), and Mann-Whitney U test (C).

15
Figure Legends
1. A term or a sentence (in present or past tense) is used as headings should be sufficiently clear so that the meaning of the data is understandable without reference to the text.
2. Legends are to explain the meaning of data, not the details for repeating the experiments. They should define all symbols used in the figures and define all abbreviations that are not used in the text.

16
Photographs
All digital images should not be manipulated.
1. No specific feature within an image may be enhanced, obscured, moved, removed, or introduced.
2. The grouping of images from different parts of the same gel, or from different gels, fields, or exposures must be made explicit by the arrangement of the figure (i.e., using dividing lines) and in the text of the figure legend.
3. Adjustments of brightness, contrast, or color balance are acceptable if they are applied to the whole image and as long as they do not obscure, eliminate, or misrepresent any information present in the original, including backgrounds.

17
Homework:
1. Analyze the tables, table footnotes, figures, and figure legends for your paper.
2. Practice to make your own tables, table footnotes, figures, and figure legends