Embed Size (px)
Citation preview

1
SSUUSSTTAAIINNAABBLLEE LLIIVVEELLIIHHOOOODD PPRROOJJEECCTT IINN
RRUUKKMMAAVVAATTII RRIIVVEERR BBAASSIINN AARREEAA
MMAANNDDVVII--BBHHUUJJ--KKUUTTCCHH
DDEETTAAIILL PPRROOJJEECCTT RREEPPOORRTT
SShhrreeee VViivveekkaannaanndd RReesseeaarrcchh aanndd TTrraaiinniinngg IInnssttiittuuttee -- MMaannddvvii
((VVRRTTII))
Near Jain Ashram, Nagalpur Road,
Mandvi, Dist. Kutch (Gujarat) - Pin. 370 465
Phone: (02834) 223934, 223253, Fax : (02834) 223838
Email: [email protected], [email protected]

2
Sustainable Livelihood Project
Rukmavati River Basin Area
Mandvi-Bhuj-Kutch Introduction
River is an important physical agent that plays very vital role in distribution of water and maintaining equilibrium of water in hydrological cycle. The area from where river collects water is termed as watershed or catchment area. The whole unit can be defined as basin where set of physical processes are interlinked with each other and maintain relationships between biological and non biological components. It is well known truth that any major civilization has developed around river or in other wards within balanced watershed region due to healthiness of natural resources. Management of such basin is not only important for mankind only but also to maintain healthiness of environment of a particular region.
Rukmavati Basin
Keeping this concept in mind Rukmavati River Basin Management project is being planned by Kachchh based NGOs such as Vivekanand Research and Training Institute (VRTI), Shrujan, and Arid Communities and Technologies (ACT) in collaboration with local communities.
Rukmavati river basin is located in Mandvi taluka of Kachchh district. Details of the area are as under; No of Villages : 46 Total population : 108033 Total area : 59075 Ha. Total Agri. Area : 33477 Ha. Irri.Area : 15366 Ha. Culti. waste land : 5649 Ha Forest area : 4282 Ha. Other Land : 15671 Ha.
Location Map of Rukmavati Basin
Geological Map of Rukmavati Basin
M o ta
N a g a lp a r
N a n i
R a y a n M o ti
M a m a y m o ra
L u d v a
V a d a s a r
A s am biy a N an a
G o n iya s ar
R a m p a r
B h era iya
D u rga p a r
Ja m tha d a
V in g an iya
N a b ho i
D a ras h a di
Ja k ha n iya
K o ja ch o ra
S a m a tra
S a rl i
D h o kd aA s am biy a M o ta
B h ad a i M o t i
A ja p ar
K u rb a i
D a h in sa ra
D h u na i
V a nd h a y
V e kra
P u na d i
V a nd h
D o n
K o da y
M a n d v i
G e o log y
B hu j F orm ation
D ecc an T ra p
J hu ran F orm atio nJ um a ra F orm atio n
K an k a v a ti S e r iesM ad h S e ries
R ece n t
S tud y V illa g esW ate rs he d
6 0 6 12 K ilo m ete rs
N
3
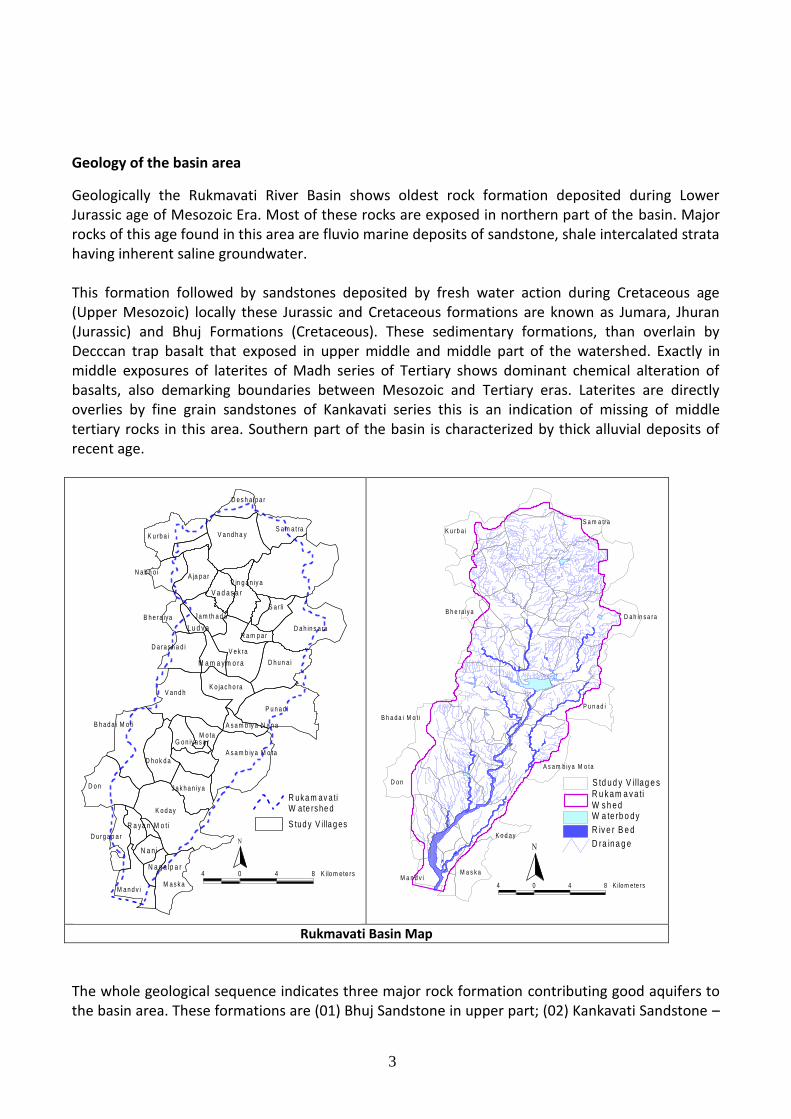
Geology of the basin area
Geologically the Rukmavati River Basin shows oldest rock formation deposited during Lower Jurassic age of Mesozoic Era. Most of these rocks are exposed in northern part of the basin. Major rocks of this age found in this area are fluvio marine deposits of sandstone, shale intercalated strata having inherent saline groundwater. This formation followed by sandstones deposited by fresh water action during Cretaceous age (Upper Mesozoic) locally these Jurassic and Cretaceous formations are known as Jumara, Jhuran (Jurassic) and Bhuj Formations (Cretaceous). These sedimentary formations, than overlain by Decccan trap basalt that exposed in upper middle and middle part of the watershed. Exactly in middle exposures of laterites of Madh series of Tertiary shows dominant chemical alteration of basalts, also demarking boundaries between Mesozoic and Tertiary eras. Laterites are directly overlies by fine grain sandstones of Kankavati series this is an indication of missing of middle tertiary rocks in this area. Southern part of the basin is characterized by thick alluvial deposits of recent age.
Rukmavati Basin Map
The whole geological sequence indicates three major rock formation contributing good aquifers to the basin area. These formations are (01) Bhuj Sandstone in upper part; (02) Kankavati Sandstone –
K o d a y
D o n
V a n d h
P u n a d i
V e k ra
V a n d h a y
D h u n a i
D a h in s a ra
K u rb a i
M a s k a
A ja p a r
B h a d a i M o ti
A s a m b iy a M o ta
M a n d v i
D h o k d a
S a r li
S a m a t ra
K o ja c h o ra
J a k h a n iy a
D a ra s h a d i
N a b h o i
V in g a n iy a
J a m th a d a
D u rg a p a r
D e s h a lp a r
B h e ra iya
R a m p a r
G o n iya s a r
A s a m b iy a N a n a
V a d a s a r
L u d v a
M a m a y m o r a
R a ya n M o t i
N a n i
N a g a lp a r
M o ta
S tud y V illa g es
R uk a m av ati W ate rshe d
4 0 4 8 K ilo m ete rs
N
D a h in s a ra
K u rb a i
D o n
M a s k a
B h e ra iy a
A s a m b iy a M o ta
S a m a tra
P u n a d i
K o d a y
B h a d a i M o t i
M a n d v i
D ra ina g e
R iv e r B e d
W a te rb o dy
R u k am a v a ti W s h ed
S td ud y V illag e s
4 0 4 8 K ilo m ete rs
N

4
in middle-lower and upper lower parts and (03) alluvium in lower part. Average water level in all these formation ranging from 75 m to 130 m especially in case of deep aquifers whereas in case of shallow aquifer systems it ranges from 3 to15 m. Aim and Objectives The Rukmavati Basin Management project is aimed to conceptualize River Basin Management in Arid to Semi Arid and geologically complex region like Kachchh. To achieve the aim following objectives have been framed To understand potential of various natural resources like water, land, vegetation etc. within the
basin and aware the stake holders about the situation To understand issues and challenges of the river basin management To understand existing socio-economic status from its problems and perspective point of view To institutionalize decentralized but people’s centered resource management mechanism Approach and Methodology There will be three phases of the entire project such as Community awareness, Planning phase, Implementation phase and Monitoring phase. Three approaches bottom up, participatory and decentralized are adopted to execute the project. Community awareness & Planning Phase:
Selection of local youth as para engineers
Intensive Training of selected para engineers.
Mapping of basin area. (Base map, land use map, Water Resource Map, Geomorphology, Geo hydrology, Water level & Water quality map etc.)
Detail base line survey for the basin (Agriculture - Surface water - Animal husbandry - Rain fed farming-Irrigated farming (Through wells, Ponds, Dams, Canals etc.)- Well inventory- Food and fodder)
Formation of different types of groups
Linkages & integration with various resources & creating services
Analysis of data for strategic planning.
Village wise Action plan with villagers

5
DETAIL BASE LINE SURVEY FOR THE BASIN
Sr.No
Type of Survey & Monitoring
Objectives Outcome
Sector : Water Resource
1. Well Inventory (No. of Wells: 1639)
1. To identify ground water potential area in basin. 2. To set up monitoring of well. 3. To understand aquifer types & its spread.
1. Maps of ground water zone of basin area.
2. Pre & Post monsoon well monitoring
1. To understand changing trends in water level & water quality. 2. To estimate ground water recharge estimation. 3. To understand ground water movement
1. Pre & post monsoon water quality (TDS) and water level maps. 2. Ground water recharge potential map.
3. Surface water resource inventory
1. To understand existing surface water resource availability. 2. To work out water budget.
1. Surface water resources map.
Sector : Agriculture
5. Agriculture productivity survey (Sampling method)
1. To know cropping pattern of the basin area. 2. To estimate productivity of different crops under rain fed & irrigated condition. 3. To know major source of irrigation & methods of irrigation.
1. Cropping pattern & productivity details of basin area. 2. Details of area under irrigated & rain fed agriculture.
6. Household food consumption survey (Sampling method)
1. To understand food consumption pattern of basin area. 2. To estimate food requirement of basin area.
1. Food balance (Demand v/s Supply) of basin area. ( Negative or positive balance in particular grain or pulse production at basin level)
Sector : Animal & Husbandry
7 A & H sector practices survey (Sampling method)
1. To understand productivity of animals, i.e. milk, wool etc. 2. To understand fodder management in normal rainfall year and drought year. 3. To understand herd management practices. 4. To understand marketing of animal products. 5. To estimate milk production at basin level.
1. Milk balance (Demand v/s Supply) of basin area.

6
Details of Water resources
1. Surface water resources:
All existing water bodies have been surveyed through GPS for entire basin as shown in the map and matched with Satellite images. Details of structures with storage capacity are as under. We have also considered the present status of each structure and strategy to make them efficient
2. Ground water resources:
5 0 5 1 0 K i lo m e te r s
NW a te rb o d y
L e g e n d
V a n d h a y
D e s h a lp a r
S a m a tr a
K u rb a i
N a b h o i
M o t iA ja p a r
V a d a s a r
B id d a p a d a r
V in g a d iy a
Z iz u t im b o
S a r l i
D a h in s a ra
B h e r a iy a
L u d v a
J a m th a d a
R a m p a r
V e k r a
D a r s a d i
M a m a y
m o r a
D h u n a i
P u n d i
K o ja c h o ra
V a n d h
B h a d a i
D h o k d a
A s a m b i y a
N a n a
G o n iy a s a r
M o ta A s a m b i y a
M o ta
D o n
K o d a y
J a k h n iy a
T a lv a n a
V a d a
D u r g a p u r
R a y a n
M o t i
R a y a n
N a n i
R a jp a r
T im b o
B h a r a p a r
M a n d v iM a s k a
G o n iy a s a r
N a n a
B a s in b o u n d a ry
B A S I N S U R F A C E W A T E R B O D Y M A P
Sr. No.
Type of resource
No. of resource
Storage capacity (MCFT)
1. Checkdam 153 225.69
2. Percolation Tank
43 40.76
3. Irrigation Dam 17 26348.66
4. Drinking water tank
17 76.79
5. Domestic water use tank
29 158.57
6. Tank for Animals
139 867.77
Total 398 27718.24

7
At present major source of irrigation in the basin is ground water. However there is medium irrigation dam ‘Vijay sagar’ in the centre helps some part in down steam side. As shown in the map in lower side, in alluvium and sandy area and upper side, in sand stone area high density of tube wells is observed while in other areas ground water is not available except shallow aquifers in weathered basalt in the middle. Detail is as under;
A. Water Quality For water quality, we have fixed 250 monitoring wells in the basin. Water sample collection started in November 2009 (post monsoon). We put TDS data on the maps and generated ISO TDS contour maps for Nov. 2009 and June 2010(Pre monsoon) as shown in the maps. We will continuously monitor the wells and prepare comparison statement. Comparison of Pre and post monsoon maps and comparison statement will give the clear picture of impact of water harvesting on ground water quality.
B. Ground water level Similarly for ground water level, we started to measure water level of same 250 monitoring wells from Nov. 2009 and is continue afterward for pre and post monsoon period to know the impact of ground water recharge by comparing reduced water level (RWL) maps. In addition to that it will helpful to assess the impact of ground water recharge on salinity ingress in coastal aquifer where water level is far below mean sea level (MSL)
TDS maps:
TDS Post monsoon 2009 TDS Pre monsoon 2010
# #
#
# #
#
# ##
#
#
#
####
##
#
###
#
#
#
##
#####
#
###
##
#
##
### #
## #
#
#
#
#####
#
####
####
######
# #
#
## ##
#
#
###
#
#### #######
###
###
#
#
####
#
##
##
#
#
#
#
#
####
##
#
#
#####
#
#
##
#
#
###
##
###
##
#
##
###
#
###
#
##
##
#######
#
#
#
#
##
#
##
#
#
#
##
#
####
#
### ##
#
######
#
#
#
##
## ####
#
####
##
# ###
###
#
##
# ### #
#
##
#
#
##
#
#
##
#
#
#
##
##
## ## ####
###### ### #
#
#
#
#
## #
#
###
####
###
#
###### #
# ## ##
###### #### ####
##
####
## #
######
###
###
##
#
# ##
#########
###### ##
##
#
#
####
#
###
#
##
# #
####
# ##
#
#
## ##
#
# #
##
#
#
## ###
##
#
###
#
#
#
###
#
# #
##
###
#
####
#
#
#
###
####
#
##
###
##
##
#
#
#
## ##
#
##
#
#
#
#
#
#
#
#
##
#
##
#
#
#
#
#
##
#
#
#
#
#
#
##
#
####
#
#
# #
#
#
#
##
#
#
#
##
##
#
#
#
##
#
#
#
#
#
#
#
##
##
##
#
#
##
#
#
# #
#
#
#
#
#
#
#
#
#
##
#
#
###
#
#
#
#
#
#
###
#
#####
#
#####
#
## ##
#
#
###
#
#
#######
#
#
########
#####
##
########
##
#
#
#####
#### ###
##
###
#
#
################ ####
####
### ##
#
######
##
###
####
####
###
###
#
#
#
#
##
#
#
###
###
#
#
##
##########
#
##
####
#
###
##
## ##
###
########
####### ########
##### ###
###
#
###
##
##
## #
#
#####
#
#
#
##
###
#### ########
##
###
##
### #####
#
#
### ###
####
#
## #
#
### #
#
##
####### ####
# #
###
#
##
###
#
###
#
####
##
# ###
####
#
##### #
#
# ###
#
##
###
#####
###
## ##
##
# #
#
#### ###
## ##########
###
#
########### #######
###
####
###
#######
###
###
###
### #####
# ### ###
# ### #
## ##
##
##
##
#
#
##
##
#
#
#
#
##########
##
#
##
##
# ##
## #
##
########
#####
#
#
###### #
# ######
##
#
#
####
## ########
### ############ ####
#
#
#####
# ## ##### # ##
#
#### #
####
####
#
##
##################### ###
###################
#
###### #
### #####
#
## ###
##
### #
##
#
#
########
########
#
#
#### ######## ####### #
#
###
############### ###
###
### #######
########
#
#
######
#########
# ####
########
#######
###
###
###
###########
###
#
####
##
#
#
####
#####
## #
#
#
####
#
####
##
####
#
###
#
#
##
# #
#
#
#
##
###
###
#########
###
###
#
#
#
#
#
#
##
##
#
#
##
###
##
#
###
#
#
## #
#
#
D a h in s a r a
D o n
M a s k a
B h e ra iy a
A s a m b iy a M o ta
P u n a d i
K o d a y
M a n d v i
A ja p a r
Ku rb a i
Sa m a t ra
D a h in s a ra
N a b ho i
K o d a y
D o n
V a n d h
V e k ra
V a n d h a y
D h u n a i
D a h in s a ra
K u rb a i
M a s k a
A ja p a r
B h a d a i
M o ti
A s a m b iy a M o ta
M a n d v i
D h o k d a
S a r l i
S a m a t ra
K o ja c h o r a
J a k h a n iya
D a ra s h a d i
N a b h o i
V in g a n iya
J a m th a d a
D u rg a p a r
D e s h a lp a r
R a m p a r
R a y a n M o ti
G o n iy a s a r
N a n a
3 0 3 6 K ilo m ete rs
N R iv erW a te r B o dy
S tu die d W e lls#
# M o nito ring W e lls
V illa ge B ou n da ry
Le g en d
Sr. No.
Type of well No. of well
1. Dug well 93
2. Dug cum bore well 13
3. Bore well 1533
Total 1639

8
RWL maps:
RWL Post monsoon 2009 RWL Pre monsoon 2010
#
#
#
#
#
#
#
#
#
#
#
#
#
#
#
##
##
#
##
#
#
##
#
##
#
#
#
#
#
#
#
#
##
#
#
600 0
500 0
500 0
400 0
400 0
300 0
300 0
200 0
200 0
150 0
200 0
200 0
300 0
300 0
150 0
150 0
200 0
200 0
300 0
300 0
200 0
200 0
150 0
150 0
150 0
200 0
200 0300 0
300 0
400 0
400 0
500 0
500 0
200 0
150 0
150 0
200 0
200 0
200 0 150 0
150 0
200 0
400 0
200 0
150 0
200 0
130 00
120 00
110 00
100 00
110 00
100 00900 0
900 0
800 0
700 0
600 0
500 0
400 0
500 0
500 0
400 0
400 0
400 0
300 0
200 0
150 0150 0
200 0
300 0
300 0
200 0
150 0
150 0
200 0
300 0
300 0
800 0
700 0
600 0
500 0
400 0
200 0
150 0
600 0
D o n
K o d a i
M a s k a
P ip r i
W a nd h
S a r liLu d v a
F il on
P u n d i
M a n d v i
D h ok da
D h un a i
R a m p a r
A ja p a r
V ir a n i
K u r ba i
S u k h p a r
N a v a v a s
T a lv a n a
D a rs ad i
W a da s a r
V a n dh a y
S a m atr a
N a ga lp a r
J a k h an ia
J a m th a d aB h e ra iy a
D e s a lp a r
D a h i s a ra
K o ja c h o r a
M a m a y m o r a
V in g a d iy a
R a ya n n a n a
B h a da i M o t i
B h a da i N a n i
N a bh o i M o t i
N a bh o i N an i
R a jp a r T im b o
A s a m b iy a M o ta
A s a m b iy a N a n a
G on iy a s a r M o ta
E x c e le n t W a te r Q u a lity(T D S < 5 0 0 m g / lit)
G o o d W a te r Q u a lit y(T D S 5 0 0 - 1 5 0 0 m g / lit)
M o d e ra te /P e rm is s ib le W a te r Q u a lity(T D S 1 5 0 0 - 2 0 0 0 m g /lit)
B ra c k is h /P a r tia l S a lin e W a te r Q u a lity(T D S 2 0 0 0 - 3 0 0 0 m g /lit)
S a lin e W a te r Q u a lity(T D S > 3 0 0 0 m g /lit)
T D S P o s t M o n s o o n - 2 0 0 9
4 0 4 8 K ilo m ete rs
N
#
#
#
#
#
#
#
#
#
#
#
#
#
#
#
##
##
#
##
#
#
##
#
##
#
#
#
#
#
#
#
#
##
#
#
D o n
K o d a i
M a s k a
P ip r i
W a nd h
S a r liLu d v a
F il on
P u n d i
M a n d v i
D h ok da
D h un a i
R a m p a r
A ja p a r
V ir a n i
K u r ba i
S u k h p a r
N a v a v a s
T a lv a n a
D a rs ad i
W a da s a r
V a n dh a y
S a m atr a
N a ga lp a r
J a k h an ia
J a m th a d aB h e ra iy a
D e s a lp a r
D a h i s a ra
K o ja c h o r a
M a m a y m o r a
V in g a d iy a
R a ya n n a n a
B h a da i M o t i
B h a da i N a n i
N a bh o i M o t i
N a bh o i N an i
R a jp a r T im b o
A s a m b iy a M o ta
A s a m b iy a N a n a
G on iy a s a r M o ta
2000
2000
3000
3000
40004000
3000
3000
2000
1500
1500
2000
2000
1500
1500
2000
1500
1500
2000
2000
3000
2000
2000
3000
30004000
5000
60007000
5000
40003000
2000
200030004000
5000
60006000
5000
4000
3000
3000
3000
5000 6000
1500
1500
500
500
500
500
500 - 1500
500
1500
1500
2000
2000
3000
3000
4000
4000
4000
4000
3000
3000
2000
2000
500500
1500
1500
1500
1500
150015002000 2000
1500
1500
1500
1500
2000
2000
1500
1500
1500
1500
1500
N
4 0 4 8 K ilo m ete rs
T D S P re M o n s o o n - 2 0 1 0
S a lin e W a te r Q u a lity(T D S > 3 0 0 0 m g /lit)
B ra c k is h /P a r tia l S a lin e W a te r Q u a lity(T D S 2 0 0 0 - 3 0 0 0 m g /lit)
M o d e ra te /P e rm is s ib le W a te r Q u a lity(T D S 1 5 0 0 - 2 0 0 0 m g /lit)
G o o d W a te r Q u a lit y(T D S 5 0 0 - 1 5 0 0 m g / lit)
E x c e le n t W a te r Q u a lity(T D S < 5 0 0 m g / lit)

9
Details of Agriculture Resources:
Details of families involved in Agriculture No.
No. of families involved in Rainfed Agriculture 4135
Area under rainfed Agriculture (Hac) 18111
No. of families involved in Irrigated Agriculture 6030
Area under Irrigated Agriculture (Hac) 15366
Total Area under agriculture in basin area (Hac) 33477
1. Major crops in Basin Area:
Kharif Crops: Pearlmillet, Moong, Cotton, Castor, Groundnut, Fodder sorghum
Rabi Crops: Wheat, Cumin, Mustard, Isabgol
Summer crops: Groundnut, Pearlmillet, Fodder sorghum 2. Productivity & production details of Major crops in basin area:
Name of Crop Details Irrigated Rainfed
#
#
#
#
#
#
#
#
#
#
#
#
#
#
#
##
##
#
##
#
#
##
#
##
#
#
#
#
#
#
#
#
##
#
#
D o n
K o d a i
M a s k a
P ip r i
W a nd h
S a r liLu d v a
F il on
P u n d i
M a n d v i
D h ok da
D h un a i
R a m p a r
A ja p a r
V ir a n i
K u r ba i
S u k h p a r
N a v a v a s
T a lv a n a
D a rs ad i
W a da s a r
V a n dh a y
S a m atr a
N a ga lp a r
J a k h an ia
J a m th a d aB h e ra iy a
D e s a lp a r
D a h i s a ra
K o ja c h o r a
M a m a y m o r a
V in g a d iy a
R a ya n n a n a
B h a da i M o t i
B h a da i N a n i
N a bh o i M o t i
N a bh o i N an i
R a jp a r T im b o
A s a m b iy a M o ta
A s a m b iy a N a n a
G on iy a s a r M o ta
-10-20
-20
-30
-40
-40-30
-20
-10
-10
10
10
-20
-30
-40
-50
-60
-70
-80
-90
-100-110
-60
-50-40
-40
-30
-20
-10
10
0
20
30
30
2010
-50
-50
-40
-40
-30
-30
-20
-10
0
0
-10
-20
-30-40
-40
-30
-20
-10
0
10
10
-20
-10
0
0
0
70
60
80
80
80
90
100
110120
130
140
140
130
120
110
100
90
90
100
110
120120
110
100
90
80706060
708090
90
8070
60
100
110
90
100
110
50
40
30
5040 30
60
6070
80
708090
90
100
100
110
110120
120
130
130140
140150
150160
160
4 0 4 8 K ilo m ete rs
N
S tu d y A re a
0 -1 01 0 -2 0
0 to -1 0-1 0 to -2 0-2 0 to -3 0-3 0 to -4 0-4 0 to -5 0-5 0 to -8 0-8 0 to -1 1 0> -1 1 0
2 0 -3 03 0 -4 04 0 -5 05 0 -6 06 0 to 9 0
9 0 -1 2 0
# S a tlm n t.s h p
1 2 0 -1 6 0N o D a ta
R e d u c e W a te r L e v e l - P o s t M o n s o o n 2 0 0 9
#
#
#
#
#
#
#
#
#
#
#
#
#
#
#
##
# #
#
#
#
#
#
##
#
##
#
#
#
#
#
#
#
#
##
#
#
D o n
K o d a i
M a s k a
P ip r i
W a nd h
S a r liLu d v a
F il on
P u n d i
M a n d v i
D h ok da
D h un a i
R a m p a r
A ja p a r
V ir a n i
K u r ba i
S u k h p a r
N a v a v a s
T a lv a n a
D a rs ad i
W a da s a r
V a n dh a y
S a m atr a
N a ga lp a r
J a k h an ia
J a m th a d aB h e ra iy a
D e s a lp a r
D a h i s a ra
K o ja c h o r a
M a m a y m o r a
V in g a d iy a
R a ya n n a n a
B h a da i M o t i
B h a da i N a n i
N a bh o i M o t i
N a bh o i N an i
R a jp a r T im b o
A s a m b iy a M o ta
A s a m b iy a N a n a
G on iy a s a r M o ta
100
100
90
90
80
80
70
70
60
60
50
60
70
80
40
4030
50
6070
80 90100
110120
120110
100
90
50
4030
-10 010
20
20
30
30
40
40
50
Rajpar Timbo60 70
010
010
20
706050
40 40 5060
7080
9090100
110120
130140
140
130
120
110
100
90
90
90
100
80
80
80
70
70
605040
8090100
110110
10090
90
80
9080706060
40 50
7080
90
90
80
7060
50
40
30
20
10
20 30 40 50
80
80
70
70
70
70
80
80
90
90
50
50
40
40
30
30
20
20
10
10
0
010
10
2030
0
0
-50-40
-30
-10-30
-20
-20
-10
-10
-10
-20
-20
-30
-30-40
-40
-50
-50
-60
-70
-80
-90
-90
-90
-80
-70 -60-60
-50 -50 -80
-130
-130
-100
-80
-90
-80
-100
-110
-110
-100
-90
-80
-100
-110
-120
-120
-110
-100-90
-80 -70-60 -50-40 -30
-30
-40
-50
-60-70
-70
-60
-60
-50
-50
-70
-80
-80
-70
-60
-70
-50 -60 -70
-60
-70
-50 -40
-70
-100 -110
-120-110
-100
-100
-110
R e d u c e W a te r L e v e l - P re M o n s o o n 2 0 1 0
N o D a ta1 2 0 -1 6 0
9 0 -1 2 0
6 0 to 9 05 0 -6 04 0 -5 03 0 -4 02 0 -3 0
> -1 1 0-8 0 to -1 1 0-5 0 to -8 0-4 0 to -5 0-3 0 to -4 0-2 0 to -3 0-1 0 to -2 00 to -1 0
1 0 -2 00 -1 0
S tu d y A re a
N
4 0 4 8 K ilo m ete rs

10
Kharif Pear millet Area (Ha) 224 665
Unit Production (KG) 1826 806
Total Production (Tons) 409.024 535.99
Kharif Groundnut Area (Ha) 1019 7605
Unit Production (KG) 2800 1557
Total Production (Tons) 2853.2 11841.54
Kharif Cotton Area (Ha) 4179.4 1100
Unit Production (KG) 2100 2112
Total Production (Tons) 8776.74 2322.96
Kharif Til Area (Ha) 725 2595.8
Unit Production (KG) 520 228
Total Production (Tons) 377 596.24
Kharif Castor Area (Ha) 1427.6 224
Unit Production (KG) 2130 150
Total Production (Tons) 3040.79 33.6
Kharif Moong Area (Ha) 3994
Unit Production (KG) 1776
Total Production (Tons) 7093.416
Kharif Clusterbean
Area (Ha) 578.8
Unit Production (KG) 113
Total Production (Tons) 65.404
Kharif Sorghum Area (Ha) 5665
Unit Production (KG) 3158
Total Production (Tons) 17890.13
Kharif Fodder Area (Ha) 1001
Unit Production (KG) 670
Total Production (Tons) 670.67
Rabi Wheat Area (Ha) 2651.8
Unit Production (KG) 1925
Total Production (Tons) 5104.79
Rabi Isabgul Area (Ha) 243
Unit Production (KG) 140
Total Production (Tons) 31.22
Rabi Fodder Area (Ha) 1172
Unit Production (KG) 6090
Total Production (Tons) 7137.48
Summer Bajra Area (Ha) 228
Unit Production (KG) 1021
Total Production (Tons) 232.788
Summer Fodder Area (Ha) 680
Unit Production (KG) 5250
Total Production (Tons) 3570 3. Total production of major crops under irrigated & rainfed condition in basin area:

11
Total Pearl Millet Production (Tons) 1177.80
Total Groundnut Production (Tons) 14694.74
Total Cotton Production (Tons) 11099.70
Total Til Production (Tons) 973.24
Total Castor Production (Tons) 3074.39
Total Mung Production (Tons) 7093.42
Total Clusterbean Production (Tons) 65.40
Total Sorgham Production (Tons) 17890.13
Total Fodder Production (Tons) 11378.15
Total Wheat Production (Tons) 5104.79
Total Isabgul Production (Tons) 31.22
4. Production balance (Demand v/s Supply) of major food crops of basin area.
Wheat Balance2010(Tn) Demand 5032.26
Production 5104.79
Balance 72.53
Pearl Millet Balance2010(Tn) Demand 1705.68
Production 1177.80
Balance -527.88
Mung Balance2010(Tn) Demand 1016.83
Production 7093.41
Balance 6076.58
Jowar Balance2010(Tn) Demand 69.72
Production 17890.13
Balance 17820.41 Details of Animal & Husbandry Resources:
1. Milk production & balance analysis for basin area:
Total No animals in the basin at present: 53,878
Milk Balance2010(Kiloliter) Demand 5625.61
Production 14194.15
Balance 8568.55
2. Fodder requirement, production & balance analysis for basin area:
Problem analysis and
Total No. of Animal in basin area 53878
Fodder requirement (Tons) 175657
Fodder production in good rainfall year (Tons) 103023
Fodder production in drought year (Tons) 43317
Balance of fodder in good rainfall year (Tons) - 72634 (Deficit)
Balance of fodder in drought year (Tons) -132340 (Deficit)

12
activity plan of Rukmavati River Basin Various natural and manmade problems of the Rukmavati river basin can be described as follow
Water Resources:
Problem Strategy Activity Plan Expected Impact
Limited water resources for
Irrigation
Storing rain water through surface storage
Rainwater Harvesting structures like check
dams, dug well recharge, Construction of
‘Bandhara’, sub surface dyke
Availability of water for irrigation,
Improvement in ground water quality
Water not suitable for irrigation due to high dissolved salts
Ground water Recharge
Salinity ingress in coastal aquifers
Checking sea water intrusion
Soil Resources:
Problem Strategy Activity Plan Expected Impact
Reducing trend in soil fertility, organic
carbon, beneficial microbes & soil health
Mitigating ill effect of chemicals and saline
irrigation water
Promoting use of organic inputs, compost, green
manuring
Improvement in soil quality, Increased
productivity, Increase in soil fertility
Recurrent crop failure due to lack of
knowledge of soil health
Providing information regarding soil health
Soil Health Card having detailed soil analysis
on regular basis
Sustainable crop production
Soil erosion and reducing vegetative
cover
Soil moisture conservation
Contour Trenches, Staggered Trenches,
Silt Traps
Conservation of soil and regeneration of
vegetative cover

13
Agricultural Extension:
Problem Strategy Activity Plan Expected Impact
Low rate of adoption of scientific package of
practices
Guide farmers regarding scientific
package of practices and use of improved
seeds
Trainings & capacity building of farmers
with support of SAUs, KVKs, ATMA, FTC
Resources conservation, Increase
in productivity & profitability of farmers
Improper soil, water & fertilizer management
Improving water & fertilizer use efficiency,
Integrated Nutrient Management
Lack of knowledge regarding weed, pest
& disease management
Integrated weed, pest, & disease
management
Animal Husbandry:
Problem Strategy Activity Plan Expected Impact
Low productivity of cattle
Improving productivity through breed
improvement, health improvement
Para vet service, Breeding bull service,
AI
Improvement in cattle productivity
Degraded pasture lands
Improve productivity of pasture lands
Grass plot development through proper management and sowing of good quality grass seed
Availability of fodder for cattle
Improper market mechanism
Providing forward & backward market
linkages
Cattle Feed Centers, Milk Collection Centers
Good returns for cattle rearers
Climate change:
Problem Strategy Activity Plan Expected Impact
Increased climate driven risk in farming due to:
• Limited access to weather info • Lack of information regarding
aberrant weather condition and how to respond to this situation
• Current crop varieties are vulnerable to changing climate
Creating awareness regarding
climate
Village level agro-met
observatory, cadre of climate
manager
Climate resilient agriculture

14
Market linkages:
Problem Strategy Activity Plan Expected Impact
Low return for agricultural produce due to:
• improper market mechanism
• Farmers lack market intelligence
• Limited infrastructure for storage & value addition to agricultural product
Providing forward and
backward linkage
Developing local market, ‘Pro-sumer
(Producer + Consumer) society’ ,
Agro industrial complex
Better return on produce
Implementation phase
For proper implementation, basin is divided into five clusters based on hydro-geological characteristics and problems of the area (As per map)
Suitable strategy has been adapted to overcome the problems for each cluster
Activates as per strategy have been carried out through linkages with Govt. departments and other funding agencies
A village from each cluster will be developed as a model village
Groups formed during planning phase have been involved in each stage of implementation
Cluster – I

15
Villages Vandhay, Kurbai, Ajapar,Vadasar, Viganiya, Sarli, Samatra, Deaslpar, Nabhoi, Bidada Padar and Forest area Total area Geology Juran & Jumara formations - Sand stone - Shale - clay Problems
Negligible Ground water
Low permeability
Excessive over land flow, head ward erosion Broad strategy Surface water storage and recharging of isolated sand stone Patches for drinking water Activities 1. Soil Water conservation Wells and tanks for drinking water, Silt trap, Gabion, Storage tank. 2. Agriculture Rain fed area treatment, farm banding & Waste wear, Farm pond, soil moisture conservation, grass land Development in forest area through Joint forest management. Cluster – II VILLAGES Bheraiya, Ludva, Jamathda, Vekra, Rampara, Dahinsra and Dhunai Area Geology Bhuj formations

16
- Sand stone Problems
Deep Ground water
Over exploitation of water
High Fe Impurity in water Broad strategy Ground water recharge, Judicious use of ground water, Participatory aquifer management (Shared aquifer, Demo of participatory ground water management Activities 1. Soil Water conservation, Recharge structures like Check dam, Percolation tank, etc. 2. Agriculture: Promotion to micro irrigation and other water saving techniques. Promotion to Horticultural crops Cluster – III Villages Darsadi, Momay Mora, Vandh Kojachora, Punadi Geology Deccan Trap, Madh series - weathered basalt - Laterite - Bentonite - Bauxite - clay Problems
Inadequate water availability
Inadequate irrigation facilities
Land degradation due to mining Broad strategy Shallow aquifer recharge through micro watershed development (ridge to valley concept) , ground water management, land reclamation Activities 1. Soil Water conservation CCT, ST, Gully plug, Gabion, CD, PT, Vegetative measures

17
2. Agriculture: Rain fed area treatment, farm banding & Waste wear, Farm pond,, soil moisture conservation, grass land development in forest area Cluster – IV
Villages Bhadai Moti, Dhokada, Don, Goniyasar nana, Goniyasar Mota, Asambiya Mota, Asambiya Nana, Koday/Madanpura, Jakhaniya, Talvana Geology Kankavati& Madh series - Sand stone - Laterite - clay Problems
Deep Ground water
Over exploitation
Quality degradation
Prone to seawater ingression Broad strategy Surface recharge, Injection recharge, sub surface recharge and water management, Roof top rain water harvesting. Activities
1. Soil Water conservation, Check dam, Injection well, subsurface structures, well recharge, Percolation tanks etc.
2. Agriculture: Micro irrigation, Water management through participatory irrigation management (PIM) , Promotion to Horticulture, Agri .practices
Cluster – V Villages Durgapar, Vada, Bharapar, Mandvi Rayan nani, Rayan Moti, Nagalpar, Maska Geology Recent - Alluvium - Sand Problems

18
Salinity ingress Over exploitation of Ground water
Broad strategy Salinity prevention activities, Roof top rain ware harvesting (RRWH) for drinking water, experiment of shallow zone recharge
Activities 1. Soil Water conservation: Check dam, Percolation tanks, Existing well/Bore well recharge, RRWHS etc 2. Agriculture : Soil reclamation , revival of Salt affected , Promo. to micro irrigation and Horticulture
Common activities for each cluster
• Awareness generation • Capacity building of stakeholders through training, workshop, seminar and exposure visits • SHG group formation and micro enterprises • Compost pit preparation from agro waste and animal dung and urine • Prosumer societies • Joint forest management activities wherever forest area is existed • CBO formation
Employment generation due to implementation of the project:
Employment generated in Agriculture sector (in man days): 10,00,000 Employment generated in Animal & Husbandry sector (in man days): 6,00,000 Employment generated in water resource sector (in man days):4,00,000
Institutional building for the project:

19
VRTI
Basin Level committee
(Representative from
Cluster level
committee)
Cluster Level committee
(Representative from Village level
committee)
Village level committee

20
Management phase
As per our experience involvement of community from planning to operation and management of common asset is essential
We are in process of development of Self sustainable river management institution that has two units such as decision making unit and service providing unit.
Para engineer will be in basin level institute
After completion of the project, we will act as a facilitator and provide guidance to basin level institute
Expected results The main expectation from this project is to demonstrate successful model of river basin management that can be replicated
o Each cluster of the basin will be self reliant on their drinking water, food ,fodder and fuel requirement
o Improvement of water quality as per drinking and irrigation norms o Green cover on the land will be restored o Finally contribute to improve GDP improvement of basin area, improve happiness
index & Human Development Index of this basin area. o Increase in productivity o Reduction in cost of cultivation o Sustainable crop production based on soil productivity o Increase in quantity of surface as well as ground water o Increase in availability of fodder o Increase in biodiversity o Increase in business enterprise o Institution of farmers which is capable of providing support for forward & backward
linkages o Agro processing & value addition units run by farmers
******


![u u } ] Ì Ì } ] %WWI 4SWM^MSRI 2); 'SHMGI )UYMZEPIRXI ...€¦ · 4vmrgmtepm ettpmge^msrm 'shmgi &evvi 'shmgi / pewwmg 2); 0mwxmrs wykkivmxs 0ykpms (mjj 0mwxmrs 'shmgi &evvi %qq](https://img.pdfslide.tips/doc/110x75/6014171c34531617b2012f26/u-u-oe-oe-wwi-4swmmsri-2-shmgi-uymzepirxi-4vmrgmtepm-ettpmgemsrm.jpg)