Embed Size (px)
Citation preview

Investor Presentation
December 12 – 14, 2016
Page 2
FORWARD-LOOKING STATEMENTS
• All presentations contain certain forward-looking information within the meaning of the Private Securities Litigation
Reform Act of 1995. The words “may,” “will,” “expect,” “intend,” “estimate,” “anticipate,” “aspiration,” “objective,” “project,” “believe,” “continue,” “on track” or “target” or the negative thereof and similar expressions, among others, identify forward-looking statements. All forward looking statements are based on information currently available to
management. Such forward-looking statements are subject to certain risks and uncertainties that could cause
events and the Company’s actual results to differ materially from those expressed or implied. Please see the disclosure regarding forward-looking statements immediately preceding Part I of the Company’s Annual Report on the most recently filed Form 10-K. The company assumes no obligation to update any forward-looking statements.
REGULATION G
• This presentation may include certain non-GAAP financial measures like EBITDA and other measures that
exclude special items such as restructuring and other unusual charges and gains that are volatile from period to
period. Management of the company uses the non-GAAP measures to evaluate ongoing operations and believes
that these non-GAAP measures are useful to enable investors to perform meaningful comparisons of current and
historical performance of the company. All non-GAAP data in the presentation are indicated by footnotes. Tables
showing the reconciliation between GAAP and non-GAAP measures are available at the end of this presentation
and on the Greif website at www.greif.com.
SAFE HARBOR

Greif strategy
Page 4
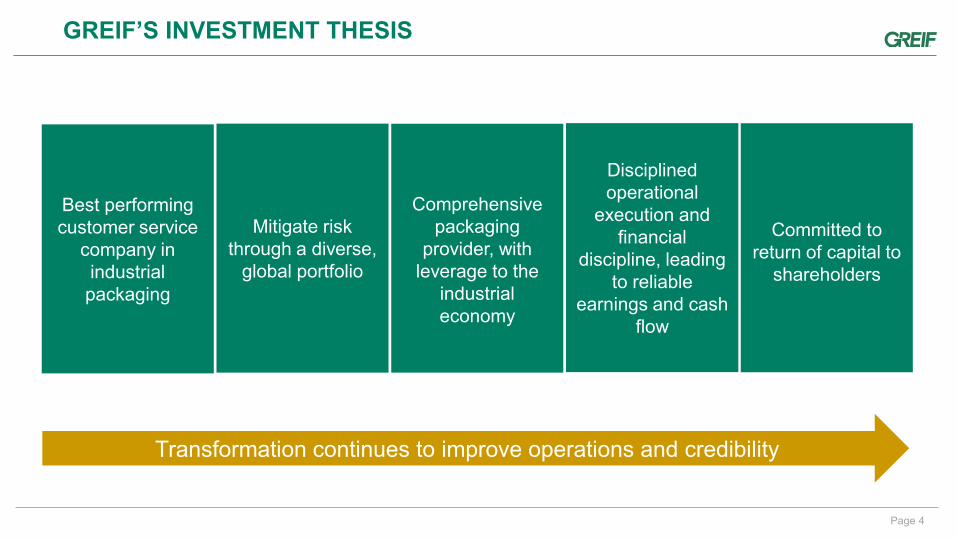
GREIF’S INVESTMENT THESIS
Best performing customer service
company in industrial packaging
Mitigate risk through a diverse,
global portfolio
Comprehensive packaging
provider, with leverage to the
industrial economy
Disciplined operational
execution and financial
discipline, leading to reliable
earnings and cash flow
Committed to
return of capital to shareholders
Transformation continues to improve operations and credibility

Page 5
GREIF’S VISION AND THREE STRATEGIC PRIORITIES
In industrial packaging, be the best performing customer service company in the world
People & Teams
• Colleague engagement
• Accountability aligned to value creation
• Health and safety
Customer Service Excellence
• Superior customer satisfaction
‒ Share of wallet growth
• Superior customer loyalty
‒ Innovative and solutions focused approach
Transformational Performance
• Strengthen the portfolio
• Margin expansion
• Fiscal discipline and free cash flow expansion
Vision
Strategic Priorities
Enabling Platform
THE GREIF WAY

Page 6
GREIF’S PATH TO TRANSFORMATION
• Embarked on Transformation process
• Completed portfolio review
• Held Greif’s first Investor Day
• Published 2017 Transformation commitments
New direction:
• New leadership
• Customer service excellence
• Execution discipline
2015 2016 2017
($M) RUN RATE
COMMITMENTS
Net Sales $3,500
Gross Profit $720 - $730
SG&A $345 - $355
Operating Profit Before Special Items1
$365 - $385
Free Cash Flow2 $205 - $225
1Special items include restructuring charges, acquisition-related costs, timberland gains, non-cash asset impairment charges and gain or loss on disposal of properties, plants, equipment and businesses, net. No reconciliation of 2017 Run Rate Commitments for Operating Profit Before Special Items, a non-GAAP financial measure which excludes the foregoing special items, is included in this presentation because, due to the high variability and difficulty in making accurate forecasts and projections of some of the excluded information, together with some of the excluded information not being ascertainable or accessible, we are unable to quantify certain amounts that would be required to be included in the most directly comparable GAAP financial measure without unreasonable efforts. 2Free cash flow is defined as net cash provided by operating activities less cash paid for capital expenditures. For a reconciliation of the 2017 Free Cash Flow run rate commitment, see the Free Cash Flow reconciliation in the financial schedules that can be found in the appendix of this presentation.
2017 Transformation OPBSI Commitment is intact and updated only for F/X change

Page 7
0% 5% 10% 15% 20% 25%
Customer ratings
Productivity
Profitability
Gallup survey findings: Higher engagement leads to better performance1
1Gallup’s 2015 State of the American Manager report. The chart highlights the differences between businesses with top and bottom quartile engagement scores.
STRATEGIC PRIORITY: PEOPLE AND TEAMS
• New leadership team
• Colleague engagement
• Culture of accountability with incentives aligned to value creation
Engaged Teams
Delighted Customers
Profitable Growth
Our vision is founded in the service-profit chain
Page 8
0 25 50 75 100
RIPS
FPS
PPS
Q4 2015 Q4 2016
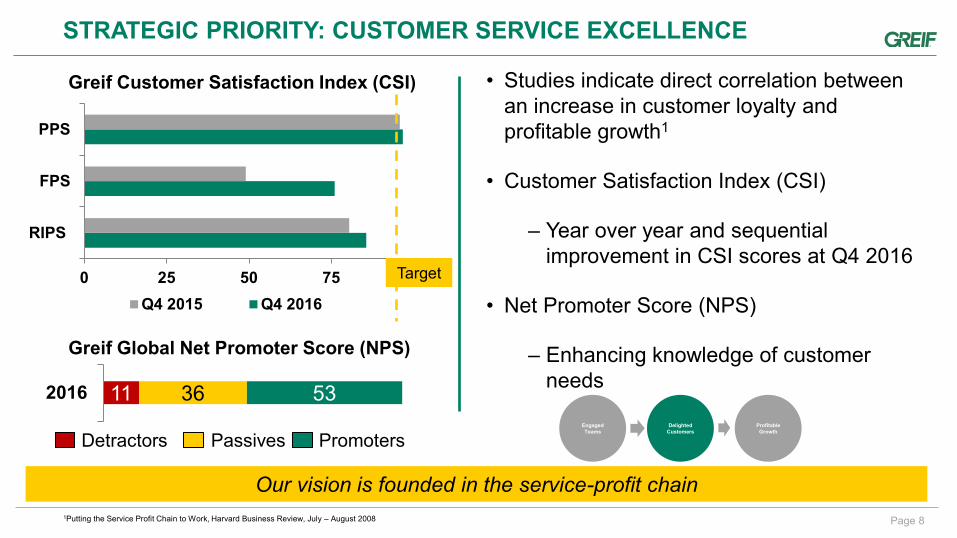
STRATEGIC PRIORITY: CUSTOMER SERVICE EXCELLENCE
Greif Customer Satisfaction Index (CSI)
Passives Detractors Promoters
11 36 53 2016
Greif Global Net Promoter Score (NPS)
1Putting the Service Profit Chain to Work, Harvard Business Review, July – August 2008
• Studies indicate direct correlation between an increase in customer loyalty and profitable growth1
• Customer Satisfaction Index (CSI)
‒ Year over year and sequential improvement in CSI scores at Q4 2016
• Net Promoter Score (NPS)
‒ Enhancing knowledge of customer needs
Our vision is founded in the service-profit chain
Engaged Teams
Delighted Customers
Profitable Growth
Target

Page 9
STRATEGIC PRIORITY: TRANSFORMATIONAL PERFORMANCE
• 23 divestitures and 15 closed operations
• Targeted growth:
‒ 10% volume growth – global Intermediate Bulk Containers (IBC)1
‒ 13% revenue growth – Paper Packaging specialty products1
• New facilities:
‒ Germany IBC/reconditioning plant
‒ Saudi Arabia steel drum plant
‒ CorrChoice sheet feeder
1FY 2016 vs FY 2015. 2 FY 2015 free cash flow = $70.5M. FY 2016 free cash flow = $200.9M. Free cash flow is defined as net cash provided by operating activities less cash paid for capital expenditures.
Optimize and strengthen the portfolio
Operational performance improving; free cash flow expanding
• 20.6% = Trailing four quarter gross profit margin (best in 10+ years)
• Disciplined execution of commercial excellence, supply chain and operational excellence
• Pursuing quality of market share over quantity and enhancing product mix for profitability
Expand margins through fundamental operating
improvements
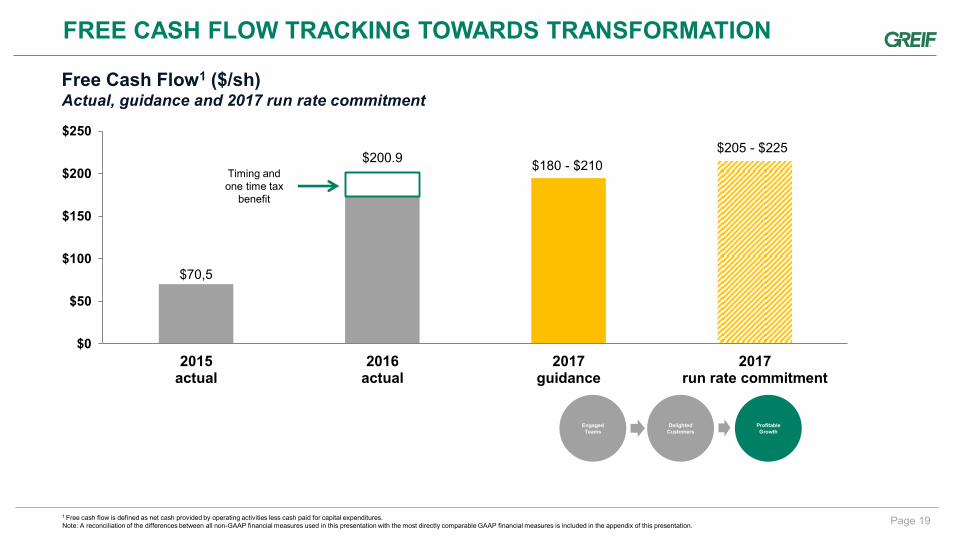
• Focused on Free Cash Flow (FCF) generation
‒ $200.9M delivered in 2016; tracking towards 2017 run rate commitment of $205 – $225M
• $119M reduction in SG&A since 2014 (11.3% of sales in 2016)
‒ Targeting 10% of sales
• Cost control mechanisms implemented for sustainability
Fiscal discipline

Page 10
DELIVERING SUSTAINED OPERATIONAL IMPROVEMENT
FY 2014 Actual
FY 2015 Actual
FY 2016 Actual
End of 2017 run rate target
Gross Profit Margin
19.1% 18.5% 20.6% 20%
SG&A Ratio
11.7% 11.4% 11.3% 10%
OPBSI Margin1 7.5% 7.4% 9.3% 10%
1 Operating Profit Before Special Items as a percentage of net sales for fiscal 2014, fiscal 2015 and fiscal 2016. A summary of all special items that are excluded from the earnings per diluted Class A share before special items and operating profit before special items is set forth in the appendix of this presentation. Note: A reconciliation of the differences between all non-GAAP financial measures used in this presentation with the most directly comparable GAAP financial measures is included in the appendix of this presentation.
Engaged Teams
Delighted Customers
Profitable Growth
Page 11
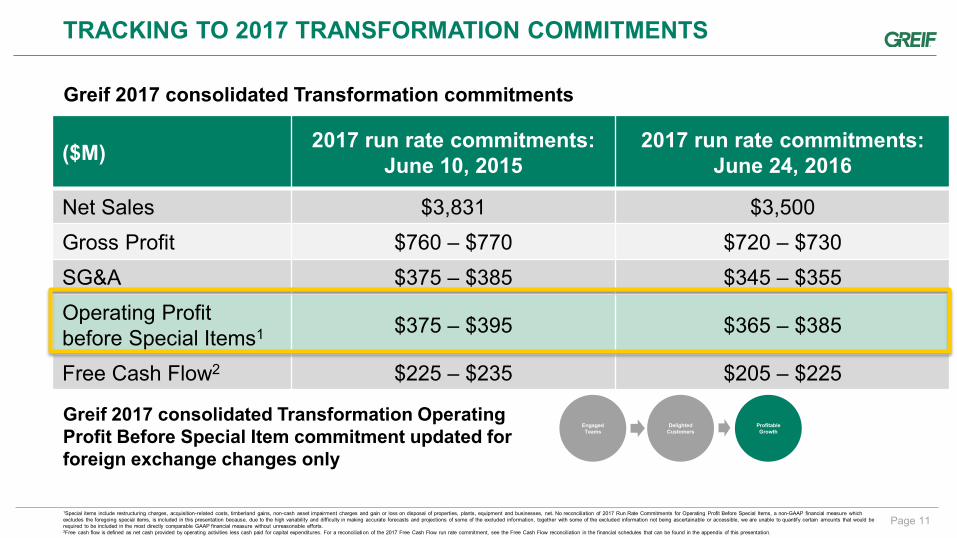
($M) 2017 run rate commitments:
June 10, 2015 2017 run rate commitments:
June 24, 2016
Net Sales $3,831 $3,500
Gross Profit $760 – $770 $720 – $730
SG&A $375 – $385 $345 – $355
Operating Profit before Special Items1 $375 – $395 $365 – $385
Free Cash Flow2 $225 – $235 $205 – $225
TRACKING TO 2017 TRANSFORMATION COMMITMENTS
Greif 2017 consolidated Transformation commitments
Greif 2017 consolidated Transformation Operating Profit Before Special Item commitment updated for foreign exchange changes only
Engaged Teams
Delighted Customers
Profitable Growth
1Special items include restructuring charges, acquisition-related costs, timberland gains, non-cash asset impairment charges and gain or loss on disposal of properties, plants, equipment and businesses, net. No reconciliation of 2017 Run Rate Commitments for Operating Profit Before Special Items, a non-GAAP financial measure which excludes the foregoing special items, is included in this presentation because, due to the high variability and difficulty in making accurate forecasts and projections of some of the excluded information, together with some of the excluded information not being ascertainable or accessible, we are unable to quantify certain amounts that would be required to be included in the most directly comparable GAAP financial measure without unreasonable efforts. 2Free cash flow is defined as net cash provided by operating activities less cash paid for capital expenditures. For a reconciliation of the 2017 Free Cash Flow run rate commitment, see the Free Cash Flow reconciliation in the financial schedules that can be found in the appendix of this presentation.
Business overview

Page 13
A GLOBAL LEADER IN INDUSTRIAL PACKAGING
Rigid Industrial Packaging &
Services
2016 Revenue: $2,324M
Paper Packaging & Services
2016 Revenue: $687M
Flexible Products & Services
2016 Revenue: $288M
Land Management
2016 Revenue: $24M
Page 14
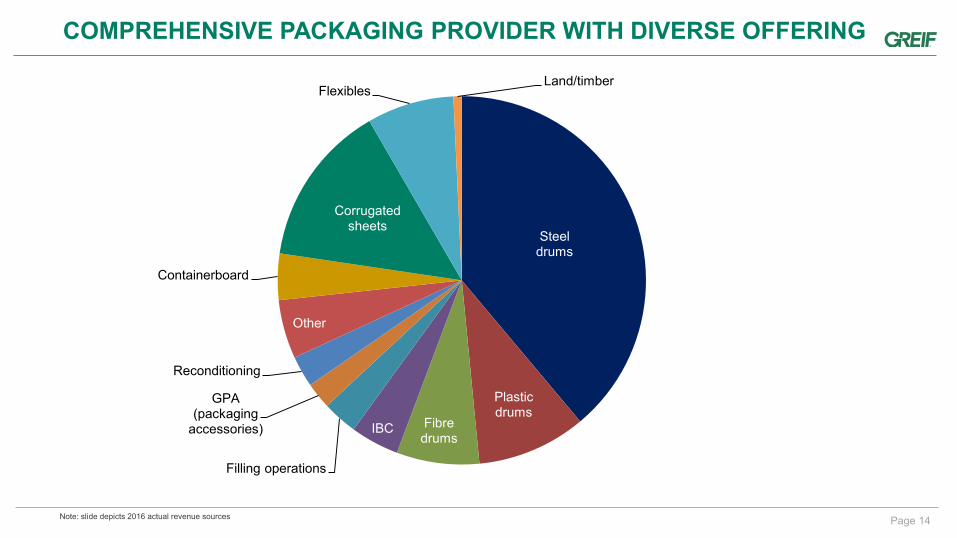
COMPREHENSIVE PACKAGING PROVIDER WITH DIVERSE OFFERING
Note: slide depicts 2016 actual revenue sources
Steel drums
Plastic drums
Fibre drums
IBC
Filling operations
GPA (packaging
accessories)
Reconditioning
Other
Containerboard
Corrugated sheets
Flexibles Land/timber

Page 15
RIGID INDUSTRIAL PACKAGING AND SERVICES KEY MARKETS
Bulk/commodity chemicals
Oil/lubricants
Specialty chemicals
Solid food, pastes, etc.
Other
Paints, coatings, adhesives
Packaging distributors
Agro chemicals
Juices and beverages
Pharmaceuticals and personal care
Flavors and fragrances
Blenders/fillers
Silicones
Solvents
Detergents
Waste industry
Note: slide depicts RIPS drum demand end markets.
Page 16
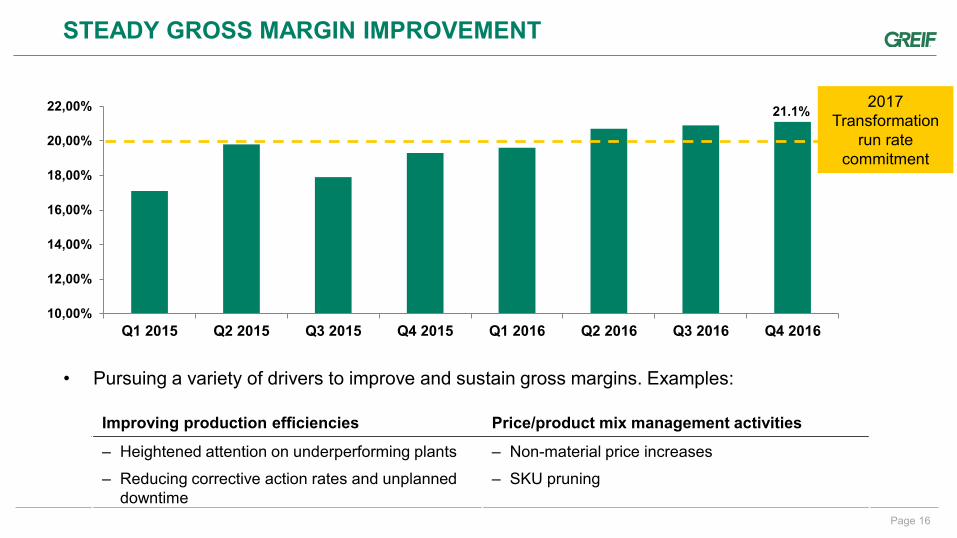
STEADY GROSS MARGIN IMPROVEMENT
21.1%
10,00%
12,00%
14,00%
16,00%
18,00%
20,00%
22,00%
Q1 2015 Q2 2015 Q3 2015 Q4 2015 Q1 2016 Q2 2016 Q3 2016 Q4 2016
2017 Transformation
run rate commitment
• Pursuing a variety of drivers to improve and sustain gross margins. Examples:
Improving production efficiencies Price/product mix management activities
‒ Heightened attention on underperforming plants
‒ Reducing corrective action rates and unplanned downtime
‒ Non-material price increases
‒ SKU pruning

Page 17
SG&A REDUCED BY 24% SINCE 2014
• Sustainable SG&A reductions implemented
• Additional, but smaller, opportunities exist
• Improved culture of accountability
Annual SG&A expense ($M)
$496.7
$376.8
$0
$100
$200
$300
$400
$500
$600
2013 2014 2015 2016
Engaged Teams
Delighted Customers
Profitable Growth

Page 18
FISCAL YEAR 2017 EARNINGS PER SHARE GUIDANCE
1 Class A earnings per share excluding special items. Special items include restructuring charges, acquisition-related costs, timberland gains, non-cash asset impairment charges and gain on disposal of properties, plants, equipment and businesses, net. No reconciliation of the fiscal year 2017 Class A earnings per share guidance, a non-GAAP financial measure which excludes gains and losses on the sales of businesses, timberland and property, plant and equipment, acquisition costs and restructuring and impairment charges is included in this release because, due to the high variability and difficulty in making accurate forecasts and projections of some of the excluded information, together with some of the excluded information not being ascertainable or accessible, we are unable to quantify certain amounts that would be required to be included in the most directly comparable GAAP financial measure without unreasonable efforts. Note: A reconciliation of the differences between all non-GAAP financial measures used in this presentation with the most directly comparable GAAP financial measures is included in the appendix of this presentation.
$2,18
$2,44
$2.78 - $3.08
$1,00
$1,50
$2,00
$2,50
$3,00
$3,50
2015actual
2016actual
2017guidance
• Fiscal 2017: Expect to generate between $2.78 and $3.08 in Class A earnings per share before special items
• Midpoint of Fiscal 2017 guidance:
‒ Represents a 20% improvement over fiscal 2016’s full year result
‒ Improvement driven by:
• Better margin / product mix management and continued execution discipline
• Improvement in underperforming operations
• Share of wallet expansion in key markets
• Announced containerboard price increase
• Reduced annual interest expense
• Lower income tax expense
Class A earnings per share before special items1 ($/sh) Actual and guidance
Page 19
FREE CASH FLOW TRACKING TOWARDS TRANSFORMATION
Free Cash Flow1 ($/sh) Actual, guidance and 2017 run rate commitment
1 Free cash flow is defined as net cash provided by operating activities less cash paid for capital expenditures. Note: A reconciliation of the differences between all non-GAAP financial measures used in this presentation with the most directly comparable GAAP financial measures is included in the appendix of this presentation.
$70,5
$200.9 $180 - $210
$205 - $225
$0
$50
$100
$150
$200
$250
2015actual
2016actual
2017guidance
2017run rate commitment
Timing and one time tax
benefit
Engaged Teams
Delighted Customers
Profitable Growth
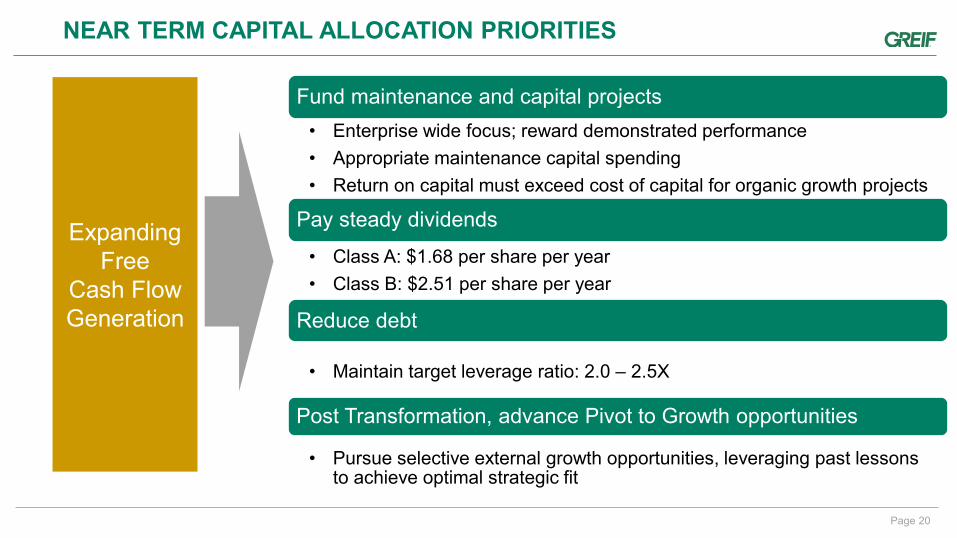
Page 20
Fund maintenance and capital projects
• Enterprise wide focus; reward demonstrated performance
• Appropriate maintenance capital spending
• Return on capital must exceed cost of capital for organic growth projects
Pay steady dividends
• Class A: $1.68 per share per year
• Class B: $2.51 per share per year
Reduce debt
• Maintain target leverage ratio: 2.0 – 2.5X
Post Transformation, advance Pivot to Growth opportunities
• Pursue selective external growth opportunities, leveraging past lessons to achieve optimal strategic fit
NEAR TERM CAPITAL ALLOCATION PRIORITIES
Expanding Free
Cash Flow Generation
Page 21
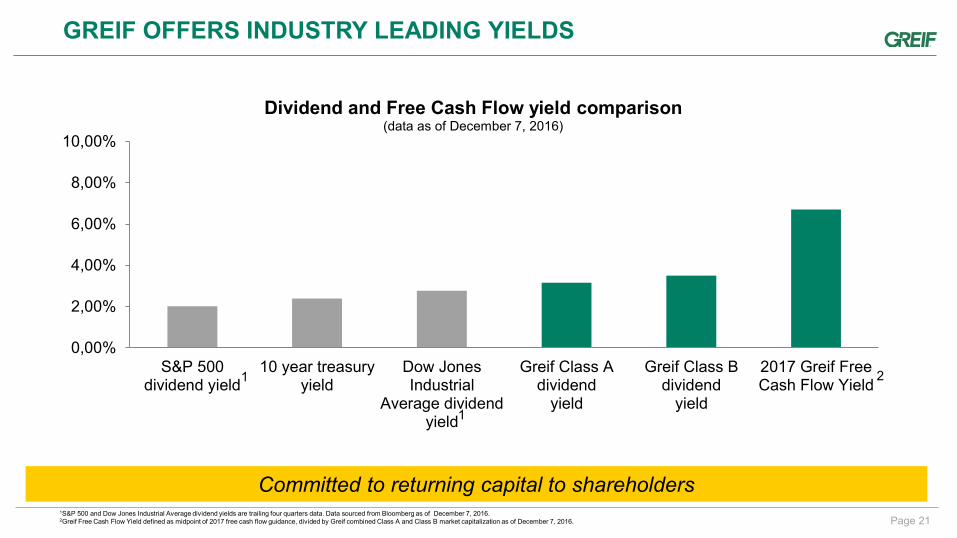
GREIF OFFERS INDUSTRY LEADING YIELDS
0,00%
2,00%
4,00%
6,00%
8,00%
10,00%
S&P 500dividend yield
10 year treasuryyield
Dow JonesIndustrial
Average dividendyield
Greif Class Adividend
yield
Greif Class Bdividend
yield
2017 Greif FreeCash Flow Yield
Dividend and Free Cash Flow yield comparison (data as of December 7, 2016)
1S&P 500 and Dow Jones Industrial Average dividend yields are trailing four quarters data. Data sourced from Bloomberg as of December 7, 2016. 2Greif Free Cash Flow Yield defined as midpoint of 2017 free cash flow guidance, divided by Greif combined Class A and Class B market capitalization as of December 7, 2016.
1
1
2
Committed to returning capital to shareholders
Page 22
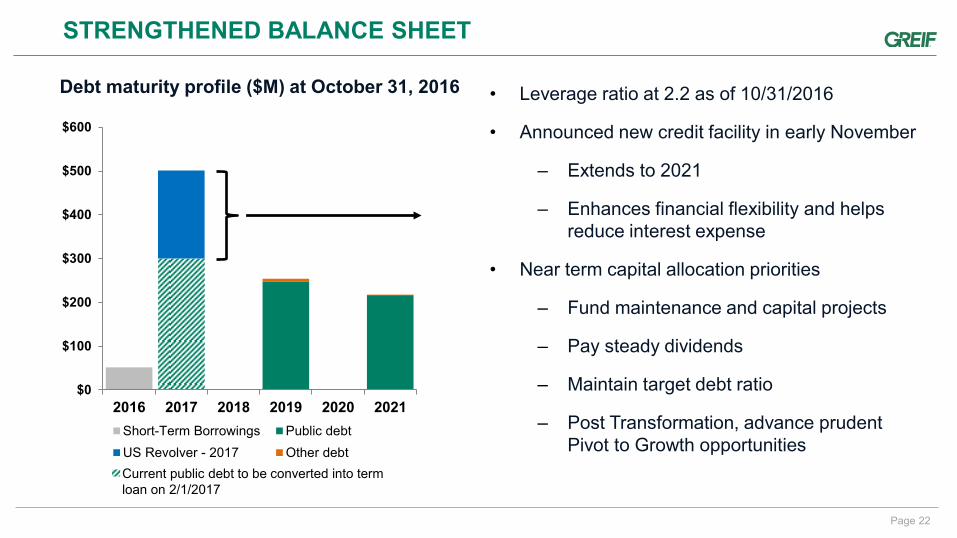
STRENGTHENED BALANCE SHEET
$0
$100
$200
$300
$400
$500
$600
2016 2017 2018 2019 2020 2021
Short-Term Borrowings Public debt
US Revolver - 2017 Other debt
Debt maturity profile ($M) at October 31, 2016
• Leverage ratio at 2.2 as of 10/31/2016
• Announced new credit facility in early November
‒ Extends to 2021
‒ Enhances financial flexibility and helps reduce interest expense
• Near term capital allocation priorities
‒ Fund maintenance and capital projects
‒ Pay steady dividends
‒ Maintain target debt ratio
‒ Post Transformation, advance prudent Pivot to Growth opportunities
Current public debt to be converted into term loan on 2/1/2017

Q4 and Fiscal 2016 financial highlights
Page 24
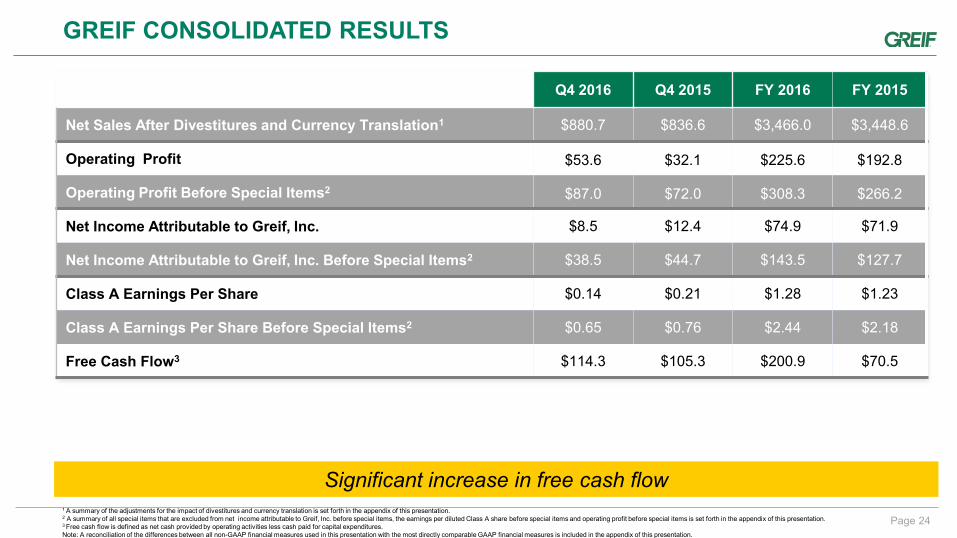
GREIF CONSOLIDATED RESULTS
Q4 2016 Q4 2015 FY 2016 FY 2015
Net Sales After Divestitures and Currency Translation1 $880.7 $836.6 $3,466.0 $3,448.6
Operating Profit $53.6 $32.1 $225.6 $192.8
Operating Profit Before Special Items2 $87.0 $72.0 $308.3 $266.2
Net Income Attributable to Greif, Inc. $8.5 $12.4 $74.9 $71.9
Net Income Attributable to Greif, Inc. Before Special Items2 $38.5 $44.7 $143.5 $127.7
Class A Earnings Per Share $0.14 $0.21 $1.28 $1.23
Class A Earnings Per Share Before Special Items2 $0.65 $0.76 $2.44 $2.18
Free Cash Flow3 $114.3 $105.3 $200.9 $70.5
1 A summary of the adjustments for the impact of divestitures and currency translation is set forth in the appendix of this presentation. 2 A summary of all special items that are excluded from net income attributable to Greif, Inc. before special items, the earnings per diluted Class A share before special items and operating profit before special items is set forth in the appendix of this presentation. 3 Free cash flow is defined as net cash provided by operating activities less cash paid for capital expenditures. Note: A reconciliation of the differences between all non-GAAP financial measures used in this presentation with the most directly comparable GAAP financial measures is included in the appendix of this presentation.
Significant increase in free cash flow
Transformation segment run rate commitments
Page 26
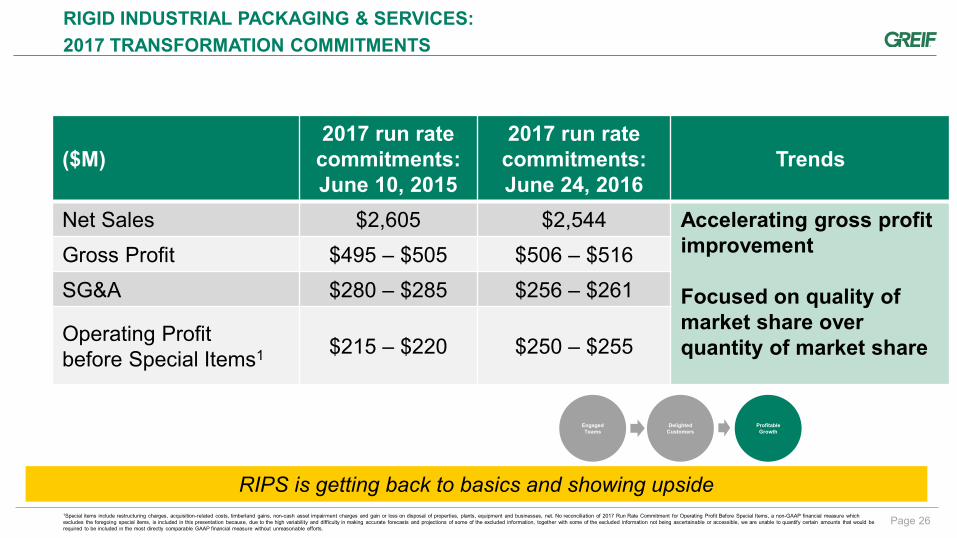
($M) 2017 run rate
commitments: June 10, 2015
2017 run rate commitments: June 24, 2016
Trends
Net Sales $2,605 $2,544 Accelerating gross profit improvement Focused on quality of market share over quantity of market share
Gross Profit $495 – $505 $506 – $516
SG&A $280 – $285 $256 – $261
Operating Profit before Special Items1 $215 – $220 $250 – $255
RIGID INDUSTRIAL PACKAGING & SERVICES:
2017 TRANSFORMATION COMMITMENTS
RIPS is getting back to basics and showing upside
Engaged Teams
Delighted Customers
Profitable Growth
1Special items include restructuring charges, acquisition-related costs, timberland gains, non-cash asset impairment charges and gain or loss on disposal of properties, plants, equipment and businesses, net. No reconciliation of 2017 Run Rate Commitment for Operating Profit Before Special Items, a non-GAAP financial measure which excludes the foregoing special items, is included in this presentation because, due to the high variability and difficulty in making accurate forecasts and projections of some of the excluded information, together with some of the excluded information not being ascertainable or accessible, we are unable to quantify certain amounts that would be required to be included in the most directly comparable GAAP financial measure without unreasonable efforts.
Page 27
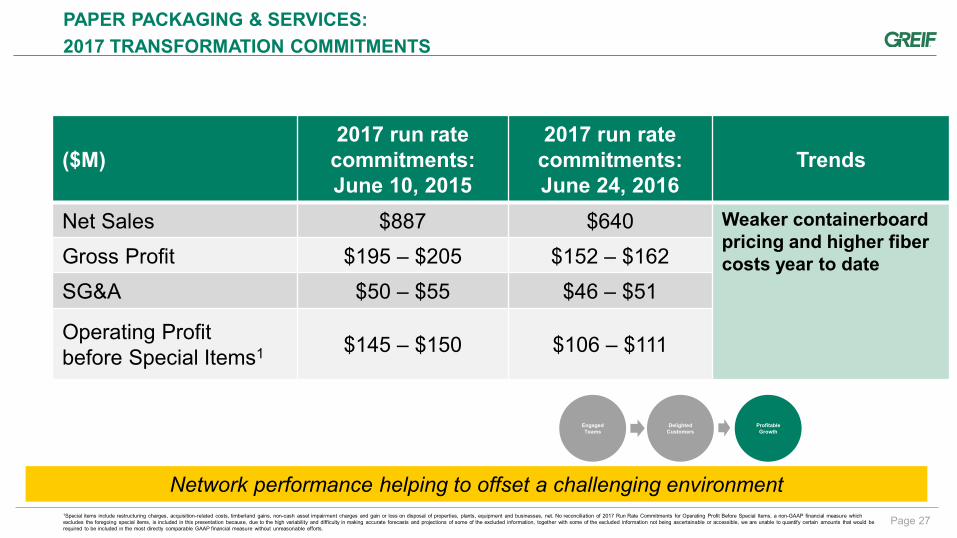
($M) 2017 run rate
commitments: June 10, 2015
2017 run rate commitments: June 24, 2016
Trends
Net Sales $887 $640 Weaker containerboard pricing and higher fiber costs year to date Gross Profit $195 – $205 $152 – $162
SG&A $50 – $55 $46 – $51
Operating Profit before Special Items1 $145 – $150 $106 – $111
PAPER PACKAGING & SERVICES:
2017 TRANSFORMATION COMMITMENTS
Network performance helping to offset a challenging environment
Engaged Teams
Delighted Customers
Profitable Growth
1Special items include restructuring charges, acquisition-related costs, timberland gains, non-cash asset impairment charges and gain or loss on disposal of properties, plants, equipment and businesses, net. No reconciliation of 2017 Run Rate Commitments for Operating Profit Before Special Items, a non-GAAP financial measure which excludes the foregoing special items, is included in this presentation because, due to the high variability and difficulty in making accurate forecasts and projections of some of the excluded information, together with some of the excluded information not being ascertainable or accessible, we are unable to quantify certain amounts that would be required to be included in the most directly comparable GAAP financial measure without unreasonable efforts.

Page 28
($M) 2017 run rate
commitments: June 10, 2015
2017 run rate commitments: June 24, 2016
Trends
Net Sales $315 $290 Instilling a sense of urgency to fix underperforming operations
Gross Profit $55 – $65 $43 – $53
SG&A $45 – $50 $38 – $43
Operating Profit before Special Items1 $10 – $15 $5 – $10
FLEXIBLE PRODUCTS & SERVICES:
2017 TRANSFORMATION COMMITMENTS
Accelerating the pace of change at FPS
Engaged Teams
Delighted Customers
Profitable Growth
1Special items include restructuring charges, acquisition-related costs, timberland gains, non-cash asset impairment charges and gain or loss on disposal of properties, plants, equipment and businesses, net. No reconciliation of 2017 Run Rate Commitments for Operating Profit Before Special Items, a non-GAAP financial measure which excludes the foregoing special items, is included in this presentation because, due to the high variability and difficulty in making accurate forecasts and projections of some of the excluded information, together with some of the excluded information not being ascertainable or accessible, we are unable to quantify certain amounts that would be required to be included in the most directly comparable GAAP financial measure without unreasonable efforts.
Page 29
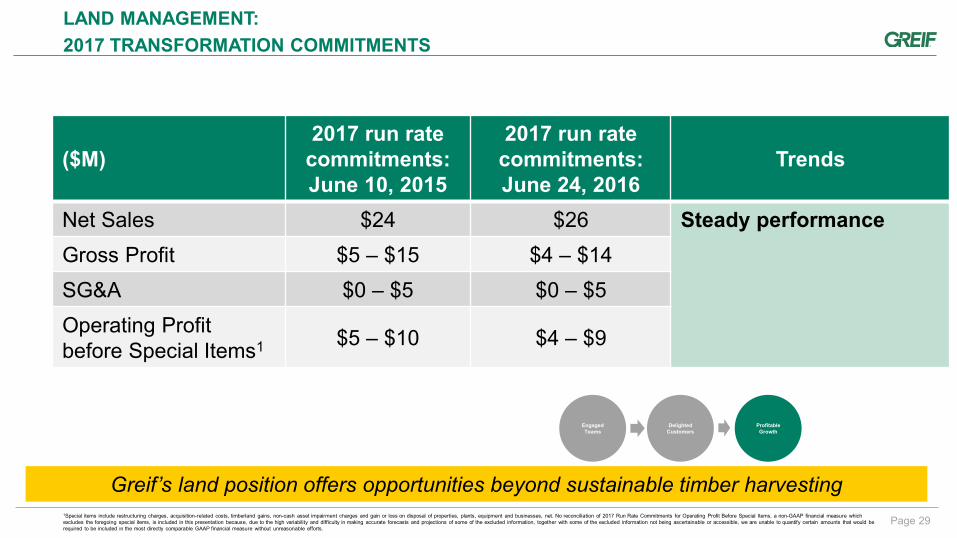
($M) 2017 run rate
commitments: June 10, 2015
2017 run rate commitments: June 24, 2016
Trends
Net Sales $24 $26 Steady performance
Gross Profit $5 – $15 $4 – $14
SG&A $0 – $5 $0 – $5
Operating Profit before Special Items1 $5 – $10 $4 – $9
LAND MANAGEMENT:
2017 TRANSFORMATION COMMITMENTS
Greif’s land position offers opportunities beyond sustainable timber harvesting
Engaged Teams
Delighted Customers
Profitable Growth
1Special items include restructuring charges, acquisition-related costs, timberland gains, non-cash asset impairment charges and gain or loss on disposal of properties, plants, equipment and businesses, net. No reconciliation of 2017 Run Rate Commitments for Operating Profit Before Special Items, a non-GAAP financial measure which excludes the foregoing special items, is included in this presentation because, due to the high variability and difficulty in making accurate forecasts and projections of some of the excluded information, together with some of the excluded information not being ascertainable or accessible, we are unable to quantify certain amounts that would be required to be included in the most directly comparable GAAP financial measure without unreasonable efforts.

Page 30
2017 COMMITMENT ASSUMPTIONS
• Assumed market growth rate of 0-1%
• Raw material costs assumed flat against current indices in the markets in which we participate
• Major raw material price increases are passed to customers through price adjustment mechanisms in contracts or otherwise with customary delay
• The FX impact was calculated using actual year to date FX rates in 2016 through April and the assumption that the rates remain constant at the April rates through the remainder of the year
• Salary/wage increase assumed at historical rates
• For purposes of calculation of run rate free cash flow exiting 2017, we have assumed an effective cash tax rate range of 37-40%
• Cap-Ex at $90 - 120M
• $75-85M restructuring costs estimated for 2015-17 period
• All divestitures completed by the end of FY2016; no material acquisitions
Appendix

Page 32
NOTE ON NON – GAAP FINANCIAL MEASURES
Non-GAAP measures are intended to supplement and should be read together with our financial results. They should not be considered an alternative or substitute for, and should not be considered superior to, our reported financial results. Accordingly, users of this financial information should not place undue reliance on these non-GAAP financial measures.
With respect to all forward looking non-GAAP measures including Operating Profit Before Special Items and Free Cash Flow, no reconciliation is included in this presentation because, due to the high variability and difficulty in making accurate forecasts and projections of some of the excluded information, together with some of the excluded information not being ascertainable or accessible, we are unable to quantify certain amounts that would be required to be included in the most directly comparable GAAP financial measure without unreasonable efforts.
NOTE ON FORWARD LOOKING STATEMENTS
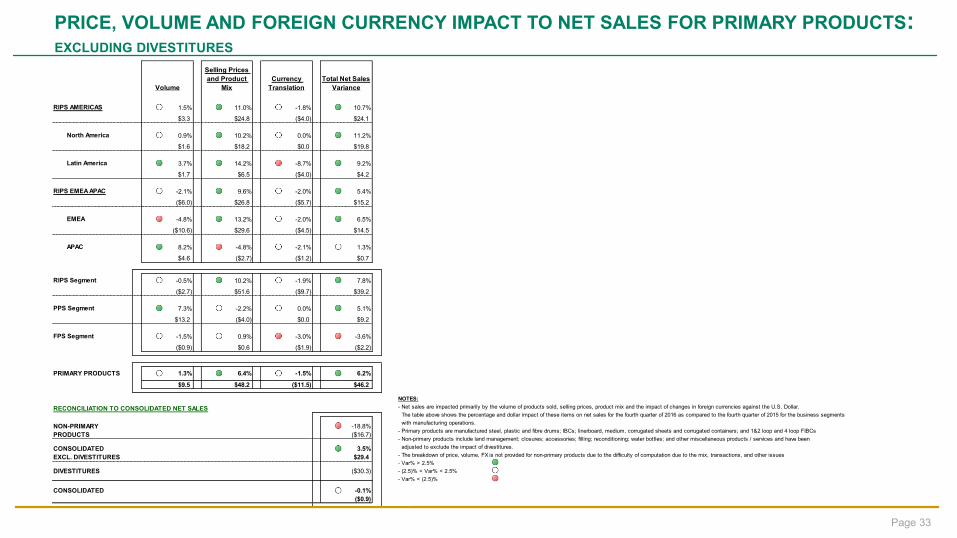
PRICE, VOLUME AND FOREIGN CURRENCY IMPACT TO NET SALES FOR PRIMARY PRODUCTS: EXCLUDING DIVESTITURES
Page 33
RIPS AMERICAS 1.5% 11.0% -1.8% 10.7%
$3.3 $24.8 ($4.0) $24.1
North America 0.9% 10.2% 0.0% 11.2%
$1.6 $18.2 $0.0 $19.8
Latin America 3.7% 14.2% -8.7% 9.2%
$1.7 $6.5 ($4.0) $4.2
RIPS EMEA APAC -2.1% 9.6% -2.0% 5.4%
($6.0) $26.8 ($5.7) $15.2
EMEA -4.8% 13.2% -2.0% 6.5%
($10.6) $29.6 ($4.5) $14.5
APAC 8.2% -4.8% -2.1% 1.3%
$4.6 ($2.7) ($1.2) $0.7
RIPS Segment -0.5% 10.2% -1.9% 7.8%
($2.7) $51.6 ($9.7) $39.2
PPS Segment 7.3% -2.2% 0.0% 5.1%
$13.2 ($4.0) $0.0 $9.2
FPS Segment -1.5% 0.9% -3.0% -3.6%
($0.9) $0.6 ($1.9) ($2.2)
PRIMARY PRODUCTS 1.3% 6.4% -1.5% 6.2%
$9.5 $48.2 ($11.5) $46.2
RECONCILIATION TO CONSOLIDATED NET SALES
-18.8%
($16.7)
CONSOLIDATED 3.5%
EXCL. DIVESTITURES $29.4
DIVESTITURES ($30.3)
CONSOLIDATED -0.1%
($0.9)
NON-PRIMARY
PRODUCTS
Volume
Selling Prices
and Product
Mix
Currency
Translation
Total Net Sales
Variance
NOTES:
- Net sales are impacted primarily by the volume of products sold, selling prices, product mix and the impact of changes in foreign currencies against the U.S. Dollar.
The table above shows the percentage and dollar impact of these items on net sales for the fourth quarter of 2016 as compared to the fourth quarter of 2015 for the business segments
with manufacturing operations.
- Primary products are manufactured steel, plastic and fibre drums; IBCs; linerboard, medium, corrugated sheets and corrugated containers; and 1&2 loop and 4 loop FIBCs
- Non-primary products include land management; closures; accessories; filling; reconditioning; water bottles; and other miscellaneous products / services and have been
adjusted to exclude the impact of divestitures.
- The breakdown of price, volume, FX is not provided for non-primary products due to the difficulty of computation due to the mix, transactions, and other issues
- Var% > 2.5%
- (2.5)% < Var% < 2.5%
- Var% < (2.5)%
Page 34
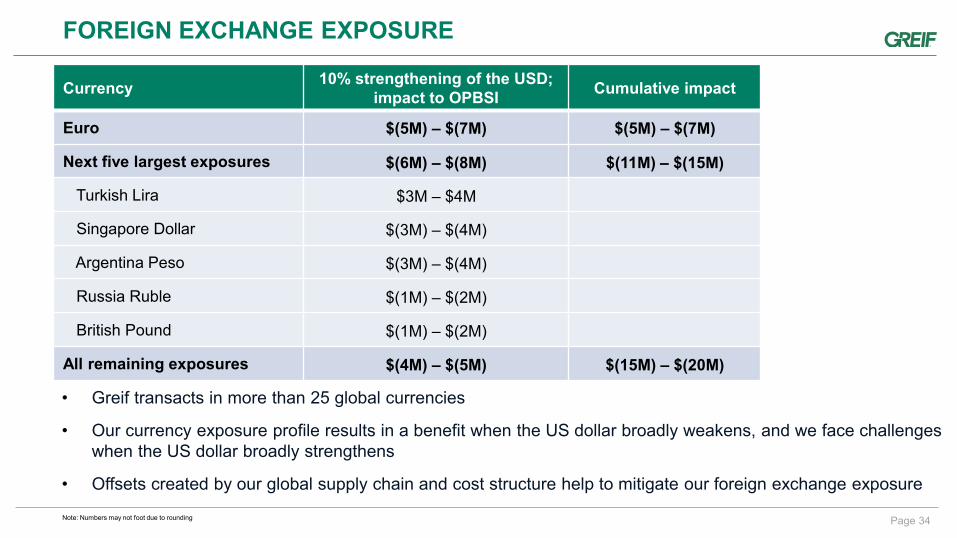
FOREIGN EXCHANGE EXPOSURE
Currency 10% strengthening of the USD;
impact to OPBSI Cumulative impact
Euro $(5M) – $(7M) $(5M) – $(7M)
Next five largest exposures $(6M) – $(8M) $(11M) – $(15M)
Turkish Lira $3M – $4M
Singapore Dollar $(3M) – $(4M)
Argentina Peso $(3M) – $(4M)
Russia Ruble $(1M) – $(2M)
British Pound $(1M) – $(2M)
All remaining exposures $(4M) – $(5M) $(15M) – $(20M)
• Greif transacts in more than 25 global currencies
• Our currency exposure profile results in a benefit when the US dollar broadly weakens, and we face challenges when the US dollar broadly strengthens
• Offsets created by our global supply chain and cost structure help to mitigate our foreign exchange exposure
Note: Numbers may not foot due to rounding

GAAP TO NON-GAAP RECONCILIATION: SEGMENT AND CONSOLIDATED OPERATING PROFIT (LOSS) BEFORE SPECIAL ITEMS
Page 35
$ Millions Three months ended October 31, Twelve months ended October 31,
2016 2015 2016 2015
Operating profit (loss):
Rigid Industrial Packaging & Services $ 30.5 $ 10.9 $ 143.9 $ 86.4
Paper Packaging & Services 24.7 32.6 89.1 109.3
Flexible Products & Services (3.6 ) (12.8 ) (15.5 ) (36.6 )
Land Management 2.0 1.4 8.1 33.7
Total operating profit (loss) 53.6 32.1 225.6 192.8
Restructuring charges:
Rigid Industrial Packaging & Services 7.8 9.2 19.0 29.6
Paper Packaging & Services 0.4 1.2 1.5 2.2
Flexible Products & Services 0.7 2.8 6.3 8.1
Land Management 0.1 0.1 0.1 0.1 Total restructuring charges 9.0 13.3 26.9 40.0
Acquisition-related costs:
Rigid Industrial Packaging & Services 0.1 — 0.2 0.3
Total acquisition-related costs 0.1 — 0.2 0.3
Timberland gains:
Land Management — — — (24.3 )
Total timberland gains — — — (24.3 )
Non-cash asset impairment charges:
Rigid Industrial Packaging & Services 3.5 22.1 43.3 43.4
Paper Packaging & Services — — 1.5 0.8
Flexible Products & Services 3.0 1.5 6.6 1.7
Total non-cash asset impairment charges 6.5 23.6 51.4 45.9
(Gain) loss on disposal of properties, plants, equipment and businesses, net:
Rigid Industrial Packaging & Services 18.5 0.3 7.3 2.7
Paper Packaging 0 (0.5 ) (0.4 ) (0.5 )
Flexible Products & Services 0 3.2 (1.0 ) 2.7
Land Management (0.7 ) 0 (1.7 ) (2.7 )
Total (gain) loss on disposal of properties, plants, equipment and businesses, net 17.8 3.0 4.2 2.2
Impact of Venezuela devaluation on cost of products sold
Rigid Industrial Packaging & Services — — — 9.3
Total Impact of Venezuela devaluation on cost of products sold — — — 9.3
Operating profit (loss) before special items:
Rigid Industrial Packaging & Services 60.4 42.5 213.7 171.7
Paper Packaging & Services 25.1 33.3 91.7 111.8
Flexible Products & Services 0.1 (5.3 ) (3.6 ) (24.1 )
Land Management 1.4 1.5 6.5 6.8
Total operating profit (loss) before special items $ 87.0 $ 72.0 $ 308.3 $ 266.2

GAAP TO NON-GAAP RECONCILIATION: NET INCOME AND CLASS A EARNINGS PER SHARE EXCLUDING SPECIAL ITEMS
Page 36
$ Millions and $/sh Three months ended October 31, 2016 Class A
Net Income Attributable to Greif, Inc. $ 8.5 $ 0.14
Plus: Loss on disposal of properties, plants, equipment and businesses, net 17.3 0.29
Plus: Restructuring charges 7.4 0.13
Plus: Non-cash asset impairment charges 5.3 0.09
Plus: Acquisition-related costs — —
Net Income Attributable to Greif, Inc. Excluding Special Items $ 38.5 $ 0.65
Three months ended October 31, 2015 Class A
Net Income Attributable to Greif, Inc. $ 12.4 $ 0.21
Plus: Loss on disposal of properties, plants, equipment and businesses, net 1.7 0.03
Plus: Restructuring charges 9.5 0.16
Plus: Non-cash asset impairment charges 21.1 0.36
Net Income Attributable to Greif, Inc. Excluding Special Items $ 44.7 $ 0.76
Twelve months ended October 31, 2016 Class A
Net Income Attributable to Greif, Inc. $ 74.9 $ 1.28
Plus: Loss on disposal of properties, plants, equipment and businesses, net 7.0 0.12
Plus: Restructuring charges 19.1 0.33
Plus: Non-cash asset impairment charges 42.4 0.71
Plus: Acquisition-related costs 0.1 —
Net Income Attributable to Greif, Inc. Excluding Special Items $ 143.5 $ 2.44
Twelve months ended October 31, 2015 Class A
Net Income Attributable to Greif, Inc. $ 71.9 $ 1.23
Less: Gain on disposal of properties, plants, equipment and businesses, net (2.8 ) (0.05 )
Less: Timberland Gains (14.9 ) (0.25 )
Less: Venezuela devaluation on other income/expense
(4.9 ) (0.08 )
Plus: Restructuring charges 28.2 0.48
Plus: Non-cash asset impairment charges 40.7 0.69
Plus: Acquisition-related costs 0.2 —
Plus: Venezuela devaluation of inventory on cost of products sold
9.3 0.16
Net Income Attributable to Greif, Inc. Excluding Special Items $ 127.7 $ 2.18
Note: All special items are net of tax and noncontrolling interests

GAAP TO NON-GAAP RECONCILIATION: RECONCONCILIATION OF SELECTED FINANCIAL INFORMATION EXCLUDING THE IMPACT OF DIVESTITURES
Page 37
Three months ended October 31, Twelve months ended October 31,
2016 Impact of
Divestitures
Excluding the Impact of
Divestitures 2016 Impact of
Divestitures
Excluding the Impact of
Divestitures
Net Sales: Rigid Industrial Packaging & Services $ 602.9 $ 1.6 $ 601.3 $ 2,324.2 $ 59.6 $ 2,264.6 Paper Packaging & Services 189.0 — 189.0 687.1 — 687.1 Flexible Products and Services 69.1 — 69.1 288.1 6.5 281.6 Land Management 6.6 — 6.6 24.2 — 24.2 Consolidated $ 867.6 $ 1.6 $ 866.0 $ 3,323.6 $ 66.1 $ 3,257.5
Gross Profit: Rigid Industrial Packaging & Services $ 130.9 $ 0.3 $ 130.6 $ 489.4 $ 5.7 $ 483.7 Paper Packaging & Services 39.0 — 39.0 144.5 — 144.5 Flexible Products and Services 11.7 — 11.7 42.0 1.1 40.9 Land Management 1.8 — 1.8 9.0 — 9.0 Consolidated $ 183.4 $ 0.3 $ 183.1 $ 684.9 $ 6.8 $ 678.1
Operating Profit (Loss): Rigid Industrial Packaging & Services $ 30.5 $ (0.4) $ 30.9 $ 143.9 $ (24.6 ) $ 168.5 Paper Packaging & Services 24.7 0 24.7 89.1 — 89.1 Flexible Products and Services (3.6 ) — (3.6 ) (15.5) 0.3 (15.8 ) Land Management 2.0 0 2.0 8.1 — 8.1 Consolidated $ 53.6 $ (0.4) $ 54.0 $ 225.6 $ (24.3 ) $ 249.9
Operating profit (loss) before special items:
Rigid Industrial Packaging & Services $ 60.4 $ 0.1 $ 60.3 $ 213.7 $ (0.3 ) $ 214.0 Paper Packaging & Services 25.1 — 25.1 91.7 — 91.7 Flexible Products and Services 0.1 — 0.1 (3.6 ) 0.3 (3.9 ) Land Management 1.4 — 1.4 6.5 — 6.5 Consolidated $ 87.0 $ 0.1 $ 86.9 $ 308.3 $ — $ 308.3
$ Millions
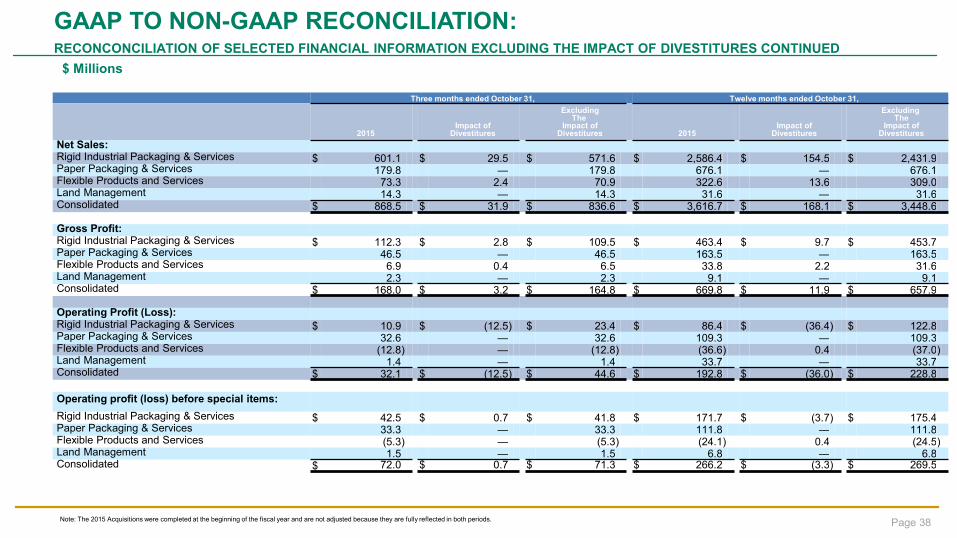
GAAP TO NON-GAAP RECONCILIATION: RECONCONCILIATION OF SELECTED FINANCIAL INFORMATION EXCLUDING THE IMPACT OF DIVESTITURES CONTINUED
Page 38 Note: The 2015 Acquisitions were completed at the beginning of the fiscal year and are not adjusted because they are fully reflected in both periods.
$ Millions
Three months ended October 31, Twelve months ended October 31,
2015 Impact of
Divestitures
Excluding The
Impact of Divestitures 2015
Impact of Divestitures
Excluding The
Impact of Divestitures
Net Sales: Rigid Industrial Packaging & Services $ 601.1 $ 29.5 $ 571.6 $ 2,586.4 $ 154.5 $ 2,431.9 Paper Packaging & Services 179.8 — 179.8 676.1 — 676.1 Flexible Products and Services 73.3 2.4 70.9 322.6 13.6 309.0 Land Management 14.3 — 14.3 31.6 — 31.6 Consolidated $ 868.5 $ 31.9 $ 836.6 $ 3,616.7 $ 168.1 $ 3,448.6
Gross Profit: Rigid Industrial Packaging & Services $ 112.3 $ 2.8 $ 109.5 $ 463.4 $ 9.7 $ 453.7 Paper Packaging & Services 46.5 — 46.5 163.5 — 163.5 Flexible Products and Services 6.9 0.4 6.5 33.8 2.2 31.6 Land Management 2.3 — 2.3 9.1 — 9.1 Consolidated $ 168.0 $ 3.2 $ 164.8 $ 669.8 $ 11.9 $ 657.9
Operating Profit (Loss): Rigid Industrial Packaging & Services $ 10.9 $ (12.5 ) $ 23.4 $ 86.4 $ (36.4 ) $ 122.8 Paper Packaging & Services 32.6 — 32.6 109.3 — 109.3 Flexible Products and Services (12.8 ) — (12.8 ) (36.6 ) 0.4 (37.0 ) Land Management 1.4 — 1.4 33.7 — 33.7 Consolidated $ 32.1 $ (12.5 ) $ 44.6 $ 192.8 $ (36.0 ) $ 228.8
Operating profit (loss) before special items:
Rigid Industrial Packaging & Services $ 42.5 $ 0.7 $ 41.8 $ 171.7 $ (3.7 ) $ 175.4 Paper Packaging & Services 33.3 — 33.3 111.8 — 111.8 Flexible Products and Services (5.3 ) — (5.3 ) (24.1 ) 0.4 (24.5 ) Land Management 1.5 — 1.5 6.8 — 6.8 Consolidated $ 72.0 $ 0.7 $ 71.3 $ 266.2 $ (3.3 ) $ 269.5
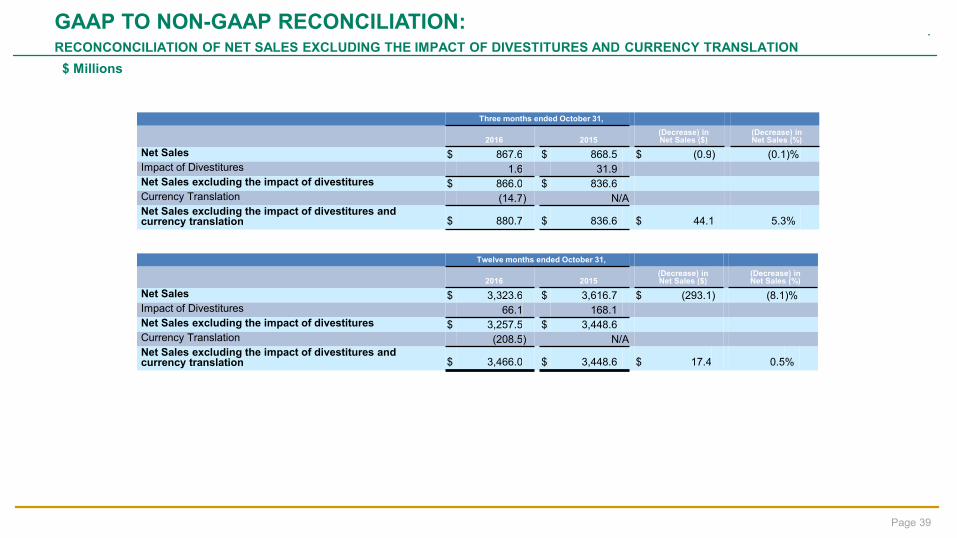
GAAP TO NON-GAAP RECONCILIATION: RECONCONCILIATION OF NET SALES EXCLUDING THE IMPACT OF DIVESTITURES AND CURRENCY TRANSLATION
Page 39
$ Millions
Three months ended October 31,
2016 2015 (Decrease) in Net Sales ($)
(Decrease) in Net Sales (%)
Net Sales $ 867.6 $ 868.5 $ (0.9 ) (0.1 )% Impact of Divestitures 1.6 31.9 Net Sales excluding the impact of divestitures $ 866.0 $ 836.6 Currency Translation (14.7 ) N/A Net Sales excluding the impact of divestitures and currency translation $ 880.7 $ 836.6 $ 44.1 5.3 %
Twelve months ended October 31,
2016 2015 (Decrease) in Net Sales ($)
(Decrease) in Net Sales (%)
Net Sales $ 3,323.6 $ 3,616.7 $ (293.1 ) (8.1 )% Impact of Divestitures 66.1 168.1 Net Sales excluding the impact of divestitures $ 3,257.5 $ 3,448.6 Currency Translation (208.5 ) N/A Net Sales excluding the impact of divestitures and currency translation $ 3,466.0 $ 3,448.6 $ 17.4 0.5 %

Page 40
GAAP TO NON-GAAP RECONCILIATION RIGID INDUSTRIAL PACKAGING & SERVICES NET SALES TO NET SALES EXCLUDING THE IMPACT OF DIVESTITURES AND CURRENCY TRANSLATION
$ Millions
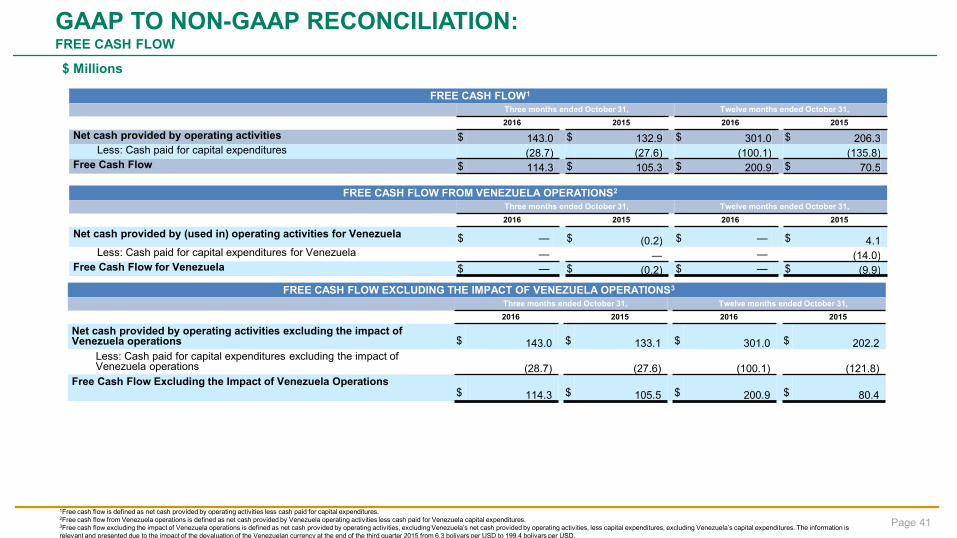
Page 41
1Free cash flow is defined as net cash provided by operating activities less cash paid for capital expenditures. 2Free cash flow from Venezuela operations is defined as net cash provided by Venezuela operating activities less cash paid for Venezuela capital expenditures. 3Free cash flow excluding the impact of Venezuela operations is defined as net cash provided by operating activities, excluding Venezuela’s net cash provided by operating activities, less capital expenditures, excluding Venezuela’s capital expenditures. The information is relevant and presented due to the impact of the devaluation of the Venezuelan currency at the end of the third quarter 2015 from 6.3 bolivars per USD to 199.4 bolivars per USD.
GAAP TO NON-GAAP RECONCILIATION: FREE CASH FLOW
$ Millions
FREE CASH FLOW1
Three months ended October 31, Twelve months ended October 31,
2016 2015 2016 2015
Net cash provided by operating activities $ 143.0 $ 132.9 $ 301.0 $ 206.3 Less: Cash paid for capital expenditures (28.7) (27.6) (100.1) (135.8)
Free Cash Flow $ 114.3 $ 105.3 $ 200.9 $ 70.5
FREE CASH FLOW FROM VENEZUELA OPERATIONS2
Three months ended October 31, Twelve months ended October 31,
2016 2015 2016 2015
Net cash provided by (used in) operating activities for Venezuela $ — $ (0.2) $ — $ 4.1 Less: Cash paid for capital expenditures for Venezuela — — — (14.0)
Free Cash Flow for Venezuela $ — $ (0.2) $ — $ (9.9)
FREE CASH FLOW EXCLUDING THE IMPACT OF VENEZUELA OPERATIONS3
Three months ended October 31, Twelve months ended October 31,
2016 2015 2016 2015
Net cash provided by operating activities excluding the impact of Venezuela operations $ 143.0 $ 133.1 $ 301.0 $ 202.2
Less: Cash paid for capital expenditures excluding the impact of Venezuela operations (28.7) (27.6) (100.1) (121.8)
Free Cash Flow Excluding the Impact of Venezuela Operations $ 114.3 $ 105.5 $ 200.9 $ 80.4
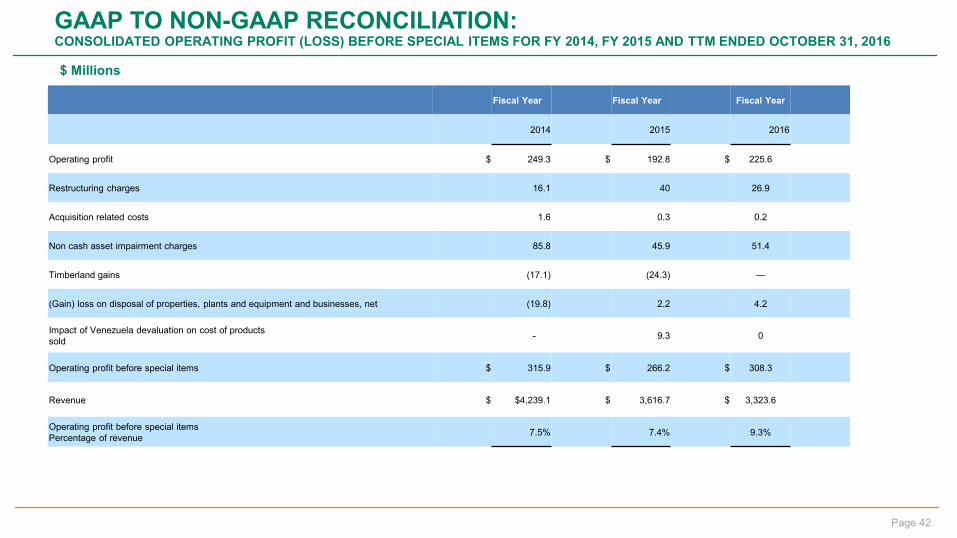
GAAP TO NON-GAAP RECONCILIATION: CONSOLIDATED OPERATING PROFIT (LOSS) BEFORE SPECIAL ITEMS FOR FY 2014, FY 2015 AND TTM ENDED OCTOBER 31, 2016
Page 42
$ Millions
Fiscal Year Fiscal Year Fiscal Year
2014 2015 2016
Operating profit $ 249.3 $ 192.8 $ 225.6
Restructuring charges 16.1 40 26.9 Acquisition related costs 1.6 0.3 0.2
Non cash asset impairment charges 85.8 45.9 51.4 Timberland gains (17.1) (24.3) —
(Gain) loss on disposal of properties, plants and equipment and businesses, net (19.8) 2.2 4.2
Impact of Venezuela devaluation on cost of products sold - 9.3 0
Operating profit before special items $ 315.9 $ 266.2 $ 308.3 Revenue $
$4,239.1
$ 3,616.7 $ 3,323.6
Operating profit before special items Percentage of revenue
7.5% 7.4% 9.3%

TRAILING TWELVE MONTHS: GROSS PROFIT MARGIN, SG&A RATIO AND OPERATING PROFIT BEFORE SPECIAL ITEMS MARGIN
Page 43
$ Millions
Q4 2016 Q3 2016 Q2 2016 Q1 2016 Trailing Twelve Months
$ % $ % $ % $ % $ %
Net Sales 867.6 845.0 839.6 771.4 3,323.6
Gross Profit 183.4 21.1% 176.5 20.9% 173.7 20.7% 151.3 19.6% 684.9 20.6%
Gross Profit after Venezuela inventory revaluation 183.4 21.1% 176.5 20.9% 173.7 20.7% 151.3 19.6% 684.9 20.6%
SG&A 96.5 11.1% 92.6 11.0% 94.5 11.3% 93.2 12.1% 376.8 11.3%
OPBSI 87.0 10.0% 83.9 9.9% 79.3 9.4% 58.1 7.5% 308.3 9.3%

Page 44
FREE CASH FLOW GUIDANCE RECONCILIATION
1The reconciliation includes two scenarios that illustrate our guidance free cash flow range for 2017. The amounts used in the reconciliation are subject to many variables, some of which are not under our control and, Therefore, are not necessarily indicative of actual results. 2The reconciliation includes two scenarios that illustrate our run rate free cash flow commitment range for 2017. The amounts used in the reconciliation are subject to many variables, some of which are not under our control and, Therefore, are not necessarily indicative of actual results.
2017 RUN RATE FREE CASH FLOW COMMITMENT
Forecast Range
Scenario 1 Scenario 2
Net cash provided by operating activities $ 295.0 $ 345.0
Less: Cash paid for capital expenditures (90.0 ) (120.0 )
Free Cash Flow $ 205.0 $ 225.0
2
2016 PROJECTED FREE CASH FLOW
Forecast Range
Scenario 1 Scenario 2
Net cash provided by operating activities $275 $315
Less: Cash paid for capital expenditures $(95) $(105)
Free Cash Flow $180 $210
1
Page 45
KEY DEFINITIONS
• Customer Satisfaction Index: Customer Satisfaction Index is an internal measure of a plants or businesses performance against selected parameters that customers experience, giving us an indication of our level of meeting our customers basic needs. Components include: customer complaints received; customer complaints open greater than 30 days; credits raised; number of late deliveries; and the number of deliveries. Categories are weighted by importance. Customer complaints and customers weighting for complaint responses may be considered more important than a credit request. Late delivery to a customer may also be more inconvenient than a credit. Therefore each category is measured, multiplied by a factor, before adding all the scores together.
• Net Promoter Score: a management tool that can be used to gauge the loyalty of a firm's customer relationships. It serves as an alternative to traditional customer satisfaction research and claims to be correlated with revenue growth. NPS can be as low as −100 (everybody is a detractor) or as high as +100 (everybody is a promoter). An NPS that is positive (i.e., higher than zero) is felt to be good, and an NPS of +50 is excellent.