Embed Size (px)
Citation preview

Desktop Virtualization Assessment
<Insert Partner Name>
<Insert Consultant Name>
April 15, 2010

Agenda
1. Scope
2. Findings
3. VDI FIT
4. Recommendations

Scope Findings VDI FIT Recommendations
Assessment Scope
Assessment Scope Assessment Start Date: January 12, 2010
Assessment End Date: February 12, 2010
Assessment Duration: 32 days
Assessment Locations: <fill in number, names>
Desktops in Org: <fill in number>
Desktops Assessed: 187
Users in Org: <fill in number>
Users Assessed: 474
Machine Groups in Org: <fill in number>
Machine Groups Assessed: 5
User Groups in Org: <fill in number>
User Groups Assessed: 2
Scope Findings VDI FIT Recommendations
VDI Fit Definition
CPU and Memory Fit Good Fair Poor Avg. System CPU % Used < 10 % 10 - 40 % > 40 %
Avg. User CPU % Used < 10 % 10 - 40 % > 40 %
Avg. Memory KB Used < 350000 KB 350000 - 700000 KB > 700000 KB
Avg. GDI Objects < 150 150 - 300 > 300
I/O Fit Good Fair Poor Avg. Disk IOPS < 10 IOPS 10 - 25 IOPS > 25 IOPS
Avg. Network KB/s < 5 KB/s 5 - 20 KB/s > 20 KB/s
Avg. Network Roundtrip MS < 40 ms 40 - 140 ms > 140 ms

Scope Findings VDI FIT Recommendations
Assessment Machine Groups
Machine Group Number of Desktops
Stats-All-Not vitsd 186
Stats-cXXXXX machines 111
Stats-vstf-int-PreRefresh 55
Stats-vstf-int-PostRefresh 20
Stats-vitsd Machines 1
Total : 5

Scope Findings VDI FIT Recommendations
Assessment User Groups
User Group Number of Users
Stats Users 292
Stats VITSD 2
Total : 2

Agenda
1. Scope
2. Findings
3. VDI FIT
4. Recommendations

Scope Findings VDI FIT Recommendations
Key Metrics Over Assessment Time Period
ActiveDesktops
ActiveUsers
Logon Duration (s)
App Load(ms)
System CPU (%)
User CPU (%)
CPU MhzMemory Usage
(%)
Disk I/O(IOPS)
Disk I/O RateDisk R/W
RatioNetwork I/O
RateNetwork
Latency (ms)GraphicsIntensity
Avg. 113.43 97.57 14.59s 19.59s 1.64% 0.55% 63.91 35.83% 8.43 IOPS 210.28 KB/s 0.84 26.65 KB/s 10.97ms 21.2
Peak Avg. 161.00 222.00 21.85s 1.13min 2.23% 0.87% 81.21 39.09% 10.11 IOPS 324.44 KB/s 1.12 49.39 KB/s 14.89ms 32.0
Scope Findings VDI FIT Recommendations
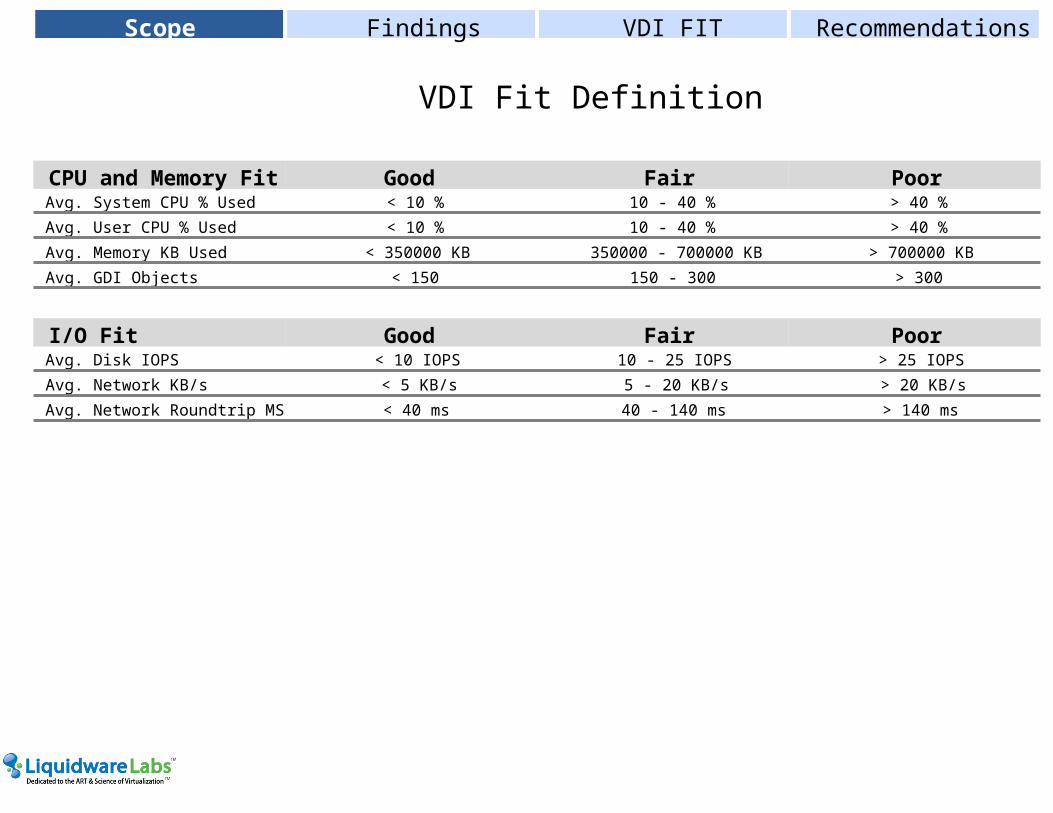
Key Metrics During Average Workday (M-F 8am-8pm)
Hour Beginning
ActiveDesktops
ActiveUsers
AverageLogon
Duration
AverageApp Load
AverageSystem CPU
AverageUser CPU
AverageCPU Mhz
AverageMemory
Usage
AverageDisk I/O
AverageDisk I/O Rate
AverageDisk R/W
Ratio
AverageNetwork I/O
Rate
AverageNetwork Latency
AverageGraphicsIntensity
8AM 168 47 16.53s 14.02s 1.09% 0.28% 39.74 35.36% 9.09 IOPS 264.52 KB/s 1.31 8.39 KB/s 12.54ms 14.5
9AM 168 153 17.39s 6.77s 1.42% 0.56% 57.17 36.88% 9.46 IOPS 256.27 KB/s 1.18 21.63 KB/s 12.37ms 20.2
10AM 169 197 16.34s 5.62s 1.82% 0.92% 79.73 39.56% 8.66 IOPS 217.55 KB/s 0.93 44.37 KB/s 12.37ms 28.2
11AM 159 224 15.03s 3.87s 1.86% 0.98% 82.80 40.23% 8.38 IOPS 202.79 KB/s 0.79 44.67 KB/s 22.45ms 30.9
12PM 160 183 14.08s 5.31s 1.92% 1.22% 91.75 39.90% 11.21 IOPS 310.57 KB/s 0.88 43.98 KB/s 30.72ms 33.1
1PM 163 185 14.31s 4.00s 1.76% 0.82% 75.42 38.95% 9.05 IOPS 228.21 KB/s 0.88 35.77 KB/s 13.96ms 32.3
2PM 167 188 14.79s 5.84s 1.76% 1.17% 85.22 39.71% 10.18 IOPS 265.47 KB/s 0.90 48.60 KB/s 15.42ms 33.6
3PM 168 207 14.94s 5.93s 2.02% 1.24% 95.21 39.26% 12.96 IOPS 350.35 KB/s 1.00 48.78 KB/s 15.93ms 34.9
4PM 162 215 14.58s 5.14s 1.81% 0.98% 81.18 39.00% 8.74 IOPS 214.40 KB/s 0.84 49.10 KB/s 15.94ms 34.1
5PM 176 255 14.16s 5.32s 1.72% 0.89% 76.40 38.20% 8.08 IOPS 180.03 KB/s 0.70 52.75 KB/s 15.39ms 31.1
6PM 161 199 14.43s 4.02s 1.53% 0.64% 63.28 37.37% 7.02 IOPS 159.54 KB/s 0.57 54.17 KB/s 11.64ms 27.4
7PM 156 160 15.30s 5.36s 1.21% 0.38% 46.15 35.82% 6.90 IOPS 160.62 KB/s 0.54 29.95 KB/s 11.03ms 21.9
8PM 158 135 13.80s 4.66s 1.23% 0.37% 46.59 36.29% 6.80 IOPS 162.18 KB/s 0.55 40.81 KB/s 10.52ms 21.9

Scope Findings VDI FIT Recommendations
Desktop Age
Years Desktops Avg. CPU % Avg. CPU MHz Total CPU MHz Avg. Memory %Avg. Memory
UsedAvg. Disk Used
%Avg. Disk Used VDI FIT Good VDI FIT Fair VDI FIT Poor
1yr 76 2% 59MHz 1151GHz 60% 317MB 57.05% 9GB 73 3 0
2yr 1 2% 96MHz 68GHz 51% 512MB 19.87% 46GB 1 0 0
4yr 3 1% 41MHz 92GHz 65% 332MB 33.51% 16GB 3 0 0
5yr 107 2% 55MHz 4793GHz 63% 336MB 31.61% 20GB 107 0 0
Totals 187 184 3 0

Scope Findings VDI FIT Recommendations
CPU Configuration
CPU Model Desktops Avg. CPU % Avg. CPU MHz Avg. CPU Peak % VDI FIT Good VDI FIT Fair VDI FIT Poor
Intel(R) Pentium(R) 4 CPU 3.00GHz
107 1.81% 54.21MHz 2.30% 107 0 0
Intel(R) Xeon(R) CPU X7350 @ 2.93GHz
48 1.95% 57.28MHz 2.40% 47 1 0
Intel(R) Xeon(R) CPU E7330 @ 2.40GHz
28 2.62% 62.92MHz 3.19% 26 2 0
Intel(R) Pentium(R) 4 CPU 3.20GHz
2 1.55% 49.50MHz 1.98% 2 0 0
Intel(R) Core(TM)2 CPU 6600 @ 2.40GHz
1 2.00% 95.69MHz 2.54% 1 0 0
Intel(R) Pentium(R) 4 CPU 2.66GHz
1 3.28% 87.25MHz 4.33% 1 0 0
Totals 187 184 3 0

Scope Findings VDI FIT Recommendations
Memory Configuration
Memory Size Count Avg. Memory Used % Avg. Memory Used VDI FIT Good VDI FIT Fair VDI FIT Poor
<= 512MB 181 62.24% 317.99MB 179 2 0
1024MB 4 53.68% 545.62MB 4 0 0
2048MB 2 44.87% 918.31MB 1 1 0
Totals 187 184 3 0

Scope Findings VDI FIT Recommendations
Operating System
Operating Systems Count VDI FIT Good VDI FIT Fair VDI FIT Poor
Microsoft Windows XP Professional, Service Pack 3
186 184 2 0
Microsoft® Windows Vista™ Enterprise , Service Pack 2
1 0 1 0
Totals 187 184 3 0

Scope Findings VDI FIT Recommendations
Storage
Disk Size Group Count Avg. Disk Size Avg. Disk Used % Avg. Disk Used VDI FIT Good VDI FIT Fair VDI FIT Poor
< 40GB 100 20.43GB 53.03% 10.59GB 99 3 0
< 80GB 84 74.56GB 28.07% 20.93GB 84 0 0
< 160GB 3 149.03GB 27.61% 41.15GB 3 0 0
< 320GB 1 232.88GB 19.87% 46.27GB 1 0 0
Totals 187 3 0

Scope Findings VDI FIT Recommendations
External Devices - Most Used

Scope Findings VDI FIT Recommendations
Monitors and Printers
Monitor Configurations Number of Desktops 1 Monitor 185
2 Monitors 1
More than 2 Monitors 0
Printer Configurations Number of Desktops 1 Local Printer 2
More Than 1 Local Printer 2
1 Network Printer 0
More Than 1 Network Printer 0

Scope Findings VDI FIT Recommendations
User Groups - CPU Utilization
Group Total Users Avg. CPU % Used Avg. CPU MHz Used Avg. CPU Peak % Used VDI FIT Good VDI FIT Fair VDI FIT Poor
Stats VITSD 2 3.55% 90.52MHz 4.44% 1 1 0
Stats Users 290 3.38% 94.65MHz 4.23% 66 224 0

Scope Findings VDI FIT Recommendations
User Groups - Memory Utilization
Group Total Users Avg. Memory Used Avg. Memory SizeAvg. Memory
Used %VDI FIT Good VDI FIT Fair VDI FIT Poor
Stats VITSD 2 933.70MB 2048MB 45.62% 1 1 0
Stats Users 290 354.12MB 526MB 68.11% 66 224 0

Scope Findings VDI FIT Recommendations
User Groups - Storage Utilization
Group Total Users Avg. Disk IOPS Avg. Disk KB/s Avg. Disk Used Avg. Disk SizeAvg. Disk
Used %VDI FIT
GoodVDI FIT Fair
VDI FIT Poor
Stats Users 290 9.79 226.10 15GB 60.275862068965516GB 41.45% 66 224 0
Stats VITSD 2 5.87 116.87 35GB 100GB 55.06% 1 1 0
Scope Findings VDI FIT Recommendations
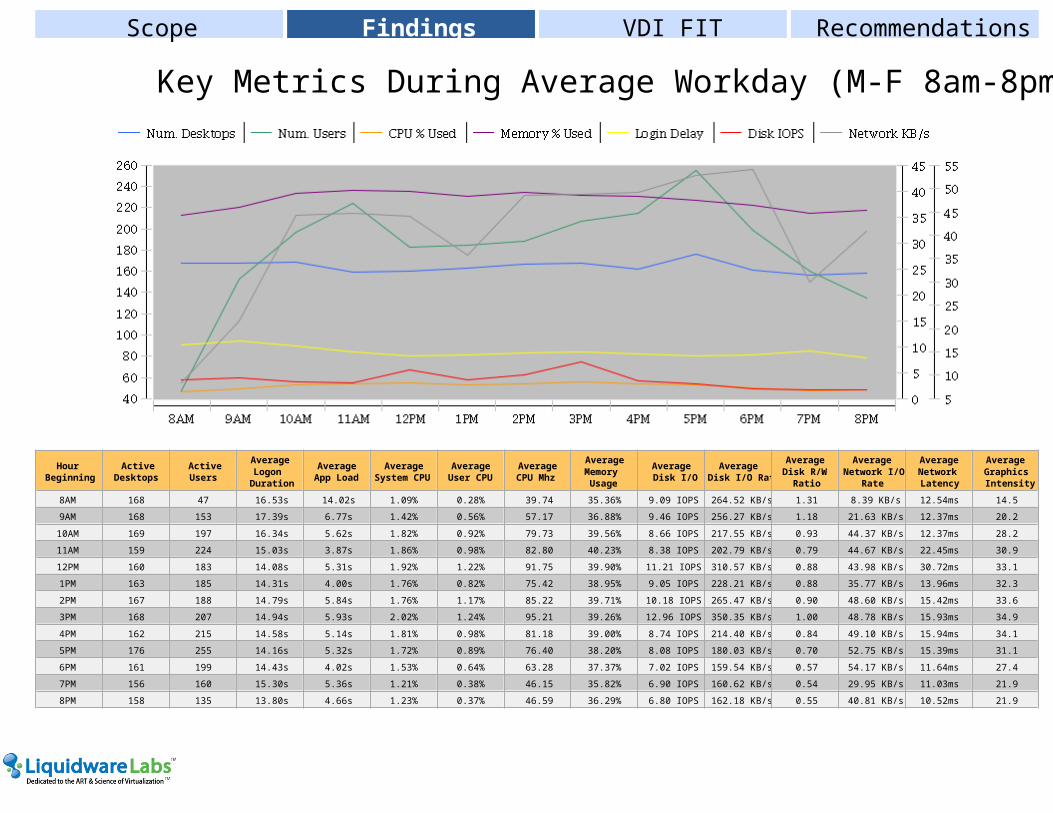
Applications - Most Used by Number of Users
Application Name Version Number of Users Number of Machines Number of ExecutionsTotal
UsageTime
On-Access Scanner service Unknown 337 173 306 34 days 452:57:56
tntgrd 4.5.0 337 173 44 n/a
Java(TM) Quick Starter Service 6.0.170 336 172 71 n/a
LSA Shell (Export Version) 5.1.2600 336 172 17 n/a
Framework Service Unknown 336 173 114 n/a
Generic Host Process for Win32 Services
5.1.2600 336 172 91 n/a
CCM Executive 2.50.4253 336 173 141 n/a
NAI Product Manager Unknown 333 170 187 n/a
Client Server Runtime Process 6.0.6000 332 171 19 n/a
Windows Explorer 6.0.6000 328 173 1026 17 days 1901:40:29

Scope Findings VDI FIT Recommendations
Applications - Most Used by Time
Application Name Version Number of Users Number of Machines Number of ExecutionsTotal
UsageTime
Windows Explorer 6.0.6000 328 173 1026 17 days 1901:40:29
Common User Interface Unknown 177 113 789 3 days 1434:10:03
On-Access Scanner service Unknown 337 173 306 34 days 452:57:56
Microsoft Outlook 10.0.685 45 42 377 12 days 486:58:00
Internet Explorer 7.00.6000 135 124 411 9 days 332:16:16
Realtek Sound Manager 5.0.1 145 85 705 504:01:58
NetSupport Client Application V10.00 260 126 933 502:14:46
CTF Loader 5.1.2600 155 101 615 435:39:09
Microsoft Office Outlook 12.0.6514 1 1 5 15 days 04:01:52
VMware Tools Service 3.5.0 150 62 418 1 day 237:13:35

Scope Findings VDI FIT Recommendations
Applications - Top Avg. CPU Consumers (%)
Application UsersAverage
CPUTime
AverageCPU
%
AverageMemory
AverageI/O
AverageGraphicsIntensity
SURVAPP 4 12.59min 24.32% 6.81MB 0.00KB/s 54.2
Vselect 7 7.91min 13.47% 11.24MB 0.88KB/s 165.2
Microsoft Office Word 1 40.68s 2.26% 12.65MB 0.18KB/s n/a
Direct3D Flying Objects Screen Saver
1 55.56s 1.54% 3.25MB 0.00KB/s 11.0
McAfee Agent Script Engine 1 30.36s 1.26% 7.82MB 3.77MB/s 4.0
Adaptive Server Anywhere Database Engine
7 14.12s 0.47% 14.11MB 0.15KB/s 24.0
SQL Server Windows NT 1 16.27s 0.45% 6.84MB 0.00KB/s 4.0
Microsoft Excel 38 9.95s 0.40% 10.02MB 14.52KB/s 257.9
WMI Provider Host 1 4.20s 0.35% 5.66MB 1.00KB/s 6.0
Spider 1 9.61s 0.32% 2.96MB 0.00KB/s 28.7

Scope Findings VDI FIT Recommendations
Applications - Top Avg. Memory Consumers (MB)
Application UsersAverage
CPUTime
AverageCPU
%
AverageMemory
AverageI/O
AverageGraphicsIntensity
McAfee Engine Service 41 3.28s 0.10% 47.89MB 118.60KB/s 4.0
Microsoft Office Outlook 1 3.84s 0.21% 47.45MB 0.71KB/s n/a
Windows Update Automatic Updates
11 4.99s 0.19% 38.48MB 395.17KB/s 4.4
VpxClient 2 1.62s 0.07% 36.09MB 0.00KB/s 492.6
sas 1 0.61s 0.02% 30.83MB 0.00KB/s 414.3
Host Process for Windows Services
1 2.52s 0.15% 30.82MB 12.21KB/s 4.0
On-Access Scanner service 337 1.29s 0.04% 30.48MB 8.31KB/s 4.0
Manipula 4 6.78s 0.21% 27.25MB 7.01KB/s 180.6
Microsoft (R) HTML Application host
6 0.00s 0.00% 25.80MB 0.00KB/s 44.7
Generic Host Process for Win32 Services
336 2.31s 0.07% 23.93MB 15.17KB/s 8.3

Scope Findings VDI FIT Recommendations
Applications - Top Avg. IO Consumers (KB/s)
Application UsersAverage
CPUTime
AverageCPU
%
AverageMemory
AverageI/O
AverageGraphicsIntensity
McAfee Agent Script Engine 1 30.36s 1.26% 7.82MB 3.77MB/s 4.0
Windows Update Automatic Updates
11 4.99s 0.19% 38.48MB 395.17KB/s 4.4
Java(TM) Quick Starter Service
336 3.90s 0.12% 1.38MB 277.60KB/s 4.0
McAfee Engine Service 41 3.28s 0.10% 47.89MB 118.60KB/s 4.0
Local Security Authority Process
1 3.95s 0.22% 3.03MB 45.76KB/s 4.0
Content Index service 1 2.16s 0.09% 804.00KB 45.00KB/s 4.0
Windows® installer 15 2.92s 0.06% 6.05MB 30.88KB/s 4.1
Generic Host Process for Win32 Services
336 2.31s 0.07% 23.93MB 15.17KB/s 8.3
Microsoft Excel 38 9.95s 0.40% 10.02MB 14.52KB/s 257.9
WMI 323 0.77s 0.03% 6.34MB 13.56KB/s 7.1

Scope Findings VDI FIT Recommendations
Applications - Top Avg. Graphics Consumers (GDI Objects)
Application UsersAverage
CPUTime
AverageCPU
%
AverageMemory
AverageI/O
AverageGraphicsIntensity
Intel(R) Audio Studio 1 0.24s 0.01% 22.73MB 0.00KB/s 1139.0
Adobe Reader 9.3 6 1.29s 0.04% 18.66MB 0.09KB/s 508.0
Microsoft Project-ThinApp 1 0.00s 0.00% 7.90MB 0.00KB/s 506.0
VpxClient 2 1.62s 0.07% 36.09MB 0.00KB/s 492.6
Windows Media Player 2 0.87s 0.07% 12.98MB 0.00KB/s 473.0
Adobe Reader 9.2 6 0.45s 0.02% 15.37MB 0.00KB/s 461.3
sas 1 0.61s 0.02% 30.83MB 0.00KB/s 414.3
FlexMail Core Software 1 4.85s 0.17% 14.18MB 0.00KB/s 387.3
Microsoft Outlook 45 2.36s 0.07% 13.69MB 0.33KB/s 359.6
Microsoft Office Visio-ThinApp 2 1.81s 0.04% 8.79MB 0.32KB/s 351.8
Agenda
1. Scope
2. Findings
3. VDI FIT
4. Recommendations

Scope Findings VDI FIT Recommendations
VDI Fit - Machines
VDI Fit, All Machines Count Good 166
Fair 4
Poor 0

Scope Findings VDI FIT Recommendations
VDI Fit - Users
VDI Fit, All Users Count Good 105
Fair 369
Poor 0

Scope Findings VDI FIT Recommendations
VDI Fit - User Groups
Good Avg. VDI FitUser Group Users with Good Fit Avg. Sys CPU (%) Avg. User CPU (%) Avg. Memory Used Avg. Mem Used (%) Avg. Graphics Avg. Disk IOPS Avg. Network I/O Avg. Network Latency
Stats Users 64 1.77% 0.52% 361.61MB 38.44% 35.35 9.09 10.65KB/s 11.99ms
Stats VITSD 1 0.84% 0.48% 682.94MB 21.67% 78.52 4.50 0.56KB/s 432.26µs
Fair Avg. VDI FitUser Group Users with Fair Fit Avg. Sys CPU (%) Avg. User CPU (%) Avg. Memory Used Avg. Mem Used (%) Avg. Graphics Avg. Disk IOPS Avg. Network I/O Avg. Network Latency
Stats Users 226 2.58% 1.10% 364.23MB 38.98% 31.29 9.91 45.37KB/s 11.79ms
Stats VITSD 1 4.10% 1.72% 1.24GB 43.48% 4.37 7.30 2.76KB/s 4.30ms
Poor Avg. VDI FitUser Group Users with Poor Fit Avg. Sys CPU (%) Avg. User CPU (%) Avg. Memory Used Avg. Mem Used (%) Avg. Graphics Avg. Disk IOPS Avg. Network I/O Avg. Network Latency

Scope Findings VDI FIT Recommendations
VDI Fit Comparison - Good Vs. Others
Group Avg. CPU Mhz Avg. CPU %Avg. Login
Delay (s)Avg. Disk Read
IOPSAvg. Disk Write IOPS Avg. Disk Read KB/s Avg. Disk Write KB/s
Avg. Disk R/W IOPS Ratio
Avg. Page Faults Avg. Page File Size MB Avg. Memory % Avg. Memory MBAvg. Graphics
Intensity
Other Fitness Levels
117.37 4.04 13.13 8.99 7.32 225.13 142.32 1.10 335,054.11 1,566.92 40.15 396.14 32.83
VDI Fit Good 43.44 1.49 11.83 2.80 3.94 97.82 68.86 0.70 571,517.17 1,464.22 35.48 328.42 18.72

Scope Findings VDI FIT Recommendations
VDI Fit Comparison - Good Vs. Others
CPU Utilization Trend
Memory Utilization Trend

Scope Findings VDI FIT Recommendations
VDI Fit Comparison - Good Vs. Others
Disk Utilization Trend
Network Utilization Trend

Scope Findings VDI FIT Recommendations
Worst VDI Fit - Machines
Name Avg. Sys CPU (%) Avg. User CPU (%) Avg. Memory Used Avg. Mem Used (%) Avg. Graphics Avg. Disk IOPS Avg. Network I/OAvg. Network
LatencyAvg. VDI Fit
vitsd-horsmic 4.10% 1.73% 1.24GB 43.56% 4.37 7.33 2.75KB/s 4.30ms 2.65
vstf-int-061 2.10% 0.67% 342.27MB 31.25% 25.91 5.81 27.84KB/s n/a 2.72
vstf-int-050 3.95% 0.72% 368.58MB 47.18% 19.35 10.56 26.07KB/s 1.53ms 2.72
vstf-int-004 2.18% 0.53% 348.62MB 42.21% 20.17 6.86 26.11KB/s 1.68ms 2.74
vstf-int-099 1.91% 0.42% 343.34MB 34.48% 19.67 9.08 34.59KB/s n/a 2.75
vstf-int-096 2.72% 0.52% 359.11MB 44.59% 19.58 11.51 15.33KB/s n/a 2.76
vstf-int-001 1.82% 0.39% 342.84MB 31.67% 17.93 6.52 24.89KB/s n/a 2.77
c157940 0.86% 0.60% 333.10MB 36.27% 21.65 9.58 24.43KB/s 12.22ms 2.78
c157968 0.91% 0.75% 343.72MB 37.97% 20.58 8.66 27.15KB/s 13.94ms 2.78
c157970 0.89% 0.37% 342.83MB 37.97% 21.04 10.20 22.30KB/s 12.74ms 2.78
c158026 0.86% 0.94% 340.16MB 37.46% 20.80 8.93 25.79KB/s 13.22ms 2.78
c157952 1.61% 0.45% 332.37MB 37.25% 21.61 10.10 23.52KB/s 13.05ms 2.78
c157946 0.92% 1.93% 344.32MB 38.25% 27.18 8.95 21.23KB/s 17.87ms 2.79
c157972 5.93% 1.44% 334.96MB 38.46% 25.33 9.27 20.72KB/s 12.43ms 2.79
c157793 1.56% 1.13% 332.55MB 37.51% 20.90 9.65 17.66KB/s 18.22ms 2.79
c157800 1.07% 0.61% 332.23MB 37.10% 21.04 9.61 18.59KB/s 25.72ms 2.79
c157951 0.86% 2.59% 335.44MB 37.55% 21.86 8.15 26.61KB/s 13.15ms 2.79
c177675 1.12% 0.91% 529.49MB 27.93% 50.99 11.84 4.34KB/s 12.73ms 2.80
c157957 0.86% 0.35% 348.91MB 38.60% 20.23 10.07 19.10KB/s 32.31ms 2.80
c157958 1.21% 0.41% 333.55MB 36.67% 19.94 9.40 24.78KB/s 12.64ms 2.80

Scope Findings VDI FIT Recommendations
Worst VDI Fit - Users
Name Avg. Sys CPU (%) Avg. User CPU (%) Avg. Memory Used Avg. Mem Used (%) Avg. Graphics Avg. Disk IOPS Avg. Network I/OAvg. Network
LatencyAvg. VDI Fit
railynn 8.04% 3.34% 449.31MB 65.44% 33.00 45.51 79.00KB/s n/a 2.15
nadahei@STATCAN 2.83% 1.66% 393.61MB 40.94% 13.62 40.63 92.00KB/s n/a 2.15
lazalau@STATCAN 1.70% 0.68% 387.46MB 39.04% 11.57 34.42 48.00KB/s n/a 2.15
proinik 2.04% 1.15% 339.39MB 42.71% 28.89 39.09 72.00KB/s n/a 2.25
rancchr@STATCAN 3.65% 0.82% 444.24MB 59.32% 29.31 17.64 47.62KB/s n/a 2.35
taylkat@STATCAN 1.80% 0.79% 344.73MB 41.45% 32.75 18.70 96.84KB/s n/a 2.37
shanala 5.66% 1.36% 400.28MB 53.06% 24.85 19.90 128.65KB/s 505.68µs 2.38
tuzimar@STATCAN 3.42% 0.88% 390.76MB 46.56% 34.74 19.39 28.08KB/s n/a 2.40
robegar@STATCAN 2.79% 2.87% 596.18MB 17.55% 11.19 30.51 7.00KB/s 341.75µs 2.40
goscfra 3.08% 0.62% 385.60MB 40.95% 22.38 17.94 43.35KB/s n/a 2.40
auguark 1.01% 0.26% 393.73MB 43.70% 30.00 10.15 126.00KB/s n/a 2.40
krymmay@STATCAN
2.10% 0.83% 381.44MB 42.23% 31.30 22.51 150.33KB/s n/a 2.40
thibdom 4.28% 0.89% 353.76MB 30.27% 13.15 17.30 60.00KB/s n/a 2.40
andejen@STATCAN 5.25% 0.72% 406.15MB 52.47% 23.02 13.92 78.68KB/s 2.17ms 2.40
perriri 4.18% 0.55% 422.52MB 51.90% 21.87 13.06 58.81KB/s n/a 2.40
goulden 4.31% 0.67% 358.46MB 37.87% 27.44 13.37 195.61KB/s 1.83ms 2.45
simolis 3.80% 3.59% 436.17MB 33.85% 31.03 8.61 74.82KB/s n/a 2.46
TremJul 4.48% 1.42% 413.34MB 57.01% 26.72 11.22 64.92KB/s n/a 2.46
lamamar@STATCAN
1.47% 0.42% 408.67MB 43.89% 32.73 11.59 113.31KB/s 11.46ms 2.46
armibri 3.95% 0.68% 392.17MB 40.81% 26.49 13.03 60.80KB/s n/a 2.47

Agenda
1. Scope
2. Findings
3. VDI FIT
4. Recommendations

Scope Findings VDI FIT Recommendations
Design Baseline
Aggregate DataSystem Element Observed - High Observed - Average Observed - Low
CPU Speed 3192.00 2924.24 2397.00
CPU Used (%) 99.62 1.98 0.33
Memory Used (MB) 1635.58 339.93 160.41
Page File Size (MB) 2429.61 377.30 207.26
Disk Used (GB) 68.07 18.70 7.40
Disk IOPS 194.97 8.77 0.00
Network I/O (KB/s) 1193.00 34.98 2.00
Network Latency (ms) 9212.32 13.23 0.04
VDI Configuration BaselineMinimum Configuration Recommended Configuration Conservative Configuration
Number of Cores 23 31 47
Memory Needed 37 GB 47 GB 56 GB
Storage Needed 2463 GB 3162 GB 3512 GB
** Design assumes master image, de-duplication

Scope Findings VDI FIT Recommendations
Recommendations
Proposed Solution- <Enter VDI Configuration description>
End Points- <Enter plan for end clients, terminals, hardware reuse>
Ensuring Good User Experience- Liquidware Labs' ProfileUnity for user data migration, profile migration- Liquidware Labs' Stratusphere for end user performance monitoring, problem resolution

Scope Findings VDI FIT Recommendations
VDI
Prepared On: April 15, 2010Prepared By:Contact Information:
<Enter Name(s)><Enter Contact>