Embed Size (px)
Citation preview
Detection of debugger awaremalware
Project Report
1013f15
Aalborg UniversityDepartment of Computer Science
Selma Lagerlöfs Vej 300DK-9220 Aalborg Østhttp://www.cs.aau.dk

Department of Computer ScienceSelma Lagerlöfs Vej 300
DK-9220 Aalborg Østhttp://www.cs.aau.dk
Title:Detection of debugger aware malware
Theme:Malware
Project Period:Spring Semester 2015
Project Group:des1013f15
Participant(s):Sergey Gurkin
Supervisor(s):Rene Rydhof HansenMatija Stevanovic
Copies: 4
Page Numbers: 41
Date of Completion:June 4, 2015
Synopsis:
A debugger is a tool that is oftenemployed by a security researcher toanalyse malware. Sophisticated sam-ples often employ different variety ofanti-tampering techniques, which of-ten include debugger detection. Thiscan be detected by a researcher, but itis impossible to analyse every piece ofmalware due to high volume, and anautomatic solution is needed.Two approaches to the problem ofautomatic detection of anti-debuggermalware were researched and dis-cussed during this project - instruc-tion tracing and differential analysis.Based on the research, a utility tooland a Cuckoo Sandbox module wereimplemented as a solution.
The content of this report is freely available, but publication (with reference) may only be pursued
due to agreement with the author.

4
Abstract
Computer security researchers are often placed in a difficult situation - theirtools need to be perfect, in terms of possible exploits, in order to not raise suspi-cions in analysed malware. It is in the interest of malicious code to shut down ifan analyst’s presence is detected as the longer it runs, the more revenue can begenerated. While malware only needs to find one weakness in the analysis tool,the tool needs to cover all possible angles of attack, which is often impractical. Itis not possible to analyse every discoverd malware sample by hand, because oflarge numbers, and automation is required. Malicious code that employs anti-tampering techniques can often mimic as a non-threatening application to slippast the automatic analyser. Such samples require more fine-grained approach,which is also more costly. A system that can detect these samples can improvethe overall performance of the malware analysis process.
Differential analysis converts the weakness of an analyst’s tool into a strengthand can yield better performance than analysing every sample in a fine-grainedmanner. This runs a malware sample in two machines and records it’s actions.One of the machines is clean while the other contains traces of an analysis tool,such as debugger. Malware is declared as evasive if a difference is spotted in it’sbehavior. This workflow was implemented in an automatic dynamic malwareanalysis environment - Cuckoo Sandbox.
5

6
Preface
The following report is a product of SW10 specialization project for the fifth-yearstudent of Software Engineering at Aalborg University. This project is the con-tinuation of work performed during SW9th pre-specialization semester. Sourcescan be found in the last part of the report.
Sergey Gurkin
7

Contents
List of Listings 9
1 Introduction 111.1 Initiating Question . . . . . . . . . . . . . . . . . . . . . . . . . . . . . 12
2 Malware analysis 132.1 Debuggers . . . . . . . . . . . . . . . . . . . . . . . . . . . . . . . . . . 132.2 Virtualization . . . . . . . . . . . . . . . . . . . . . . . . . . . . . . . . 162.3 Differential analysis . . . . . . . . . . . . . . . . . . . . . . . . . . . . . 192.4 Cuckoo sandbox . . . . . . . . . . . . . . . . . . . . . . . . . . . . . . . 212.5 Discussion . . . . . . . . . . . . . . . . . . . . . . . . . . . . . . . . . . 23
3 Related work 253.1 Debugging malware . . . . . . . . . . . . . . . . . . . . . . . . . . . . 253.2 Differential analysis . . . . . . . . . . . . . . . . . . . . . . . . . . . . . 29
4 Solution 334.1 Obtaining samples . . . . . . . . . . . . . . . . . . . . . . . . . . . . . 334.2 Differential analysis . . . . . . . . . . . . . . . . . . . . . . . . . . . . . 35
5 Conclusion 41
9

10
Chapter 1
Introduction
According to the experiment performed in [6], 40% of malware samples exhibitless malicious behavior when executed with an attached debugger. This is a se-rious problem because debuggers are often employed by security researchersto understand the behavior of malware so that counter-measures can be devel-oped.
Malware and security solutions are in a state of continuous arms race. Everynew exploit is often soon countered with a patch which is then countered by anewer exploit. There exist several ways in which malware can be analysed, butthese are often separated into static and dynamic techniques. Static approachanalyses malware without executing it, e.g. disassembling the binary files. Thisis countered by different obfuscation techniques, that make static analysis andextraction of assembly code very difficult [26].
Dynamic analysis techiques counter this by letting the malware run whileobserving its behavior that can be expressed in a form of e.g. manual debug-ging, Application Programming Interface (API)-calls trace, a memory or networkdump analysis, changes to registry and file structure. Malware responds to thisby detecting the tools and techniques that are used to capture this data and ap-pearing harmless if that is the case. Such samples require a more thorough butalso a more costly analysis technique. It is not possible to manually analyse allthe malware samples because of sheer volume and much of this task is auto-mated. Automatically detecting whether an executable is truly harmless or onlyappears to be so can be difficult. Automation can be done by employing sand-box analysis systems such as described in [9].
The presented work is a continuation of [15], a project which evaluted pop-ularity of Virtual Machine (VM) detection techniques. This was done by iden-tifying popular methods and querying a database containing analysis reportsof 80000 malware samples obtained in the wild. The reports were generatedusing Cuckoo Sandbox (Cuckoo)[13], an open source customizable automaticdynamic malware analysis system that is still being actively developed. It wasdiscovered that some approaches, e.g. [39] which do not use APIs but inline as-
11
sembly techniques, could not be viewed in the Cuckoo reports as the requireddata was lacking. Approaches that use inline assembly techniques to detect de-buggers also exist [10]. This problem is not local to Cuckoo and many sandboxessuffer from same issues, but Cuckoo was developed from the start to be expand-able through some customizable modules which could be a source of solution.
1.1 Initiating Question
How to improve Cuckoo to detect malware samples that use advanced anti-debugging methods that rely on techniques such as inline assembly checks?
12
Chapter 2
Malware analysis
Malware that uses inline assembly to test for debuggers can be detected in sev-eral ways. In an ideal world, researchers would have access to the malwaresource code but this is not the case and only raw machine code binary files areavailable. One possible solution is to obtain the assembly code of the sampleand look for specific patterns, signatures. This can be done statically by apply-ing tools such as disassemblers. A disassembler generates assembly code frombinary files which contain raw machine code. This can fail if the code is “ar-mored” - malware creator used e.g. obfuscation techniques or packer software.A dynamic approach would let the malware run and record all the assembly levelinstructions as they are executed by hardware - an instruction trace. An instruc-tion trace can be obtained by using some debugging functionality encoded di-rectly in hardware.
An alternative approach that does not rely on instruction tracing is differen-tial analysis. This is a dynamic approach that requires execution of the samplein different environments - with and without a debugger. Behavior across bothenvironments is then compared and a sample is declared as evasive if deviationsare found.
2.1 Debuggers
A debugger is a piece of software that utilizes Central Processing Unit (CPU) fa-cilities that were specifically designed for the purpose. A debugger provides aninsight into how a program performs its tasks, allows the user to control the ex-ecution, and provides access to the debugged program’s environment. It is pos-sible, using a debugger, to manually step over every instruction executed by theanalysed binary and observe the changes done to memory and registers. Aninstruction trace can be generated by automating this process. This project fo-cuses on Windows Operating Systems (OSs) using Intel CPUs.
Windows OS supports debuggers in the form of specific events, APIs andstructures [23]. A debugger either starts a new process or attaches to a running
13
one and then enters an event handling loop. To manually step over every in-struction, a specific CPU functionality is used - single-stepping mode. A CPUgenerates exceptions and waits for user response after execution of every in-struction when it runs in single-stepping mode. These exceptions are deliveredto the debugging software by the OS in form of events. Every exception has anEXCEPTION_RECORD structure associated with it. This structure is used to de-scribe events to the handlers. Exceptions generated by a CPU running in single-step mode are described by EXCEPTION_SINGLE_STEP value of ExceptionCodefield of EXCEPTION_RECORD structure. The GetThreadContext function re-turns the CONTEXT structure describing the state of the CPU at the momentof the exception.
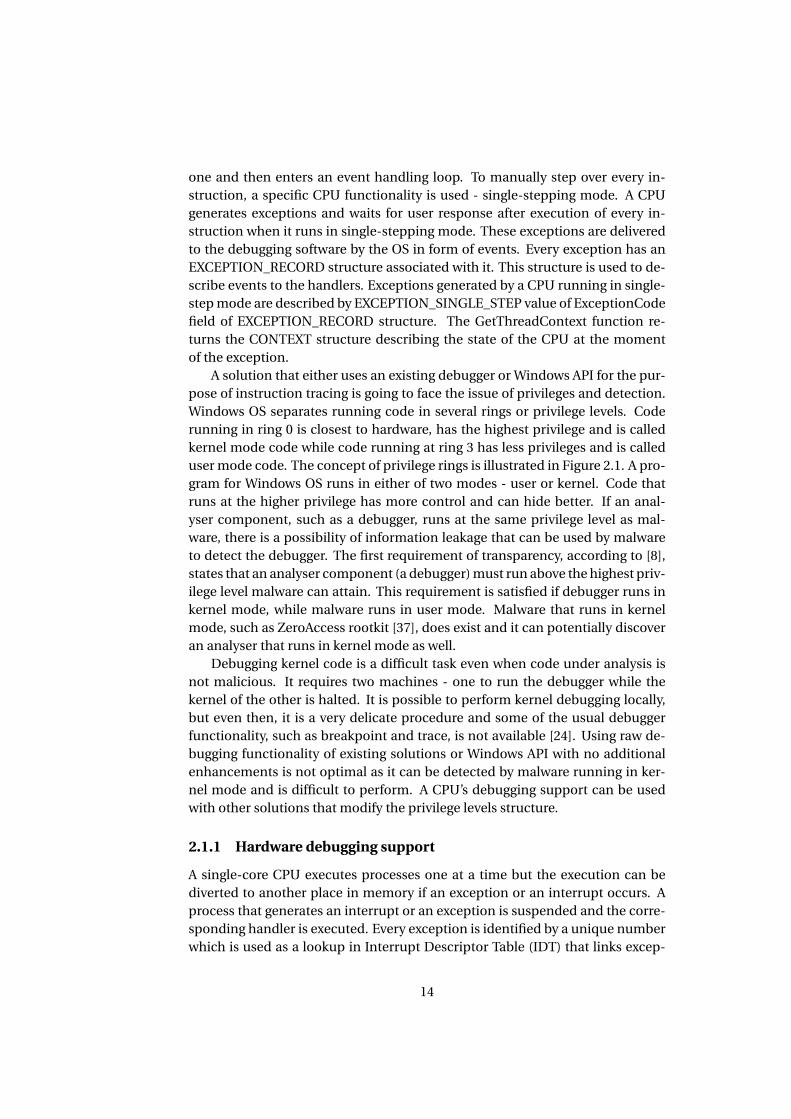
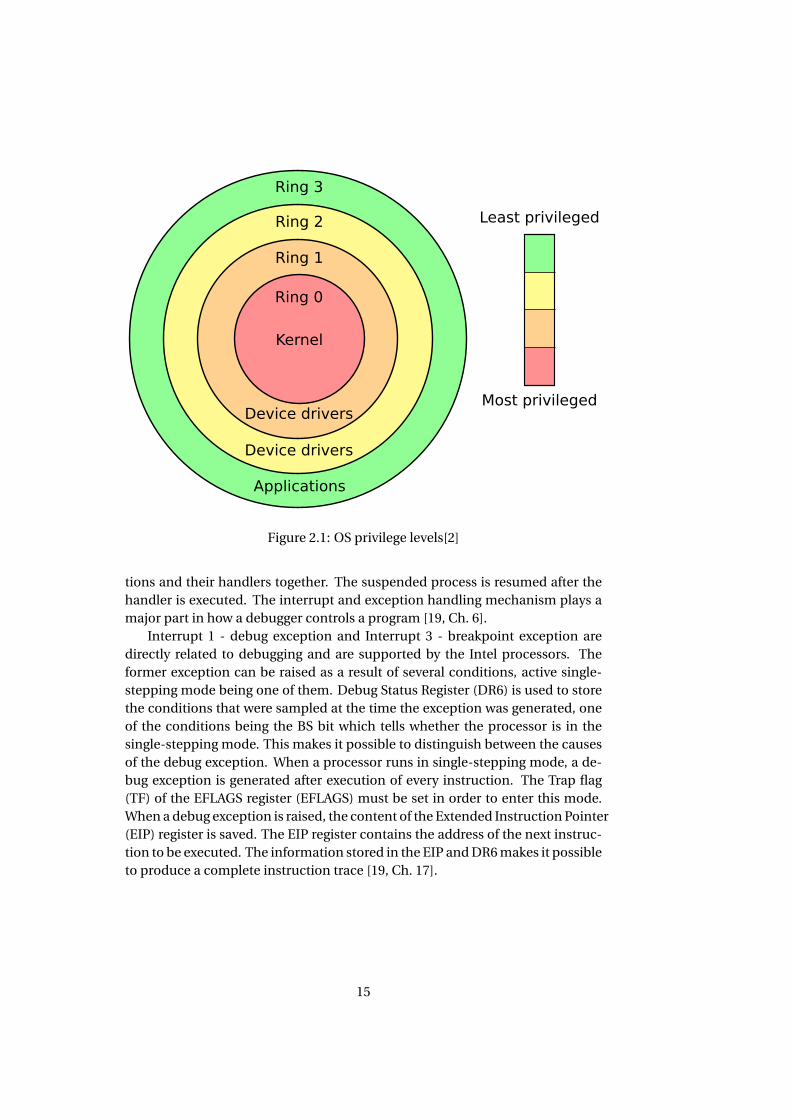
A solution that either uses an existing debugger or Windows API for the pur-pose of instruction tracing is going to face the issue of privileges and detection.Windows OS separates running code in several rings or privilege levels. Coderunning in ring 0 is closest to hardware, has the highest privilege and is calledkernel mode code while code running at ring 3 has less privileges and is calleduser mode code. The concept of privilege rings is illustrated in Figure 2.1. A pro-gram for Windows OS runs in either of two modes - user or kernel. Code thatruns at the higher privilege has more control and can hide better. If an anal-yser component, such as a debugger, runs at the same privilege level as mal-ware, there is a possibility of information leakage that can be used by malwareto detect the debugger. The first requirement of transparency, according to [8],states that an analyser component (a debugger) must run above the highest priv-ilege level malware can attain. This requirement is satisfied if debugger runs inkernel mode, while malware runs in user mode. Malware that runs in kernelmode, such as ZeroAccess rootkit [37], does exist and it can potentially discoveran analyser that runs in kernel mode as well.
Debugging kernel code is a difficult task even when code under analysis isnot malicious. It requires two machines - one to run the debugger while thekernel of the other is halted. It is possible to perform kernel debugging locally,but even then, it is a very delicate procedure and some of the usual debuggerfunctionality, such as breakpoint and trace, is not available [24]. Using raw de-bugging functionality of existing solutions or Windows API with no additionalenhancements is not optimal as it can be detected by malware running in ker-nel mode and is difficult to perform. A CPU’s debugging support can be usedwith other solutions that modify the privilege levels structure.
2.1.1 Hardware debugging support
A single-core CPU executes processes one at a time but the execution can bediverted to another place in memory if an exception or an interrupt occurs. Aprocess that generates an interrupt or an exception is suspended and the corre-sponding handler is executed. Every exception is identified by a unique numberwhich is used as a lookup in Interrupt Descriptor Table (IDT) that links excep-
14
Ring 3
Ring 2
Ring 1
Ring 0
Kernel
Device drivers
Applications
Device drivers
Least privileged
Most privileged
Figure 2.1: OS privilege levels[2]
tions and their handlers together. The suspended process is resumed after thehandler is executed. The interrupt and exception handling mechanism plays amajor part in how a debugger controls a program [19, Ch. 6].
Interrupt 1 - debug exception and Interrupt 3 - breakpoint exception aredirectly related to debugging and are supported by the Intel processors. Theformer exception can be raised as a result of several conditions, active single-stepping mode being one of them. Debug Status Register (DR6) is used to storethe conditions that were sampled at the time the exception was generated, oneof the conditions being the BS bit which tells whether the processor is in thesingle-stepping mode. This makes it possible to distinguish between the causesof the debug exception. When a processor runs in single-stepping mode, a de-bug exception is generated after execution of every instruction. The Trap flag(TF) of the EFLAGS register (EFLAGS) must be set in order to enter this mode.When a debug exception is raised, the content of the Extended Instruction Pointer(EIP) register is saved. The EIP register contains the address of the next instruc-tion to be executed. The information stored in the EIP and DR6 makes it possibleto produce a complete instruction trace [19, Ch. 17].
15
2.2 Virtualization
Using physical machines for the purpose of malware analysis is possible, but itinvolves some risks and VMs are often used instead [36, Ch. 2]. VMs simplifycontainment and the process of restoring the machine to a clean state after theanalysis. It is possible to use virtualization to move an analyser component, suchas debugger, out of malware’s reach by either introducing new privilege levels orde-privileging the OSs.
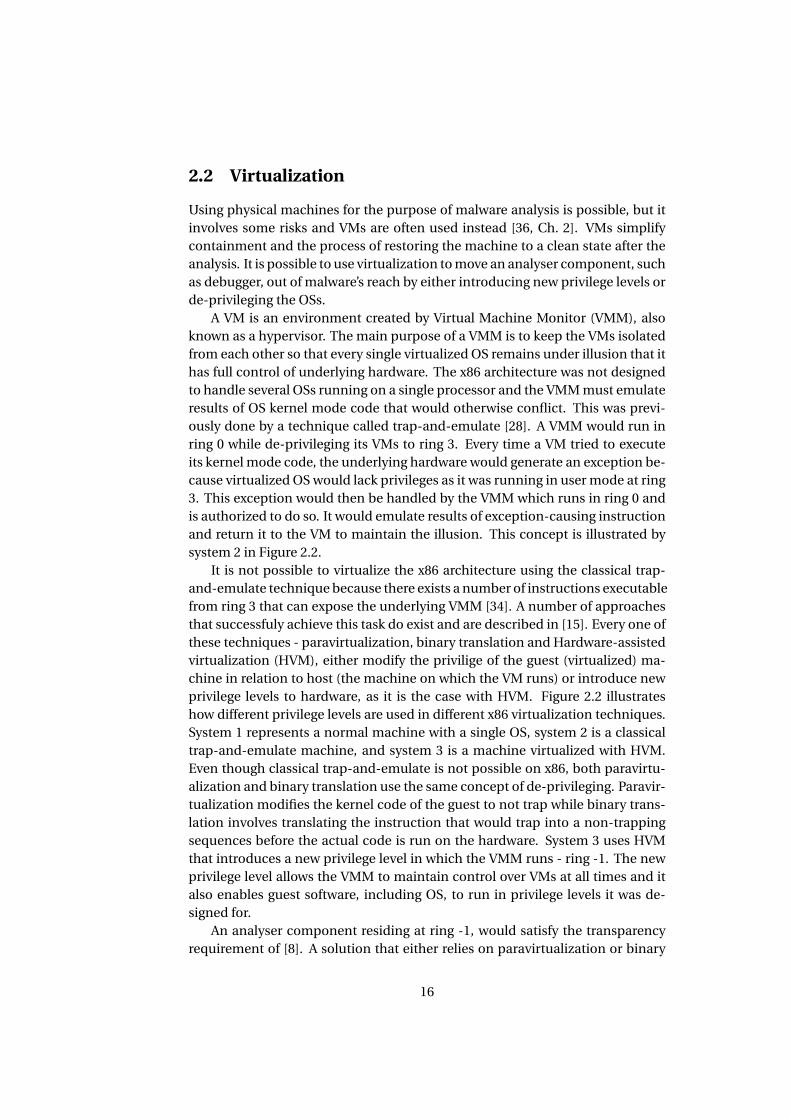
A VM is an environment created by Virtual Machine Monitor (VMM), alsoknown as a hypervisor. The main purpose of a VMM is to keep the VMs isolatedfrom each other so that every single virtualized OS remains under illusion that ithas full control of underlying hardware. The x86 architecture was not designedto handle several OSs running on a single processor and the VMM must emulateresults of OS kernel mode code that would otherwise conflict. This was previ-ously done by a technique called trap-and-emulate [28]. A VMM would run inring 0 while de-privileging its VMs to ring 3. Every time a VM tried to executeits kernel mode code, the underlying hardware would generate an exception be-cause virtualized OS would lack privileges as it was running in user mode at ring3. This exception would then be handled by the VMM which runs in ring 0 andis authorized to do so. It would emulate results of exception-causing instructionand return it to the VM to maintain the illusion. This concept is illustrated bysystem 2 in Figure 2.2.
It is not possible to virtualize the x86 architecture using the classical trap-and-emulate technique because there exists a number of instructions executablefrom ring 3 that can expose the underlying VMM [34]. A number of approachesthat successfuly achieve this task do exist and are described in [15]. Every one ofthese techniques - paravirtualization, binary translation and Hardware-assistedvirtualization (HVM), either modify the privilige of the guest (virtualized) ma-chine in relation to host (the machine on which the VM runs) or introduce newprivilege levels to hardware, as it is the case with HVM. Figure 2.2 illustrateshow different privilege levels are used in different x86 virtualization techniques.System 1 represents a normal machine with a single OS, system 2 is a classicaltrap-and-emulate machine, and system 3 is a machine virtualized with HVM.Even though classical trap-and-emulate is not possible on x86, both paravirtu-alization and binary translation use the same concept of de-privileging. Paravir-tualization modifies the kernel code of the guest to not trap while binary trans-lation involves translating the instruction that would trap into a non-trappingsequences before the actual code is run on the hardware. System 3 uses HVMthat introduces a new privilege level in which the VMM runs - ring -1. The newprivilege level allows the VMM to maintain control over VMs at all times and italso enables guest software, including OS, to run in privilege levels it was de-signed for.
An analyser component residing at ring -1, would satisfy the transparencyrequirement of [8]. A solution that either relies on paravirtualization or binary
16
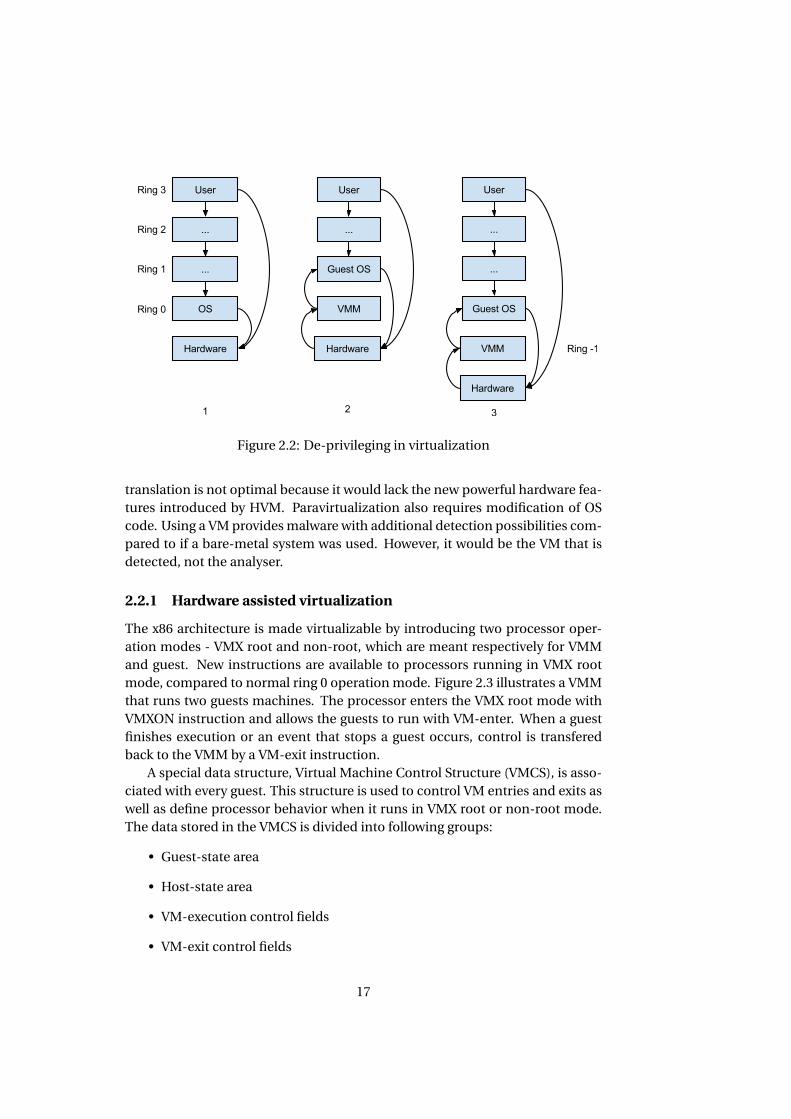
Figure 2.2: De-privileging in virtualization
translation is not optimal because it would lack the new powerful hardware fea-tures introduced by HVM. Paravirtualization also requires modification of OScode. Using a VM provides malware with additional detection possibilities com-pared to if a bare-metal system was used. However, it would be the VM that isdetected, not the analyser.
2.2.1 Hardware assisted virtualization
The x86 architecture is made virtualizable by introducing two processor oper-ation modes - VMX root and non-root, which are meant respectively for VMMand guest. New instructions are available to processors running in VMX rootmode, compared to normal ring 0 operation mode. Figure 2.3 illustrates a VMMthat runs two guests machines. The processor enters the VMX root mode withVMXON instruction and allows the guests to run with VM-enter. When a guestfinishes execution or an event that stops a guest occurs, control is transferedback to the VMM by a VM-exit instruction.
A special data structure, Virtual Machine Control Structure (VMCS), is asso-ciated with every guest. This structure is used to control VM entries and exits aswell as define processor behavior when it runs in VMX root or non-root mode.The data stored in the VMCS is divided into following groups:
• Guest-state area
• Host-state area
• VM-execution control fields
• VM-exit control fields
17
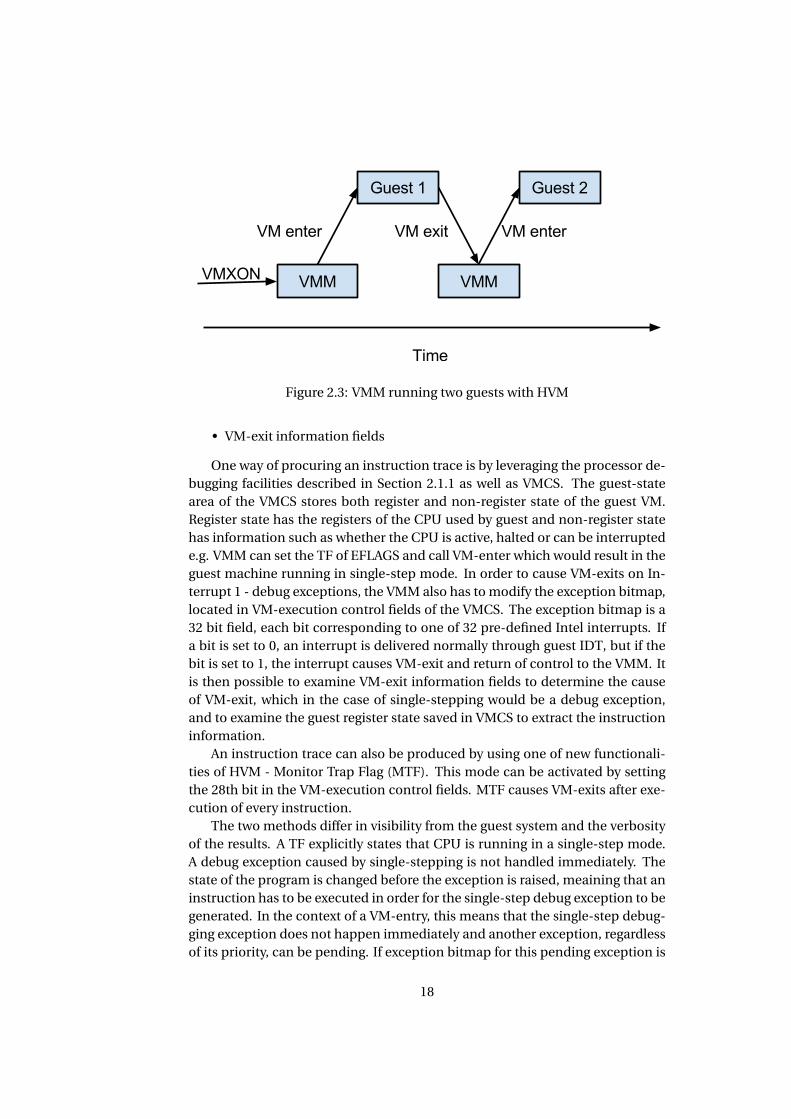
Figure 2.3: VMM running two guests with HVM
• VM-exit information fields
One way of procuring an instruction trace is by leveraging the processor de-bugging facilities described in Section 2.1.1 as well as VMCS. The guest-statearea of the VMCS stores both register and non-register state of the guest VM.Register state has the registers of the CPU used by guest and non-register statehas information such as whether the CPU is active, halted or can be interruptede.g. VMM can set the TF of EFLAGS and call VM-enter which would result in theguest machine running in single-step mode. In order to cause VM-exits on In-terrupt 1 - debug exceptions, the VMM also has to modify the exception bitmap,located in VM-execution control fields of the VMCS. The exception bitmap is a32 bit field, each bit corresponding to one of 32 pre-defined Intel interrupts. Ifa bit is set to 0, an interrupt is delivered normally through guest IDT, but if thebit is set to 1, the interrupt causes VM-exit and return of control to the VMM. Itis then possible to examine VM-exit information fields to determine the causeof VM-exit, which in the case of single-stepping would be a debug exception,and to examine the guest register state saved in VMCS to extract the instructioninformation.
An instruction trace can also be produced by using one of new functionali-ties of HVM - Monitor Trap Flag (MTF). This mode can be activated by settingthe 28th bit in the VM-execution control fields. MTF causes VM-exits after exe-cution of every instruction.
The two methods differ in visibility from the guest system and the verbosityof the results. A TF explicitly states that CPU is running in a single-step mode.A debug exception caused by single-stepping is not handled immediately. Thestate of the program is changed before the exception is raised, meaining that aninstruction has to be executed in order for the single-step debug exception to begenerated. In the context of a VM-entry, this means that the single-step debug-ging exception does not happen immediately and another exception, regardlessof its priority, can be pending. If exception bitmap for this pending exception is
18
0, it will be handled by guest IDT, meaning that no VM-exits will be generated.Contents of CPU registers, EFLAGS amongst others, is saved to the stack rightbefore the exception or interrupt handler code is run. The TF is also set to 0, soas to not trap on every instruction of handler code. If malware gains access tothe running handler, it can see the state of TF on the stack and determine thatit is being traced and it would not be possible to see as the handler code is nottraced if TF is used.
The MTF approach is transparent to the guest as it is controlled through theVMCS. It causes VM-exit after execution of every instruction, unless an event ofhigher priority, such as system-management interrupt, occurs before CPU hada chance to execute an instruction. This means that interrupt handler code withlower priority will be traced.
Both of the described approaches to produce an instruction trace can be au-tomated, but they suffer from performance issues. This happens because everyinstruction executed by guest means a VM-exit which involves:
• Record the cause of VM-exit
• Record the state of guest processor
• Load the state of host processor
The cost of VM-entry is similar as host state has to be saved and guest state hasto be loaded. Optimizations are possible as demonstrated by [1] who note thatperformance of VM-entries between P4 and “Core” Intel architectures improvedfrom 2409 to 937 cycles.
2.3 Differential analysis
This is an alternative approach to detect debugger aware malware. At least twoenvironments are created - reference and comparison. Reference environmentis used as a baseline while comparison environment is “tainted” by the presenceof a debugger. A malware sample is executed in both environments and behav-ioral logs are generated for each. Behavior of the sample is compared across theenvironments and it is declared evasive if the difference is significant.
Reference machine needs to be convincing enough for malware to show itstrue malicious behavior. One option is to use bare-metal machines both as ref-erence and as comparison. This approach is more transparent than if VMs wereused but it is also more costly as restoring bare-metal machines to a clean stateis more difficult than doing so with a VM, as snapshotting is a core feature that isreadily available out of the box for many VM products. Using VMs introducesanother problem - malware that detects virtualization and shuts down. Thismakes it difficult to decide whether a sample behaves equally in both referenceand comparison environments because anti-debugger techniques are abscentor because it detects virtualization before anti-debugger checks are performed
19
and stops executing. It is possible to hide some signs of virtualization. The VM-Cloak project [5], for example, does this by harvesting real world hardware infor-mation from registry and applying it to the generated VMs. While it is possible tomaintain transparency against some approaches, methods like local [31] or re-mote timing analysis [21] are difficult to defend against and achieving completeVM transparency is not yet possible [11].
Whether a bare-metal or VM approach is chosen, the machine itself needsto be convicing. Signs of a real world user activity, such as presence of cook-ies, popular applications, documents and some modifications to default settingscan improve the illusion of a real machine. Making the illusion completely trans-parent is difficult as at least one component of the analysis system - the initiatorthat starts the malware, must be present. The signs of this component can behidden by automatically uninstalling it after every run, such as the case with[20].
One telltale sign of an analysis environment is the absence of internet ac-cess. Internet is used by malware for propagation and as a Command and Con-trol (C&C) channel - which is the case with botnets. A bot would not be able tofunction properly without internet to receive commands from the master. Thepropagation technique is also difficult to observe without at least a local net-work. Giving malware full network access is dangerous and unethical but sev-eral solutions exist. One way to deal with this problem is to only grant partialnetwork access to malware so that messages which are perceived as maliciousare blocked. For example, a single Domain Name Service (DNS) lookup anda connection to the resolved Internet Protocol (IP)-address is probably an at-tempt to connect to a C&C server and should be allowed. Repeated attempts toestablish and drop a Transmission Control Protocol (TCP) connection is a signof an ongoing Distributed Denial of Service (DDoS) and should be blocked. Thisapproach is used by Honeywall, a 2nd generation honeypot [29] and GQ [22].Automating policy generation is difficult and most work has to be done by hand.Another approach to the network problem is to try and fool the malware by em-ulating populare network services such as Hypertext Transfer Protocol (HTTP),DNS and Internet Relay Chat (IRC). Tools like fakeNet [35] and INetSim [17] tryto perform intelligent emulation of these services by satisfying the malware’s re-quests. For example, if malware requests a .jpg file from an emulated HTTP ser-vice, the response would include a stock image or one located at user-configuredpath. It is possible to defeat such approaches and sophisticated malware will notbe fooled. For example, a botherder can generate a list of email addresses, in-cluding some of his own to test if everything is working properly, to send spamto.
An important part of the environment for this project is the debugger it-self. Popular methods of debugger detection are known and while it is possi-ble to emulate the signs of debugger presence, like setting the BeingDebuggedflag of a process to true, it is also cumbersome as debuggers can be detectedin numerous ways [10]. Another disadvantage of such approach is that previ-
20
ously unknown methods will not be detected. This can be solved by using ac-tual debugging software. Merely installing it is often not enough and a debug-ger must take an active role by running the malware samples. It is possible toautomate this process to a degree as some debuggers, such as GNU Project de-bugger (GDB), have a Command Line Interface (CLI) that allows to simply run aselected sample. Making the debugger perform more advanced actions, such assetting breakpoints or passing exceptions to the sample, is difficult. This wouldrequire a standalone emulation component using a dedicated debugger’s API orusing some debugging functions provided by the OS, such as Windows debug-ging API [23].
It is also necessary to gather enough information so as to generate an accu-rate behavioral profile for later comparison. Presence of analyser componentsin the machine reduce authenticity but increase information yield. The moststealthy approach to generate a malware’s behavioral profile is to base it only onpersisten system changes as this does not require an in-guest analyser compo-nent, reducing risk of detection. A change is persistent if it is still present aftera system shutdown, e.g. changes to Windows registry or filesystem, such as cre-ated, edited or deleted files. It is not possible to detect memory-only malwareusing this approach. Network activity can also help in generating a malware be-havioral profile. If the traffic is captured from outside the analysis environment,e.g. at the gateway, filtering is necessary to generate traffic produced specificallyby the sample. It is possible to obtain more information from a malware run byusing in-guest components. For example, a list of all API-calls and parametersperformed by malware can be obtained by hooking the APIs.
The comparison of malware behavioral data can take several forms. A cheapsolution is to compare the raw data in a bruteforce manner - each API call fromone environment is directly compared to an API call from a second environmente.g. The sample is labeled as evasive if there is a slightest mismatch. This is a veryrigid approach and a slightest difference, that might have been completely un-related, can set it off. For example, a fast-flux network [32] could have been usedby malware author. In this case, the IP-address associated with the hostnamecan change very often, meaning that if malware analysis was not performed si-multaneously at both reference and comparison machines, the extracted net-work logs would show different IP-addresses. This difference is superficial anddoes not have any semantic meaning, but it would be detected by the brute-force comparison nonetheless. This can be solved by abstracting from the rawbehavioral data, as suggested by [4].
2.4 Cuckoo sandbox
Cuckoo [13] is an open source customizable automated malware analysis sys-tem. It dynamically analyses a sample by running it in a controlled VM. ACuckoo analysis yeilds reports such as API-calls trace, network and memory
21
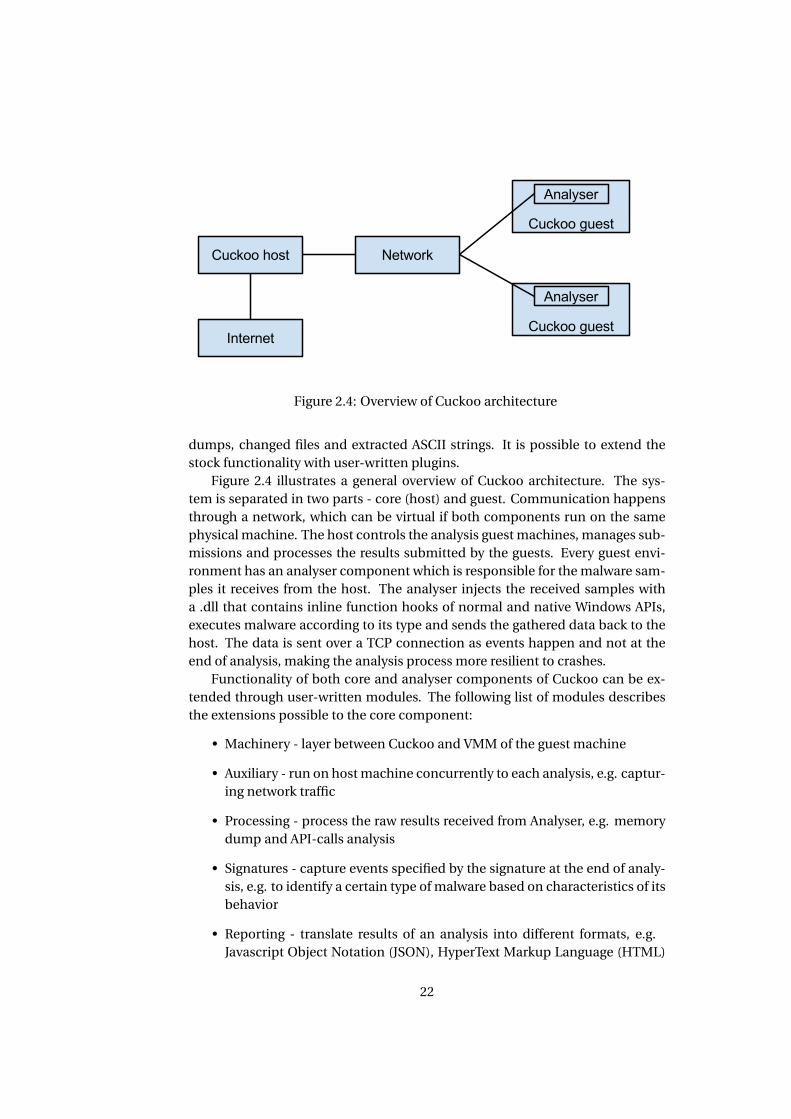
Figure 2.4: Overview of Cuckoo architecture
dumps, changed files and extracted ASCII strings. It is possible to extend thestock functionality with user-written plugins.
Figure 2.4 illustrates a general overview of Cuckoo architecture. The sys-tem is separated in two parts - core (host) and guest. Communication happensthrough a network, which can be virtual if both components run on the samephysical machine. The host controls the analysis guest machines, manages sub-missions and processes the results submitted by the guests. Every guest envi-ronment has an analyser component which is responsible for the malware sam-ples it receives from the host. The analyser injects the received samples witha .dll that contains inline function hooks of normal and native Windows APIs,executes malware according to its type and sends the gathered data back to thehost. The data is sent over a TCP connection as events happen and not at theend of analysis, making the analysis process more resilient to crashes.
Functionality of both core and analyser components of Cuckoo can be ex-tended through user-written modules. The following list of modules describesthe extensions possible to the core component:
• Machinery - layer between Cuckoo and VMM of the guest machine
• Auxiliary - run on host machine concurrently to each analysis, e.g. captur-ing network traffic
• Processing - process the raw results received from Analyser, e.g. memorydump and API-calls analysis
• Signatures - capture events specified by the signature at the end of analy-sis, e.g. to identify a certain type of malware based on characteristics of itsbehavior
• Reporting - translate results of an analysis into different formats, e.g.Javascript Object Notation (JSON), HyperText Markup Language (HTML)
22
or MongoDB.
Machinery modules are a way for Cuckoo to connect to the VMM of choice inorder to leverage its functionality for the purpose of analysis VMs management,e.g. to reboot the VMs and restore them to a clean snapshot. Machinery mod-ules allow Cuckoo to connect to desired VMM directly or by using LibVirt [16]library. LibVirt is an open source API the goal of which is to provide commonand stable layer for accessing different VMMs through a single library. In orderto generate an instruction trace of a malware sample, the code of VMM itselfneeds to support this functionality. If the VMM support is present, a machinerymodule can be used in order to start the tracing and an auxiliary module canreceive the reports generated by the VMM through the network. A processingmodule for analysing the high volume of assembly instructions would also berequired.
Extending the analyser component through the following user modules isalso possible:
• Analysis packages - define how to run malware in guest, e.g. how to opena .pdf or .exe files.
• Auxiliary - run concurrently with analysis in guest, e.g. emulating humanpresence by moving mouse and clicking on “Accept” or “OK” windows
An analysis package component is responsible for starting the actual malwareprocess. It is possible to modify the process environment to make it look likeit is being debugged or to attach an actual debugger to the process. A differen-tial analysis workflow is made of executing a sample in different environments,comparing results and producing a report. A Cuckoo workflow works only witha sample running in one environment per analysis. Automating the process ofdifferential analysis only with Cuckoo modules might be difficult because of thedifference in workflows. The customizable modules allow some change in howeach individual analysis step is performed, but it is not possible to add newsteps or completely redefine old ones. It is possible to add some comparisonand automation functionality to a core reporting module, as processed malwareexecution results are first available at reporting stage and also because every re-porting module is run by Cuckoo every analysis. A standalone component thatuses Cuckoo only to produce malware analysis reports and then performs thecomparison and reporting tasks on its own is also a possible solution.
2.5 Discussion
Instruction tracing, a feature present in many debuggers, produces a trace ofassembly instructions performed by a sample. It is possible to automate thetask of obtaining instruction traces by leveraging a CPU’s support for debuggingand the new hardware features introduced by HVM. An instruction trace can be
23
useful in different cases of malware analysis, but it does not in itself tell an an-alyst whether a sample employs anti-debugging techniques or not and furtheranalysis is required. This approach produces a lot of data and is also compu-tationally expensive as each instruction executed by malware results in severalcontext switches in the CPU with VM-exits and VM-enters. It requires supportfrom a VMM which makes the complete solution possibly dependent on oneVM vendor. An instruction trace also only covers a branch of execution. If mal-ware stops its execution before it tests for debuggers, e.g. it spots virtualization,anti-debugging behavior would not be visible.
Differential analysis relies on comparison of execution of a malware samplein several environments. This approach does not require support from low-levelcomponents, such as VMM. Detection of samples that perform 0-day exploits isalso possible for further, possibly manual, analysis. Whereas instruction tracingcan be of benefit for any malware researcher, the results of differential analy-sis are only of interest for researchers interested in anti-debugging techniques.Both approaches require an environment that appears as trustworthy to mal-ware as possible. This raises several ethical and technological difficulties, mainlyassociated with internet access and VM transparency.
A solution using the differential analysis approach is the focus of this project.While it also requires more computation than a normal analysis, it can spot mal-ware that tries any of detection techniques, including the 0-day exploits. It canbe viewed as a filtering step that separates trivial malware from armored sam-ples. These anti-tampering samples can then be sent for a more costly but alsomore informative analysis.
24
Chapter 3
Related work
3.1 Debugging malware
Debuggers are useful tools that allow analysis of code at low level. One of themost important functionality of a debugger is breakpoint. When a breakpointis hit, execution of program is stopped and control is given to the debugger, al-lowing analysis of the environment at the time. This could be very helpful whenanalysing malware, as it would be possible to see how it tries to detect tamper-ing and to skip the garbage instructions inserted on purpose. Breakpoints canbe of two types - software and hardware. Hardware breakpoints use CPU’s debugregisters to store a memory address value, which can for example be of code ordata type, on which to trigger. The disadvantage of hardware breakpoints is thelow number of debug registers - 4. Software breakpoints can be implementedin two ways - either by inserting debugging instructions at compile-time or bymodifying binary at run-time. The former is often not possible when analysingmalware, as this requires access to source code. The latter involves saving the in-struction at the desired address and overwriting it with a special instruction thatwould generate an exception if executed - int3 on x86 architecture. When thishappens, the control is given to the debugger program and the original instruc-tion is restored to be executed. Number of software breakpoints is not limited astheir hardware counterpart. Both types of breakpoints can be detected by mal-ware. Hardware breakpoints can be counteracted by malware that fills the debugregisters with some of its own values e.g. Sofware breakpoints can be detectedby checksum approaches, as they modify program’s code.
VAMPiRE is one of the subsystems of dynamic malware analysis frameworkdeveloped by [38]. The main purpose of this subsystem is to implement “stealthbreakpoints” - unlimited breakpoint functionality that is not detectable by com-mon malware approaches. This is done by leveraging virtual memory system ab-straction of modern computers. One of the purposes of an OS is to keep runningprocesses separated from each other. This involves managing their memory, sothat processes do not write over other processes memory. This is managed by a
25
virtual memory system - a mapping between a virtual and physicall addresses.A process sees the virtual address space as continuous piece of memory whileOS uses special hardware such as Memory Management Unit (MMU) to trans-late virtual addresses to real ones, which can be fragmented. The smallest uniton which virtual memory system can operate is a page, which has several at-tributes available to it. One of the attributes is present or non-present whichmeans whether a page is actually present in the physical memory or if it wasswapped and is stored on disk. A page fault is generated if it is the latter andcontrol is handled to the page fault exception handler.
Manipulation of page attributes to cause invocation of a page fault handleris the main mechanism behind breakpoints implemented by the VAMPiRE sys-tem. A user specifies the memory location on which to set the breakpoint. Thislocation is added to a breakpoint table and the page associated with the addressis set to be non-present. The default page fault handler redirects execution to thecode implemented by VAMPiRE. This is done in binary at run-time so as to coverit up from malware. If the address of the page that generates a page fault excep-tion and any of the addresses stored in the breakpoint table match, a breakpointis reached and the target instruction is executed in single-step mode.
VAMPiRE modifies the page table and can be detected by malware that at-tains kernel level privilege. It must also run its handler on every page fault, whichcan incur a performance overhead. The transparency requirements of Ether [8]are not satisfied either, as the system runs in guest.
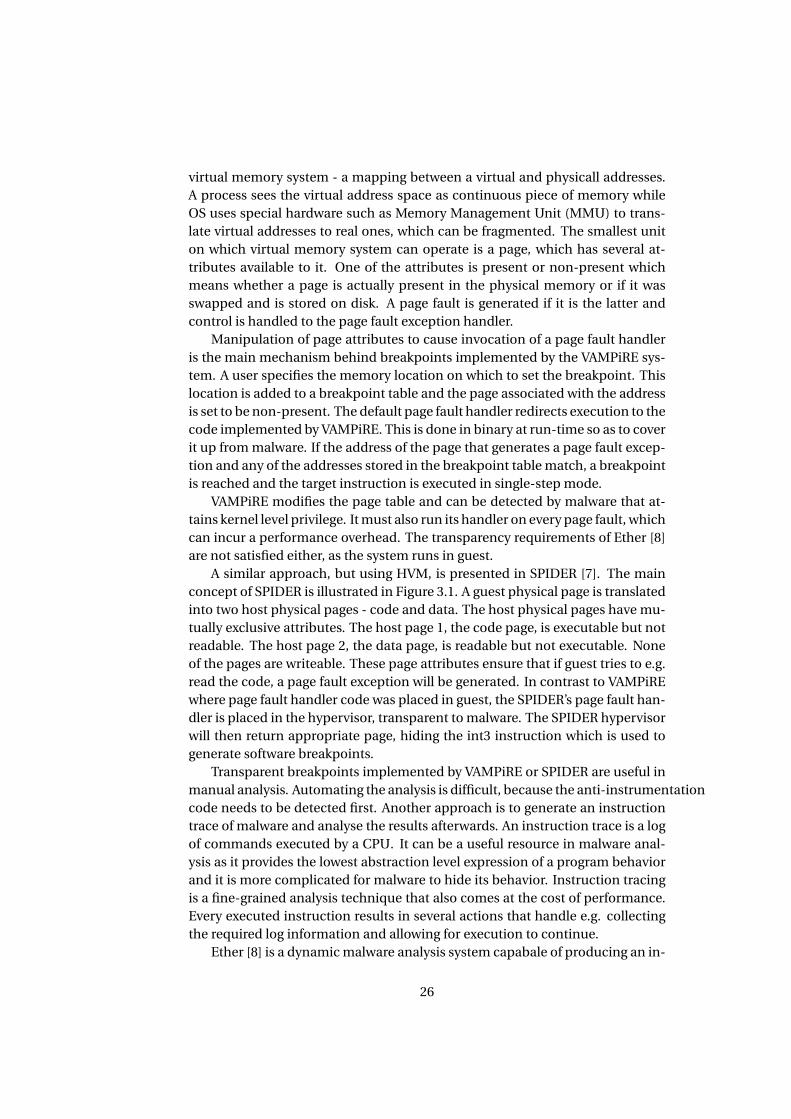
A similar approach, but using HVM, is presented in SPIDER [7]. The mainconcept of SPIDER is illustrated in Figure 3.1. A guest physical page is translatedinto two host physical pages - code and data. The host physical pages have mu-tually exclusive attributes. The host page 1, the code page, is executable but notreadable. The host page 2, the data page, is readable but not executable. Noneof the pages are writeable. These page attributes ensure that if guest tries to e.g.read the code, a page fault exception will be generated. In contrast to VAMPiREwhere page fault handler code was placed in guest, the SPIDER’s page fault han-dler is placed in the hypervisor, transparent to malware. The SPIDER hypervisorwill then return appropriate page, hiding the int3 instruction which is used togenerate software breakpoints.
Transparent breakpoints implemented by VAMPiRE or SPIDER are useful inmanual analysis. Automating the analysis is difficult, because the anti-instrumentationcode needs to be detected first. Another approach is to generate an instructiontrace of malware and analyse the results afterwards. An instruction trace is a logof commands executed by a CPU. It can be a useful resource in malware anal-ysis as it provides the lowest abstraction level expression of a program behaviorand it is more complicated for malware to hide its behavior. Instruction tracingis a fine-grained analysis technique that also comes at the cost of performance.Every executed instruction results in several actions that handle e.g. collectingthe required log information and allowing for execution to continue.
Ether [8] is a dynamic malware analysis system capabale of producing an in-
26
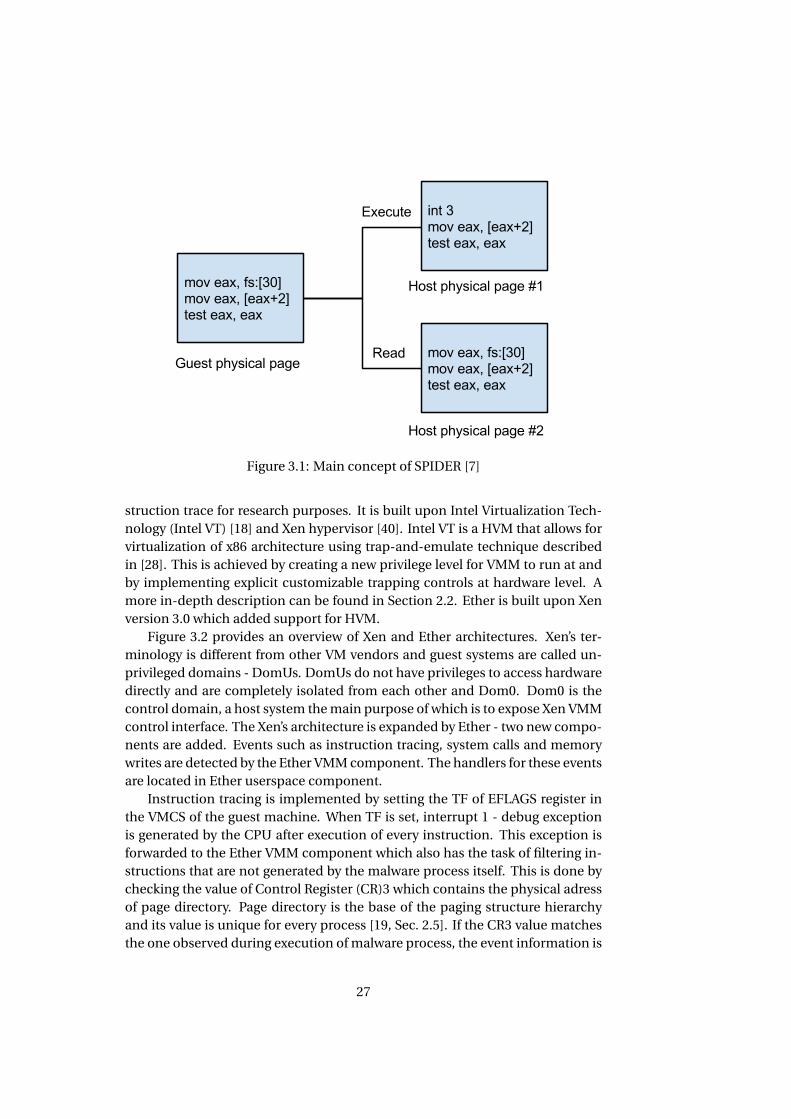
Figure 3.1: Main concept of SPIDER [7]
struction trace for research purposes. It is built upon Intel Virtualization Tech-nology (Intel VT) [18] and Xen hypervisor [40]. Intel VT is a HVM that allows forvirtualization of x86 architecture using trap-and-emulate technique describedin [28]. This is achieved by creating a new privilege level for VMM to run at andby implementing explicit customizable trapping controls at hardware level. Amore in-depth description can be found in Section 2.2. Ether is built upon Xenversion 3.0 which added support for HVM.
Figure 3.2 provides an overview of Xen and Ether architectures. Xen’s ter-minology is different from other VM vendors and guest systems are called un-privileged domains - DomUs. DomUs do not have privileges to access hardwaredirectly and are completely isolated from each other and Dom0. Dom0 is thecontrol domain, a host system the main purpose of which is to expose Xen VMMcontrol interface. The Xen’s architecture is expanded by Ether - two new compo-nents are added. Events such as instruction tracing, system calls and memorywrites are detected by the Ether VMM component. The handlers for these eventsare located in Ether userspace component.
Instruction tracing is implemented by setting the TF of EFLAGS register inthe VMCS of the guest machine. When TF is set, interrupt 1 - debug exceptionis generated by the CPU after execution of every instruction. This exception isforwarded to the Ether VMM component which also has the task of filtering in-structions that are not generated by the malware process itself. This is done bychecking the value of Control Register (CR)3 which contains the physical adressof page directory. Page directory is the base of the paging structure hierarchyand its value is unique for every process [19, Sec. 2.5]. If the CR3 value matchesthe one observed during execution of malware process, the event information is
27
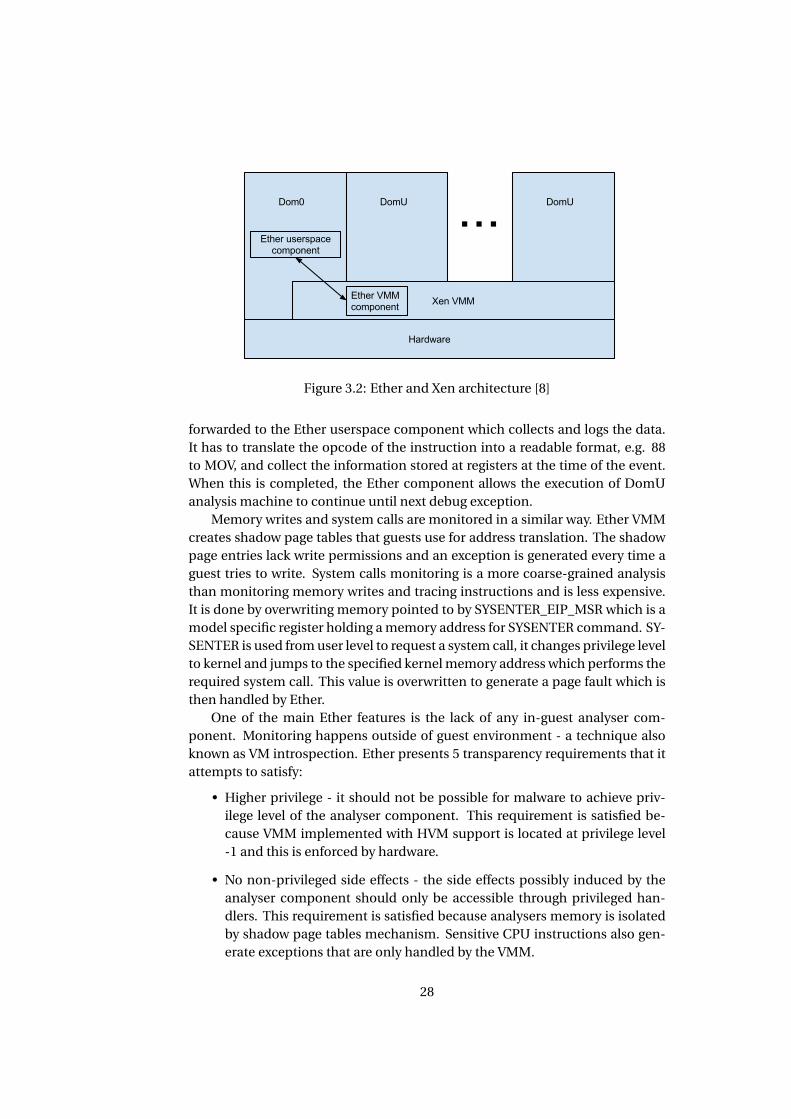
Figure 3.2: Ether and Xen architecture [8]
forwarded to the Ether userspace component which collects and logs the data.It has to translate the opcode of the instruction into a readable format, e.g. 88to MOV, and collect the information stored at registers at the time of the event.When this is completed, the Ether component allows the execution of DomUanalysis machine to continue until next debug exception.
Memory writes and system calls are monitored in a similar way. Ether VMMcreates shadow page tables that guests use for address translation. The shadowpage entries lack write permissions and an exception is generated every time aguest tries to write. System calls monitoring is a more coarse-grained analysisthan monitoring memory writes and tracing instructions and is less expensive.It is done by overwriting memory pointed to by SYSENTER_EIP_MSR which is amodel specific register holding a memory address for SYSENTER command. SY-SENTER is used from user level to request a system call, it changes privilege levelto kernel and jumps to the specified kernel memory address which performs therequired system call. This value is overwritten to generate a page fault which isthen handled by Ether.
One of the main Ether features is the lack of any in-guest analyser com-ponent. Monitoring happens outside of guest environment - a technique alsoknown as VM introspection. Ether presents 5 transparency requirements that itattempts to satisfy:
• Higher privilege - it should not be possible for malware to achieve priv-ilege level of the analyser component. This requirement is satisfied be-cause VMM implemented with HVM support is located at privilege level-1 and this is enforced by hardware.
• No non-privileged side effects - the side effects possibly induced by theanalyser component should only be accessible through privileged han-dlers. This requirement is satisfied because analysers memory is isolatedby shadow page tables mechanism. Sensitive CPU instructions also gen-erate exceptions that are only handled by the VMM.
28
• Identical basic instruction execution semantics - the instructions executedby guest should have the exact same semantics as if guest machine wasnot virtualized. This requirement is satisfied because guest OS with HVMruns in privilege level 0, just as a normal non-virtualized machine would.The exceptions generated by the CPU are transparent to the guest becausethey are handled by the VMM at privilege level -1.
• Transparent exception handling - the guest exception handling should notbe affected in any way - no existing handlers should be modified and nonew handlers should be added by the analyser component. This require-ment is satisfied because exception handling happens at VMM which hasaccess to the VMCS structure. This makes it possible for VMM to distin-guish between “true” exceptions generated by guest, which are delivered,and exceptions that are specific to the Ether, which are handled transpar-ently.
• Identical measurements of time - timing information available to guestshould be the same with and without analyser component. Ether analysercomponet incurs timing penalties as it needs time to run its code. Thisrequirement can be satisfied for local timing sources as these instructionsare privileged and generate exceptions when executed from guest. TheVMM would have to to calculate the performance hit incurred by excep-tion handling and modify the timing information available to guest ac-cordingly. It is not possible to modify remote or external timing sourcesand this can lead to detection.
Authors note that Ether could be detected because of side effects incurred bythe first generation Intel Intel VT that have to do with memory and Transactionlookaside buffer (TLB), which is flushed on every VM-exit. This issue has beenfixed in later HVM implementations [12]. Instruction tracing in Ether is alsolimited by poor performance and authors have stated that it not meant as a real-time analysis tool.
VAMPiRE, SPIDER and Ether are all vulnerable to timing analysis, one of de-tection methods that is most difficult to defend against. An analysis component,located inside the guest or in hypervisor, needs time to run if it is to be of anyuse. This incurs a timing penalty which can be detected by malware. The toolspresented here hide their presence by modifying the local time stamp counterregister to appear as if they never ran. While this makes it possible to avoid mal-ware that only relies on local timing sources, it is not possible to avoid malwarethat uses remote timing.
3.2 Differential analysis
A different way to detect anti-debugging capabilities, without suffering fromlarge performance overhead induced by fine-granularity analysis, is by compar-
29
ing the behavior of malware in a clean reference and in an instrumented analysisenvironments. Any deviations in behavior imply that the modified analysis en-vironment is detected. This method does not show exactly how a debugger isdetected. The exploit can be deduced from analysing the malware behaviorallog that was used for comparison, but if the granularity of information in thelog is not fine enough, the exploit might slip through. This method was usedin [6] to determine popularity of anti-tampering techniques in malware. 6900distinct malware samples were run in a clean, debugged and virtualized envi-ronments while having their behavior recorded. The results showed that 40% ofsamples executed fewer malicious actions in debugged and virtualized environ-ments compared to the referenced one. A malicious event is defined by authorsas an event that causes persistent changes to the system. A one-to-one compar-ison was done on the produced behavior logs.
Comparing behavior of malware in this fashion might not yield reliable re-sults, as stated by [3], who implement a “record and replay” system in their work.They state that Windows OS is very complex and it is possible for the same mal-ware sample to exhibit slightly different behavior when executed in the sameenvironment. This could happen if, for example, the execution of malware re-lies on external sources, such as internet, some parameters change, such as CPUload. The authors define the behavior of malware to be a sequence of systemcalls with their arguments. System calls provide means for malware to commu-nicate with its environment and to cause persistent changes. The authors recordthe system calls with arguments and output values in the reference system andthen “replay” this information on the analysis system.
The main part of architecture of the [3] is a kernel driver installed on bothreference and analysis systems. The driver hooks the System Service DescriptorTable (SSDT), which is a structure that is used as an entry point to every systemcall. On the reference system, this makes it possible to record the system callsperformed by malware with the according arguments and outputs. When mal-ware sample is run in the analysis system, the driver detects the identical systemcalls, but it replaces the results of these calls with values from the reference sys-tem, instead of passing them to the OS. Small timing differences can cause tem-poral deviations in behavior, e.g. asynchronous function calls. The system callmatching algorithm is implemented in a flexible way because of that. It uses twoqueue structures and has “lookahead” functionality. One of the queues holdsthe system calls that appeared on the analysis system but not on the referenceone, while the other queue holds the opposite - system calls that appear on thereference system but not in the analysis. Some system calls have side effects andcan’t be replayed - memory allocation e.g. These have to be forwarded to the OS
“Replaying” malware actions is a more complex task than simply observingits behavior, as it is necessary to handle all the possible side effects. The systemalso completely relies on in-guest components, which could be detected. Thiscould be solved by employing HVM, but that could also decrease performance.
[30] is a differential analysis system built on top of Cuckoo. It is argued that
30
organizations employ different environments in their infrastructure, e.g. Linuxservers and Windows hosts. The main goal of the system is to automatically exe-cute a malware sample in different environments in order to assess the damage.A more hollistic view of malware behavior can be gained by executing it in differ-ent environments. The main difference from the work done in this project is thefact that the environments employed by authors are static, meaning that mal-ware is allowed to run loose in VMs prepared on beforehand. The environmentused in this project is more dynamic in a sense that a debugger must actuallyrun and execute the malware. This project is also more focused on detectinganti-debugging capabilities in malware, while [30] is more focused on gaining acomplete picture of a malware’s sample behavior.
31

32
Chapter 4
Solution
4.1 Obtaining samples
In order to evaluate if the solution is working, a ground truth set of malwaresamples is needed. This set contains samples that certainly do have observableanti-debugging behavior. It can then be used as an input to the created solutionto see if it can identify the samples as evasive. Two possibilities were exploredfor creation of this set.
It is possible to create a non-malicious sample with anti-debugging capabili-ties in the lab environment. This allows much more control than if a sample wasfound in the wild and it is possible to focus only on anti-debugging. The down-side is that the methods used in the benchmark sample are the ones that havebeen already discovered and studied and newer methods might be missed. An-other approach is to obtain samples from the wild, as infrastructure for doing soalready exists in the form of malware research repositories, such as VirusShare[33]. The samples obtained in this way would also need to be studied in order toconfirm the presence of anti-debugging methods.
4.1.1 Benchmark sample
A sample that performs a debugger check using an inline assembly function andsimulates malicious activity by checking a registry key and creating a file waswritten in C++. The being_debugged function, shown in Listing 4.1, is used fordebugger detection. This type of detection method was chosen because it is oneof the simplest methods an attacker can use to detect if his malware is being de-bugged yet it is also stealthy enough to not use any APIs, rendering API - hookinginstrumentation methods, such as ones used in Cuckoo and other sandboxes,blind to this attack. The goal of this method is to check whether BeingDebuggedflag of Process Environment Block (PEB) structure [25] is set. The FS registeris used by Windows OSs to store the Thread Environment Block (TEB), a datastructure that describes currently running thread. The address of PEB is storedat offset 0x30h. The square brackets used with mov command mean that instead
33
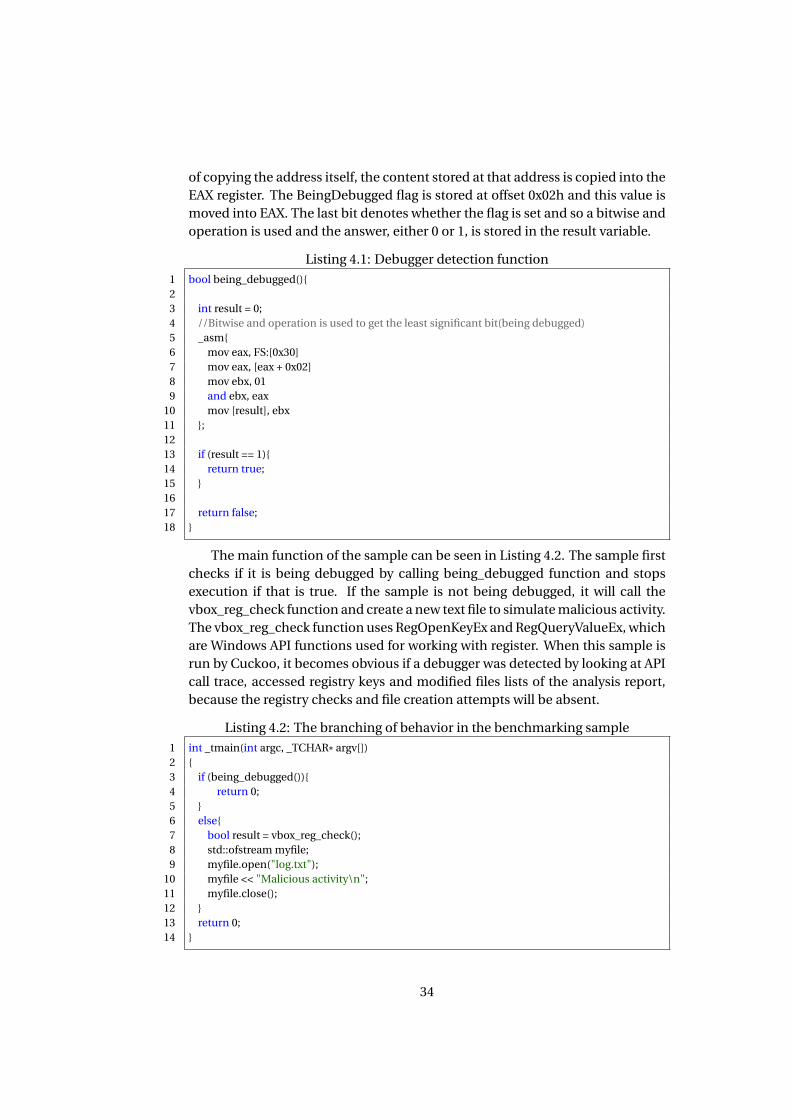
of copying the address itself, the content stored at that address is copied into theEAX register. The BeingDebugged flag is stored at offset 0x02h and this value ismoved into EAX. The last bit denotes whether the flag is set and so a bitwise andoperation is used and the answer, either 0 or 1, is stored in the result variable.
Listing 4.1: Debugger detection function
1 bool being_debugged(){23 int result = 0;4 //Bitwise and operation is used to get the least significant bit(being debugged)5 _asm{6 mov eax, FS:[0x30]7 mov eax, [eax + 0x02]8 mov ebx, 019 and ebx, eax
10 mov [result], ebx11 };1213 if (result == 1){14 return true;15 }1617 return false;18 }
The main function of the sample can be seen in Listing 4.2. The sample firstchecks if it is being debugged by calling being_debugged function and stopsexecution if that is true. If the sample is not being debugged, it will call thevbox_reg_check function and create a new text file to simulate malicious activity.The vbox_reg_check function uses RegOpenKeyEx and RegQueryValueEx, whichare Windows API functions used for working with register. When this sample isrun by Cuckoo, it becomes obvious if a debugger was detected by looking at APIcall trace, accessed registry keys and modified files lists of the analysis report,because the registry checks and file creation attempts will be absent.
Listing 4.2: The branching of behavior in the benchmarking sample
1 int _tmain(int argc, _TCHAR* argv[])2 {3 if (being_debugged()){4 return 0;5 }6 else{7 bool result = vbox_reg_check();8 std::ofstream myfile;9 myfile.open("log.txt");
10 myfile << "Malicious activity\n";11 myfile.close();12 }13 return 0;14 }
34
4.1.2 Real world samples
The SW9 project [15] researched VM detection methods that could be used bymalware to avoid being analysed. Malware samples were run in Cuckoo whichgenerated behavior reports that were uploaded to MongoDB. The database con-tains analysis reports of 80000 malware samples. This resource is reused in thisproject in order to generate a ground truth of samples. The data stored in Cuckooreports is not enough to detect malware that uses inline assembly methods fordebugger detection, such as the benchmarking sample, but it is possible to findsamples that check for debuggers in other ways. The reasoning is that if a sam-ple checks for a debugger in a way that is detectable with Cuckoo data, it mightalso perform other checks that remained undetected so far.
Cuckoo reports contain a very rich API trace and debug detection methodsthat use Windows API were queried for first. The interesting API functions are Is-DebuggerPresent and FindWindow, because these are the easiest for an attackerto use - one API call reveals whether a debugger is present or not. The formerfunction checks the PEB structure and returns the value of BeingDebugged bytewhich is set by the debugger when it starts or attaches to a process. The latterfunction can be used to find open windows in the desktop. If supplied with ar-guments such as “OllyDbg”, it will return a handle to the window with that name.Lastly, MongoDB was queried for samples that check HKEY_LOCAL_MACHINE(HKLM) \SOFTWARE\Microsoft\Windows NT\CurrentVersion\AeDebug registrykey. This key is associated with automatic postmortem debugger in Windows -a debugger that starts automatically if an application crashes. These 3 queriesyielded 17 unique results from a total of 80000 samples.
The actual samples were obtained by searching VirusShare repository formatching md5-checksums present in corresponding Cuckoo reports. A Win-dows 7 VirtualBox VM with OllyDbg was created and samples were analysed byhand looking specifically for assembly code that checked BeingDebugged flagof PEB, as this is one of the easies checks for a malware writer to perform. Theattempt was unsuccessful and no traces of inline assembly checks were foundduring manual analysis. Some of the analysed samples also made system unsta-ble and crash. This can probably be attributed to other malware defense mech-anisms, such as packing.
4.2 Differential analysis
Two environments are needed in order to perform differential analysis - one forreference and one for analysis. Both environments use VirtualBox for virtual-ization and Windows 7 32 bit edition with network simulated by INetSim withdefault configuration and no real access to the internet. The only difference be-tween the two environments is the presence of GDB on the analysis machine,which was installed as a part of Minimalist GNU for Windows (MinGW) [27].GDB was chosen for this project because of authors basic familiarity with it and
35
knowledge that it is possible to automate the process of running an applicationunder it.
Just having GDB installed on one of the system would not be useful for thepurpose of anti-debugger malware detection. A Cuckoo analysis package wascreated in order to automatically start the malware sample under the debug-ger and allow it to run. A Cuckoo analysis package tells the in-guest agent howto process certain types of malware, e.g. .pdf samples are opened with AdobeReader. The .exe package was taken as a base for this project. It starts a mal-ware process in a suspended state and injects it with the instrumentation dll tohook the API functions in default reference environment. The modified pack-age, which is used in the analysis environment, attaches the GDB after the pro-cess is created but before it is resumed. GDB knows which process to attach tobecause it is supplied with a path to the process as well as the process identi-fier in the form of arguments. To automatically continue running the process,the debugger is supplied with “-ex cont” command. “-ex” executes one GDBspecific instruction which in this case is “cont”. When “cont” instruction is exe-cuted without parameters, the process is allowed to execute until a breakpoint,error or termination is encountered.
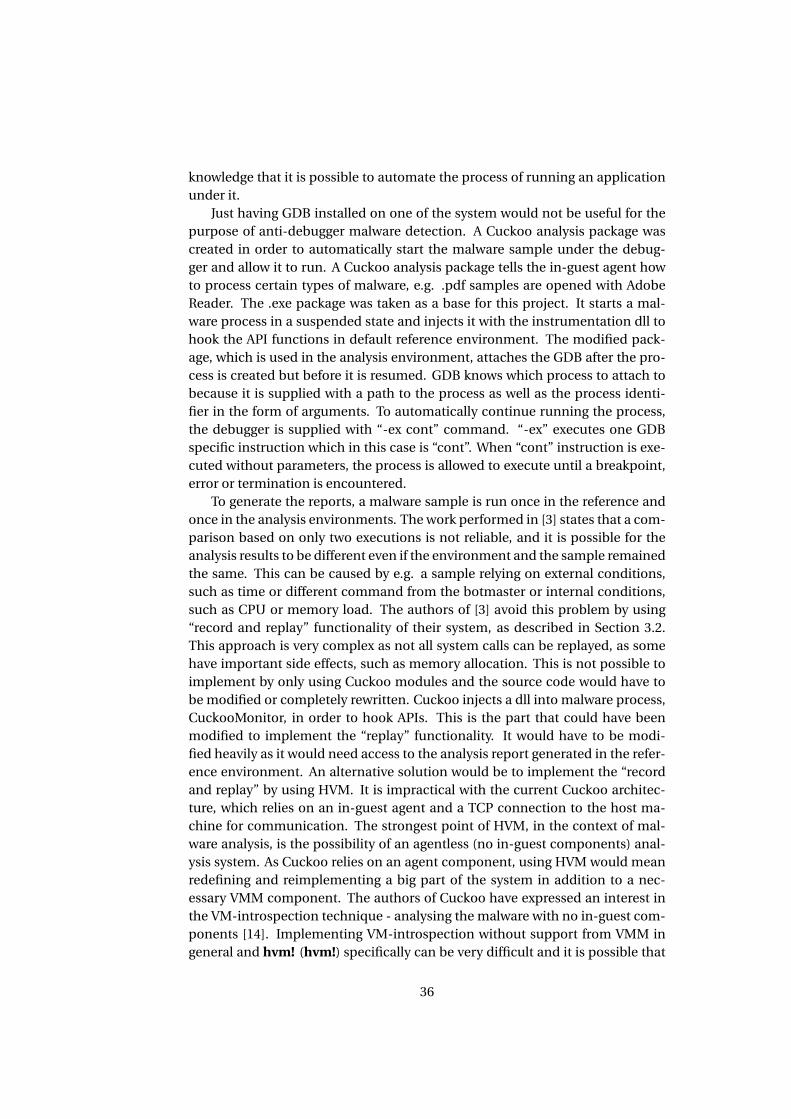
To generate the reports, a malware sample is run once in the reference andonce in the analysis environments. The work performed in [3] states that a com-parison based on only two executions is not reliable, and it is possible for theanalysis results to be different even if the environment and the sample remainedthe same. This can be caused by e.g. a sample relying on external conditions,such as time or different command from the botmaster or internal conditions,such as CPU or memory load. The authors of [3] avoid this problem by using“record and replay” functionality of their system, as described in Section 3.2.This approach is very complex as not all system calls can be replayed, as somehave important side effects, such as memory allocation. This is not possible toimplement by only using Cuckoo modules and the source code would have tobe modified or completely rewritten. Cuckoo injects a dll into malware process,CuckooMonitor, in order to hook APIs. This is the part that could have beenmodified to implement the “replay” functionality. It would have to be modi-fied heavily as it would need access to the analysis report generated in the refer-ence environment. An alternative solution would be to implement the “recordand replay” by using HVM. It is impractical with the current Cuckoo architec-ture, which relies on an in-guest agent and a TCP connection to the host ma-chine for communication. The strongest point of HVM, in the context of mal-ware analysis, is the possibility of an agentless (no in-guest components) anal-ysis system. As Cuckoo relies on an agent component, using HVM would meanredefining and reimplementing a big part of the system in addition to a nec-essary VMM component. The authors of Cuckoo have expressed an interest inthe VM-introspection technique - analysing the malware with no in-guest com-ponents [14]. Implementing VM-introspection without support from VMM ingeneral and hvm! (hvm!) specifically can be very difficult and it is possible that
36
Cuckoo will support this feature in the future. As of now, the “record and replay”functionality is out of scope for this project.
Listing 4.3: API call 34 in referenceenvironment
1 {2 "category": "registry",3 "status": true,4 "return": "0x00000000",5 "timestamp": "2015−05−05
03:51:13,251",6 "thread_id": "916",7 "repeated": 0,8 "api": "RegOpenKeyExW",9 "arguments": [
10 {11 "name": "Handle",12 "value": "0x0000007c"13 },14 {15 "name": "Registry",16 "value": "0x80000002"17 },18 {19 "name": "SubKey",20 "value": "Hardware\\
Description\\System"21 }22 ],23 "id": 3424 },
Listing 4.4: API call 34 in analysisenvironment
1 {2 "category": "system",3 "status": false,4 "return": "0xc0000135",5 "timestamp": "2015−05−05
03:52:17,496",6 "thread_id": "2412",7 "repeated": 1,8 "api": "LdrGetDllHandle",9 "arguments": [
10 {11 "name": "ModuleHandle",12 "value": "0x02100210"13 },14 {15 "name": "FileName",16 "value": "mscoree.dll"17 }18 ],19 "id": 3420 },
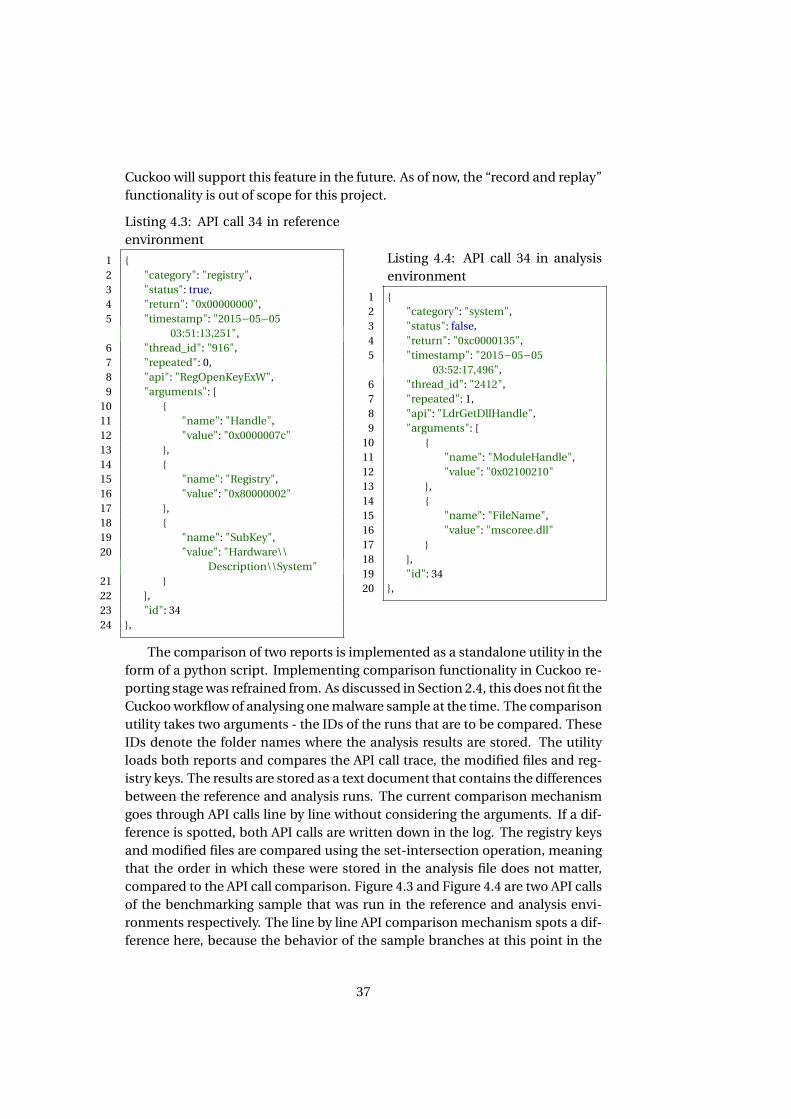
The comparison of two reports is implemented as a standalone utility in theform of a python script. Implementing comparison functionality in Cuckoo re-porting stage was refrained from. As discussed in Section 2.4, this does not fit theCuckoo workflow of analysing one malware sample at the time. The comparisonutility takes two arguments - the IDs of the runs that are to be compared. TheseIDs denote the folder names where the analysis results are stored. The utilityloads both reports and compares the API call trace, the modified files and reg-istry keys. The results are stored as a text document that contains the differencesbetween the reference and analysis runs. The current comparison mechanismgoes through API calls line by line without considering the arguments. If a dif-ference is spotted, both API calls are written down in the log. The registry keysand modified files are compared using the set-intersection operation, meaningthat the order in which these were stored in the analysis file does not matter,compared to the API call comparison. Figure 4.3 and Figure 4.4 are two API callsof the benchmarking sample that was run in the reference and analysis envi-ronments respectively. The line by line API comparison mechanism spots a dif-ference here, because the behavior of the sample branches at this point in the
37
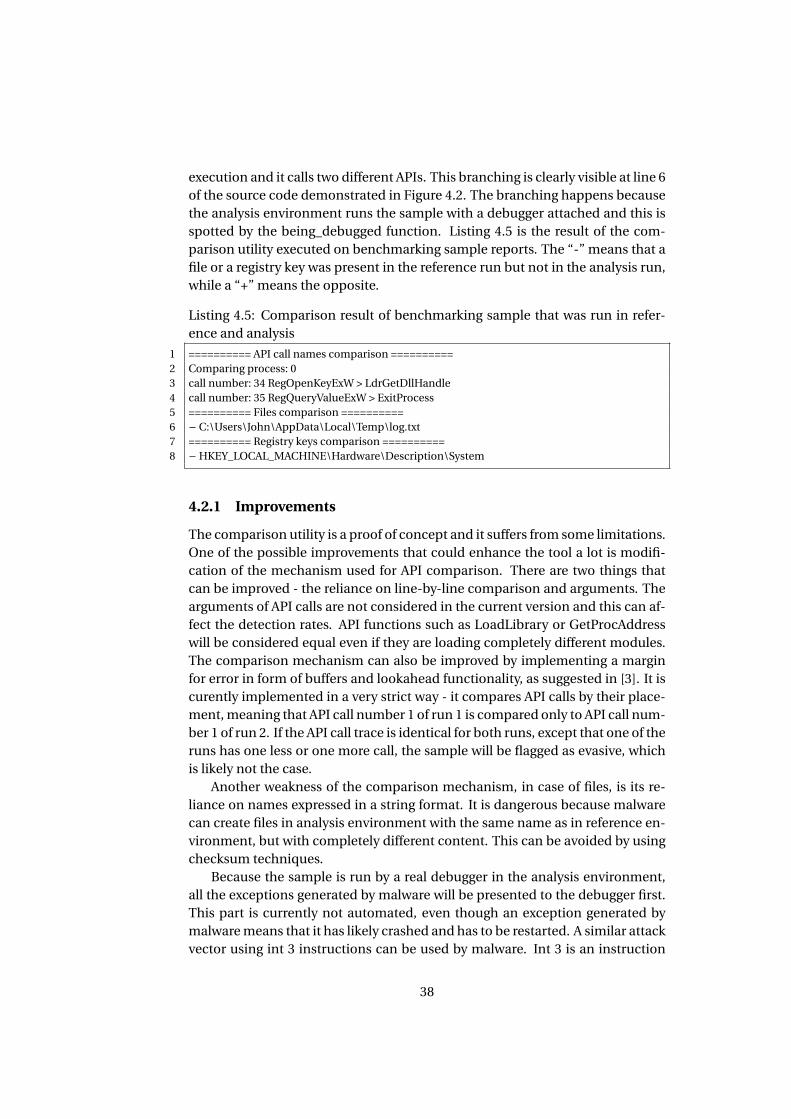
execution and it calls two different APIs. This branching is clearly visible at line 6of the source code demonstrated in Figure 4.2. The branching happens becausethe analysis environment runs the sample with a debugger attached and this isspotted by the being_debugged function. Listing 4.5 is the result of the com-parison utility executed on benchmarking sample reports. The “-” means that afile or a registry key was present in the reference run but not in the analysis run,while a “+” means the opposite.
Listing 4.5: Comparison result of benchmarking sample that was run in refer-ence and analysis
1 ========== API call names comparison ==========2 Comparing process: 03 call number: 34 RegOpenKeyExW > LdrGetDllHandle4 call number: 35 RegQueryValueExW > ExitProcess5 ========== Files comparison ==========6 − C:\Users\John\AppData\Local\Temp\log.txt7 ========== Registry keys comparison ==========8 − HKEY_LOCAL_MACHINE\Hardware\Description\System
4.2.1 Improvements
The comparison utility is a proof of concept and it suffers from some limitations.One of the possible improvements that could enhance the tool a lot is modifi-cation of the mechanism used for API comparison. There are two things thatcan be improved - the reliance on line-by-line comparison and arguments. Thearguments of API calls are not considered in the current version and this can af-fect the detection rates. API functions such as LoadLibrary or GetProcAddresswill be considered equal even if they are loading completely different modules.The comparison mechanism can also be improved by implementing a marginfor error in form of buffers and lookahead functionality, as suggested in [3]. It iscurently implemented in a very strict way - it compares API calls by their place-ment, meaning that API call number 1 of run 1 is compared only to API call num-ber 1 of run 2. If the API call trace is identical for both runs, except that one of theruns has one less or one more call, the sample will be flagged as evasive, whichis likely not the case.
Another weakness of the comparison mechanism, in case of files, is its re-liance on names expressed in a string format. It is dangerous because malwarecan create files in analysis environment with the same name as in reference en-vironment, but with completely different content. This can be avoided by usingchecksum techniques.
Because the sample is run by a real debugger in the analysis environment,all the exceptions generated by malware will be presented to the debugger first.This part is currently not automated, even though an exception generated bymalware means that it has likely crashed and has to be restarted. A similar attackvector using int 3 instructions can be used by malware. Int 3 is an instruction
38
used by debuggers to generate software breakpoints. Malware can insert theseinstructions on purpose to slow down and confuse researchers doing manualanalysis, but it will also stop the current system because skipping the breakpointinstructions is not yet automated.
39

40
Chapter 5
Conclusion
Arms race is the current state of computer security field and more malware arebecomming “armored” with anti-tampering techniques, such as debugger de-tection. The goal of this project was to improve Cuckoo, one of the current opensource sandbox analysis environments in active development, to be able to de-tect samples employing anti-debugging techniques. Two possible approachesto this problem were researched - instruction tracing and differential analysis.
Instruction tracing is based on CPU’s debug facilities to log all the instruc-tions executed by malware. This is a very fine grained analysis at low abstractionlevel. If this technique is implemented in a more stealthy fashion, using HVM, itbecomes very expensive as every instruction executed by malware results in sev-eral context switches in CPU. It also requires a new analysis component whichis capable of detecting whether the executed code was evasive or not. This solu-tion is very complex as it would require modification of VMM code as well as thesource code of Cuckoo. Differential analysis was chosen as an alternative. It re-quires execution of malware in two environments - reference and analysis. Theanalysis environment is modified to include traces of a debugger. After malwarehas been executed in both environments, the analysis reports are compared anda sample is declared evasive if there is a difference. This approach is cheaperthan instruction tracing. It requires a comparison component in order to de-termine if the sample is evasive. This approach also captures all the detectionmethods, even 0-day exploits, but it is not possible to examine them in full detaillike it could have been if an instruction trace was present.
An implementation that relies on Cuckoo customizable structure was cre-ated. An analysis package is used to attach a real debugger to the malware .exefile in the analysis environment. A utility tool that compares the results of tworuns, one in reference and one in analysis environments, is implemented inpython. The comparison mechanism is basic as it only considers API names,registry keys and files. The comparison of API calls can be further improved ifarguments are considered and if the comparison is done in a more flexible waywith lookahead functionality.
41

42
Bibliography
[1] Keith Adams and Ole Agesen. A comparison of software and hardware tech-niques for x86 virtualization. ACM Sigplan Notices, 41(11):2–13, 2006.
[2] Hertzsprung at English Wikipedia. Privilege rings. http://upload.wikimedia.org/wikipedia/commons/2/2f/Priv_rings.svg. Retrieved10.05.2015.
[3] Davide Balzarotti, Marco Cova, Christoph Karlberger, Engin Kirda, Christo-pher Kruegel, and Giovanni Vigna. Efficient detection of split personalitiesin malware. In NDSS, 2010.
[4] Ulrich Bayer, Paolo Milani Comparetti, Clemens Hlauschek, ChristopherKruegel, and Engin Kirda. Scalable, behavior-based malware clustering. InNDSS, volume 9, pages 8–11. Citeseer, 2009.
[5] Jurriaan Bremer and Thorsten Sick. Vmcloak. http://vmcloak.org/. Re-trieved 10.05.2015.
[6] Xu Chen, Jonathon Andersen, Zhuoqing Morley Mao, Michael Bailey, andJose Nazario. Towards an understanding of anti-virtualization and anti-debugging behavior in modern malware. In Dependable Systems and Net-works With FTCS and DCC, 2008. DSN 2008. IEEE International Conferenceon, pages 177–186. IEEE, 2008.
[7] Zhui Deng, Xiangyu Zhang, and Dongyan Xu. Spider: Stealthy binary pro-gram instrumentation and debugging via hardware virtualization. In Pro-ceedings of the 29th Annual Computer Security Applications Conference,pages 289–298. ACM, 2013.
[8] Artem Dinaburg, Paul Royal, Monirul Sharif, and Wenke Lee. Ether: mal-ware analysis via hardware virtualization extensions. In Proceedings of the15th ACM conference on Computer and communications security, pages 51–62. ACM, 2008.
[9] Manuel Egele, Theodoor Scholte, Engin Kirda, and Christopher Kruegel.A survey on automated dynamic malware-analysis techniques and tools.ACM Computing Surveys (CSUR), 44(2):6, 2012.
43
[10] Peter Ferrie. The ultimate anti-debugging reference. 2011.
[11] Tal Garfinkel, Keith Adams, Andrew Warfield, and Jason Franklin. Compat-ibility is not transparency: Vmm detection myths and realities. In HotOS,2007.
[12] Gideon Gerzon. Intel virtualization technology processor vir-tualization extensions and intel trusted execution technology.https://software.intel.com/sites/default/files/m/0/2/1/b/b/1024-Virtualization.pdf.
[13] Claudio Guarnieri, Jurriaan Bremer, and Mark Schloesser. Mo malwaremo problems - cuckoo sandbox. https://media.blackhat.com/us-13/US-13-Bremer-Mo-Malware-Mo-Problems-Cuckoo-Sandbox-Slides.pdf, . Retrieved 10.05.2015.
[14] Claudio Guarnieri, Allessandro Tanasi, Jurriaan Bremer, and MarkSchloesser. Cuckoo sandbox. http://www.cuckoosandbox.org, . Re-trieved 10.05.2015.
[15] Sergey Gurkin. A study of virtualization detection methods in modern mal-ware. Technical report, Aalborg University, December 2014.
[16] Red Hat. Libvirt. http://libvirt.org. Retrieved 10.05.2015.
[17] Thomas Hungeberg and Matthias Eckert. Inetsim. http://www.inetsim.org/. Retrieved 10.05.2015.
[18] Intel. Intel virtualization technology. http://www.intel.com/content/www/us/en/virtualization/virtualization-technology/intel-virtualization-technology.html. Retrieved 10.05.2015.
[19] Intel© 64 and IA-32 Architectures Software Developer’s Manual. Intel©, 12015. Volume 1,2,3.
[20] Dhilung Kirat, Giovanni Vigna, and Christopher Kruegel. Barebox: efficientmalware analysis on bare-metal. In Proceedings of the 27th Annual Com-puter Security Applications Conference, pages 403–412. ACM, 2011.
[21] Tadayoshi Kohno, Andre Broido, and Kimberly C Claffy. Remote physicaldevice fingerprinting. Dependable and Secure Computing, IEEE Transac-tions on, 2(2):93–108, 2005.
[22] Christian Kreibich, Nicholas Weaver, Chris Kanich, Weidong Cui, and VernPaxson. Gq: Practical containment for measuring modern malware sys-tems. In Proceedings of the 2011 ACM SIGCOMM conference on Internetmeasurement conference, pages 397–412. ACM, 2011.
44
[23] Microsoft. Debugging reference. https://msdn.microsoft.com/en-us/library/ms679304%28v=vs.85%29.aspx, . Retrieved 10.05.2015.
[24] Microsoft. Local kernel-mode debugging. https://msdn.microsoft.com/en-us/library/windows/hardware/ff553382%28v=vs.85%29.aspx, . Retrieved 10.05.2015.
[25] Microsoft. Peb structure. https://msdn.microsoft.com/en-us/library/windows/desktop/aa813706%28v=vs.85%29.aspx, . Retrieved10.5.2015.
[26] Andreas Moser, Christopher Kruegel, and Engin Kirda. Limits of static anal-ysis for malware detection. In Computer security applications conference,2007. ACSAC 2007. Twenty-third annual, pages 421–430. IEEE, 2007.
[27] Colin Peters. Minimalist gnu for windows. http://www.mingw.org/. Re-trieved 28.05.2015.
[28] Gerald J Popek and Robert P Goldberg. Formal requirements for virtual-izable third generation architectures. Communications of the ACM, 17(7):412–421, 1974.
[29] Honeynet Project. Know your enemy: Gen2 honeynets. http://old.honeynet.org/papers/gen2/. Retrieved 10.05.2015.
[30] Athina Provataki and Vasilios Katos. Differential malware forensics. DigitalInvestigation, 10(4):311–322, 2013.
[31] Thomas Raffetseder, Christopher Kruegel, and Engin Kirda. Detecting sys-tem emulators. In Information Security, pages 1–18. Springer, 2007.
[32] Jamie Riden. How fast-flux service networks work. http://www.honeynet.org/node/132. Retrieved 10.05.2015.
[33] J-Michael Roberts. Virusshare. http://virusshare.com/. Retrieved28.05.2015.
[34] John S Robin and Cynthia E Irvine. Analysis of the intel pentium’s ability tosupport a secure virtual machine monitor. Technical report, DTIC Docu-ment, 2000.
[35] Michael Sikorski and Adrew Honig. Fakenet. http://practicalmalwareanalysis.com/fakenet/. Retrieved 10.05.2015.
[36] Michael Sikorski and Andrew Honig. Practical Malware Analysis. No StarchPress, 1 edition, 2012. ISBN 1593272901.
[37] Symantec. Zeroaccess rootkit. http://www.symantec.com/security_response/writeup.jsp?docid=2011-071314-0410-99. Retrieved10.05.2015.
45
[38] Amit Vasudevan and Ramesh Yerraballi. Stealth breakpoints. In Computersecurity applications conference, 21st Annual, pages 10–pp. IEEE, 2005.
[39] VMware. Vmware backdoor io port. http://kb.vmware.com/selfservice/microsites/search.do?language=en_US&cmd=displayKC&externalId=1009458. Retrieved 20.12.2014.
[40] Xenproject. Xen. http://www.xenproject.org. Retrieved 10.05.2015.
46