Embed Size (px)
Citation preview
2 September 2015
Developer Satisfaction Survey 2015 Summary Report
© 2015, International Game Developers Association | igda.org
Developer Satisfaction Survey 2015 - Summary Report
1 | P a g e
Authors Johanna Weststar Assistant Professor, Department of Management and Organizational Studies Western University, Ontario, Canada Marie-Josée Legault Professor, École des sciences de l'administration TÉLUQ, Québec, Canada
Acknowledgements The International Game Developers Association (IGDA) would like to thank the tremendous support of their actively engaged volunteer community for their many contributions to this report. From all the survey respondents to the many Chapter and Special Interest Group leaders who helped disseminate the survey, as well as studio affiliates and media partners – the IGDA appreciates your help in making this research possible.
The authors would like to thank Maria Andrei-Gedja, Indranil Chakraborty and Alyssa MacDougall for their research assistance.
Developer Satisfaction Survey 2015 - Summary Report
2 | P a g e
Contents
Authors ......................................................................................................................................................... 1
Acknowledgements ..................................................................................................................................... 1
Introduction ................................................................................................................................................. 5
Overview ...................................................................................................................................................... 6
Demographics ............................................................................................................................................. 8
Snapshot: Age ......................................................................................................................................... 8
Snapshot: Country of Origin ................................................................................................................. 8
Snapshot: Country of Work ................................................................................................................... 8
Snapshot: Marital Status ....................................................................................................................... 8
Snapshot: Children ................................................................................................................................. 8
Snapshot: Elderly Care........................................................................................................................... 8
Snapshot: Educational Background ................................................................................................... 10
Snapshot: Specialized Degree in a Game Related Discipline ......................................................... 10
Diversity ..................................................................................................................................................... 11
Snapshot: Gender ................................................................................................................................. 11
Snapshot: Race/Ethnicity ..................................................................................................................... 11
Snapshot: Sexual Orientation ............................................................................................................. 11
Snapshot: Disability .............................................................................................................................. 11
Snapshot: Attitudes toward Diversity ................................................................................................ 12
Snapshot: Discrimination ..................................................................................................................... 12
Trends and Outlook on the Game Industry .......................................................................................... 14
Snapshot: Game Genres ...................................................................................................................... 14
Snapshot: Important Platforms for the Future ................................................................................. 14
Snapshot: Important Distribution Platforms ..................................................................................... 15
Developer Satisfaction Survey 2015 - Summary Report
3 | P a g e
Snapshot: Preferred Employers .......................................................................................................... 15
Snapshot: The Future of Game Development .................................................................................. 16
Snapshot: Localized Versions of Games ............................................................................................ 17
Snapshot: Society’s Negative Perceptions of Industry .................................................................... 17
Employment Overview ............................................................................................................................. 18
Snapshot: Employment Status ........................................................................................................... 18
Snapshot: Games as Primary Business ............................................................................................. 18
Snapshot: Employment Volatility ........................................................................................................ 18
Snapshot: The Unemployed ................................................................................................................ 18
A Profile of Employees ............................................................................................................................. 19
Snapshot: Demographics ..................................................................................................................... 19
Snapshot: Experience and Job Security ............................................................................................ 19
Snapshot: Company Type ................................................................................................................... 19
Snapshot: Job Role ............................................................................................................................... 19
Snapshot: Company and Team Size .................................................................................................. 20
Snapshot: Salaries ................................................................................................................................ 20
Snapshot: Incentives and Overtime ................................................................................................... 20
Snapshot: Benefits and Time Off ....................................................................................................... 20
Snapshot: Hours of Work .................................................................................................................... 21
Snapshot: Career Path and Advancement ........................................................................................ 21
A Profile of Freelancers/Contractors ...................................................................................................... 22
Snapshot: Demographics ..................................................................................................................... 22
Snapshot: Experience and Job Security ............................................................................................ 22
Snapshot: Company Type ................................................................................................................... 22
Snapshot: Job Role ............................................................................................................................... 22
Developer Satisfaction Survey 2015 - Summary Report
4 | P a g e
Snapshot: Company Size and Composition ...................................................................................... 22
Snapshot: Salaries ................................................................................................................................ 23
Snapshot: Incentives and Overtime ................................................................................................... 23
Snapshot: Benefits and Time Off ....................................................................................................... 23
IP and Credit ......................................................................................................................................... 23
Hours of work ........................................................................................................................................ 23
Snapshot: Why Freelance? .................................................................................................................. 24
A Profile of the Self-Employed ................................................................................................................ 25
Snapshot: Demographics ..................................................................................................................... 25
Snapshot: Experience and Job Security ............................................................................................ 25
Snapshot: Company Type ................................................................................................................... 25
Snapshot: Job Role ............................................................................................................................... 25
Snapshot: Company Size and Composition ...................................................................................... 25
Snapshot: Compensation ..................................................................................................................... 26
Snapshot: Incentives and Overtime for Employees ........................................................................ 26
Snapshot: Benefits and Time Off ....................................................................................................... 26
Snapshot: Benefits and Time Off for Employees ............................................................................. 26
Hours of Work ....................................................................................................................................... 27
Student Profile ........................................................................................................................................... 28
Snapshot: Desired Job ......................................................................................................................... 28
Snapshot: Desired Company ............................................................................................................... 28
Snapshot: Priorities in a Job ............................................................................................................... 28
Snapshot: Finding a Job ...................................................................................................................... 29
Conclusions and Next Steps .................................................................................................................... 30
Endnotes ..................................................................................................................................................... 33
Developer Satisfaction Survey 2015 - Summary Report
5 | P a g e
Introduction As the largest professional association for game developers worldwide, the International Game Developers Association has been in a unique position to know and understand individual game developers on a level that most companies and organizations cannot. While we’ve always had a very good pulse on how developers anecdotally feel about their work and their industry, we haven’t always been consistent in capturing and conveying that insight.
To that end, we launched this annual research survey called the Developer Satisfaction Survey (DSS) in 2014. The Developer Satisfaction Survey, open to anyone involved in the video game industry in a professional or academic capacity, is the evolution of our previous survey efforts.
The 2014 DSS was a great success for an inaugural effort, yielding over 2,000 responses worldwide. Besides my own presentations of the results at numerous events worldwide, the data from the DSS was quoted in many media sources, including the New York Times and Washington Post, and referenced by many in the academic research community. The effort also resulted in two follow-up reports on Industry Trends and Employment, both of which dove deeper into the data and revealed more insights about the current state of our industry. The results also provided an impetus for new initiatives, such as the IGDA’s declared goal to double the number of women working in the industry by 2025.
For the 2015 DSS, we aimed to expand our reach and succeeded with nearly 3,000 respondents. Part of this success was due to the availability of localized versions of the DSS in the following languages beyond English: Chinese, French, German, Italian, Japanese, and Spanish. The IGDA thanks Keyword’s International as well as volunteers from IGDA Japan for their valuable contribution of the localized language versions.
Also for 2015, the DSS offered was a shorter survey as it did not contain detailed questions about Quality of Life, as these will only appear every fifth year. The survey was also tailored so that questions better reflect unique sub-populations of the broad game industry community.
We’re thankful for the strongly positive reception for this research and moving forward, the DSS will serve as the IGDA’s core method by which we inform ourselves and the industry about the critical questions around developers’ satisfaction. For the sake of the long-term health of our industry, we will continue to strive to discern the demographic composition of game developers worldwide and tap into their knowledge, experiences and opinions on their well-being and on the state of the industry.
Thank you,
Kate Edwards, Executive Director International Game Developers Association (IGDA)
Developer Satisfaction Survey 2015 - Summary Report
6 | P a g e
Overview
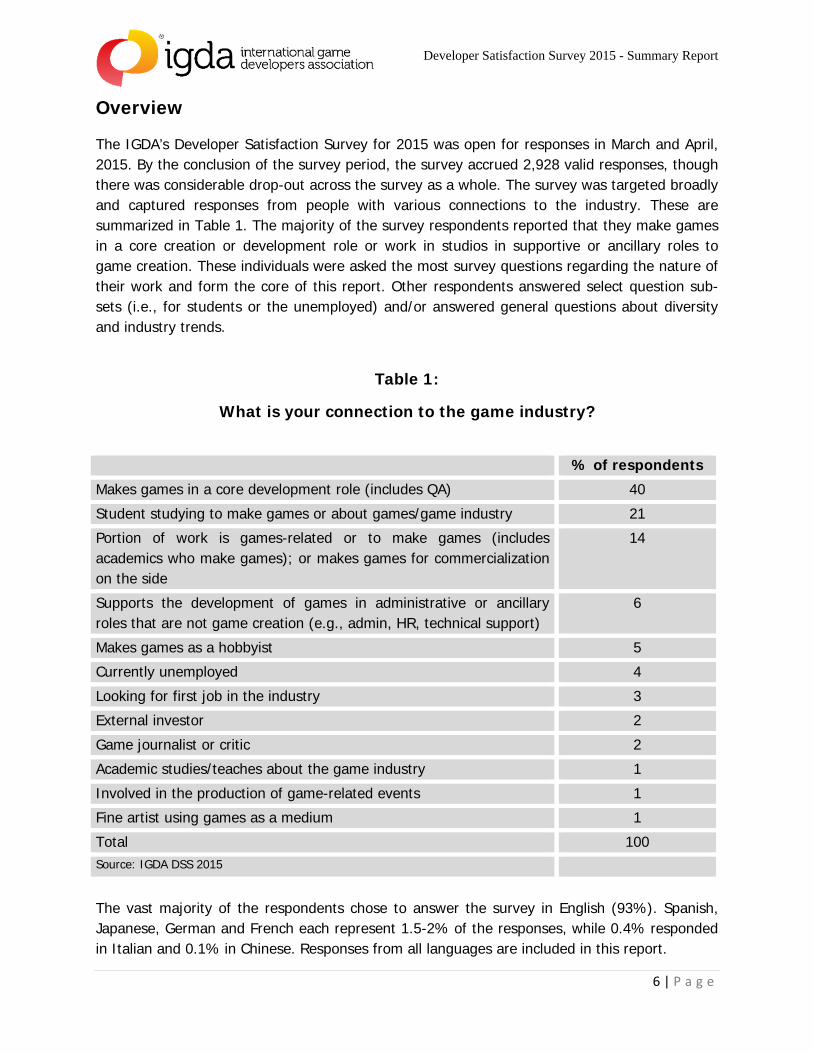
The IGDA’s Developer Satisfaction Survey for 2015 was open for responses in March and April, 2015. By the conclusion of the survey period, the survey accrued 2,928 valid responses, though there was considerable drop-out across the survey as a whole. The survey was targeted broadly and captured responses from people with various connections to the industry. These are summarized in Table 1. The majority of the survey respondents reported that they make games in a core creation or development role or work in studios in supportive or ancillary roles to game creation. These individuals were asked the most survey questions regarding the nature of their work and form the core of this report. Other respondents answered select question sub-sets (i.e., for students or the unemployed) and/or answered general questions about diversity and industry trends.
Table 1:
What is your connection to the game industry?
% of respondents
Makes games in a core development role (includes QA) 40
Student studying to make games or about games/game industry 21
Portion of work is games-related or to make games (includes academics who make games); or makes games for commercialization on the side
14
Supports the development of games in administrative or ancillary roles that are not game creation (e.g., admin, HR, technical support)
6
Makes games as a hobbyist 5
Currently unemployed 4
Looking for first job in the industry 3
External investor 2
Game journalist or critic 2
Academic studies/teaches about the game industry 1
Involved in the production of game-related events 1
Fine artist using games as a medium 1
Total 100 Source: IGDA DSS 2015
The vast majority of the respondents chose to answer the survey in English (93%). Spanish, Japanese, German and French each represent 1.5-2% of the responses, while 0.4% responded in Italian and 0.1% in Chinese. Responses from all languages are included in this report.
Developer Satisfaction Survey 2015 - Summary Report
7 | P a g e
This report is a summary of the primary observations from the survey data and, outside of a few select occasions, does not attempt to compare this data to prior surveys. Such detail will come in subsequent reports. The first part of the report includes sections answered by all respondents: Demographics, Diversity, Education, and Business Trends and Future Outlook. The second part of the report paints a profile of the work experiences of particular groups of workers (employees, freelancers and the self-employed) as well as the currently unemployed and students.
The conclusion includes the identification of key challenges for the industry as well as an overview of plans for releasing more detailed reports on each of these topics in subsequent months.
Developer Satisfaction Survey 2015 - Summary Report
8 | P a g e
Demographics This data presents the prototypical game industry worker/developer as being a 32 year old white male with a university degree who lives in North America and has no children. Some of the demographic characteristics are discussed in the diversity section that follows.
Snapshot: Age Survey respondents ranged in age from 16 to 81. However, the majority of respondents were in the 25-29 year range making up 26% of the sample. The next largest age group was 30-34 which represented 25% of survey respondents. The third largest age group was made up of 35-39 year olds at 16%.
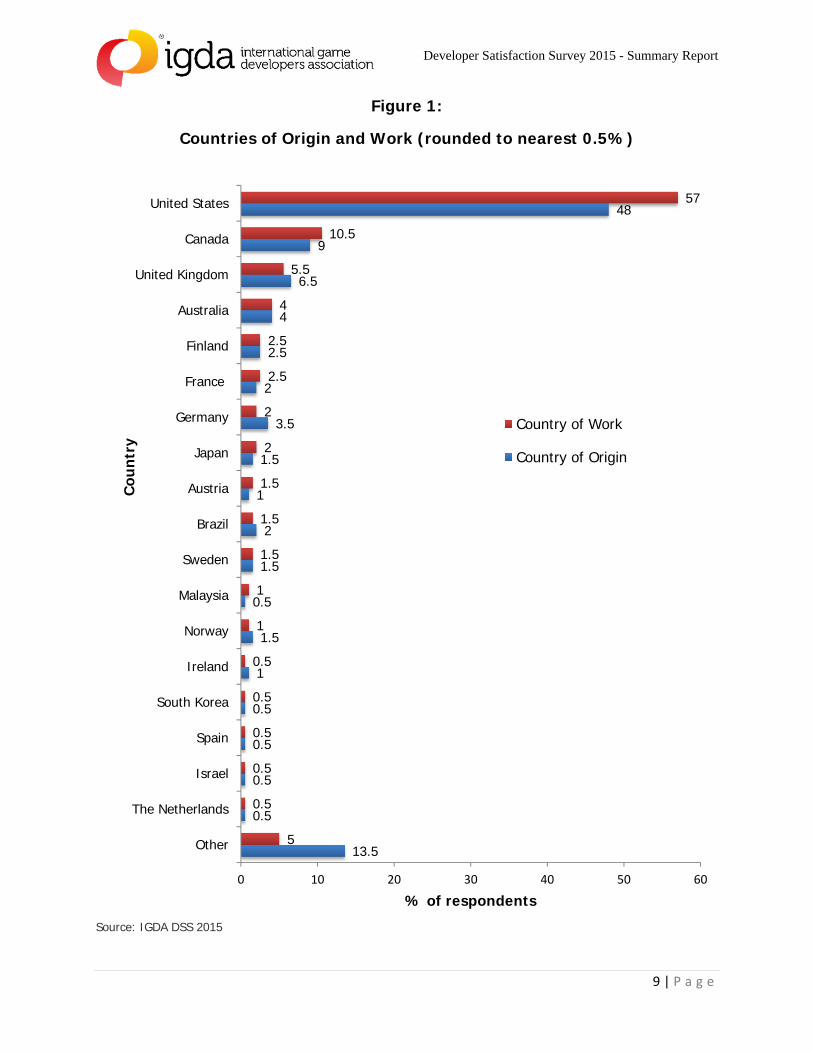
Snapshot: Country of Origin As seen in Figure 1 below, the majority of respondents were from the United States and made up a total of 49% of the sample. Canada was second with 9% and with Mexico (0.4%) they bring the overall North American representation to 58%. Europe represented 24% of survey respondents, Latin America made up 5% and Asia represented 7%. Most respondents are native born to the country where they reside (86%) while the remaining 14% consider themselves to be immigrants.
Snapshot: Country of Work The majority of respondents to this survey continue to be people working in the United States (57%) followed distantly by those working in Canada (10%) and the United Kingdom (5%). Country of work is shown alongside country of origin in Figure 1. In comparing these two numbers it should be noted that not all respondents answered each question (either it was not asked or it was skipped), so while this is a rough approximation of whether people work where they were born, it is not an exact match.
Snapshot: Marital Status Marital status reflects an even split between either single or married/partnered; 46% are single and 45% are married/partnered. Another 3% selected separated/divorced, 5% declined to answer and the while the remaining 1% responded ‘Other’.
Snapshot: Children Not surprisingly given the young age of the sample, 78% of the survey respondents do not have children. Of the 22% of respondents that do have children, 9% have pre-school children while 12% have children attending school and 4% have grown children.
Snapshot: Elderly Care Again as expected given the age of the sample, 83% are not responsible for elder care. There is however a group of 11% that is responsible for their older family members who either live with them or live separately.
Developer Satisfaction Survey 2015 - Summary Report
9 | P a g e
Figure 1:
Countries of Origin and Work (rounded to nearest 0.5%)
Source: IGDA DSS 2015
13.5
0.5
0.5
0.5
0.5
1
1.5
0.5
1.5
2
1
1.5
3.5
2
2.5
4
6.5
9
48
5
0.5
0.5
0.5
0.5
0.5
1
1
1.5
1.5
1.5
2
2
2.5
2.5
4
5.5
10.5
57
Other
The Netherlands
Israel
Spain
South Korea
Ireland
Norway
Malaysia
Sweden
Brazil
Austria
Japan
Germany
France
Finland
Australia
United Kingdom
Canada
United States
0 10 20 30 40 50 60
Cou
ntry
% of respondents
Country of Work
Country of Origin
Developer Satisfaction Survey 2015 - Summary Report
10 | P a g e
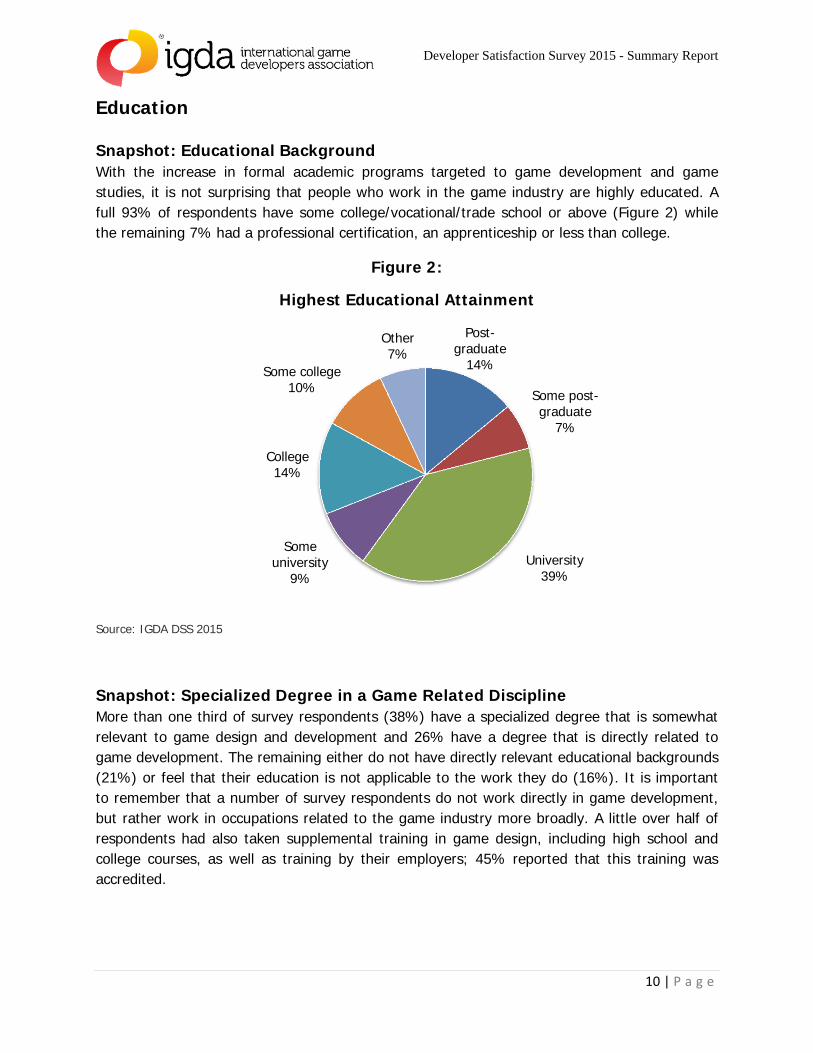
Education Snapshot: Educational Background With the increase in formal academic programs targeted to game development and game studies, it is not surprising that people who work in the game industry are highly educated. A full 93% of respondents have some college/vocational/trade school or above (Figure 2) while the remaining 7% had a professional certification, an apprenticeship or less than college.
Figure 2:
Highest Educational Attainment
Source: IGDA DSS 2015
Snapshot: Specialized Degree in a Game Related Discipline More than one third of survey respondents (38%) have a specialized degree that is somewhat relevant to game design and development and 26% have a degree that is directly related to game development. The remaining either do not have directly relevant educational backgrounds (21%) or feel that their education is not applicable to the work they do (16%). It is important to remember that a number of survey respondents do not work directly in game development, but rather work in occupations related to the game industry more broadly. A little over half of respondents had also taken supplemental training in game design, including high school and college courses, as well as training by their employers; 45% reported that this training was accredited.
Post-graduate
14%
Some post-graduate
7%
University39%
Some university
9%
College14%
Some college10%
Other7%
Developer Satisfaction Survey 2015 - Summary Report
11 | P a g e
Diversity Snapshot: Gender Survey respondents remain predominately male (75%). Only 22% identified as female, just over 1% identified as male-to-female transgender and 0.2% identified as female-to-male transgender. An additional 1% selected “other” as their response, where 9 people specified their identification as “non-binary.” This is in stark contrast to the 2012 gender distribution in the United States Census where 49% were male and 51% were femalei. The 2012 US Census did not include options beyond male and female, however other studies estimate that 0.3% of adults in the US are transgenderii.
Snapshot: Race/Ethnicity In terms of race/ethnicity, the overwhelming majority identified as white/Caucasian/European at 76%. Respondents were able to select up to 3 options for this question. When respondents who only selected white/Caucasian/European are included this number drops to 67%. The next most frequently selected category was East Asian (9%), followed by Hispanic/Latino (7.3%). People who identified as black/African/African American constituted 3% of respondents. This is only somewhat consistent with U.S. Census data from 2013 which reported that 78% of the population is white, not including those who identify as Hispanic or Latino. When those who identify as Hispanic or Latino are removed from the white category this figure drops to 63%. However the 2013 U.S. Census reported that 13% are black or African American and 17% identify as having Hispanic or Latino originsiii.
Snapshot: Sexual Orientation Regarding sexual orientation, 73% of respondents identified as heterosexual, 4% as homosexual, 12% as bisexual and 2% selected “other.” Those that provided additional detail to the ‘other’ category identified themselves as asexual, pansexual or used this option to decline answering the question as they felt it to be too personal and not relevant to the survey and their work. These numbers are slightly different than reported 2013 statistics for the United States where 97% of adults identified as heterosexual, 2% as gay or lesbian and 1% as bisexualiv.
Snapshot: Disability This year, 22% of respondents identified as having a disability; 6% declined to respond and 2% said they did not know. This is in line with statistics for the populations of the countries primarily represented in this survey. Among those who reported one or more disabilities, the largest disability listed was psychiatric and mental illness, which represented 9% of respondents. The next largest disability category was for visual impairment and represented 6%. The third most listed disability was physical in nature, with 4% of respondents identifying this way. This is in line with reported 2010 statistics for the population of the United States where 19% reported having a disability, broadly definedv.
Developer Satisfaction Survey 2015 - Summary Report
12 | P a g e
Snapshot: Attitudes toward Diversity The number of respondents who feel that diversity is very or somewhat important in the workplace has decreased from 75% in 2014 to 63% in 2015. Similarly, while 79% felt that diversity was important for the industry last yearvi, only 66% responded this way in 2015. A little over a third of developers surveyed (37%) felt the game industry had increased in diversity over the past two years, while 31% said it was the same, and 2% said it was less diverse. However, 30% said they were not sure or that the question was not applicable to them. Diversity in game content is important as well: 71% of respondents indicated this was either somewhat or very important to the game industry.
Snapshot: Discrimination A general non-discrimination policy exists in 58% of companies, but only 29% have a formal complaint procedure and 24% have a formal disciplinary procedure. Almost one-quarter of respondents (22%) did not know whether any kind of diversity policy existed at their company or not. However, over half of respondents (53%) indicated that policies that were in place were enforced – this is an improvement over last year, where only one-third responded affirmatively to a question about enforcement of policies.
In response to the question, “Do you feel there is equal treatment and opportunity for all in the game industry?” 49% of respondents answered “no.” Over a third of respondents (39%) responded “yes,” and 12.5% answer that they did not know.
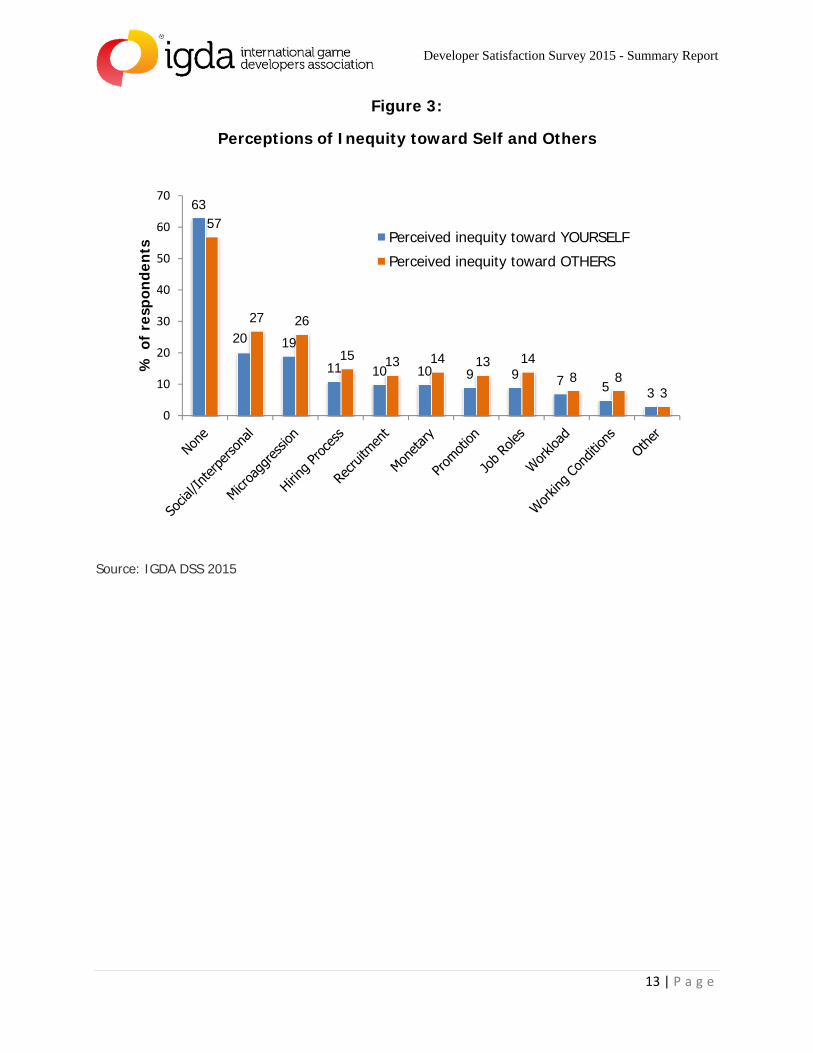
Figure 3 shows the responses to the question, “Have you perceived inequity towards yourself or towards others on the basis of gender, age, ethnicity, ability, or sexual persuasion in any of the following areas?” The majority of respondents (63% and 58%, respectively) answered “None” to both questions. However, over a quarter of respondents indicated that they had observed interpersonal inequity toward others and 20% reported having been a victim of this type of discrimination themselves. Similarly, over a quarter of respondents indicated that they had perceived micro-aggressions toward others.
Developer Satisfaction Survey 2015 - Summary Report
13 | P a g e
Figure 3:
Perceptions of Inequity toward Self and Others
Source: IGDA DSS 2015
63
20 19
11 10 10 9 9 7 5 3
57
27 26
15 13 14 13 148 8
3
0
10
20
30
40
50
60
70
% o
f re
spon
dent
s Perceived inequity toward YOURSELF
Perceived inequity toward OTHERS
Developer Satisfaction Survey 2015 - Summary Report
14 | P a g e
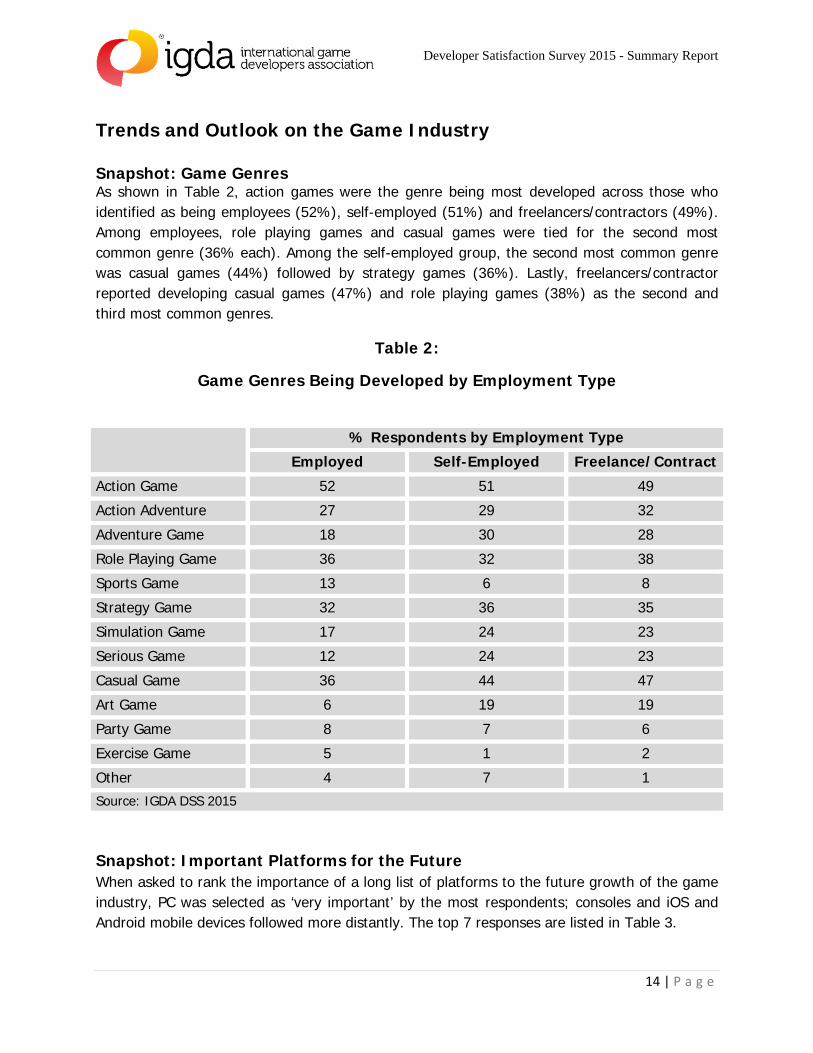
Trends and Outlook on the Game Industry Snapshot: Game Genres As shown in Table 2, action games were the genre being most developed across those who identified as being employees (52%), self-employed (51%) and freelancers/contractors (49%). Among employees, role playing games and casual games were tied for the second most common genre (36% each). Among the self-employed group, the second most common genre was casual games (44%) followed by strategy games (36%). Lastly, freelancers/contractor reported developing casual games (47%) and role playing games (38%) as the second and third most common genres.
Table 2:
Game Genres Being Developed by Employment Type
% Respondents by Employment Type
Employed Self-Employed Freelance/Contract
Action Game 52 51 49
Action Adventure 27 29 32
Adventure Game 18 30 28
Role Playing Game 36 32 38
Sports Game 13 6 8
Strategy Game 32 36 35
Simulation Game 17 24 23
Serious Game 12 24 23
Casual Game 36 44 47
Art Game 6 19 19
Party Game 8 7 6
Exercise Game 5 1 2
Other 4 7 1
Source: IGDA DSS 2015
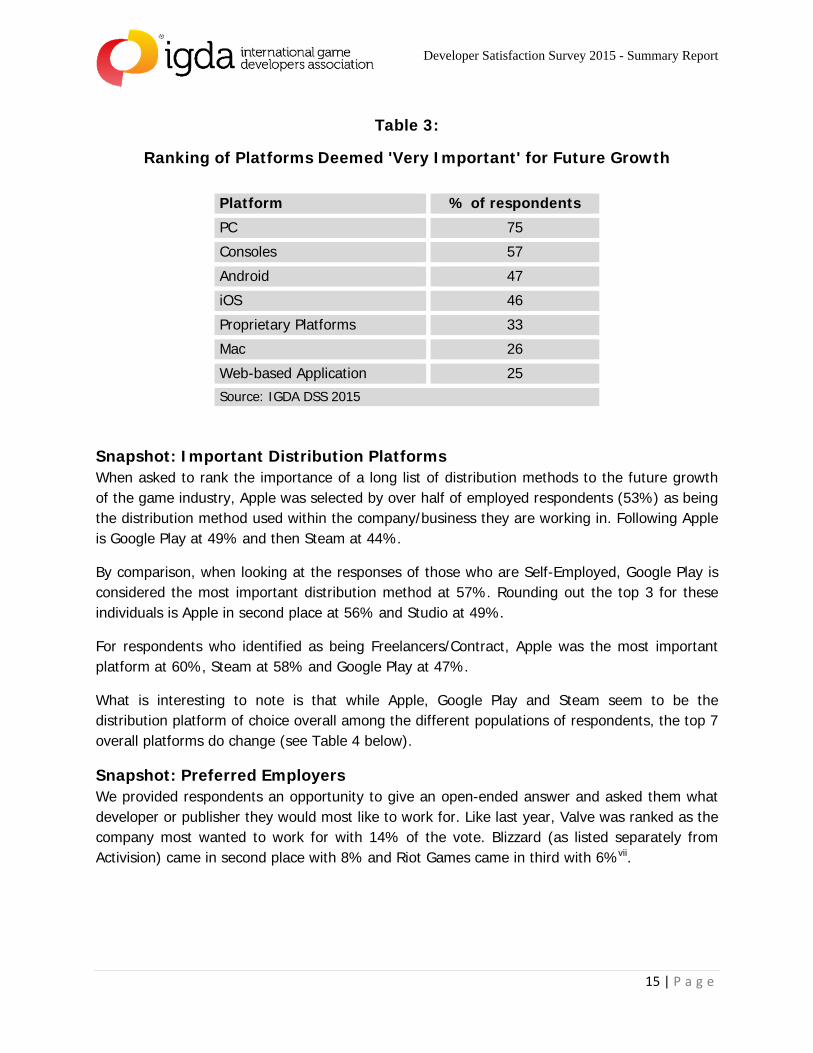
Snapshot: Important Platforms for the Future When asked to rank the importance of a long list of platforms to the future growth of the game industry, PC was selected as ‘very important’ by the most respondents; consoles and iOS and Android mobile devices followed more distantly. The top 7 responses are listed in Table 3.
Developer Satisfaction Survey 2015 - Summary Report
15 | P a g e
Table 3:
Ranking of Platforms Deemed 'Very Important' for Future Growth
Platform % of respondents
PC 75
Consoles 57
Android 47
iOS 46
Proprietary Platforms 33
Mac 26
Web-based Application 25
Source: IGDA DSS 2015
Snapshot: Important Distribution Platforms When asked to rank the importance of a long list of distribution methods to the future growth of the game industry, Apple was selected by over half of employed respondents (53%) as being the distribution method used within the company/business they are working in. Following Apple is Google Play at 49% and then Steam at 44%.
By comparison, when looking at the responses of those who are Self-Employed, Google Play is considered the most important distribution method at 57%. Rounding out the top 3 for these individuals is Apple in second place at 56% and Studio at 49%.
For respondents who identified as being Freelancers/Contract, Apple was the most important platform at 60%, Steam at 58% and Google Play at 47%.
What is interesting to note is that while Apple, Google Play and Steam seem to be the distribution platform of choice overall among the different populations of respondents, the top 7 overall platforms do change (see Table 4 below).
Snapshot: Preferred Employers We provided respondents an opportunity to give an open-ended answer and asked them what developer or publisher they would most like to work for. Like last year, Valve was ranked as the company most wanted to work for with 14% of the vote. Blizzard (as listed separately from Activision) came in second place with 8% and Riot Games came in third with 6%vii.
Developer Satisfaction Survey 2015 - Summary Report
16 | P a g e
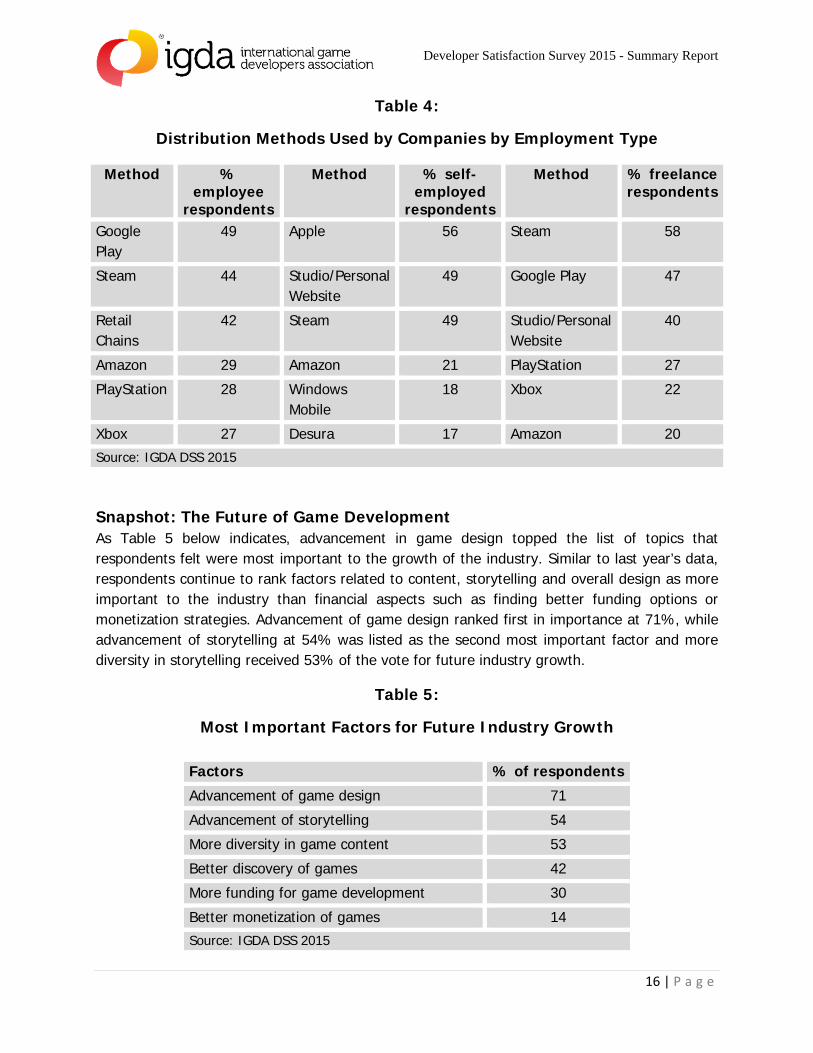
Table 4:
Distribution Methods Used by Companies by Employment Type
Method % employee
respondents
Method % self-employed
respondents
Method % freelance respondents
Google Play
49 Apple 56 Steam 58
Steam 44 Studio/Personal Website
49 Google Play 47
Retail Chains
42 Steam 49 Studio/Personal Website
40
Amazon 29 Amazon 21 PlayStation 27
PlayStation 28 Windows Mobile
18 Xbox 22
Xbox 27 Desura 17 Amazon 20
Source: IGDA DSS 2015
Snapshot: The Future of Game Development As Table 5 below indicates, advancement in game design topped the list of topics that respondents felt were most important to the growth of the industry. Similar to last year’s data, respondents continue to rank factors related to content, storytelling and overall design as more important to the industry than financial aspects such as finding better funding options or monetization strategies. Advancement of game design ranked first in importance at 71%, while advancement of storytelling at 54% was listed as the second most important factor and more diversity in storytelling received 53% of the vote for future industry growth.
Table 5:
Most Important Factors for Future Industry Growth
Factors % of respondents
Advancement of game design 71
Advancement of storytelling 54
More diversity in game content 53
Better discovery of games 42
More funding for game development 30
Better monetization of games 14
Source: IGDA DSS 2015
Developer Satisfaction Survey 2015 - Summary Report
17 | P a g e
Snapshot: Localized Versions of Games Though the numbers are lower than last year, the majority of respondents reported that having a localized version of a game is important to its success; 69.2% said it was either somewhat important (34.7%) or very important (34.5%).
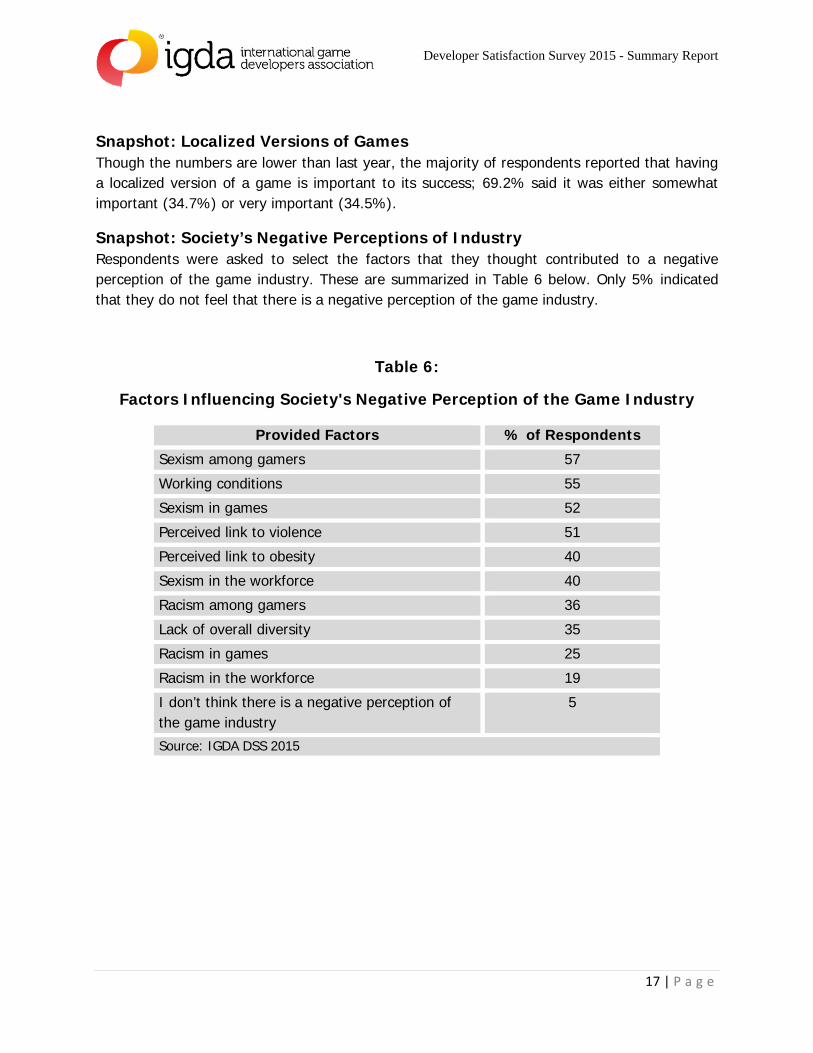
Snapshot: Society’s Negative Perceptions of Industry Respondents were asked to select the factors that they thought contributed to a negative perception of the game industry. These are summarized in Table 6 below. Only 5% indicated that they do not feel that there is a negative perception of the game industry.
Table 6:
Factors Influencing Society's Negative Perception of the Game Industry
Provided Factors % of Respondents
Sexism among gamers 57
Working conditions 55
Sexism in games 52
Perceived link to violence 51
Perceived link to obesity 40
Sexism in the workforce 40
Racism among gamers 36
Lack of overall diversity 35
Racism in games 25
Racism in the workforce 19
I don’t think there is a negative perception of the game industry
5
Source: IGDA DSS 2015
Developer Satisfaction Survey 2015 - Summary Report
18 | P a g e
Employment Overview Snapshot: Employment Status Of the respondents who were involved in making games for pay, the majority worked in the industry as permanent (65%) or temporary (4%) employees. A further 19% reported being self-employed and 12% reported that they were freelancers or independent contractors. The vast majority (85%) of this group worked in the industry on a full-time basis while the remainder worked part-time (15%). As the nature of their work is quite different, the sections that follow will provide an overview of the work experiences for each of these employment types: permanent and temporary employees, freelancers, and the self-employed.
Snapshot: Games as Primary Business The majority of these respondents worked at or operated companies wherein games and game-related products and services are the primary business. Almost 80% reported that games make up 100% of the work at their company and 11% reported that games made up at least half of the work.
Snapshot: Employment Volatility While 65% of respondents indicated being permanent employees, when asked about the number of employers they’ve had in the past 5 years, the response average is 2.7. Surprisingly, this is not so different from freelancers/contractors for whom the average is 4.6. This indicates that employees are often hired and let go while freelancers seem to maintain stable relationships with a core set of clients. The average is lowest among the self-employed (1.4) who were asked how many employers they have had in the past five years not counting themselves.
Snapshot: The Unemployed Just fewer than 5% of the survey sample (81 respondents) indicated that they were currently unemployed in the game industry. Among this unemployed group, 34% were laid off, 3% were fired, 15% ended a contract and had not found a new one, 8% quit and 2% retired.
The majority of this group had been unemployed in the industry for over a year (48%), 21% had been unemployed for 3-11 months and the remaining 31% had been unemployed for 2 months or less. Most wanted to find another job in the industry (76%) or they had a new job lined up, but had not yet started (6%).
Developer Satisfaction Survey 2015 - Summary Report
19 | P a g e
A Profile of Employees Snapshot: Demographics The average employee is between 27 and 34 years old (31%), white (83%) male (74%), and living in the United States (54%). He is heterosexual (80%) and is married or in a long term relationship (58%), but he has no children (71%). He has a university degree (47%), probably in computer science (23%).
Snapshot: Experience and Job Security The majority of employees in the industry are still either young or relatively inexperienced. Almost half of respondents (48%) indicated that they have between one and six years of experience and only 1% reported over 25 years of experience in the industry. An overwhelming majority of these respondents had been with their company for at least a year, 84% said that they had not been laid off in the past two years, and 69% reported that they had had one or two employers in the past five years. However, 25% have had three or four employers in the past five years and some churn is reflected in the intentions of employees to stay with their current employer. While almost a quarter indicated that they would stay indefinitely, plenty of respondents had plans to move within the next one to three years (25%) or within the next four to six years (18%).
Snapshot: Company Type The majority (67%) of the permanent and temporary employee respondents to this survey work in typical game development studios. The top three company types were as follows:
1) Developer who is not owned by or dependent on a single publisher and engages primarily in self-publishing (30%) – typically what is considered an independent studio;
2) A developer who is fully owned by a company that publishes games for one or more platforms, but who is not directly tied to a primary consumer product or game platform (22%) – a second-party developer; and
3) A developer who develops games under contract with one or more publishers for one or more platforms, but is not directly tied to a primary consumer product or game platform (15%) – a third-party developer.
Snapshot: Job Role Programming/software engineering was the most common jobs held by the employees in this sample with just over a quarter of respondents (26%) indicating that this is their primary role. This role is followed in rank by game designer (15%), producer or project manager (12%) and visual artist (10%).
Developer Satisfaction Survey 2015 - Summary Report
20 | P a g e
Snapshot: Company and Team Size Employees are most likely to work at relatively large companies: 26% work at companies with between 101 and 500 employees, and 27% work at companies with more than 500 people. Only 15% indicated that they work at a company with less than 10 people. Despite the large company size, many development teams are relatively small with 43% having between two and 10 members. However, 29% of respondents work on larger teams of between 11 and 50 people. Most only work on a few projects at a time, with 45% indicating they only work on one project at a time and another 46% indicating that they work on two to five projects at a time.
Snapshot: Salaries Given their status as permanent and temporary employees, it is not surprising that 88% report that more than 90% of their income is a result of the work they do in the game industry. Most employees (67%) make over $50,000.00 year, with the most common salary falling somewhere between $50,000.00 and $75,000.00 per year (20%).
Almost three quarters of employee respondents indicated that their company offers some type of raise as part of their compensation. Most often (37%) these raises are given based on a combination of factors including a fixed percentage allocation, a formula for merit, and the judgment of management, though for 22% of employee respondents this decision is based solely on the discretion of management. An additional 16% indicated that they do not get raises at all and another 10% were not sure.
Snapshot: Incentives and Overtime Incentives and bonus payments are a popular method of compensation, with 31% of respondents indicating that they receive lump sum payments and another 32% indicating that they receive company equity. However, a third of employees don’t receive incentives or bonus payments at all. When employees work beyond normal office hours, 36% receive no additional compensation. Of those who do, this additional compensation comes mostly in the form of various perks like meals (47% of respondents) or time off (27% of respondents).
Snapshot: Benefits and Time Off Most employees (72%) are provided with health coverage by their employer, but fewer employers provide for life insurance (48%) or a retirement/pension program (54%). Almost 30% do not have any form of life insurance and 20% have no form of retirement plan. A number have purchased these services individually through private vendors (21% for life insurance, and 26% for retirement programs).
Many companies (44%) provided a packaged policy where time off for sick leave, vacation, personal days and holidays are treated as one. Among this group most employees (55%) received between 2-4 weeks of paid time off, though 27% report an open policy whereby they could take as much time as they needed or wanted. Among those whose companies treated days off separately (37%), the majority reported an open policy for sick days (41%) and two
Developer Satisfaction Survey 2015 - Summary Report
21 | P a g e
weeks of vacation time (24%). When an employee has a child, 31% of respondents said their company pays for parental leave. However, 37% didn’t know their company’s policy on parental leave.
Snapshot: Hours of Work Half of respondents indicated that their company works a normal business week during a regular schedule, amounting to 40-44 hours per week. Eighteen percent of respondents did say they work between 45 and 49 hours per week during regular schedule, and another 12% said they regularly work 50 to 59 hours a week. However, crunch is still a problem: 62% indicated that their job involved crunch time; 58% said they were in crunch more than twice in the last two years; and 61% said that crunch time is expected at their workplace. In addition, 44% of those who did not report engaging in crunch said that their job did require periods of long hours, extended work hours or extended overtime that is not called ‘crunch.’ The majority of employees reported working 50-59 hours per week (31%) and up to 60-69 hours per week (30%) during crunch. A sizable minority (17%) reported working more than 70 hours a week in crunch.
Snapshot: Career Path and Advancement Although 43% of respondents indicated that their company had either “good” (29%) or “excellent” (15%) potential for promotion or career advancement, 26% felt that they weren’t sure or were “neutral” toward this question. Respondents seemed relatively divided about whether their profession had a clear career path. Almost half said that their profession does have a clear career path (48%), the remaining 52% said that there is no clear career path (35%) or that they were not sure (17%).
Developer Satisfaction Survey 2015 - Summary Report
22 | P a g e
A Profile of Freelancers/Contractors Snapshot: Demographics The average freelancer is between the ages of 27 and 31 (31%), white (79%), male (70%), and living in the United States (50%). He is heterosexual (73%) and single (48%), and he has no children (86%). He has a university degree (45%), probably in computer science (12%) or perhaps animation (4%).
Snapshot: Experience and Job Security Most respondents who indicated that they are freelancing have been doing so for only a few years: “1-3 years” was the most common response (46%), followed by “less than one year” (19%), and “4-6 years” (19%). Just over 75% of freelancers said they had previously been a permanent or temporary employee of a game-related company. Compared to the employee data, most freelancers have a strong intention to stay in the industry; 57% said they will remain indefinitely, only 5% said they would move on in the next six years. Almost one-quarter said they did not know how long they would remain.
The majority of freelancers seem to concentrate their work with a handful of employers; half reported having only 1 or 2 employers in the past five years and a further 31% reported 3-4.
Most freelancers are only working on one project at a time (55%), but working on 2 to 5 projects at a time is also common (41%). Current contracts are most commonly 3 to 6 months (24%), but various other contract lengths were also popular. A fifth of respondents said their current contracts are less than three months, and 14% said their contracts are a year in length. Current contracts seem to be representative of typical contracts: 37% said their typical contracts were 3 to 6 months, 22% said less than three months and 15% said a year.
Snapshot: Company Type Freelancers in this sample were most likely to work for independent studios (38%) – those which are not owned by or dependent on a single publisher and engage primarily in self-publishing. This is followed by third-party studios (13%) and second party developers fully owned by a particular publisher (8%).
Snapshot: Job Role Most freelancers in this sample were programmers/software engineers/technical designers (31%), followed by visual artists (15%) and game designers (13%).
Snapshot: Company Size and Composition Freelancers are most likely to be found at small to mid-sized companies. Company size of 2-5, 6-10 and 11-50 each received about 25% of the responses. In line with this, freelancers are most likely to work on development teams of 2-5 (35%) or 6-10 (28%) people. Freelancers
Developer Satisfaction Survey 2015 - Summary Report
23 | P a g e
overwhelming tended to work from home (70%) with a sizable group also reporting that they have space at their employer’s studio (34%).
Snapshot: Salaries Overall, freelancers in this sample make significantly less than their traditionally employed counterparts; 37% make less than $15,000 US per year and the next highest response category was only $30,000-40,000 (12%). Only 24% of freelancer respondents reported making more than $50,000 per year. Many freelancers are paid an hourly wage (29%) or per deliverable (21%), but most freelancers arrange a combination of compensation practices (31%).
Snapshot: Incentives and Overtime Generally, freelancers do not negotiate incentives or bonuses as part of their compensation (62% have none), but 27% did say they negotiate royalties or shares tied to the success of the game. Similarly, most freelancers (57%) do not negotiate extra compensation for overtime or hours worked beyond normal office hours. Some indicated that they do negotiate perks (18%) or overtime (14%). The majority of freelancers reported that they had not been expected to work unpaid hours on a contract in the past 2 years (59%), but that leaves 36% who were expected to work unpaid hours and 6% who were not sure.
Snapshot: Benefits and Time Off Only a handful of freelancers reported contracts that include paid time off (8%) or accounted for time off as additional pay (7%). Indeed, most reported taking very little time off at all. One-quarter reported taking no time for sickness and 44% typically take less than one week. Most typically take 2 weeks of vacation (22%), but 17% take no vacation.
Employer coverage for health care and life insurance is also rare (5% for health; 4% for life) Rather freelancers in this sample report relying on government provided health coverage (30%) and/or individual or private coverage (24%). Another 20% rely on parents or partners for their health coverage. Unlike health coverage, most freelancers (64%) do not have life insurance at all. If they do, it is a private plan obtained individually (22%). Similarly, most freelancers (52%) do not have a retirement or pension program. If they do have a plan, it is also likely to be a private individual plan (32%).
IP and Credit Most freelancers (84%) work for hire and their employer owns the IP. However, 72% said their name is included in the game credits as credit for their contribution to the game. Almost 20% reported that they receive no credit for their contribution to a game.
Hours of work Though a quarter of freelance respondents have full time, 40-44 hour per week jobs, 40% work less than 30 hours per week in their regular work schedules. Freelance work does involve crunch time, with 62% of respondents indicating they crunch, 67% indicating they had crunched more than twice in the past two years, and 54% feeling that long hours were expected as a normal part of their job. As well, of those who said they did not engage in
Developer Satisfaction Survey 2015 - Summary Report
24 | P a g e
‘crunch’, 42% said their work required periods of long hours, extended work hours or extended overtime, but they just did not refer to it as crunch. The majority of freelancers reported working 60-69 hours per week during crunch (21%) while 28% reported working more than 70 hours per week.
Snapshot: Why Freelance? Sometimes people choose to work on a temporary or contract basis. Other times this is the only option given their unique circumstances and the realities of their regional or national labor markets. This survey captures both of these dimensions. Many respondents said they work freelance for reasons related to personal control over their work and life (they could select more than one answer):
To have more control over working conditions like hours (56%) To work on more varied projects (45%) To have more control over the content of the work (39%) and make the games you
want to make (36%) To have more control over employment stability/risks (39%)
That said, over one-third (37%) the respondents who self-identified as independent contractors or freelancers stated that they freelance because they have not been able to find a permanent job at an established studio where they live. This shows that for some, this was not purely a personal choice.

Developer Satisfaction Survey 2015 - Summary Report
25 | P a g e
A Profile of the Self-Employed Snapshot: Demographics The average freelancer is between 29 and 34 years old (32%), white (71%), male (73%), and living in the United States (44%). He is heterosexual (73%) and married or in a long term relationship (51%), and he has no children (69%). He has a university degree (41%), probably in computer science (27%) or game design (13%).
Snapshot: Experience and Job Security Self-employed respondents also report relatively low tenure in the games industry; 35% have worked in the industry for 1 to 3 years and 22% for 4-6 years. However there is a group with more experience as 23% have worked in the industry for more than 10 years. That said, it seems that the decision to become self-employed is a more recent one as 84% reported being self-employed for 6 years or less. Only 8% reported being self-employed for more than 10 years. Fitting this conclusion, most self-employed respondents have worked as permanent or temporary employees in the past (70%) and 16% have worked as freelancers. This group seems to have the highest commitment to the industry compared to employees and freelancers. Most self-employed respondents see themselves staying in the industry indefinitely (76%), and also see themselves remaining self-employed (60%).
Snapshot: Company Type The majority (70%) of the self-employed respondents would identify as independent developers who engage primarily in self-publishing and that their company isn’t dependent on or owned by a single publisher. The next largest groups were for third-party developers and companies that do not exclusively make games each with only 6.5% of the responses.
Snapshot: Job Role In addition to their role as owner/manager, most self-employed respondents were programmers/software engineers (35%), or game designers (21%). A number of self-employed respondents reported that they are engaged in jobs across the full spectrum of their company’s operations, particularly those who own a small company or are a one-person shop.
Snapshot: Company Size and Composition The self-employed respondents in this sample typically own small companies wither operating as one-person shops (32%) or employing or contracting two to five people (52%). However, it was reported that the size of the team can fluctuate between one person at slow times of the year (45%), and up to five (15%), eight (8%) and ten (9%) people at busy times of the year. The breakdown of employees versus contractors seems to lean slightly to employees; 35% reported that their company is made up of 100% employees while 20% reported that their company is 100% contractors and 16% said it is a 50/50 split.
Developer Satisfaction Survey 2015 - Summary Report
26 | P a g e
The small company size results in fewer projects running at one time: 46% said one project at a time is normal, while 50% said they have two to five projects running at one time.
Most self-employed respondents work from their home office (61%) and their employees are likely to do the same in their own homes (63%). However, 34% work from an external studio or office and, unsurprisingly, 36% also have employees that work at the company studio or office.
Snapshot: Compensation Seventy-four percent of self-employed respondents said their company is self-funded, and this seems to create a number of financial barriers. Though they likely work at their own company full time, with 56% reporting that 90-100% of their income comes from their work in the game industry, they aren’t making much money. Almost half (49%) reported that their annual income in 2014 from game-related work was less than $15,000 USD. Forty-five percent always forego a salary or wage in order for their company to have what it needs.
Despite its seeming popularity only 10% reported that their work was crowdfunded; this is less than those who rely on investors (11%), public granting agencies (11%), or family and friends (16%).
Snapshot: Incentives and Overtime for Employees Given the financial restrictions on these respondents, it is perhaps expected that they do not generally provide raises as part of their compensation to employees; 40% do not provide raises and 39% do not provide bonuses. Thirty nine percent do offer royalties or shares tied to the success of the game. During periods of overtime and crunch, these employers offer some perks (28%), comp time (18%), or a combination of money and comp time (12%) to their workers, but 37% don’t or are unable to offer anything to their employees for working overtime.
Snapshot: Benefits and Time Off Self-employed respondents take few sick days, with 27% reporting that they take none and 37% reporting that they take less than a week. They also don’t take much vacation time; 17% don’t take any and 52% take between 1 to 3 weeks.
Most self-employed respondents do have a form of health coverage, though 20% said that they do not. Rather than a company plan, most self-employed rely on government plans (32%), spousal/parental plans (21%) and/or individual insurance (19%). A greater percentage of the self-employed have neither life insurance (57%) nor a retirement program (54%). In both cases, the majority who do have these benefits rely on individual private plans (25% for life, 26% for retirement).
Snapshot: Benefits and Time Off for Employees Not surprisingly given the above, most self-employed respondents do not offer any paid time off beyond statutory days (51%) and most (78%) indicated that they don’t offer life insurance, a pension plan, or health insurance to their employees.
Developer Satisfaction Survey 2015 - Summary Report
27 | P a g e
Common perks the self-employed offer to employees include conference travel (38%), an open pet policy (25%), coffee/espresso (31%), and other drinks (55%).
Hours of Work The typical work week for self-employed respondents is less concentrated around the standard 40-44 hours/week; 19% did report 40-44 hours, but 11% reported 35-39 hours, 12% reported 45-49 hours and 11% reported 60-69 hours. Long hours are also common for self-employed; 53% indicated that they do crunch, 54% said they crunched more than twice in the past two years, and 44% said their job required long hours that they would not necessarily call “crunch.” Forty-four percent feel these long hours are necessary for their job, but 38% say it isn’t required and another 18% say they aren’t sure. While in crunch, 30% of the self-employed reported working 80 or more hours a week while 24% reported working 50-59 hours in crunch.
Developer Satisfaction Survey 2015 - Summary Report
28 | P a g e
Student Profile An important sub-sample (20%) of our respondents identified as being either full (13%) or part-time (7%) students. Of these 71% were studying to work in the game industry while 29% were studying about games or the game industry. Consistent with the gender breakdown of those working in the industry, 73% of the student respondents identified as male, 25% as female and 2% as transgender or other.
Snapshot: Desired Job Respondents identifying as students were asked to specify the type of job they are pursuing. Nearly a third (28%) indicated that programmer/software engineer/technical designer was their primary interest. Game design was the second most popular discipline at 24%. Visual art ranked third at 14% and to be a writer in the industry captured 8% of the sample. A number of students (5%) said they wanted to start their own companies or be project managers (4%). Smaller numbers said they were interested in quality assurance and testing (2%), audio (2%), community management (1%), localization (2%), or wanted to work in user-experience and user interface research and design (2%).
Snapshot: Desired Company Few students reported wanting to work for first-party developers or their subsidiaries (7%). More desire to work for second-party developers or their subsidiaries (15%), third-party developers (14%), or be self-employed (15%). Perhaps not surprising given the rise of independents, the highest company selection was an independent game studio with 23% selecting that as their target company. Smaller numbers of respondents wanted to work freelance (4%), join a studio that does not exclusively make games (2%) or join a work for hire studio (1%).
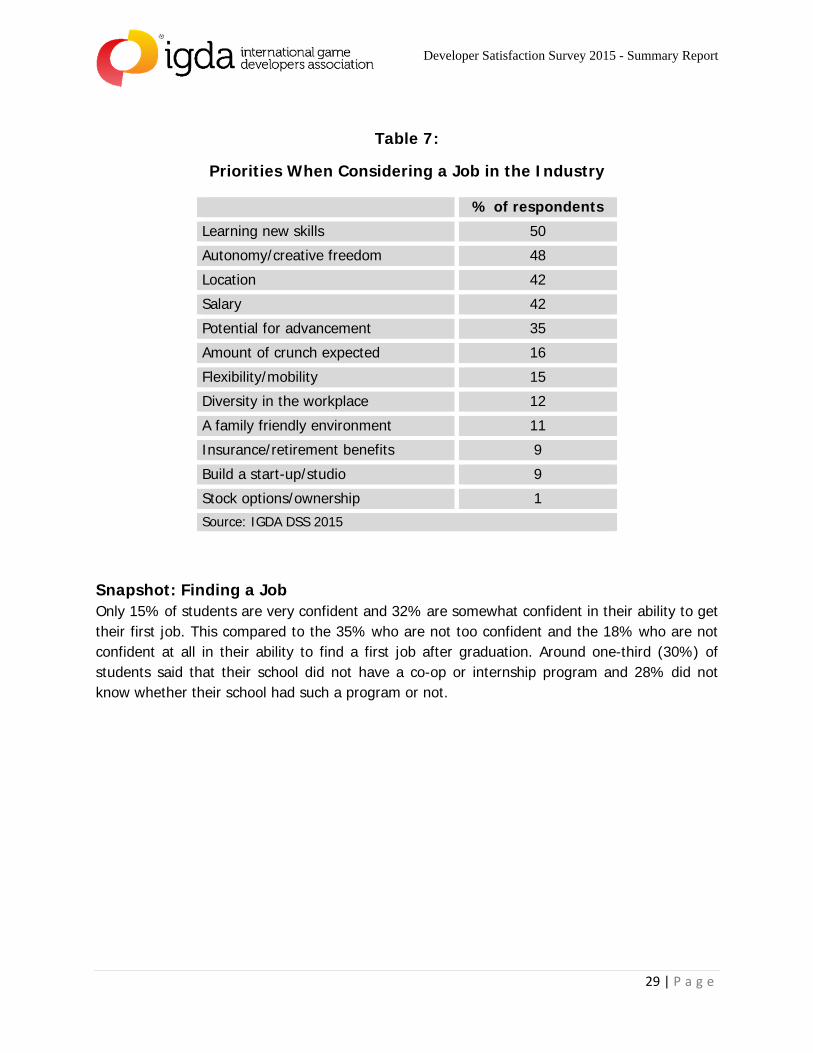
Snapshot: Priorities in a Job Table 7 below shows the things that students are looking for when they are considering a job in the industry. Respondents were asked to check all the options that applied. Note that 50% said that learning new skills was their top priority. Autonomy/creative freedom (48%) was number two. Location and salary were tied for the number three spot at 42%. Other priorities cited included potential for advancement (35%), and a family-friendly environment (11%). Only 12% said that diversity in the workplace was a priority.
Developer Satisfaction Survey 2015 - Summary Report
29 | P a g e
Table 7:
Priorities When Considering a Job in the Industry
% of respondents
Learning new skills 50
Autonomy/creative freedom 48
Location 42
Salary 42
Potential for advancement 35
Amount of crunch expected 16
Flexibility/mobility 15
Diversity in the workplace 12
A family friendly environment 11
Insurance/retirement benefits 9
Build a start-up/studio 9
Stock options/ownership 1
Source: IGDA DSS 2015
Snapshot: Finding a Job Only 15% of students are very confident and 32% are somewhat confident in their ability to get their first job. This compared to the 35% who are not too confident and the 18% who are not confident at all in their ability to find a first job after graduation. Around one-third (30%) of students said that their school did not have a co-op or internship program and 28% did not know whether their school had such a program or not.
Developer Satisfaction Survey 2015 - Summary Report
30 | P a g e
Conclusions and Next Steps The Developer Satisfaction Survey is an important source of actionable information for the entire game development community. These data points also provide the IGDA with a better indication of who the association represents and their concerns, interests and issues, providing a better foundation for how the IGDA can increase its effectiveness.
However, we should bear in mind that the majority of respondents were working in the United States and made up more than half of the sample, while the overall North American representation was brought to 67%. While North America plays an undeniably large role in the global video game industry, developers in this part of the world may still be overrepresented in the picture painted here. The same can be said of people who work at large studios, as 37% of all respondents and more than half of salaried workers share the workplace with more than 100 other workers. Among salaried workers, only 15% indicated that they work at a company with less than 10 people, though this increases to 36% when freelancers and the self-employed are included.
Developers are still young, male, white/Caucasian/European and most of them do not have children or elder care responsibilities. They are highly educated and two-thirds of them have been trained in specialized programs relevant to game design or game development.
Most of the students in this sample wish to work for second-party developers or their subsidiaries (15%), third-party developers (14%), or be self-employed (15%). Among those who wish to become salaried workers, 23% wish to work for an indie game studio. At this stage of their progress, they give priority to learning new skills and autonomy/creative freedom (half of them), and have less concern for family-friendly environments (11%) or diversity (12%) as a priority in the workplace.
By the same token, in the general population of respondents, while the concern for diversity in the workplace is still important (two thirds of respondents are concerned), it is decreasing from past years, whereas 71% of respondents are still concerned with diversity in games. In the meanwhile, half of respondents consider there is no such thing as equal treatment and opportunity on the basis of gender, age, ethnicity or ability in the workplace, and more than 57% of them also consider sexism among gamers as a factor influencing society’s negative perceptions of the game industry.
The videogame industry is still “no country for part timers” as a vast majority (85%) of respondents work in the industry on a full-time basis. That said, it does not mean that developers are stable in employment; employees are often “hired and let go” while freelancers seem to maintain stable-but-rotating relationships with a core set of clients. Employees as well as freelancers/contractors may switch employers close to once a year (2.7 switches on average during the past 5 years for employees, 4.6 for freelancers/contractors).
Developer Satisfaction Survey 2015 - Summary Report
31 | P a g e
The average career path does not typically rely on in-house promotion; while, of course, some developers get promoted in their studio, many will advance under the “spiral staircase” model of project managementviii, switching jobs, projects and studios to enhance their reputation and get hired on more prestigious projects. They gain informal but highly valued status along the way, without looking for any line position up the hierarchy.
Interestingly, though half of the respondents only work on one project at a time, the other half works on two to five projects. This is the case for employees, the self-employed and freelancers as well. As these multiple assignments are acknowledged as an important issue in project management as a challenge for team building and individual work organization, it might be relevant to study the impact of this on stress and health in the future.
Salaries are still individually negotiated or established, and part of a multi-layered compensation system, some components being universal and minimal and others variable, uncertain and meritocratic. Most often (37%) these raises are given based on a combination of factors including a fixed percentage allocation, a formula for merit, and the judgement of management, though for 22% of employee respondents this decision is based solely on the discretion of management. Studios rarely have a widely distributed precise policy and criteria for the salary level. Moreover, a third of respondents receive no additional compensation when working beyond normal office hours and if so, this additional compensation comes mostly in the form of various perks like meals (half of respondents) or time off (a quarter of respondents).
Freelancers in this sample make significantly less than their traditionally employed counterparts. Two thirds of them do not have any incentives or bonuses as part of their compensation, while a quarter negotiate royalties or shares tied to the success of the game. Similarly, most freelancers (57%) do not negotiate extra compensation for overtime or hours worked beyond normal office hours.
Self-Employed respondents likely work at their own indie company full time with more than half reporting that 90-100% of their income comes from their work in the game industry. Despite some high profile successes in recent years, the life of a self-employed indie developer is not easy; half of them reported less than $15,000 USD as an annual income in 2014. Nearly half may forego a salary or wage in order for their company to have what it needs. Given these financial restrictions, they do not generally provide raises as part of their compensation to employees, nor bonuses. They can offer royalties or shares tied to the success of the game, but do not offer anything to their employees for working overtime. Half of them declared working long hours, and say their job required long hours that they would not necessarily call “crunch.”
While there is a general decrease in regular and crunch hours of work in the industry over the past 15 years, crunch time is still part and parcel of the trade.ix Two thirds of respondents indicated that their job involved crunch time, often more than twice in the last two years and often expected as a normal practice. While two thirds of these respondents work less than 70 hours a week during crunch, a sizable minority (17%) reported working more than 70 hours a week in crunch.
Developer Satisfaction Survey 2015 - Summary Report
32 | P a g e
Insights from 2015 show that those who work in the game industry are passionate about their jobs and the number who desire to contribute to the industry for the entirety of their careers is steadily increasing. The global workforce is slowly increasing in its diversity while developers are generally gaining better wages and benefits.
However, significant challenges remain, such as these as examples:
The demands on employees’ contributions versus fair compensation for their time spent at work (i.e., compensation for “crunch” time).
The continued underrepresentation of women and the incidence of sexism in the workforce, in games themselves, and in the broad gaming community – combined with a perception that the industry doesn’t provide equal opportunity for all.
A strong desire by employees to give their time and passion to an employer, sharply contrasted by high rates of job changes over short periods of time.
The diverse experiences and challenges of different workers in the industry (i.e., salaried employees, freelancers and the self-employed) and the need to devise suitable approaches to support each group.
Subsequent to this report, the authors intend to prepare, for IGDA release, a comprehensive report covering the employment aspects of the survey data and providing deeper analysis of the relationships between the variables captured in the survey. This Summary Report addressed only the most salient points and engaged in limited comparison between questions or to past surveys. The authors also intend to prepare specific subsequent reports on the industry trends and diversity sections of the survey. Look for these and past reports on the IGDA website (igda.org) or the authors’ website (gameqol.org). You can also sign up to receive future surveys at gameqol.org.
We continue to tweak the survey to provide for a better experience and to find a balance between comprehensive questioning and survey length. For 2016 members of the game community can expect to see a very similar DSS to the 2015 version. We will continue in our attempts to reach a broader international audience and to achieve a large representative sampling of the game community.
Developer Satisfaction Survey 2015 - Summary Report
33 | P a g e
Endnotes
i United States Census Bureau (2012) Age and Sex Composition in the United States: 2012. Table 1. Population by Age and Sex: 2012. Accessed Aug 26, 2015 from https://www.census.gov/population/age/data/2012comp.html ii Gary J. Gates (2011). How many people are lesbian, gay, bisexual, and transgender? The Williams Institute: University of California School of Law. Accessed Aug 26, 2015 from http://williamsinstitute.law.ucla.edu/wp-content/uploads/Gates-How-Many-People-LGBT-Apr-2011.pdf iii United States Census Bureau (no date) State & County QuickFacts: USA QuickFacts. U.S. Department of Commerce. Accessed Aug 26, 2015 from http://quickfacts.census.gov/qfd/states/00000.html iv Brian W. Ward, James M. Dahlhamer, Adena M. Galinsky and Sarah S. Joestl (2014) Sexual Orientation and Health Among U.S. Adults: Nation Health Interview Survey, 2013. National Health Statistics Reports, no. 77. Hyattsville, MD: National Center for Health Statistics. v United States Census Bureau (July 25, 2012) Nearly 1 in 5 People Have a Disability in the U.S., Census Bureau Reports. U.S. Department of Commerce. Accessed Aug 26, 2015 from https://www.census.gov/newsroom/releases/archives/miscellaneous/cb12-134.html vi Kate Edwards, Johanna Weststar, Wanda Meloni, Celia Pearce, and Marie-Josée Legault (2014) Developer Satisfaction Survey 2014 Summary Report. International Game Developers Association. Accessed Aug 26, 2015 from http://www.gameqol.org/igda-qol-survey/ vii Johanna Weststar and Marie-Josée Legault (2015) Most Desired Video Game Employer of 2015 is… Accessed Aug 26, 2015 from http://www.gameqol.org/discussions/ viii J. Rodney Turner, Martina Huemann and Anne Keegan (2008) Human Resource Management in the Project-oriented Organization, Newtown Square, Project Management Institute (PMI) inc. Page 12.
ix Marie-Josée Legault and Johanna Weststar (2015) Working Time Among Videogame Developers, Trends Over 2004-2014. Accessed Aug 26, 2015 from http://www.gameqol.org/igda-qol-survey/