Embed Size (px)
Citation preview
Development of an assessment methodology for CO2
leakage from
off‐shore reservoir
Keisuke UCHIMOTO (RITE)内本
圭亮
CCS Technical Workshop, Tokyo, Japan, 24th January 2013
海底下貯留における海域環境影響評価手法の開発
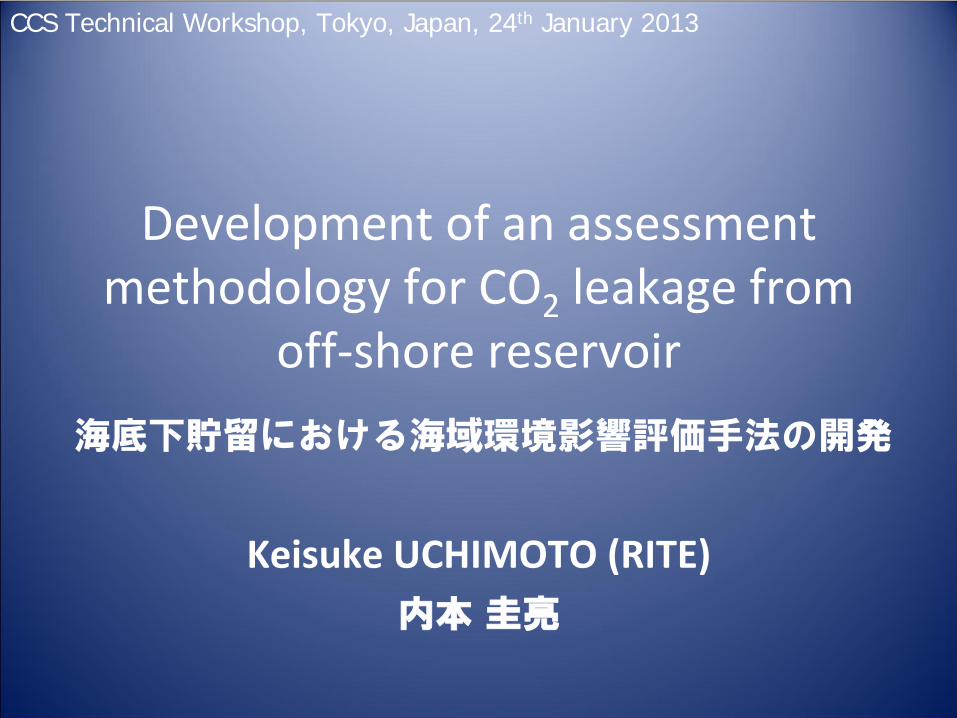
Offshore CO2
storage
reservoir
caprock layer
Caprock layer prevents injected CO2 from leaking
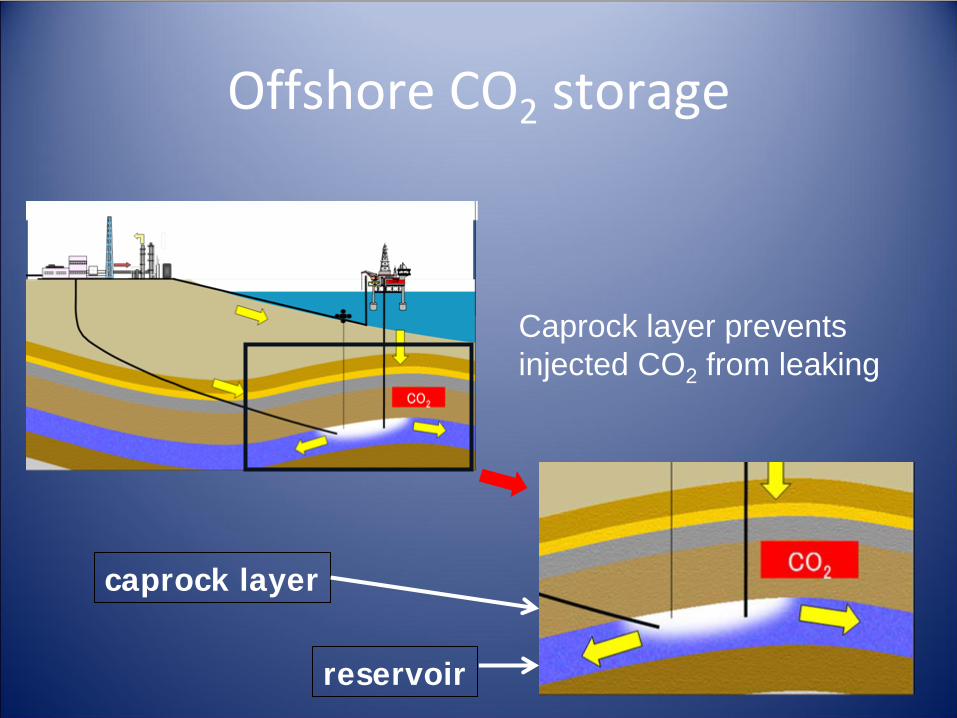
Various trapping
In addition to physical trapping
•Solubility trapping: dissolution in formation water
Buoyant forces are eliminated
•Mineral trapping: conversion to stable carbonate minerals
Physical trapping
1
10 100 1000 10000Since injection stops (year)
Contribu
tion
(%)100
0
Risk of CO2 leakage from Reservor is thought to be little.
● ● ●●
●●
●●
●●
●
●
●
●
●
Why is the assessment necessary?
Science and Technology is not perfect.
Possibility of leakage is thought to be little but not zero.
–Required by law→ talked by Dr. Kita
–To gain Public acceptance
Development of simulation models
If stored CO2
should leak into the sea,
what would happen?
RITE
is developing numerical models to simulate CO2
behavior from the reservoir to the sea, to assess environmental impacts of
leaked CO2
.
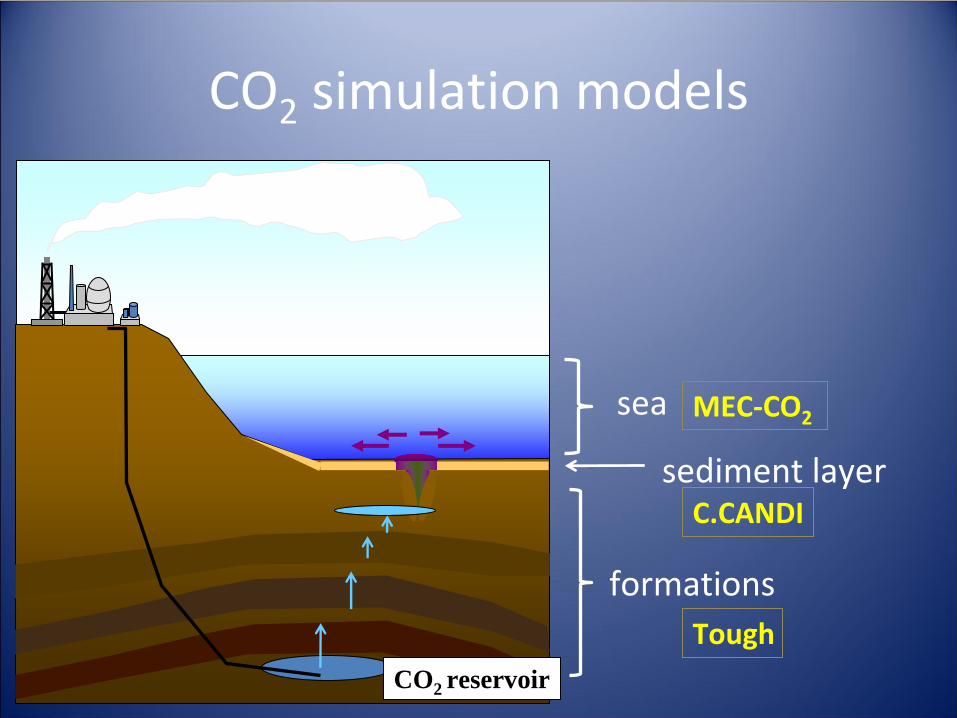
CO2 reservoir
CO2
simulation models
formations
sediment layer
sea MEC‐CO2
C.CANDI
Tough
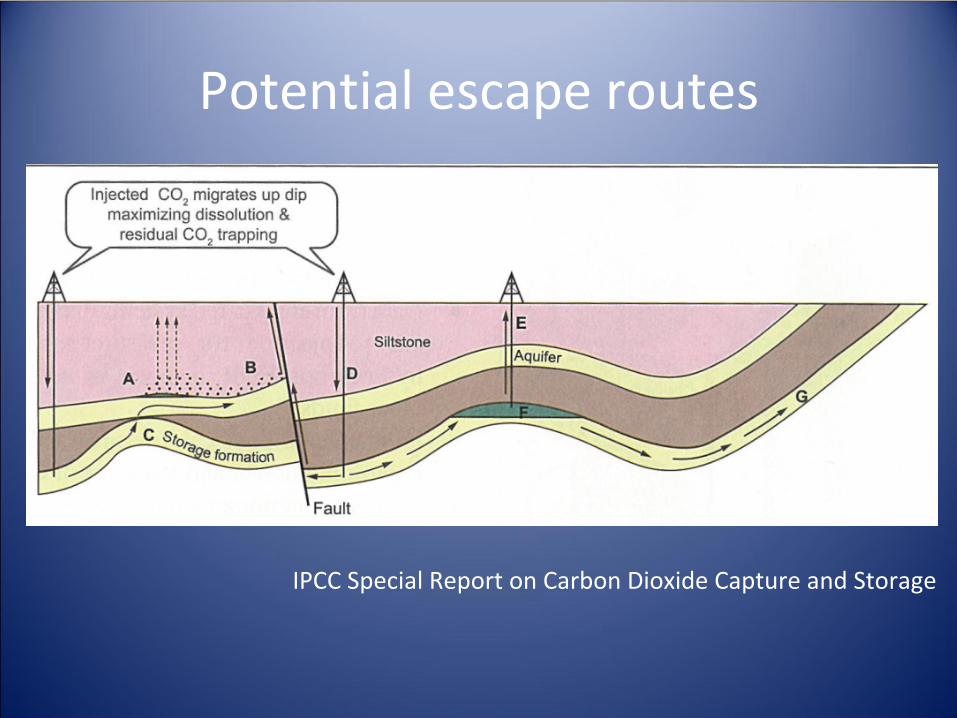
Potential escape routes
IPCC Special Report on Carbon Dioxide Capture and Storage
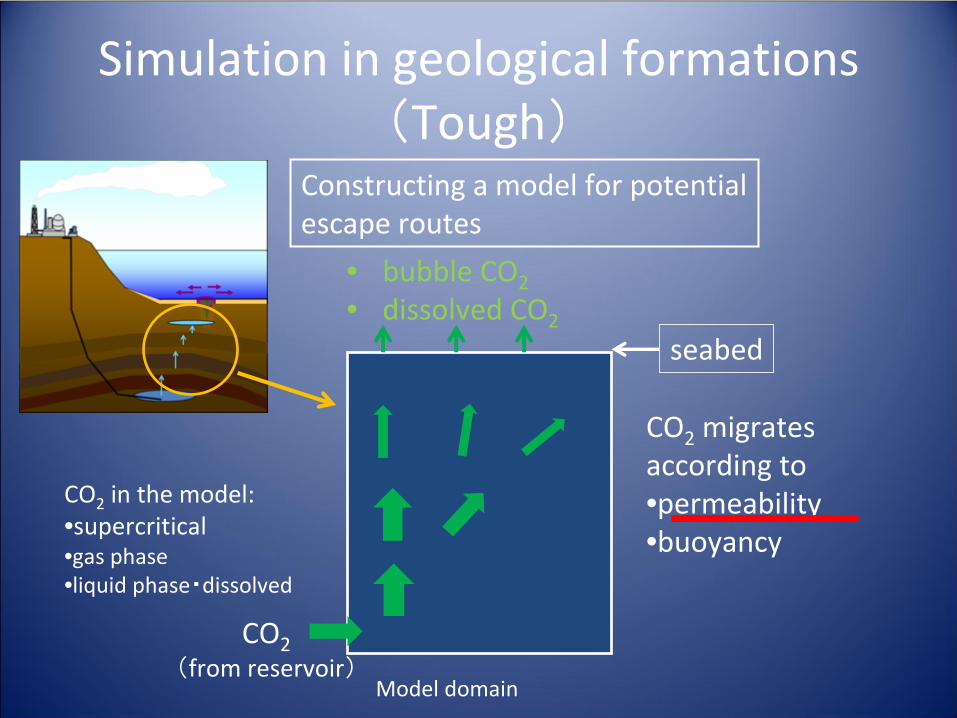
CO2(from reservoir)
Simulation in geological formations
(Tough)Constructing a model for potentialescape routes
Model domain
seabed
CO2
migratesaccording to•permeability•buoyancy
CO2
in the model:•supercritical•gas phase•liquid phase・dissolved
• bubble CO2• dissolved CO2
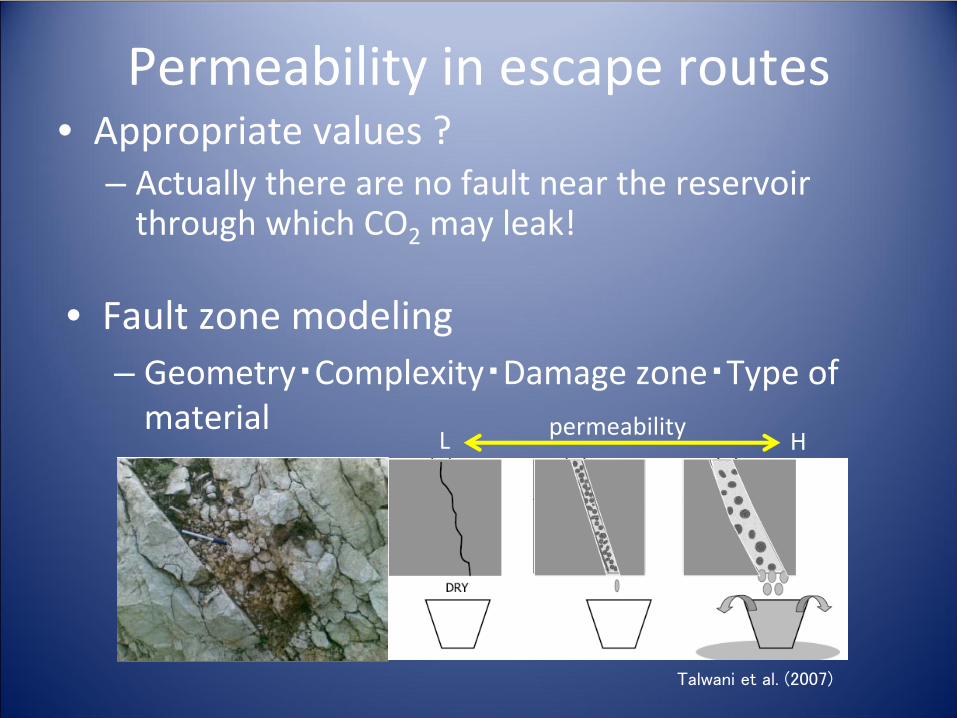
Permeability in escape routes• Appropriate values ?
– Actually there are no fault near the reservoir through which CO2
may leak!
• Fault zone modeling– Geometry・Complexity・Damage zone・Type of
material
Talwani et al. (2007)
permeabilityL H
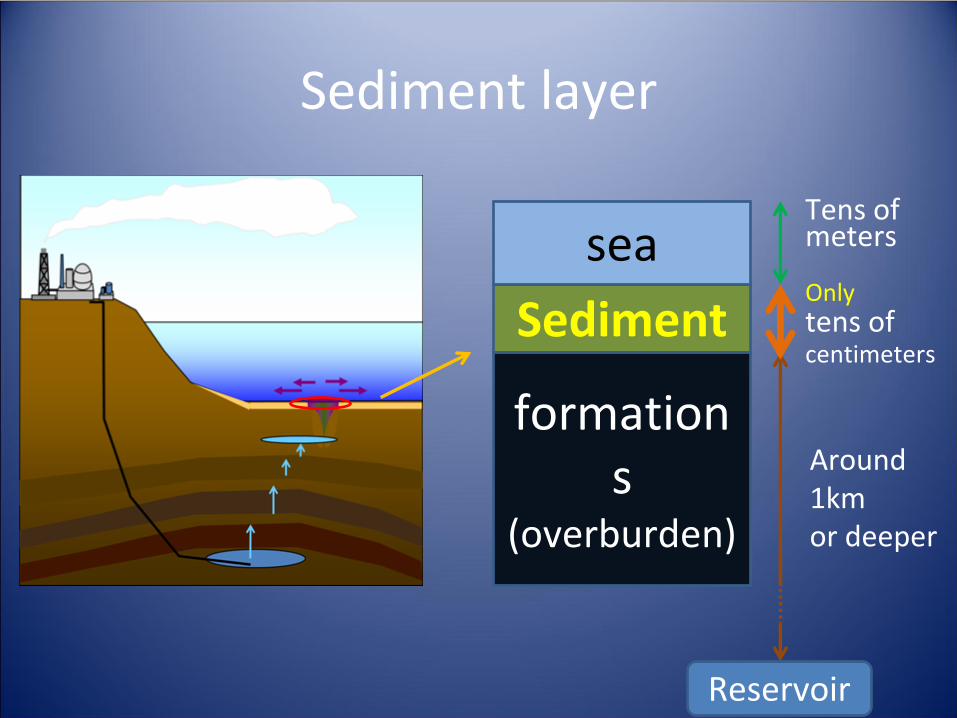
Sediment layer
Sedimentsea
formation s
(overburden)
Onlytens ofcentimeters
Tens of meters
Around 1kmor deeper
Reservoir
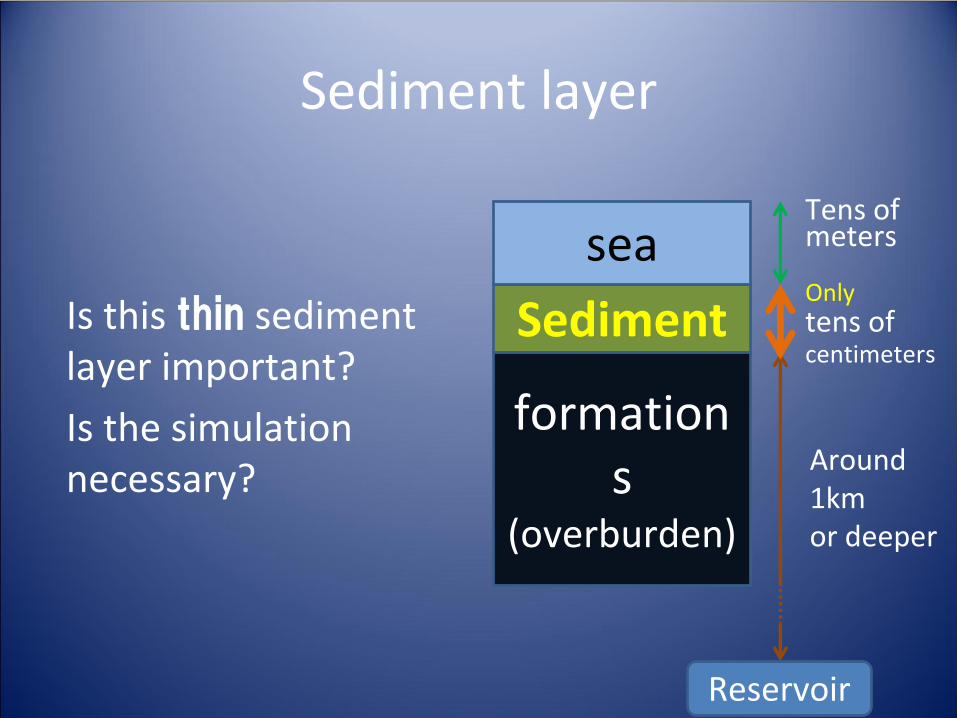
Sedimentsea
formation s
(overburden)
Tens of meters
Around 1kmor deeper
Is this thin
sediment layer important?
Is the simulation necessary?
Reservoir
Sediment layer
Onlytens ofcentimeters
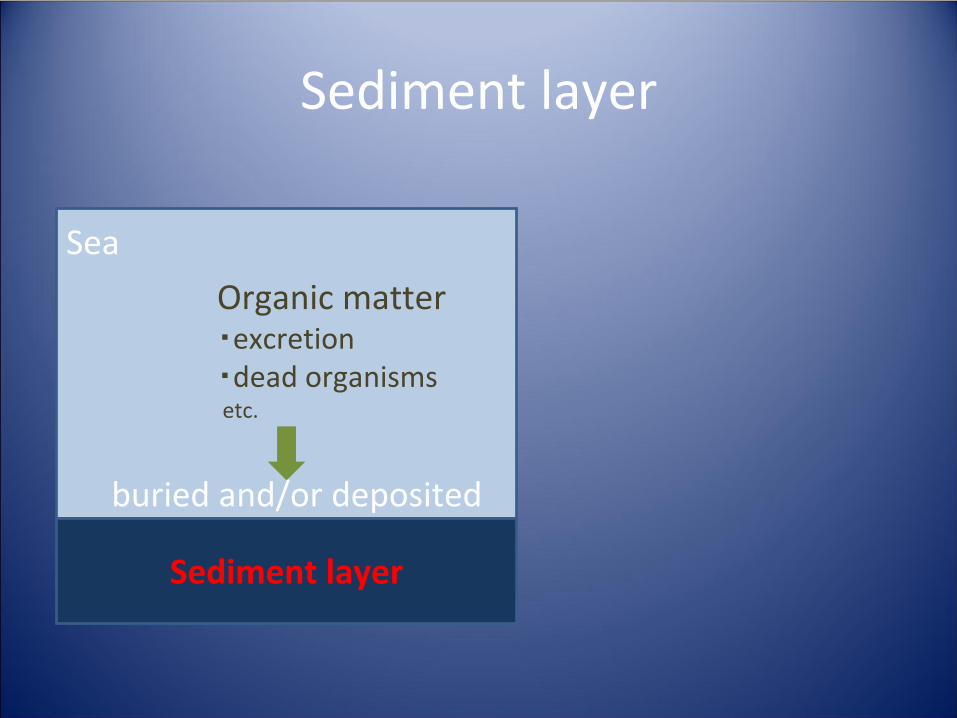
Sediment layer
Organic matter・excretion・dead organismsetc.
buried and/or deposited
Sea
Sediment layer
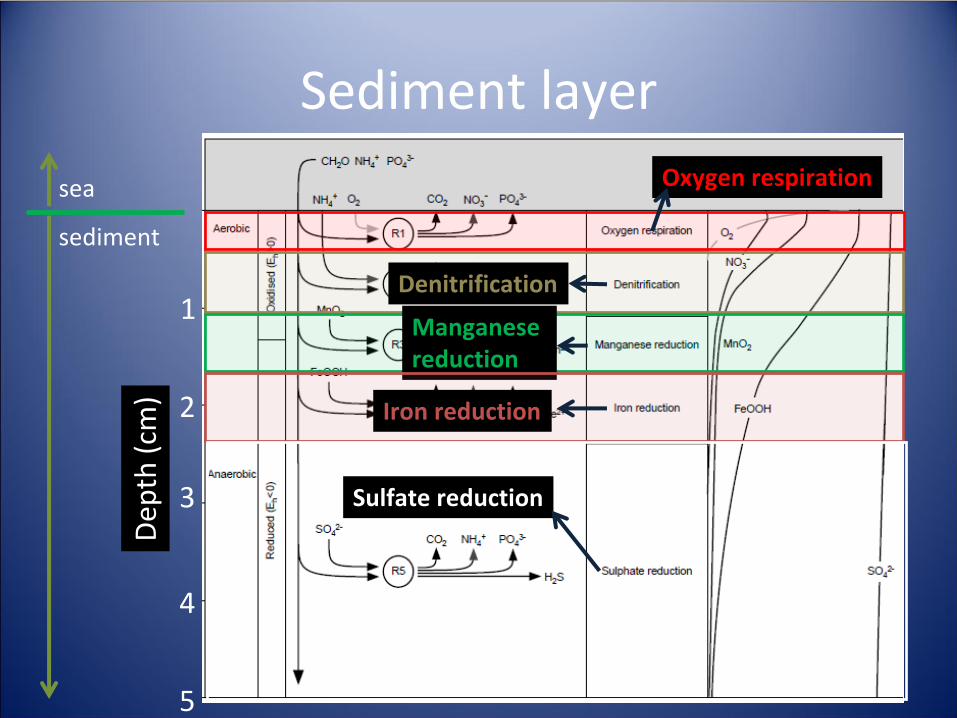
Fossing (2004)
Dep
th (cm)
sea
sediment
1
2
3
4
5
Oxygen respiration
Denitrification
Manganese reduction
Iron reduction
Sulfate reduction
Sediment layer
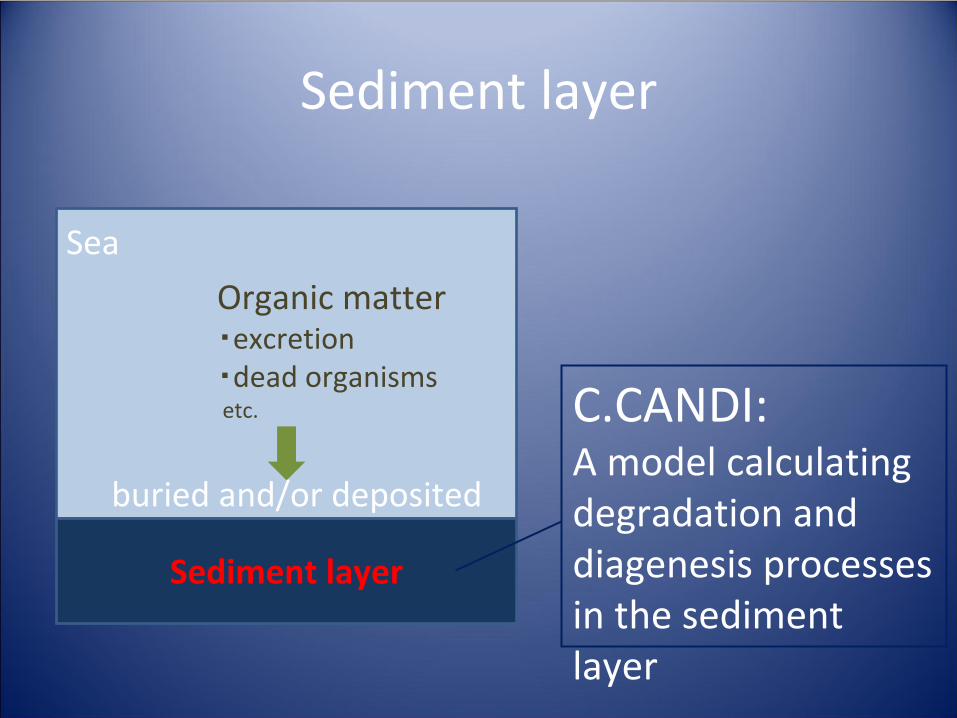
Sediment layer
Organic matter・excretion・dead organismsetc.
buried and/or deposited
C.CANDI:A model calculating
degradation and diagenesis processes
in the sediment layer
Sea
Sediment layer
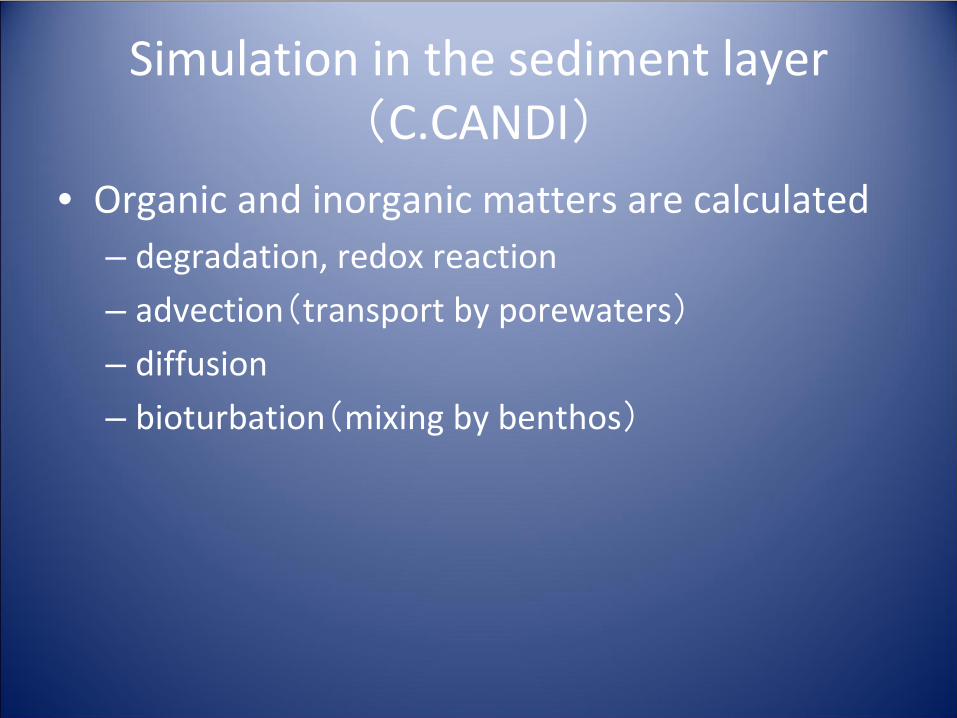
• Organic and inorganic matters are calculated– degradation, redox reaction– advection(transport by porewaters)
– diffusion– bioturbation(mixing by benthos)
Simulation in the sediment layer
(C.CANDI)
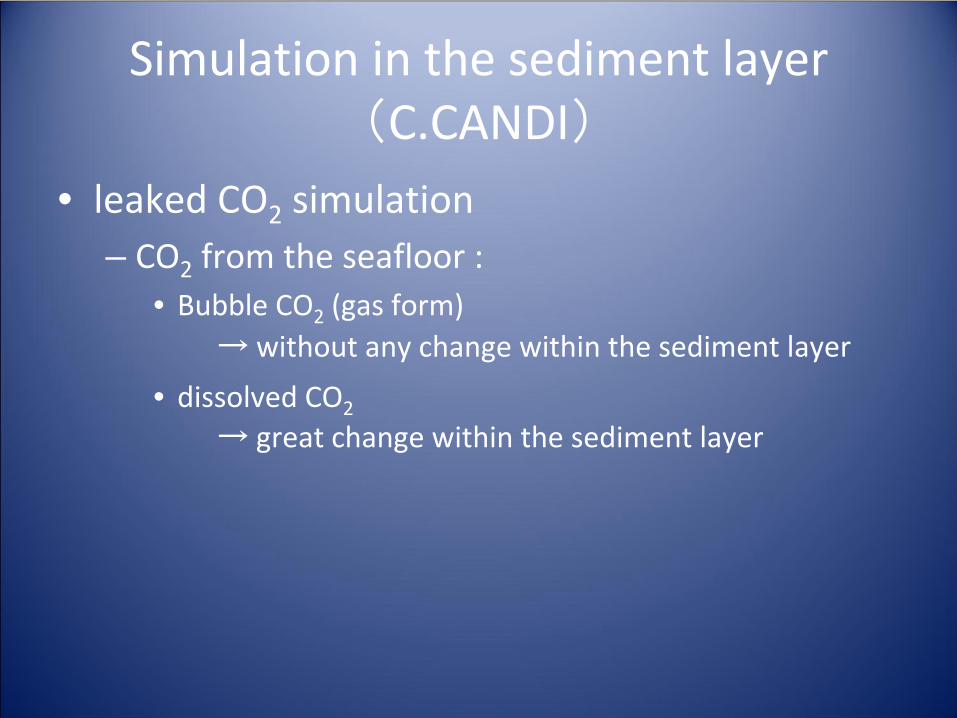
• leaked CO2
simulation– CO2
from the seafloor :• Bubble CO2
(gas form)
• dissolved CO2
→ without any change within the sediment layer
→ great change within the sediment layer
Simulation in the sediment layer
(C.CANDI)
seabed
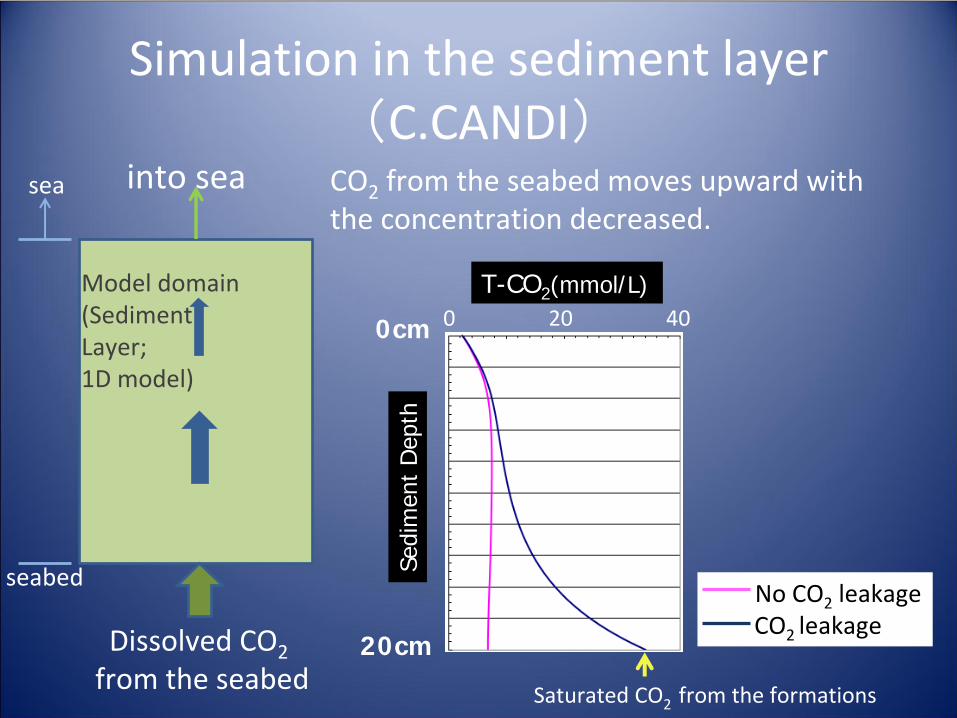
Simulation in the sediment layer
(C.CANDI)
Dissolved CO2from the seabed
into sea CO2
from the seabed moves upward with the concentration decreased.
0 20 40
20cm
Sedi
men
t D
epth
0cm
T-CO2 (mmol/L)Model domain(Sediment Layer;1D model)
sea
No CO2
leakageCO2
leakage
Saturated CO2
from the formations
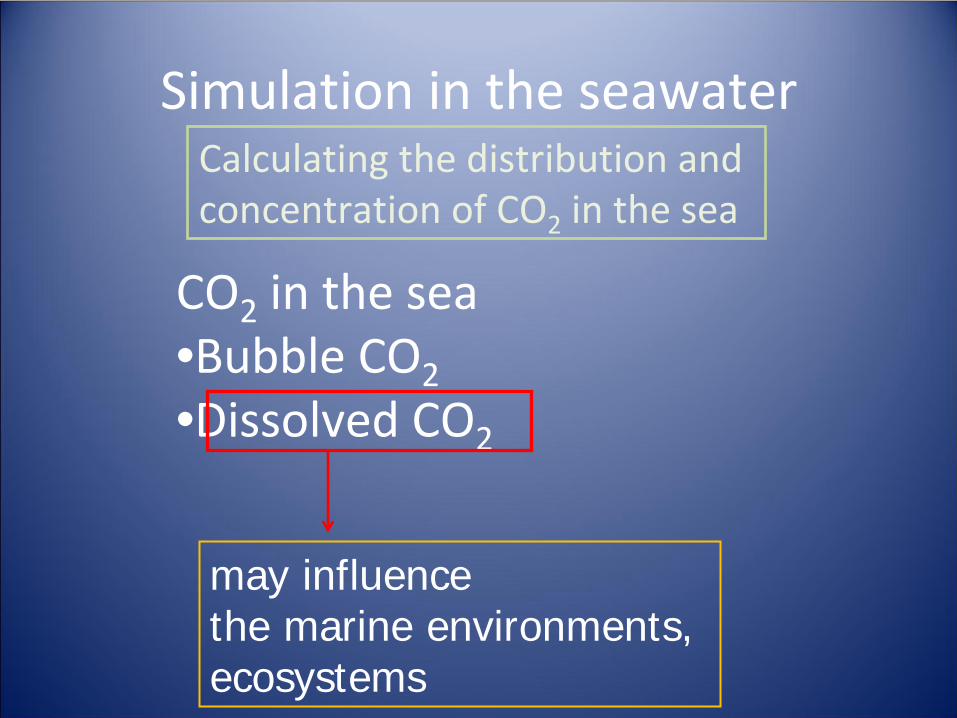
Simulation in the seawater
CO2
in the sea•Bubble CO2•Dissolved CO2
may influence the marine environments, ecosystems
Calculating the distribution and concentration of CO2
in the sea
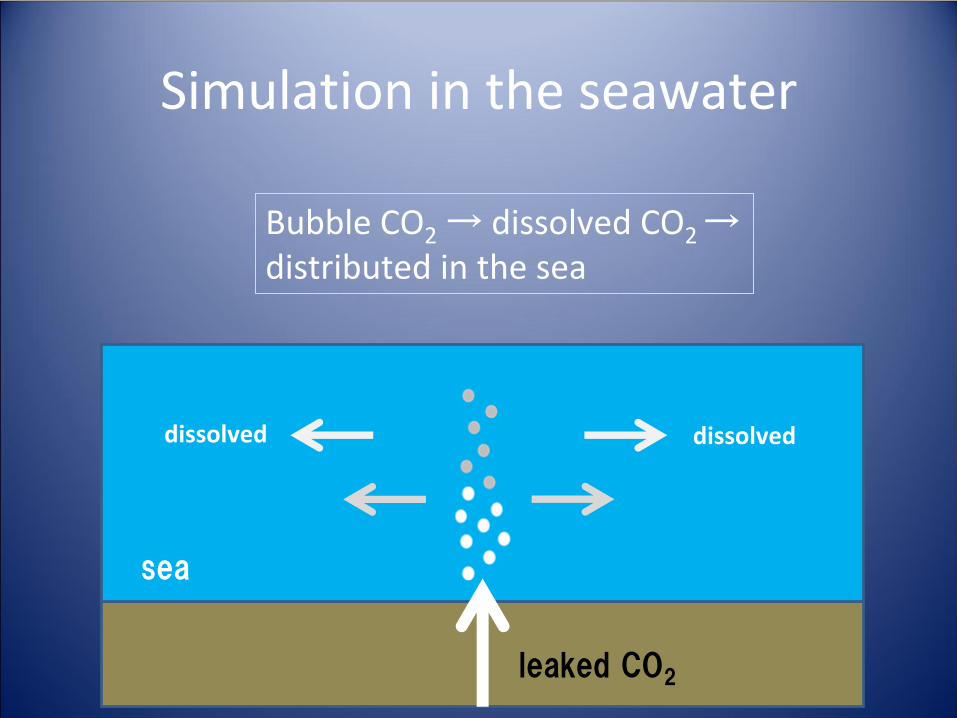
sea
leaked CO2
Simulation in the seawater
Bubble CO2
→ dissolved CO2
→ distributed in the sea
dissolveddissolved
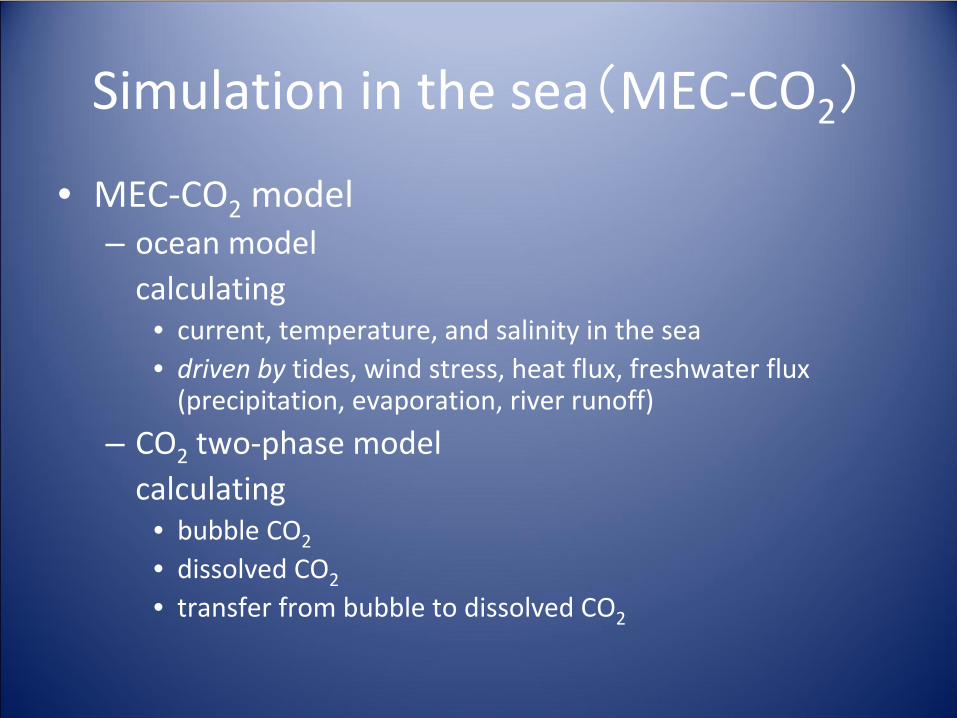
Simulation in the sea(MEC‐CO2
)
• MEC‐CO2
model– ocean modelcalculating
• current, temperature, and salinity in the sea • driven by
tides, wind stress, heat flux, freshwater flux
(precipitation, evaporation, river runoff)
– CO2
two‐phase modelcalculating
• bubble CO2
• dissolved CO2
• transfer from bubble to dissolved CO2
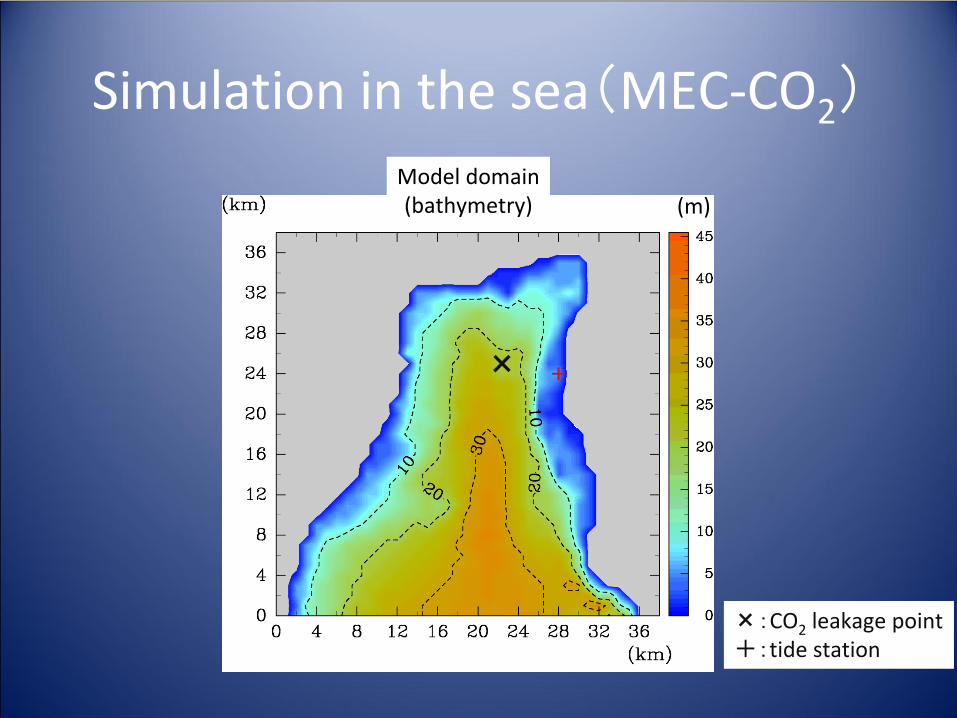
Simulation in the sea(MEC‐CO2
)
Model domain(bathymetry) (m)
×
×:CO2
leakage point+:tide station
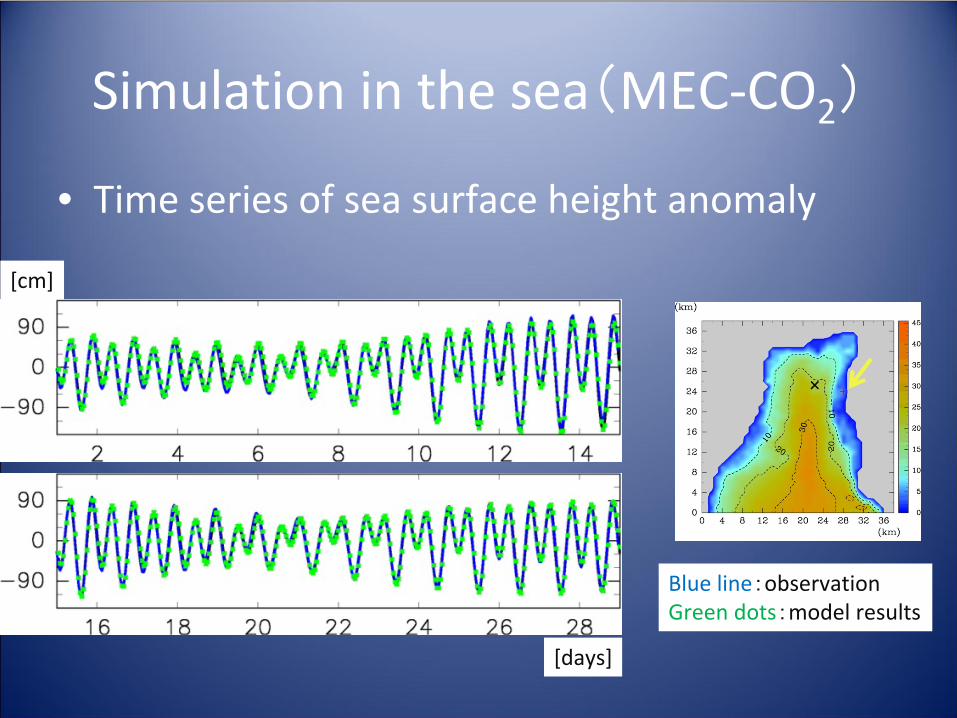
• Time series of sea surface height anomaly
Simulation in the sea(MEC‐CO2
)
Blue line:observationGreen dots:model results
[cm]
[days]
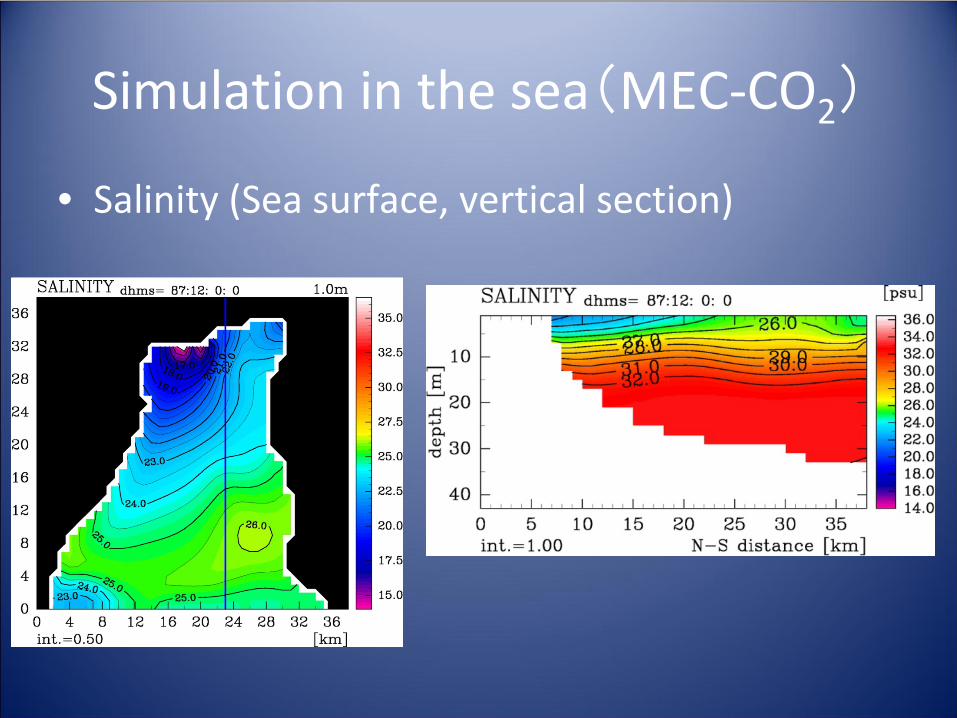
• Salinity (Sea surface, vertical section)
Simulation in the sea(MEC‐CO2
)
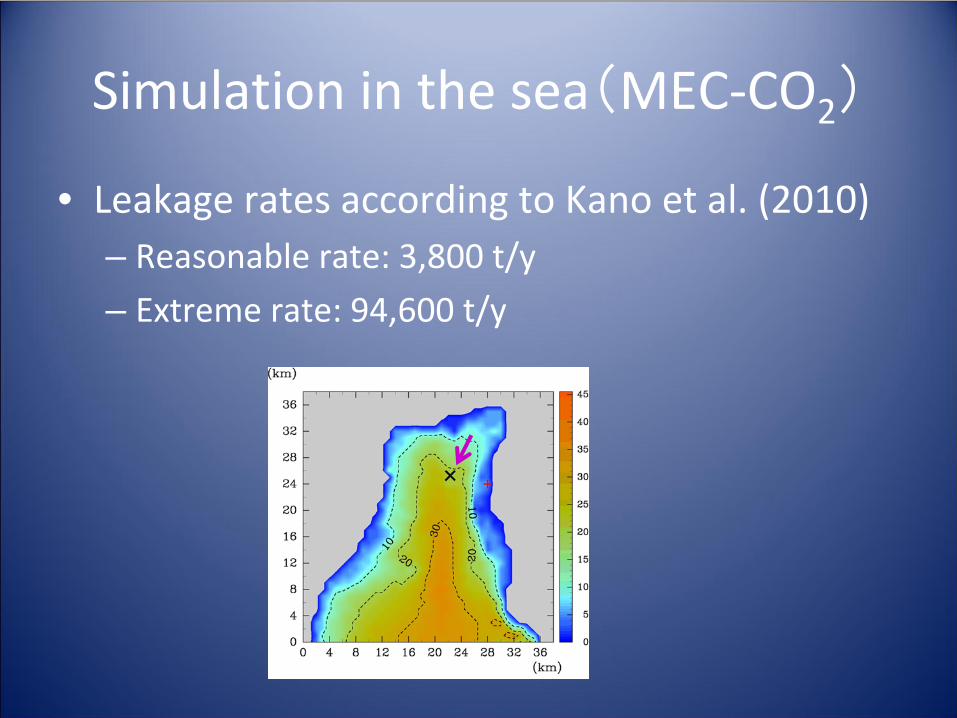
• Leakage rates according to Kano et al. (2010)– Reasonable rate: 3,800 t/y– Extreme rate: 94,600 t/y
Simulation in the sea(MEC‐CO2
)
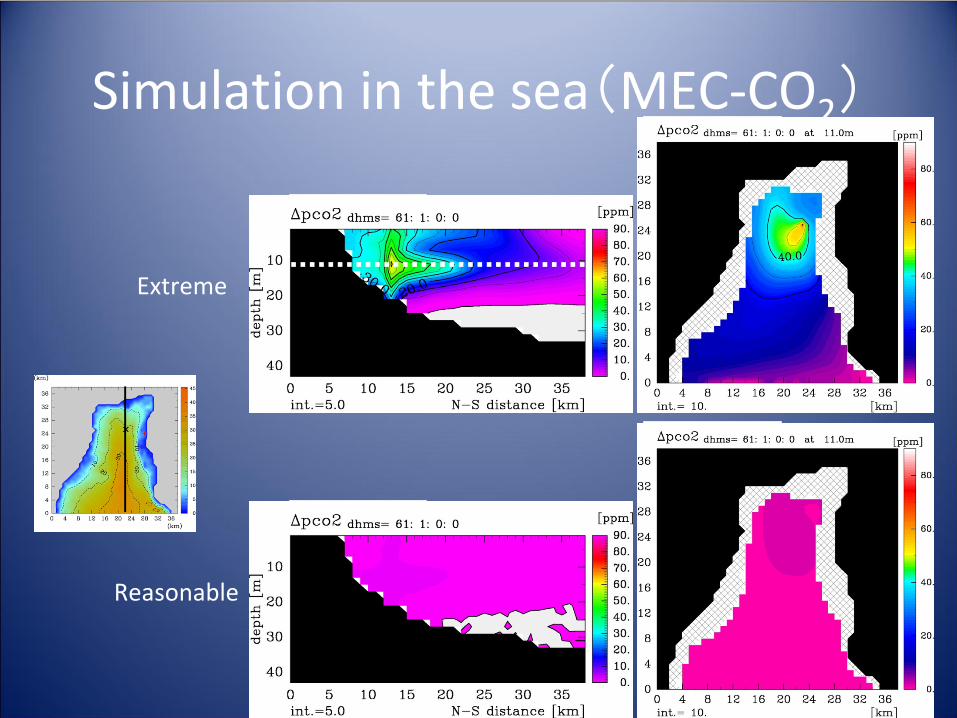
Simulation in the sea(MEC‐CO2
)
Extreme
Reasonable
Database of impact assessment on marine organisms
• Accumulating a database– Biological impacts of CO2
‐‐
pCO2
, or resultant pH change
– Species by species– Degrees of impacts; decease, growth problem,
etc.
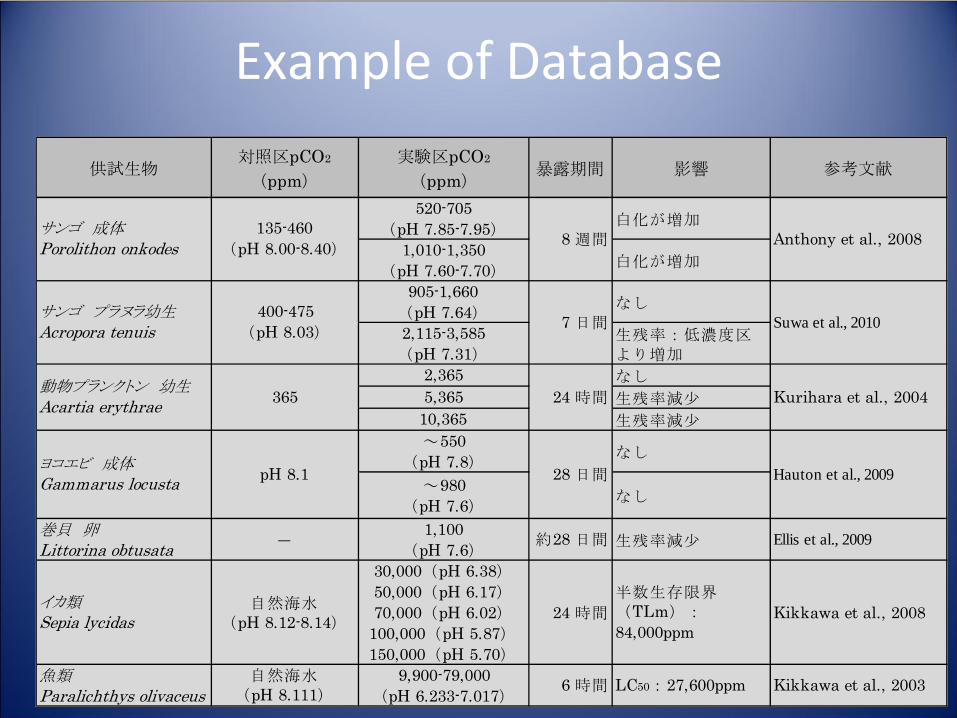
供試生物対照区pCO2
(ppm)
実験区pCO2
(ppm)暴露期間 影響 参考文献
520-705(pH 7.85-7.95) 白化が増加
1,010-1,350(pH 7.60-7.70) 白化が増加
905-1,660(pH 7.64) なし
2,115-3,585(pH 7.31)
生残率:低濃度区より増加
2,365 なし
5,365 生残率減少
10,365 生残率減少
~550(pH 7.8) なし
~980(pH 7.6) なし
巻貝 卵Littorina obtusata ― 1,100
(pH 7.6) 約28 日間 生残率減少 Ellis et al., 2009
イカ類Sepia lycidas
自然海水(pH 8.12-8.14)
30,000(pH 6.38)50,000(pH 6.17)70,000(pH 6.02)
100,000(pH 5.87)150,000(pH 5.70)
24 時間
半数生存限界(TLm):
84,000ppmKikkawa et al., 2008
魚類Paralichthys olivaceus
自然海水(pH 8.111)
9,900-79,000(pH 6.233-7.017)
6 時間 LC50:27,600ppm Kikkawa et al., 2003
365 24 時間 Kurihara et al., 2004動物プランクトン 幼生Acartia erythrae
ヨコエビ 成体Gammarus locusta
Anthony et al., 2008サンゴ 成体Porolithon onkodes
135-460(pH 8.00-8.40) 8 週間
Hauton et al., 2009pH 8.1 28 日間
Suwa et al., 2010サンゴ プラヌラ幼生Acropora tenuis
400-475(pH 8.03) 7 日間
Example of Database
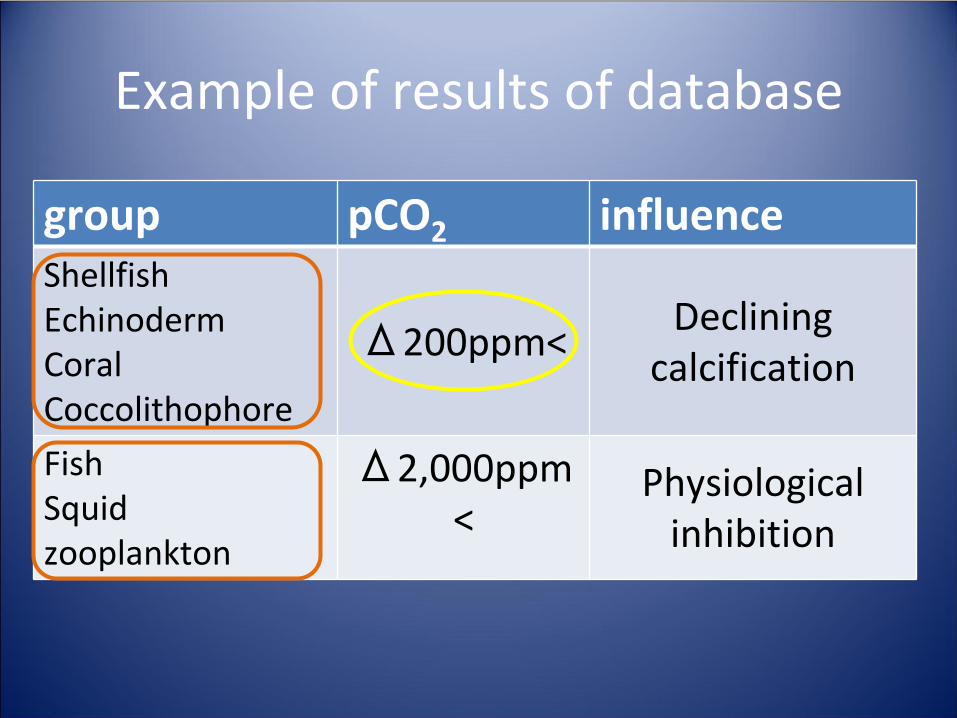
Example of results of database
group pCO2 influenceShellfishEchinodermCoralCoccolithophore
Δ200ppm<Declining
calcification
FishSquidzooplankton
Δ2,000ppm <Physiological
inhibition
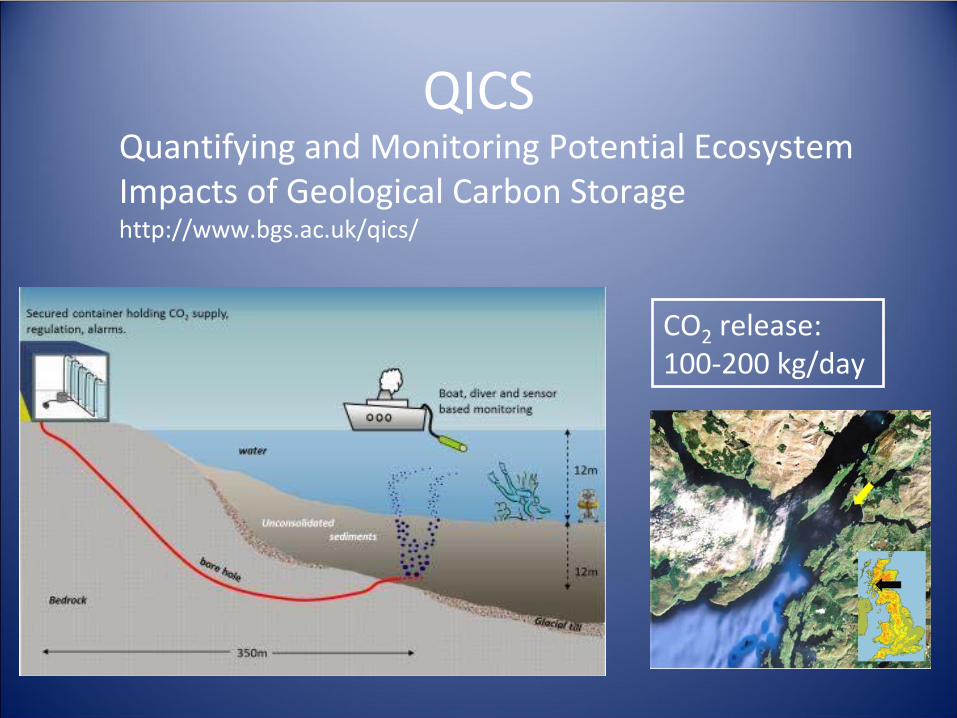
QICSQuantifying and Monitoring Potential EcosystemImpacts of Geological Carbon Storagehttp://www.bgs.ac.uk/qics/
CO2
release:100‐200 kg/day
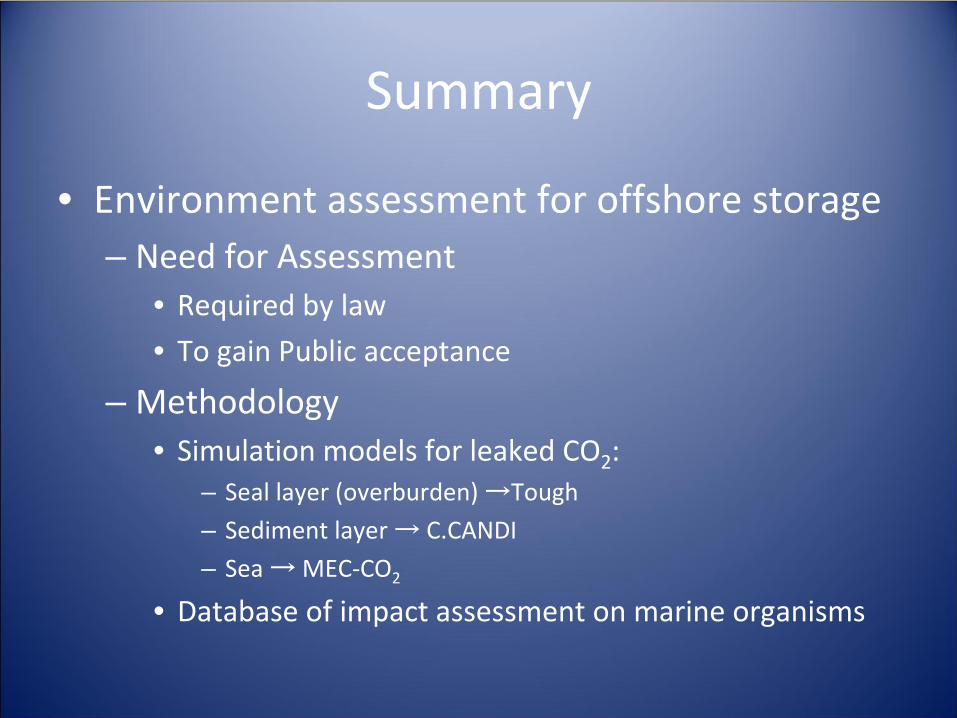
Summary
• Environment assessment for offshore storage– Need for Assessment
• Required by law• To gain Public acceptance
– Methodology • Simulation models for leaked CO2
: – Seal layer (overburden) →Tough
– Sediment layer → C.CANDI
– Sea → MEC‐CO2
• Database of impact assessment on marine organisms