Embed Size (px)
Citation preview
Annual Concrete Seminar 2013
18 April 2013
Dimensional Stability of Concrete
Ir Prof Albert K.H. KWAN
Professor, Department of Civil Engineering, The University of Hong Kong
1
Introduction
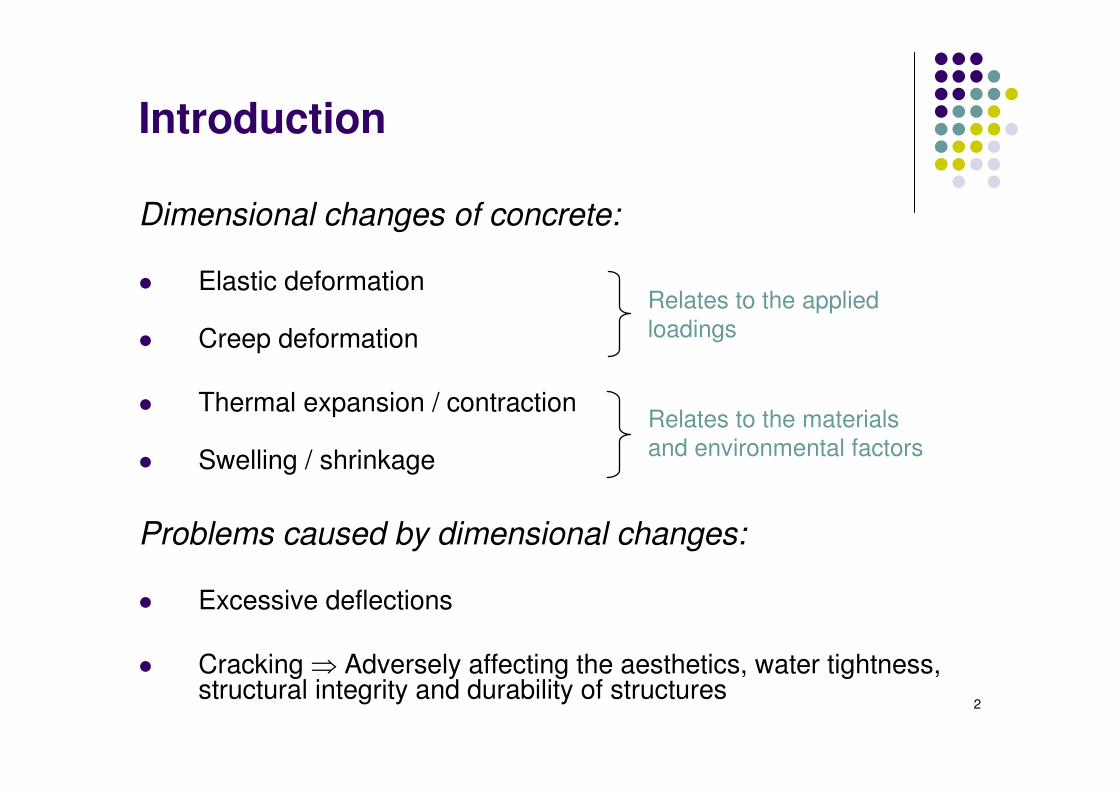
Dimensional changes of concrete:
. Elastic deformationRelates to the applied
loadings . Creep deformation
. Thermal expansion / contractionRelates to the materials
and environmental factors . Swelling / shrinkage
Problems caused by dimensional changes:
. Excessive deflections
. Cracking ⇒ Adversely affecting the aesthetics, water tightness, structural integrity and durability of structures
2
Introduction
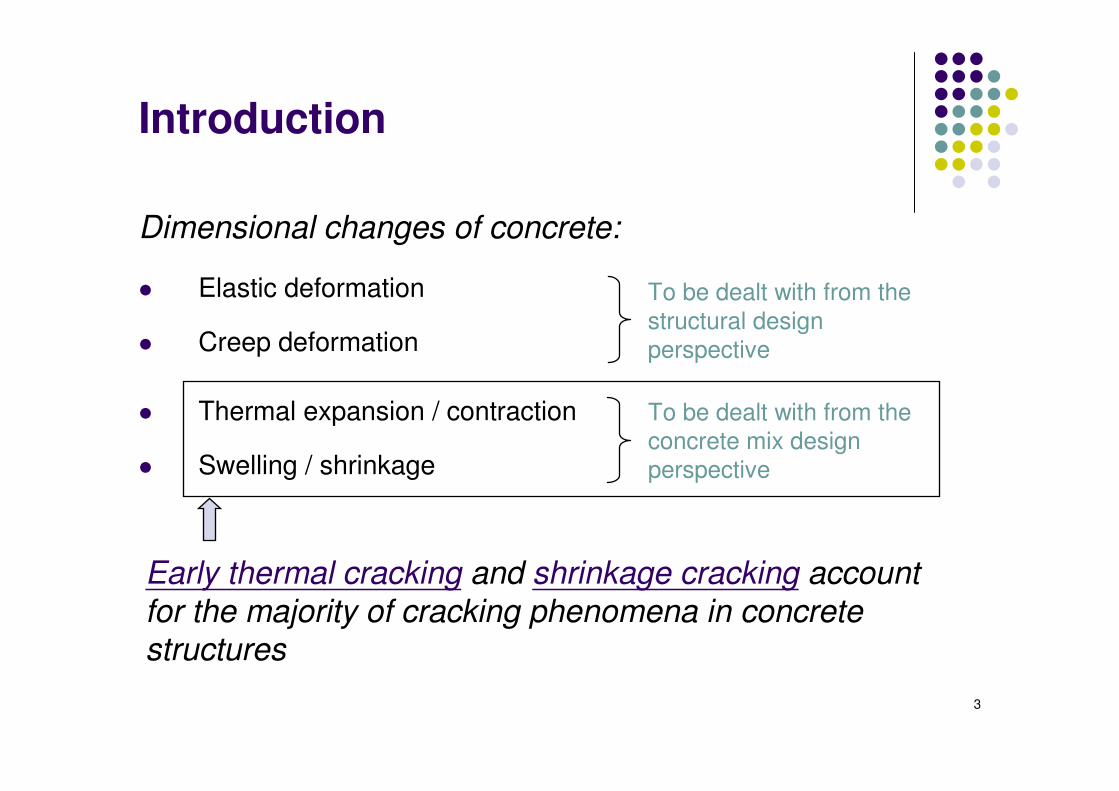
Dimensional changes of concrete:
. Elastic deformation To be dealt with from the
structural design . Creep deformation perspective
. Thermal expansion / contraction To be dealt with from the
concrete mix design . Swelling / shrinkage perspective
Early thermal cracking and shrinkage cracking account
for the majority of cracking phenomena in concrete structures
3
Introduction
Early thermal cracking:
. During curing, heat is generated from the chemical reactions of cementitious materials
. Temperature of curing concrete increases
. Heat dissipates in subsequence and causes the temperature to decrease eventually to the ambient
. Cracking may result if the thermal movement is restrained
Alleviation measures of early thermal cracking:
. Reduce the heat generation of concrete
. Apply internal cooling to the concrete
. Apply external heat insulation
. Add crack control steel 4

Introduction
Shrinkage cracking:
. Mainly due to drying shrinkage
. Water gradually evaporates from concrete and leads to reduction in volume
. Cracking may result if the shrinkage movement is restrained
Alleviation measures of shrinkage cracking:
. Reduce the drying shrinkage of concrete mix
. Provide movement joints
. Provide late cast strips
. Add crack control steel
5
Introduction
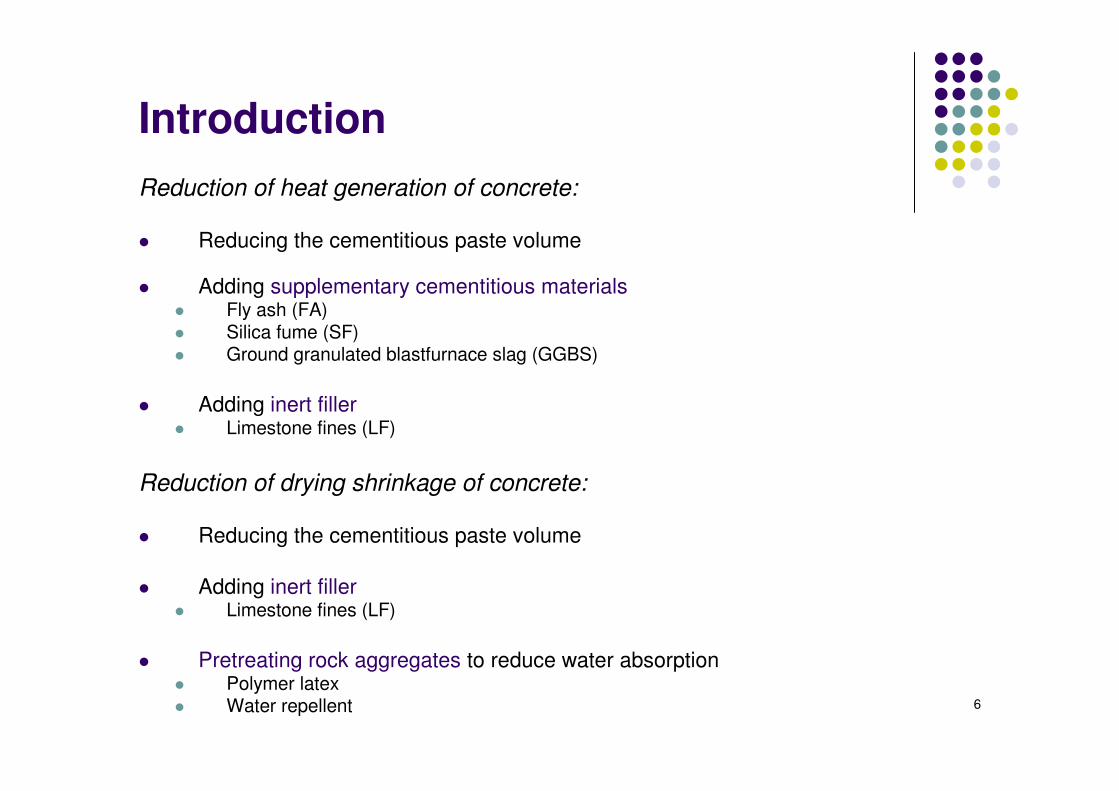
Reduction of heat generation of concrete:
. Reducing the cementitious paste volume
. Adding supplementary cementitious materials. Fly ash (FA). Silica fume (SF). Ground granulated blastfurnace slag (GGBS)
. Adding inert filler. Limestone fines (LF)
Reduction of drying shrinkage of concrete:
. Reducing the cementitious paste volume
. Adding inert filler. Limestone fines (LF)
. Pretreating rock aggregates to reduce water absorption. Polymer latex. Water repellent 6
Introduction
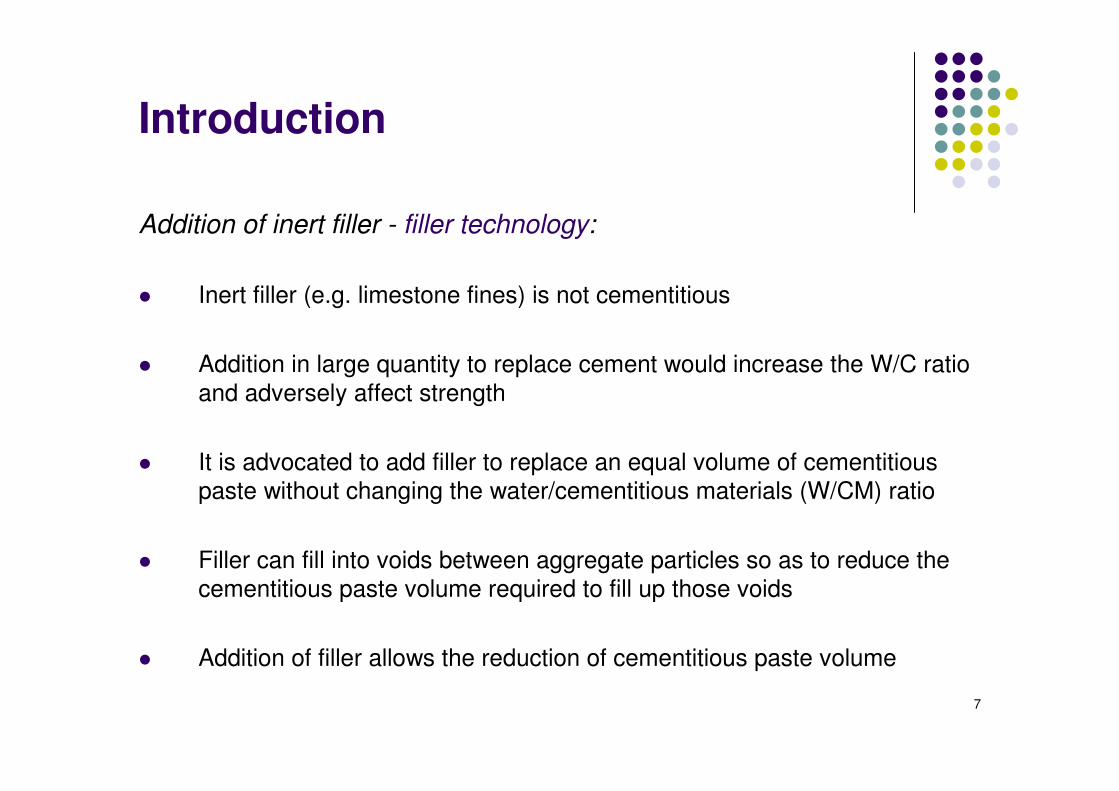
Addition of inert filler - filler technology:
. Inert filler (e.g. limestone fines) is not cementitious
. Addition in large quantity to replace cement would increase the W/C ratio
and adversely affect strength
. It is advocated to add filler to replace an equal volume of cementitious
paste without changing the water/cementitious materials (W/CM) ratio
. Filler can fill into voids between aggregate particles so as to reduce the
cementitious paste volume required to fill up those voids
. Addition of filler allows the reduction of cementitious paste volume
7
Experimental Programme
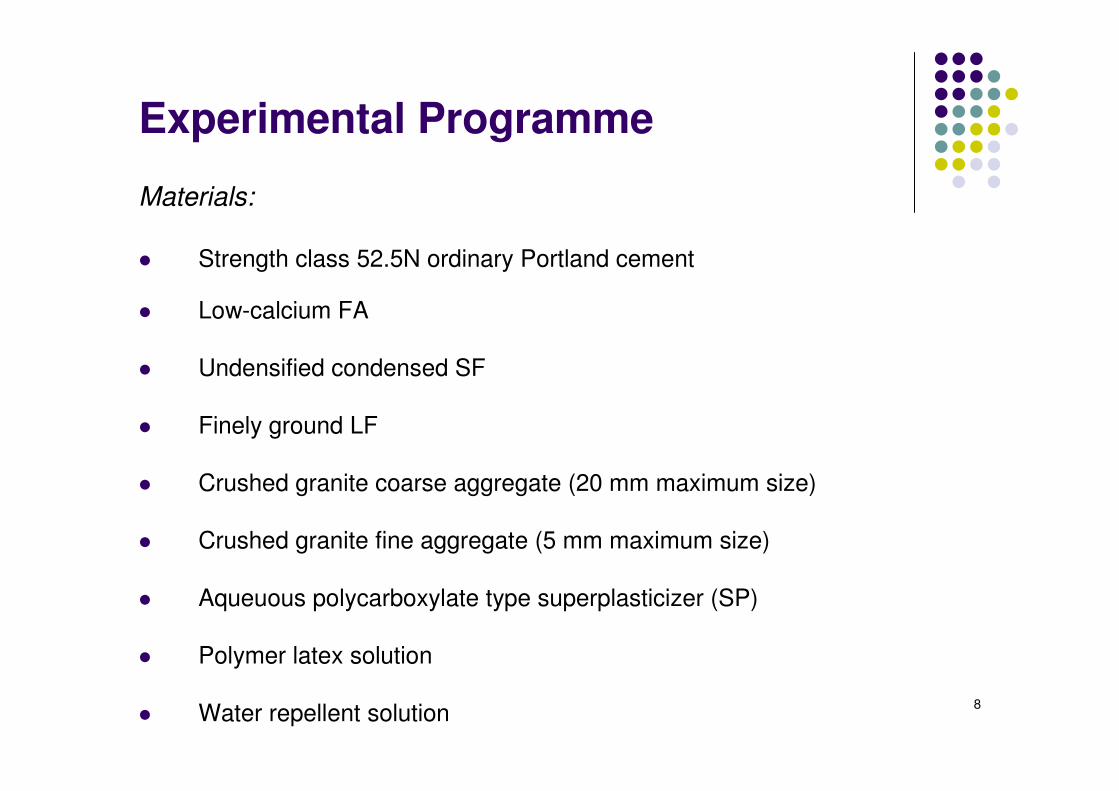
Materials:
.
.
Strength class 52.5N ordinary Portland cement
Low-calcium FA
. Undensified condensed SF
. Finely ground LF
. Crushed granite coarse aggregate (20 mm maximum size)
. Crushed granite fine aggregate (5 mm maximum size)
. Aqueuous polycarboxylate type superplasticizer (SP)
.
.
Polymer latex solution
Water repellent solution 8
Experimental Programme
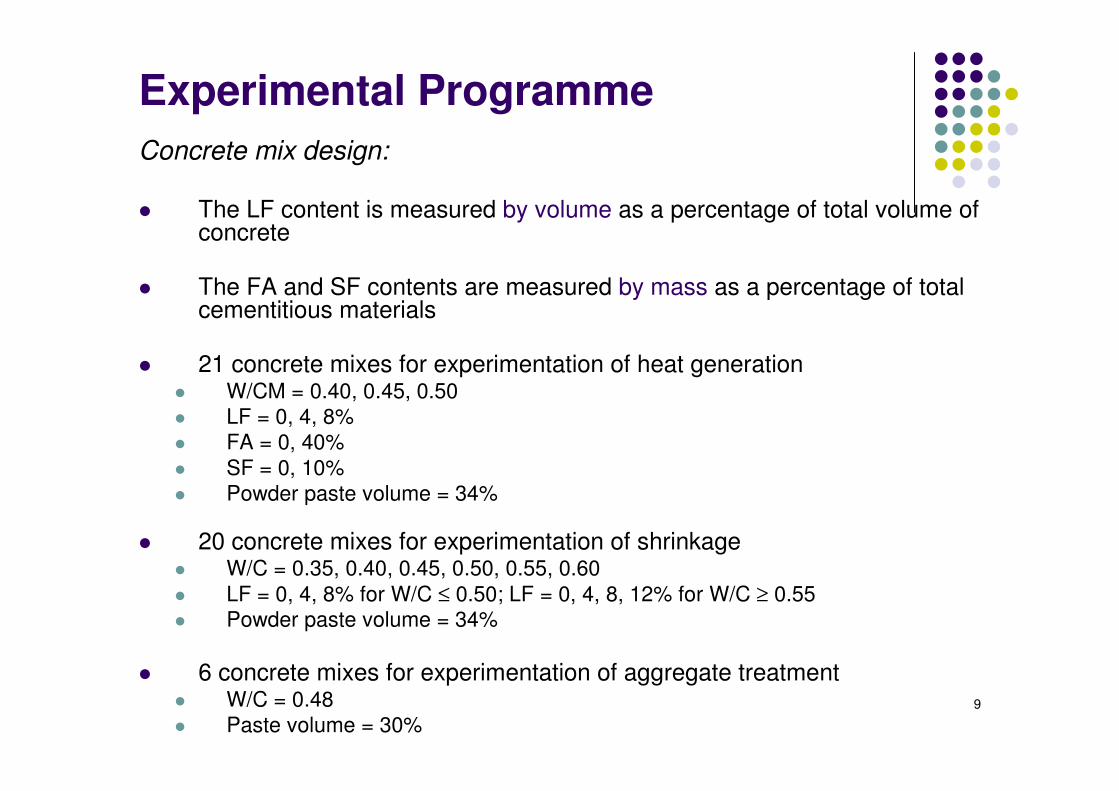
Concrete mix design:
. The LF content is measured by volume as a percentage of total volume of concrete
. The FA and SF contents are measured by mass as a percentage of total cementitious materials
. 21 concrete mixes for experimentation of heat generation. W/CM = 0.40, 0.45, 0.50
. LF = 0, 4, 8%
. FA = 0, 40%
. SF = 0, 10%
. Powder paste volume = 34%
. 20 concrete mixes for experimentation of shrinkage. W/C = 0.35, 0.40, 0.45, 0.50, 0.55, 0.60
. LF = 0, 4, 8% for W/C ≤ 0.50; LF = 0, 4, 8, 12% for W/C ≥ 0.55. Powder paste volume = 34%
. 6 concrete mixes for experimentation of aggregate treatment. W/C = 0.48 9
. Paste volume = 30%
10
--
- - -
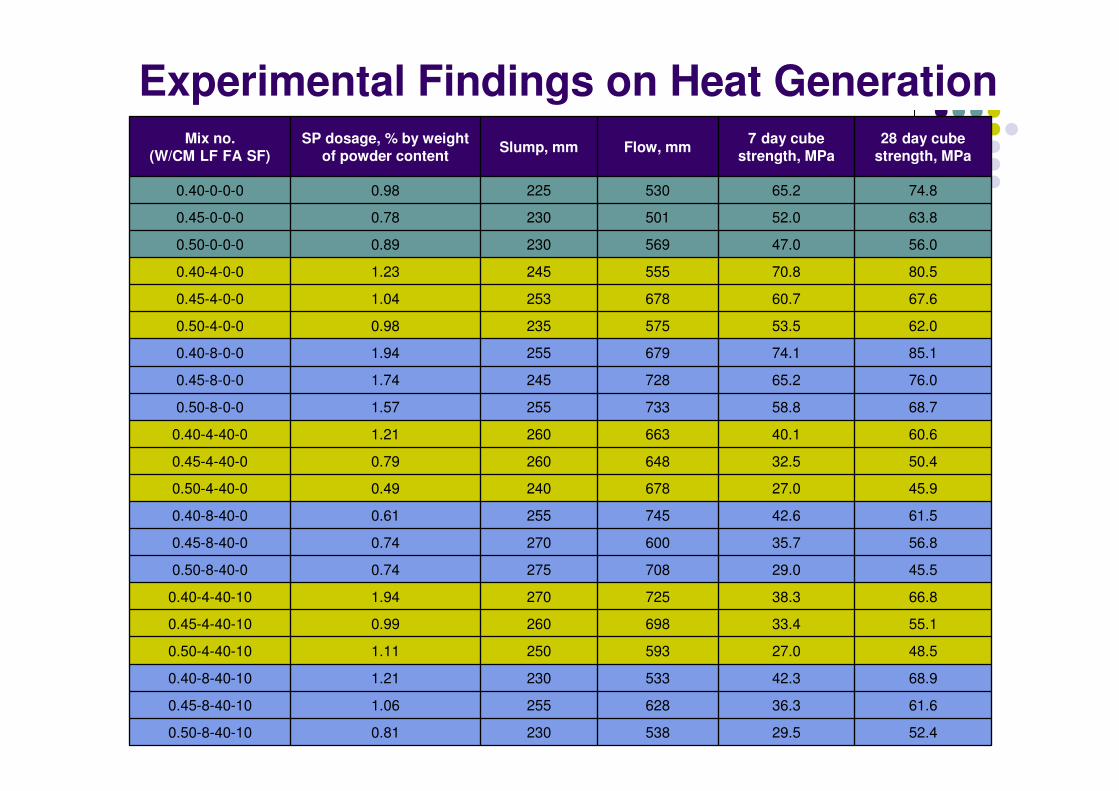
Experimental Findings on Heat Generation
52.4 29.5 538 230 0.81 0.50-8-40-10
61.6 36.3 628 255 1.06 0.45-8-40-10
68.9 42.3 533 230 1.21 0.40-8-40-10
48.5 27.0 593 250 1.11 0.50-4-40-10
55.1 33.4 698 260 0.99 0.45-4-40-10
66.8 38.3 725 270 1.94 0.40-4-40-10
45.5 29.0 708 275 0.74 0.50-8-40-0
56.8 35.7 600 270 0.74 0.45-8-40-0
61.5 42.6 745 255 0.61 0.40-8-40-0
45.9 27.0 678 240 0.49 0.50-4-40-0
50.4 32.5 648 260 0.79 0.45-4-40-0
60.6 40.1 663 260 1.21 0.40-4-40-0
68.7 58.8 733 255 1.57 0.50-8-0-0
76.0 65.2 728 245 1.74 0.45-8-0-0
85.1 74.1 679 255 1.94 0.40-8-0-0
62.0 53.5 575 235 0.98 0.50-4-0-0
67.6 60.7 678 253 1.04 0.45-4-0-0
80.5 70.8 555 245 1.23 0.40-4-0-0
56.0 47.0 569 230 0.89 0.50-0-0-0
63.8 52.0 501 230 0.78 0.45-0-0-0
74.8 65.2 530 225 0.98 0.40-0-0-0
28 day cube strength, MPa
7 day cube strength, MPa
Flow, mm Slump, mm SP dosage, % by weight
of powder content Mix no.
(W/CM LF FA SF)
11
°°°°
°°°°
°°°°
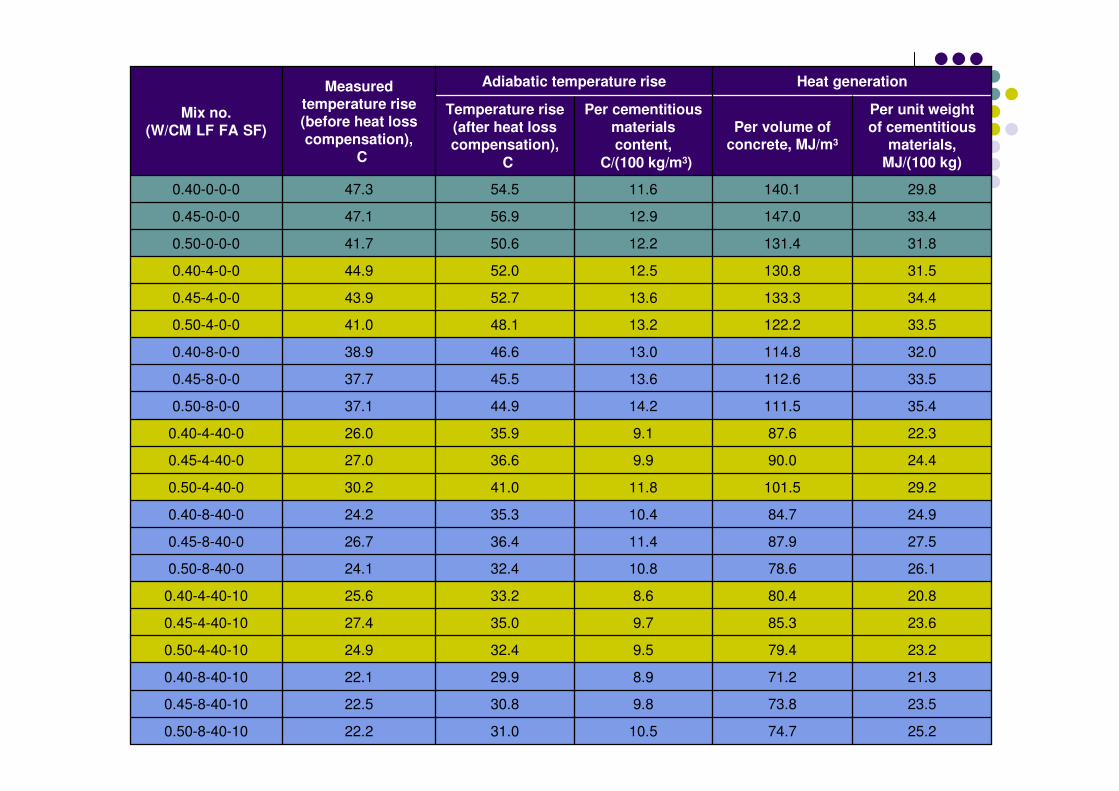
- - -
25.2 74.7 10.5 31.0 22.2 0.50-8-40-10
23.5 73.8 9.8 30.8 22.5 0.45-8-40-10
21.3 71.2 8.9 29.9 22.1 0.40-8-40-10
23.2 79.4 9.5 32.4 24.9 0.50-4-40-10
23.6 85.3 9.7 35.0 27.4 0.45-4-40-10
20.8 80.4 8.6 33.2 25.6 0.40-4-40-10
26.1 78.6 10.8 32.4 24.1 0.50-8-40-0
27.5 87.9 11.4 36.4 26.7 0.45-8-40-0
24.9 84.7 10.4 35.3 24.2 0.40-8-40-0
29.2 101.5 11.8 41.0 30.2 0.50-4-40-0
24.4 90.0 9.9 36.6 27.0 0.45-4-40-0
22.3 87.6 9.1 35.9 26.0 0.40-4-40-0
35.4 111.5 14.2 44.9 37.1 0.50-8-0-0
33.5 112.6 13.6 45.5 37.7 0.45-8-0-0
32.0 114.8 13.0 46.6 38.9 0.40-8-0-0
33.5 122.2 13.2 48.1 41.0 0.50-4-0-0
34.4 133.3 13.6 52.7 43.9 0.45-4-0-0
31.5 130.8 12.5 52.0 44.9 0.40-4-0-0
31.8 131.4 12.2 50.6 41.7 0.50-0-0-0
33.4 147.0 12.9 56.9 47.1 0.45-0-0-0
29.8 140.1 11.6 54.5 47.3 0.40-0-0-0
Per unit weight
of cementitious materials,
MJ/(100 kg)
Per volume of concrete, MJ/m3
Per cementitious
materials content,
C/(100 kg/m3)
Temperature rise
(after heat loss compensation),
C
Heat generation Adiabatic temperature rise Measured temperature rise (before heat loss
compensation),
C
Mix no.
(W/CM LF FA SF)
12
20
40
60
Ad
iab
ati
c te
mp
era
ture
ris
e ( °C
)
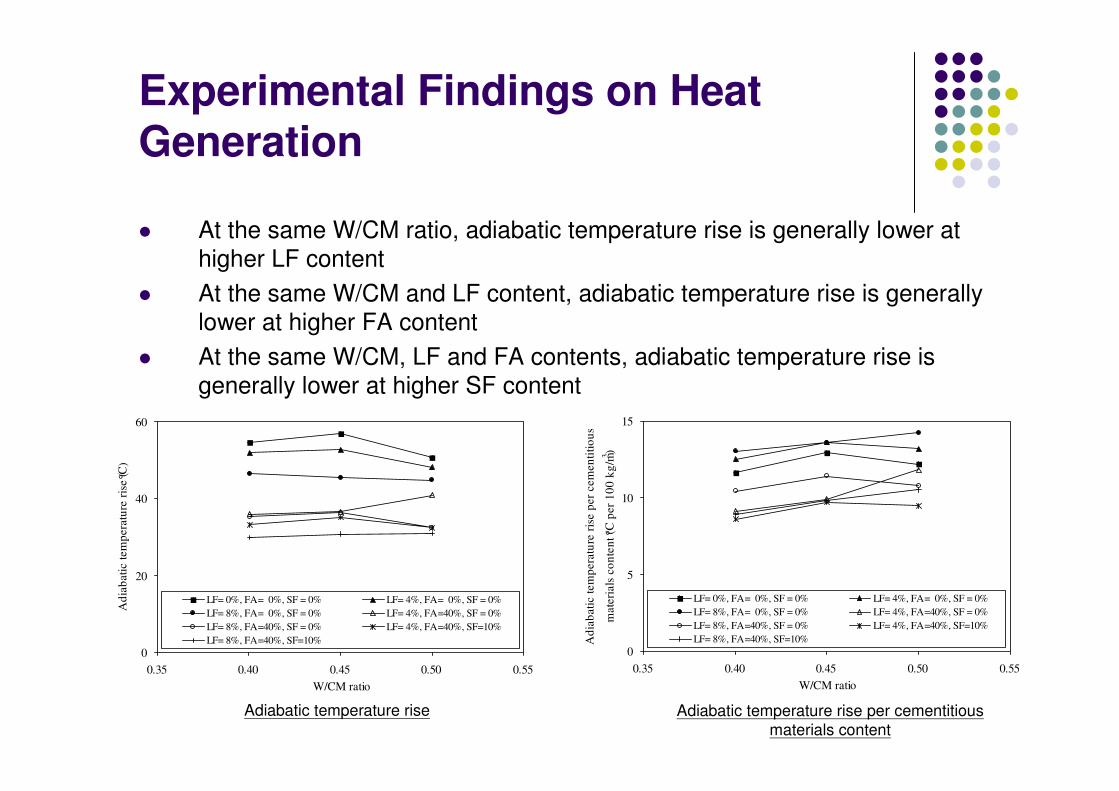
Experimental Findings on Heat Generation
. At the same W/CM ratio, adiabatic temperature rise is generally lower at
higher LF content
. At the same W/CM and LF content, adiabatic temperature rise is generally
lower at higher FA content
. At the same W/CM, LF and FA contents, adiabatic temperature rise is
generally lower at higher SF content
15
LF= 0%, FA= 0%, SF = 0% LF= 4%, FA= 0%, SF = 0%
LF= 8%, FA= 0%, SF = 0% LF= 4%, FA=40%, SF = 0%
LF= 8%, FA=40%, SF = 0% LF= 4%, FA=40%, SF=10%
LF= 8%, FA=40%, SF=10% Ad
iab
ati
c te
mp
era
ture
ris
e p
er
cem
en
titi
ou
s.
mate
rials
co
nte
nt
( °C p
er
10
0 k
g/m
3)
10
5
LF= 0%, FA= 0%, SF = 0% LF= 4%, FA= 0%, SF = 0%
LF= 8%, FA= 0%, SF = 0% LF= 4%, FA=40%, SF = 0%
LF= 8%, FA=40%, SF = 0% LF= 4%, FA=40%, SF=10%
LF= 8%, FA=40%, SF=10%
00
0.35 0.40 0.45 0.50 0.55 0.35 0.40 0.45 0.50 0.55
W/CM ratio W/CM ratio
Adiabatic temperature rise Adiabatic temperature rise per cementitious
materials content
te
13
50
100
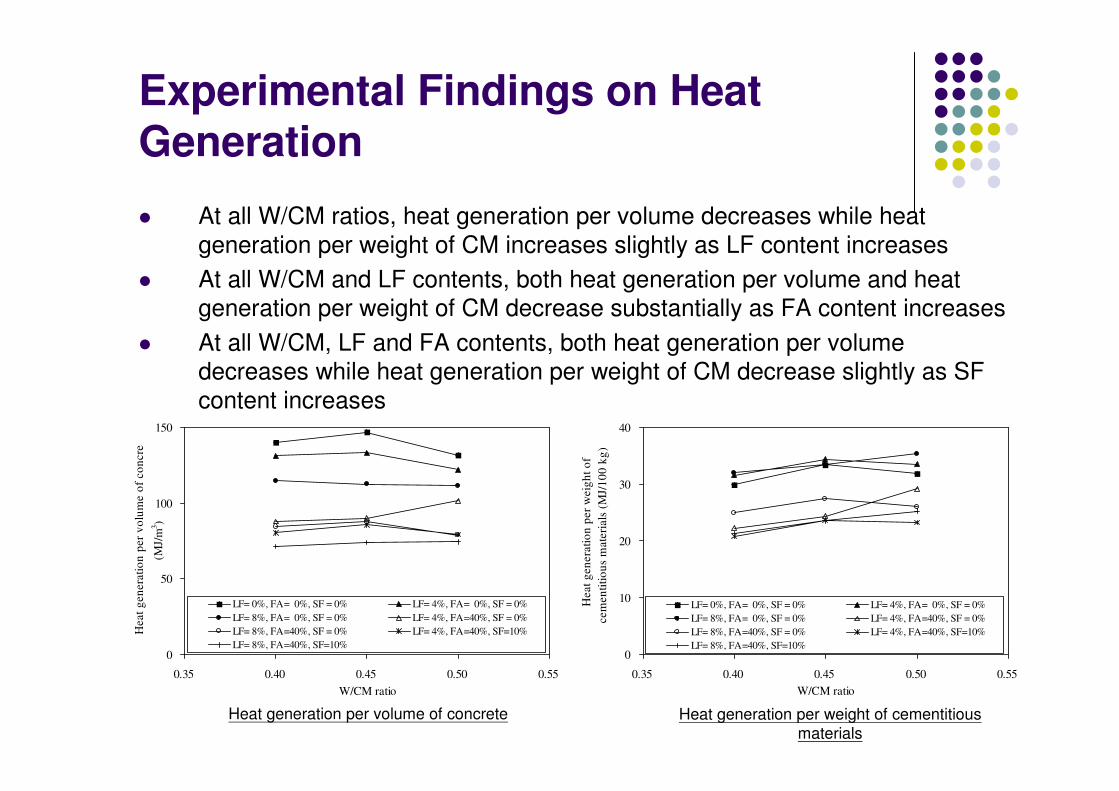
Experimental Findings on Heat Generation
. At all W/CM ratios, heat generation per volume decreases while heat
generation per weight of CM increases slightly as LF content increases
. At all W/CM and LF contents, both heat generation per volume and heat
generation per weight of CM decrease substantially as FA content increases
. At all W/CM, LF and FA contents, both heat generation per volume
decreases while heat generation per weight of CM decrease slightly as SF
content increases 150 40
Heat
gen
era
tio
n p
er
vo
lum
e o
f co
ncre
(MJ/
m3
)
LF= 0%, FA= 0%, SF = 0% LF= 4%, FA= 0%, SF = 0%
LF= 8%, FA= 0%, SF = 0% LF= 4%, FA=40%, SF = 0%
LF= 8%, FA=40%, SF = 0% LF= 4%, FA=40%, SF=10%
LF= 8%, FA=40%, SF=10%
Heat
gen
era
tio
n p
er
weig
ht
of
cem
en
titi
ou
s m
ate
rials
(M
J/1
00 k
g) .
LF= 0%, FA= 0%, SF = 0% LF= 4%, FA= 0%, SF = 0%
LF= 8%, FA= 0%, SF = 0% LF= 4%, FA=40%, SF = 0%
LF= 8%, FA=40%, SF = 0% LF= 4%, FA=40%, SF=10%
LF= 8%, FA=40%, SF=10%
30
20
10
0
0.35 0.40 0.45 0.50 0.55
W/CM ratio
0.35 0.40 0.45 0.50 0.55
W/CM ratio
Heat generation per volume of concrete Heat generation per weight of cementitious
materials
0
)
40
60
80
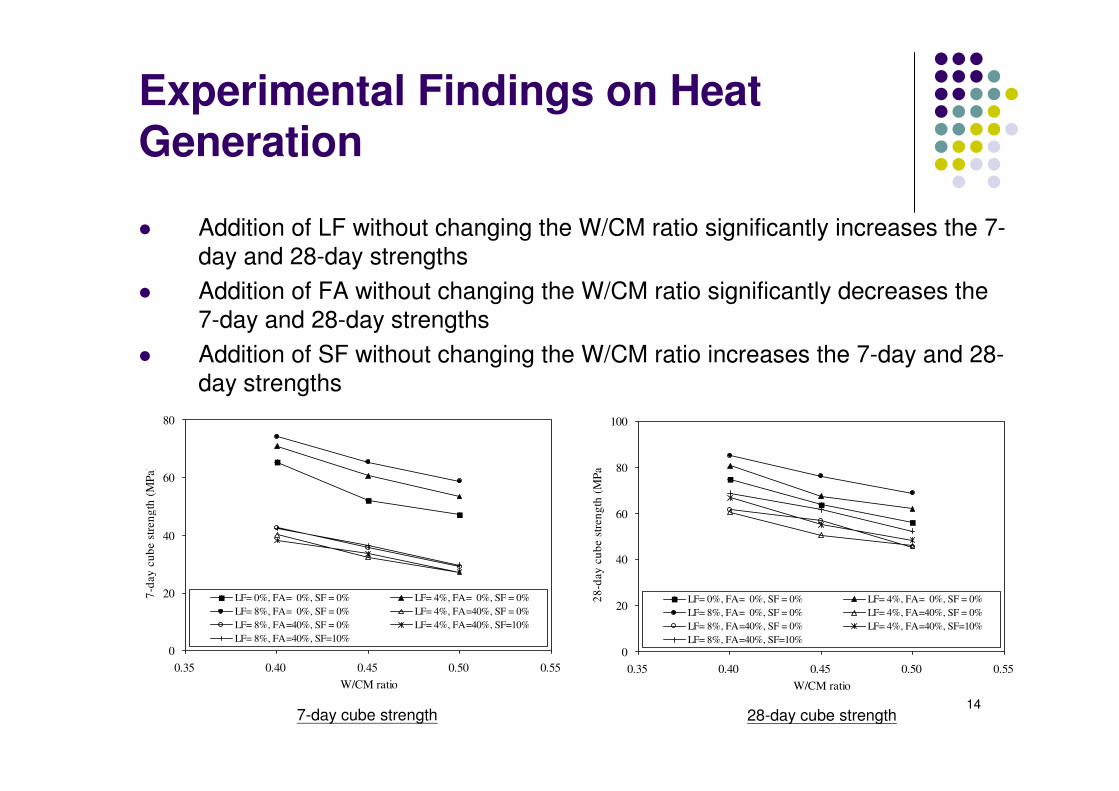
Experimental Findings on Heat Generation
. Addition of LF without changing the W/CM ratio significantly increases the 7
day and 28-day strengths
. Addition of FA without changing the W/CM ratio significantly decreases the
7-day and 28-day strengths
. Addition of SF without changing the W/CM ratio increases the 7-day and 28
day strengths
100
LF= 0%, FA= 0%, SF = 0% LF= 4%, FA= 0%, SF = 0%
LF= 8%, FA= 0%, SF = 0% LF= 4%, FA=40%, SF = 0%
LF= 8%, FA=40%, SF = 0% LF= 4%, FA=40%, SF=10%
LF= 8%, FA=40%, SF=10%
LF= 0%, FA= 0%, SF = 0% LF= 4%, FA= 0%, SF = 0%
LF= 8%, FA= 0%, SF = 0% LF= 4%, FA=40%, SF = 0%
LF= 8%, FA=40%, SF = 0% LF= 4%, FA=40%, SF=10%
LF= 8%, FA=40%, SF=10%
7-d
ay c
ub
e st
ren
gth
(M
Pa) 80
28
-day c
ub
e st
ren
gth
(M
Pa
60
40
20
0 0
0.35 0.40 0.45 0.50 0.55 0.35 0.40 0.45 0.50 0.55
W/CM ratio W/CM ratio
14 7-day cube strength 28-day cube strength
20
te
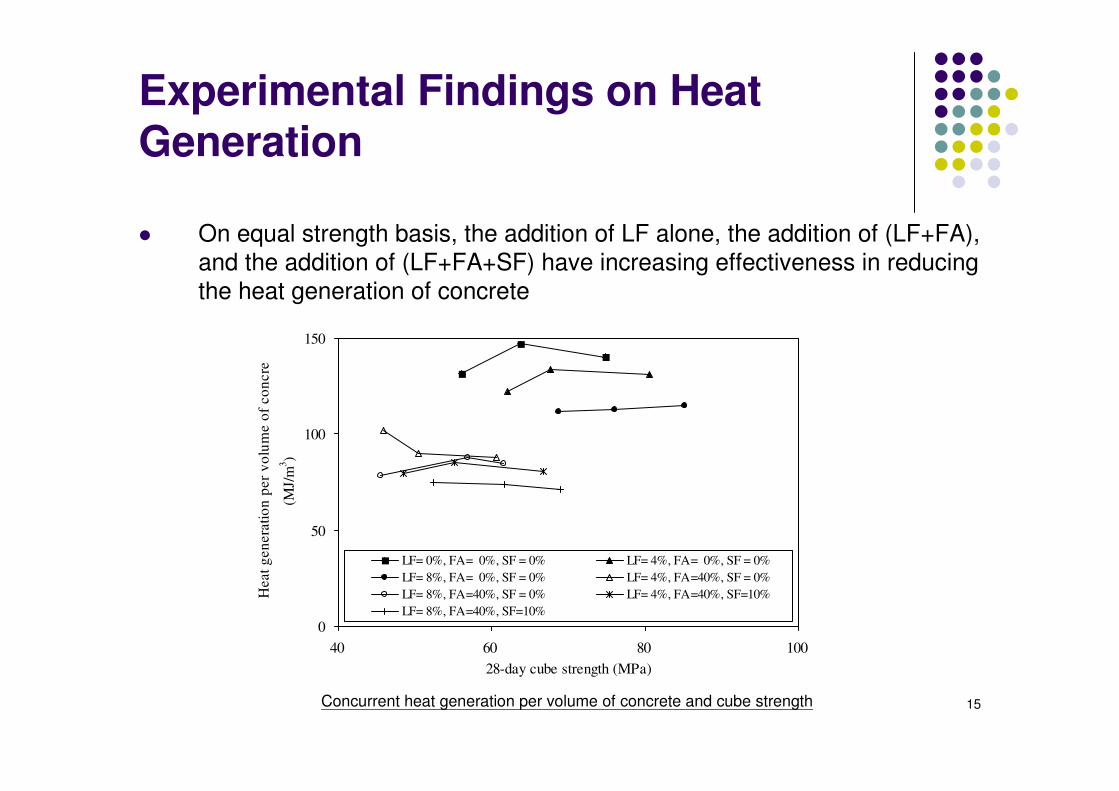
Experimental Findings on Heat Generation
. On equal strength basis, the addition of LF alone, the addition of (LF+FA),
and the addition of (LF+FA+SF) have increasing effectiveness in reducing
the heat generation of concrete
150
100
50
0
40 60 80 100
28-day cube strength (MPa)
LF= 0%, FA= 0%, SF = 0% LF= 4%, FA= 0%, SF = 0%
LF= 8%, FA= 0%, SF = 0% LF= 4%, FA=40%, SF = 0%
LF= 8%, FA=40%, SF = 0% LF= 4%, FA=40%, SF=10%
LF= 8%, FA=40%, SF=10%
Heat
gen
era
tio
n p
er
vo
lum
e o
f co
ncre
3(M
J/m
)
Concurrent heat generation per volume of concrete and cube strength 15
16
- -
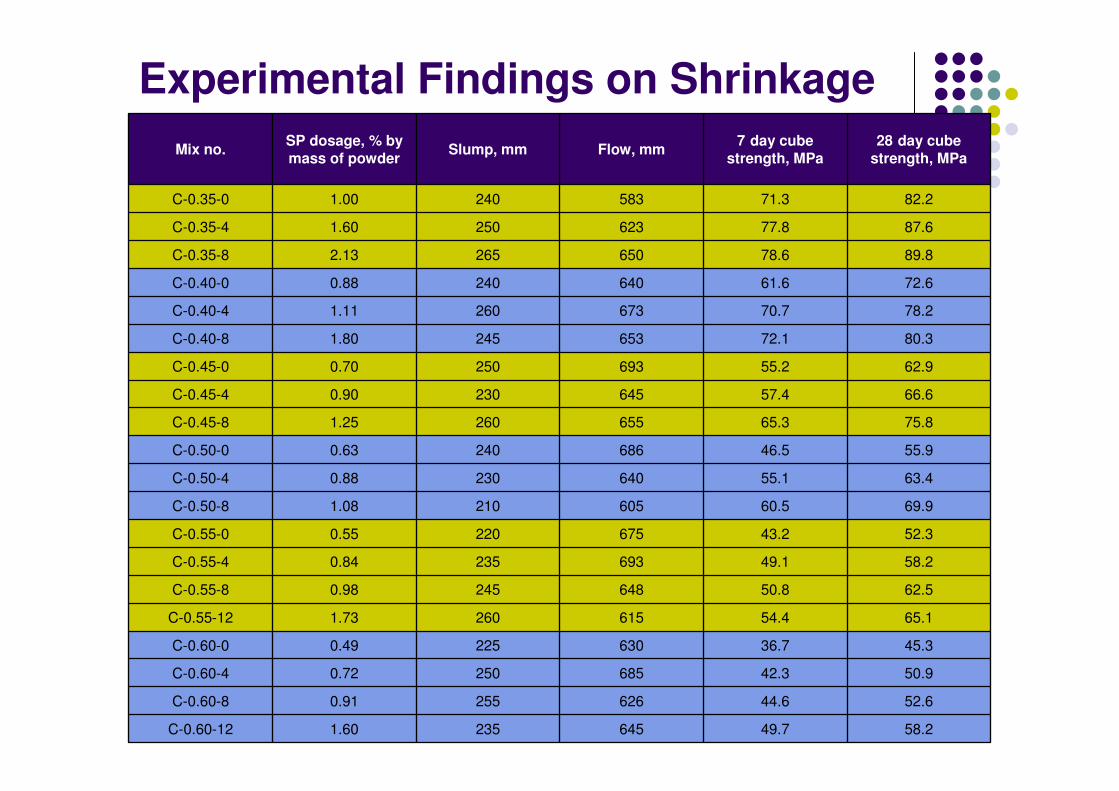
Experimental Findings on Shrinkage
58.2 49.7 645 235 1.60 C-0.60-12
52.6 44.6 626 255 0.91 C-0.60-8
50.9 42.3 685 250 0.72 C-0.60-4
45.3 36.7 630 225 0.49 C-0.60-0
65.1 54.4 615 260 1.73 C-0.55-12
62.5 50.8 648 245 0.98 C-0.55-8
58.2 49.1 693 235 0.84 C-0.55-4
52.3 43.2 675 220 0.55 C-0.55-0
69.9 60.5 605 210 1.08 C-0.50-8
63.4 55.1 640 230 0.88 C-0.50-4
55.9 46.5 686 240 0.63 C-0.50-0
75.8 65.3 655 260 1.25 C-0.45-8
66.6 57.4 645 230 0.90 C-0.45-4
62.9 55.2 693 250 0.70 C-0.45-0
80.3 72.1 653 245 1.80 C-0.40-8
78.2 70.7 673 260 1.11 C-0.40-4
72.6 61.6 640 240 0.88 C-0.40-0
89.8 78.6 650 265 2.13 C-0.35-8
87.6 77.8 623 250 1.60 C-0.35-4
82.2 71.3 583 240 1.00 C-0.35-0
28 day cube
strength, MPa
7 day cube
strength, MPa Flow, mm Slump, mm
SP dosage, % by
mass of powder Mix no.
17
-
-
-
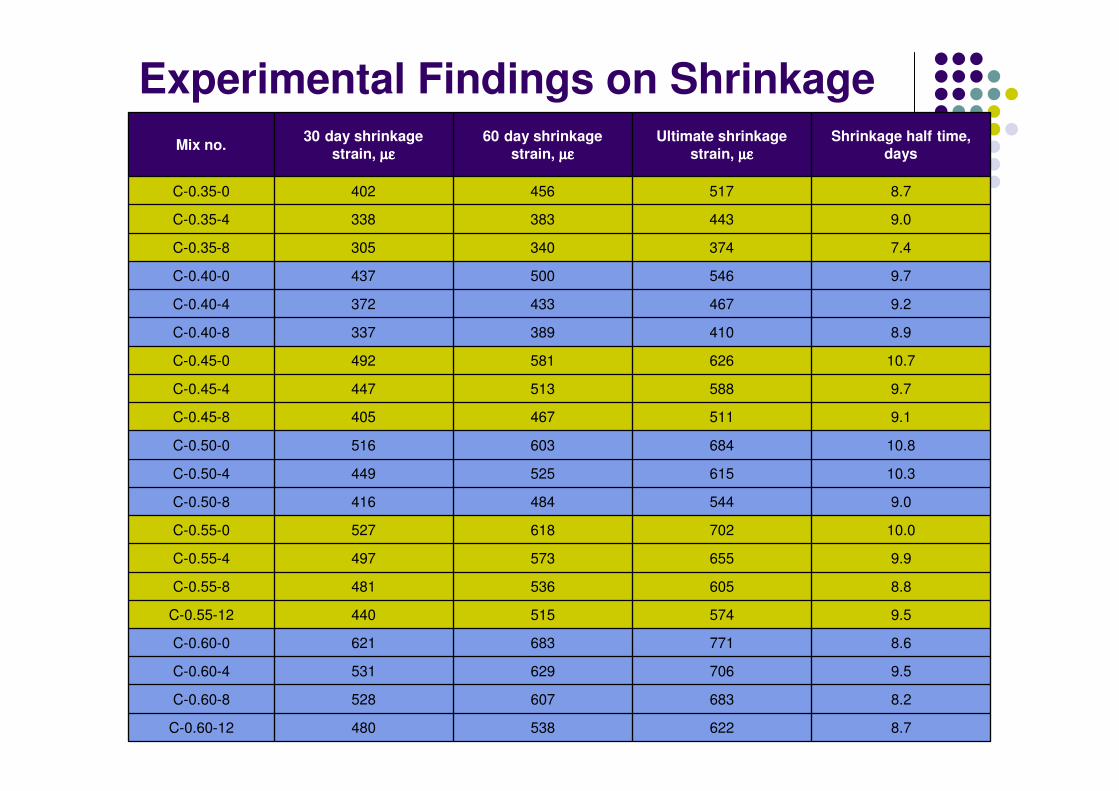
Experimental Findings on Shrinkage
8.7622538480C-0.60-12
8.2683607528C-0.60-8
9.5706629531C-0.60-4
8.6771683621C-0.60-0
9.5574515440C-0.55-12
8.8605536481C-0.55-8
9.9655573497C-0.55-4
10.0702618527C-0.55-0
9.0544484416C-0.50-8
10.3615525449C-0.50-4
10.8684603516C-0.50-0
9.1511467405C-0.45-8
9.7588513447C-0.45-4
10.7626581492C-0.45-0
8.9410389337C-0.40-8
9.2467433372C-0.40-4
9.7546500437C-0.40-0
7.4374340305C-0.35-8
9.0443383338C-0.35-4
8.7517456402C-0.35-0
Shrinkage half time, days
Ultimate shrinkage
strain, µεµεµεµε 60 day shrinkage
strain, µεµεµεµε 30 day shrinkage
strain, µεµεµεµε Mix no.
18
400
800
Experimental Findings on Shrinkage
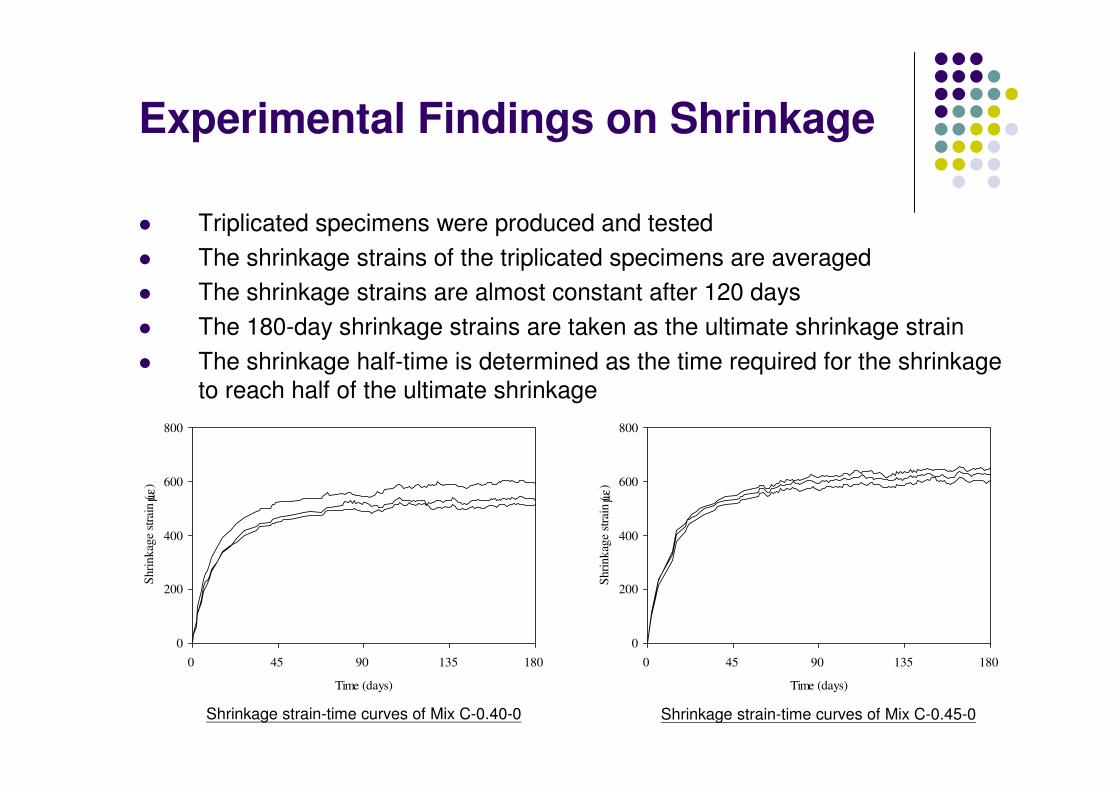
. Triplicated specimens were produced and tested
. The shrinkage strains of the triplicated specimens are averaged
. The shrinkage strains are almost constant after 120 days
. The 180-day shrinkage strains are taken as the ultimate shrinkage strain
. The shrinkage half-time is determined as the time required for the shrinkage
to reach half of the ultimate shrinkage
800
Shri
nkag
e st
rain
( µε) 600
Shri
nkag
e st
rain
( µε) 600
400
200 200
0 0
Shrinkage strain-time curves of Mix C-0.40-0 Shrinkage strain-time curves of Mix C-0.45-0
0 45 90 135 180
Time (days)
0 45 90 135 180
Time (days)
)
Experimental Findings on Shrinkage
.
.
.
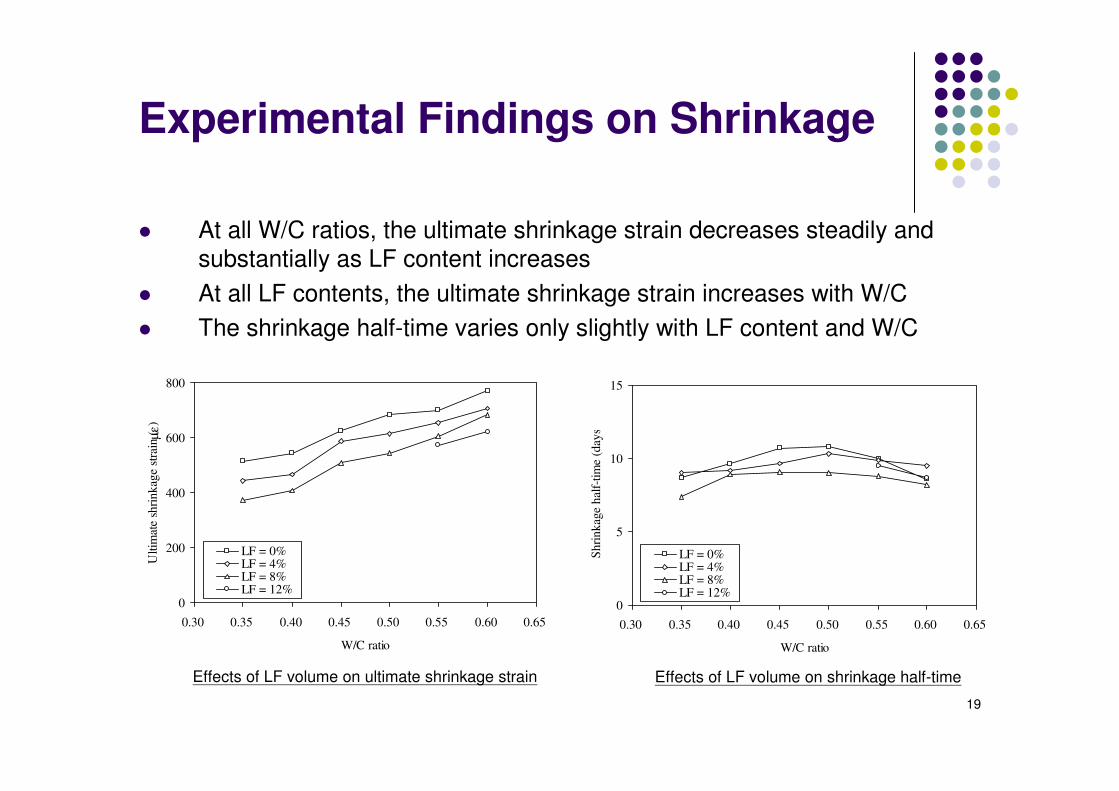
At all W/C ratios, the ultimate shrinkage strain decreases steadily and
substantially as LF content increases
At all LF contents, the ultimate shrinkage strain increases with W/C
The shrinkage half-time varies only slightly with LF content and W/C
800 15
0
200
400
600
LF = 0% LF = 4% LF = 8% LF = 12%
0
5
10
LF = 0% LF = 4% LF = 8% LF = 12%
Ult
imat
e sh
rin
kag
e st
rain
( µε
)
Sh
rin
kag
e h
alf-
tim
e (d
ays
0.30 0.35 0.40 0.45 0.50 0.55 0.60 0.65
W/C ratio
0.30 0.35 0.40 0.45 0.50 0.55 0.60 0.65
W/C ratio
Effects of LF volume on ultimate shrinkage strain Effects of LF volume on shrinkage half-time
19

Experimental Findings on Shrinkage
. The reduction in shrinkage strain resulted from addition of LF is generally
larger at lower W/C ratio, and can amount to as much as 28%
40
30
20
10
Red
uct
ion i
n u
ltim
ate
shri
nkag
e st
rain
(%
) .
0
LF = 4%
LF = 8%
LF = 12%
0.30 0.35 0.40 0.45 0.50 0.55 0.60 0.65
W/C ratio
Percentage reduction in ultimate shrinkage strain due to addition of LF
20
21
Experimental Findings on Shrinkage
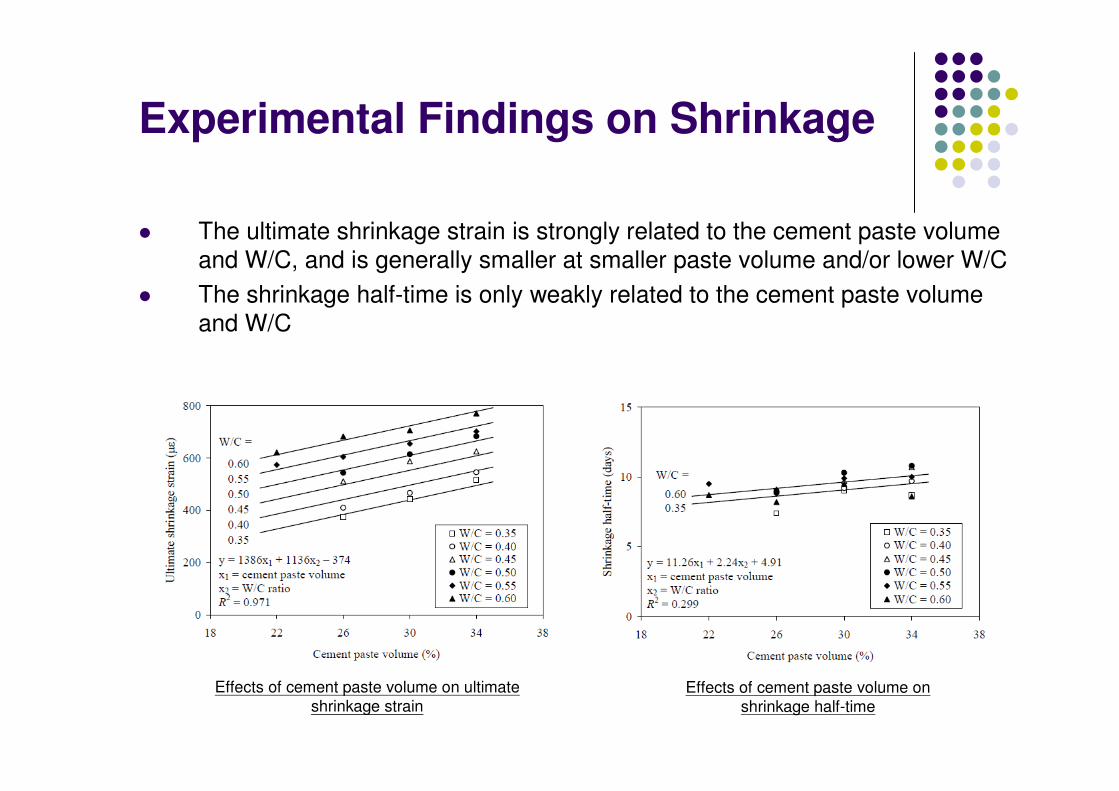
. The ultimate shrinkage strain is strongly related to the cement paste volume
and W/C, and is generally smaller at smaller paste volume and/or lower W/C
. The shrinkage half-time is only weakly related to the cement paste volume
and W/C
Effects of cement paste volume on ultimate Effects of cement paste volume on shrinkage strain shrinkage half-time
22
Experimental Findings on Shrinkage
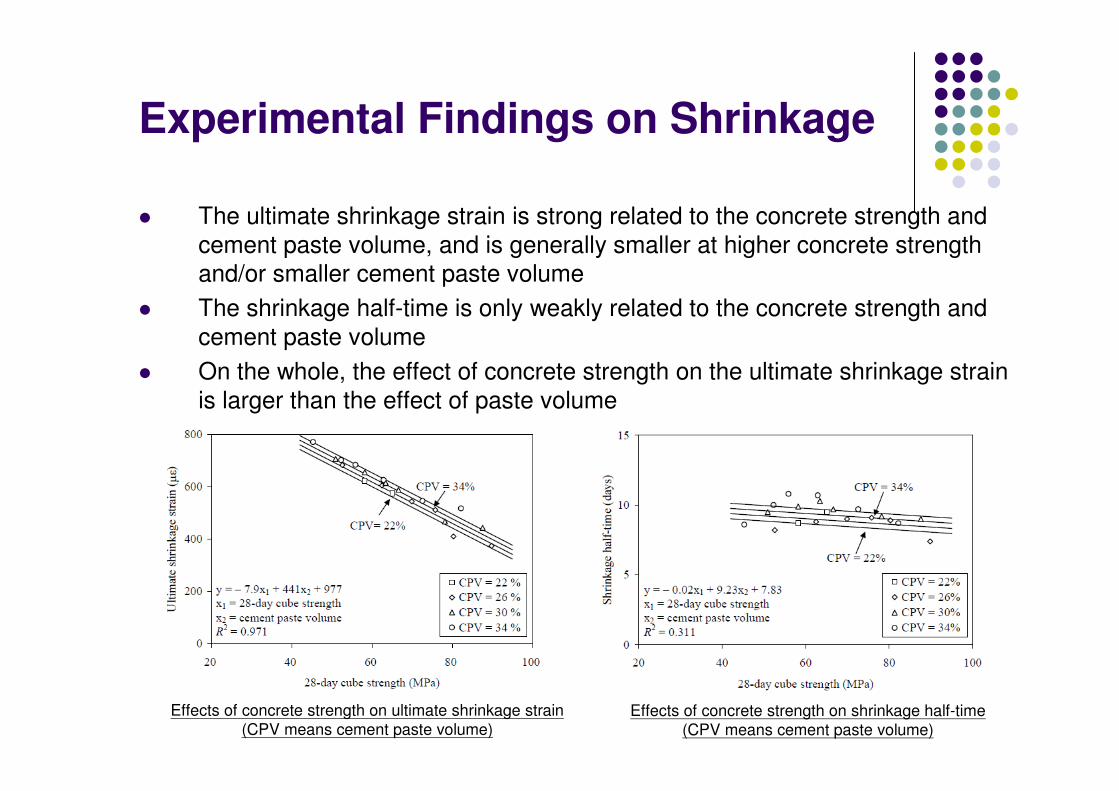
. The ultimate shrinkage strain is strong related to the concrete strength and
cement paste volume, and is generally smaller at higher concrete strength
and/or smaller cement paste volume
. The shrinkage half-time is only weakly related to the concrete strength and
cement paste volume
. On the whole, the effect of concrete strength on the ultimate shrinkage strain
is larger than the effect of paste volume
Effects of concrete strength on ultimate shrinkage strain Effects of concrete strength on shrinkage half-time (CPV means cement paste volume) (CPV means cement paste volume)
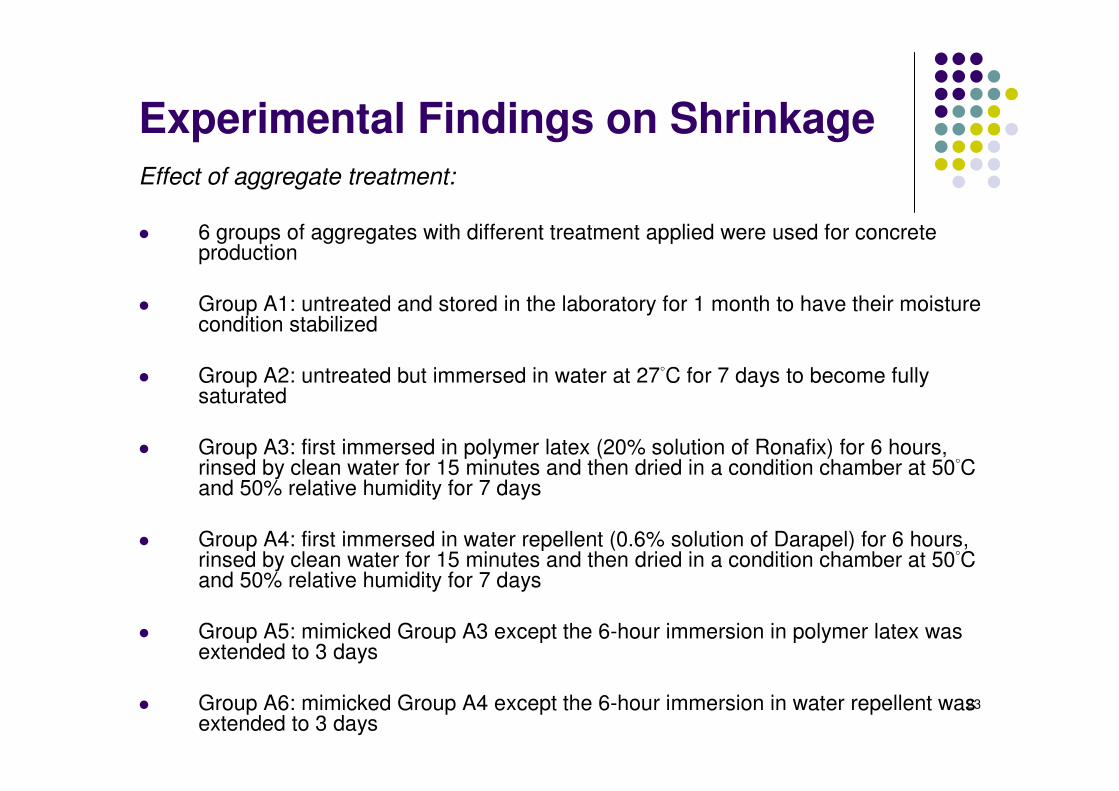
Experimental Findings on Shrinkage
Effect of aggregate treatment:
. 6 groups of aggregates with different treatment applied were used for concrete production
. Group A1: untreated and stored in the laboratory for 1 month to have their moisture condition stabilized
. Group A2: untreated but immersed in water at 27°C for 7 days to become fully saturated
. Group A3: first immersed in polymer latex (20% solution of Ronafix) for 6 hours, rinsed by clean water for 15 minutes and then dried in a condition chamber at 50°C and 50% relative humidity for 7 days
. Group A4: first immersed in water repellent (0.6% solution of Darapel) for 6 hours, rinsed by clean water for 15 minutes and then dried in a condition chamber at 50°C and 50% relative humidity for 7 days
. Group A5: mimicked Group A3 except the 6-hour immersion in polymer latex was extended to 3 days
. Group A6: mimicked Group A4 except the 6-hour immersion in water repellent was 23
extended to 3 days
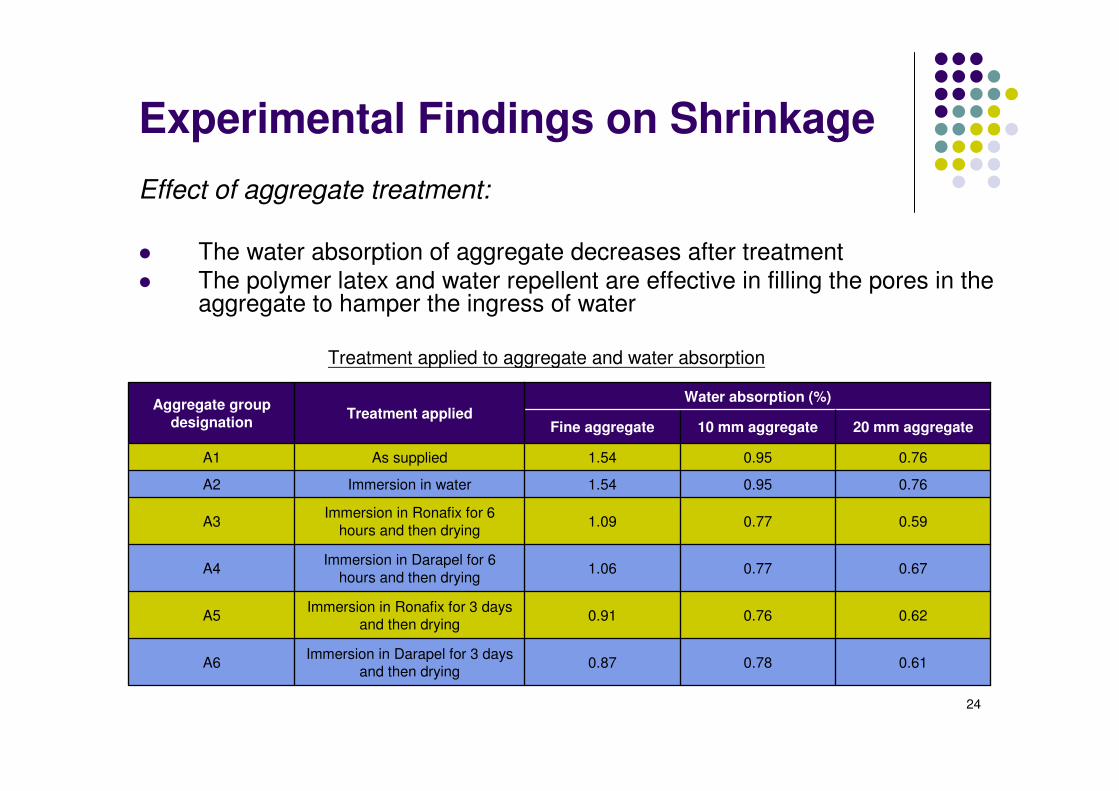
Experimental Findings on Shrinkage
Effect of aggregate treatment:
. The water absorption of aggregate decreases after treatment
. The polymer latex and water repellent are effective in filling the pores in the aggregate to hamper the ingress of water
Treatment applied to aggregate and water absorption
Aggregate group
designation Treatment applied
Water absorption (%)
Fine aggregate 10 mm aggregate 20 mm aggregate
A1 As supplied 1.54 0.95 0.76
A2 Immersion in water 1.54 0.95 0.76
A3 Immersion in Ronafix for 6
hours and then drying 1.09 0.77 0.59
A4 Immersion in Darapel for 6
hours and then drying 1.06 0.77 0.67
A5 Immersion in Ronafix for 3 days
and then drying 0.91 0.76 0.62
A6 Immersion in Darapel for 3 days
and then drying 0.87 0.78 0.61
24
-
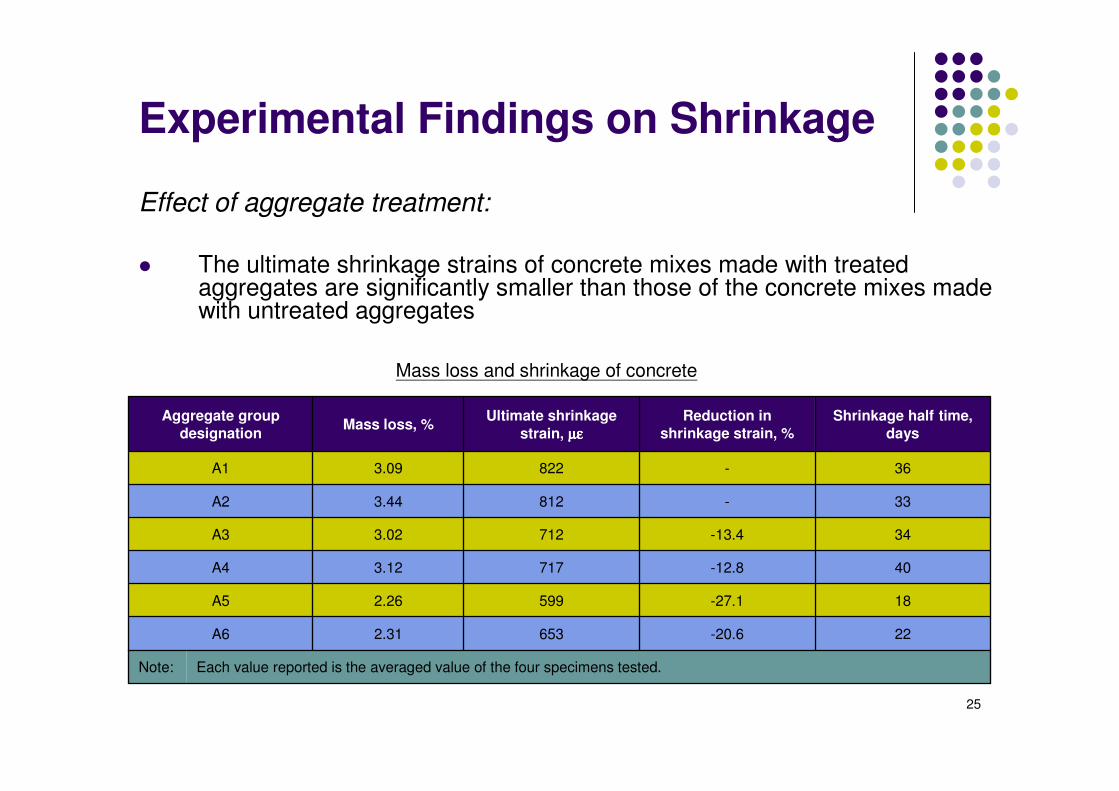
Experimental Findings on Shrinkage
Effect of aggregate treatment:
. The ultimate shrinkage strains of concrete mixes made with treated aggregates are significantly smaller than those of the concrete mixes made with untreated aggregates
Mass loss and shrinkage of concrete
Aggregate group
designation Mass loss, %
Ultimate shrinkage
strain, µµµµεεεε Reduction in
shrinkage strain, %
Shrinkage half time,
days
A1 3.09 822 - 36
A2 3.44 812 - 33
A3 3.02 712 -13.4 34
A4 3.12 717 -12.8 40
A5 2.26 599 -27.1 18
A6 2.31 653 -20.6 22
Note: Each value reported is the averaged value of the four specimens tested.
25
26
Conclusions
. The effects of adding LF as cementitious paste replacement, adding FA and SF as
cement replacement, and pretreating aggregates with polymer latex or water
repellent on the workability, strength, heat generation and drying shrinkage of
concrete have been studied.
. Based on the experimental results, it is advocated that the best strategy for
reducing the heat generation of concrete is to add supplementary cementitious
materials as cement replacement and add inert fillers as cementitious paste
replacement at the same time. This strategy can reduce the heat generation by up
to 50%.
. It is also advocated that the best strategy for reducing the drying shrinkage of
concrete is to add inert fillers as cementitious paste replacement to reduce the
paste volume, lower the W/CM ratio to increase concrete strength and if affordable
also pretreat the aggregate to reduce its water absorption. This strategy can reduce
the ultimate shrinkage strain down to about 400µε or even lower.
. With the heat generation and drying shrinkage so reduced, the dimensional stability
of the concrete would be improved and the risk of non-structural cracking would be
minimized.
Annual Concrete Seminar 2013
18 April 2013
Dimensional Stability of Concrete
Thank you!
27