Embed Size (px)
Citation preview

arX
iv:1
306.
3100
v1 [
astr
o-ph
.EP]
13
Jun
2013
Direct Imaging Search for Extrasolar Planets in the
Pleiades
Kodai Yamamoto1, Taro Matsuo2, Hiroshi Shibai1, Yoichi Itoh3, Mihoko Konishi1,
Jun Sudo1, Ryoko Tanii4, Misato Fukagawa1, Takahiro Sumi1, Tomoyuki Kudo5,
Jun Hashimoto6, Nobuhiko Kusakabe6, Lyu Abe7, Wolfgang Brandner8,
Timothy D. Brandt9, Joseph Carson
10, Thayne Currie11, Sebastian E. Egner5,
Markus Feldt8, Miwa Goto8, Carol Grady12, Olivier Guyon5, Yutaka Hayano5,
Masahiko Hayashi13, Saeko Hayashi5, Thomas Henning8, Klaus Hodapp14, Miki Ishii5,
Masanori Iye6, Markus Janson9, Ryo Kandori6, Gillian R. Knapp9,
Masayuki Kuzuhara6, Jungmi Kwon15, 6 Mike McElwain16, Shoken Miyama17,
Jun-Ichi Morino6, Amaya Moro-Martin
18, June Nishikawa6, Tetsuo Nishimura
5,
Tae-Soo Pyo5, Eugene Serabyn19, Hiroshi Suto6, Ryuji Suzuki20, Michihiro Takami21,
Naruhisa Takato5, Hiroshi Terada5, Christian Thalmann8, Daigo Tomono5,
Edwin L. Turner10, John Wisniewski22, Makoto Watanabe23, Toru Yamada24,
Hideki Takami5, Tomonori Usuda5, and Motohide Tamura6
1Department of Earth and Space Science, Graduate School of Science, Osaka University, 1-1
Machikaneyama, Toyonaka, Osaka 560-0043, Japan
[email protected] of Astronomy, Faculty of Science, Kyoto University, Kitashirakawa-Oiwake-cho,
Sakyo-ku, Kyoto 606-8502, Japan
[email protected] Astronomical Observatory, 407-2 Nishigaichi, Sayo-cho, Sayo-gun, Hyogo 679-5313,
Japan
[email protected] School of Science, Kobe University, 1-1 Rokkodai, Nada, Kobe, Hyogo 657-8501, Japan
5Subaru Telescope, 650 North Aohoku Place, Hilo, HI 96720, USA6National Astronomical Observatory of Japan, 2-21-1 Osawa, Mitaka, Tokyo 181-8588, Japan
[email protected] Lagrange, UMR7293, Universite de Nice-Sophia Antipolis, CNRS, Observatoire de la
Cote d’Azur, 06300 Nice, France
1
https://ntrs.nasa.gov/search.jsp?R=20140009144 2020-05-03T09:25:04+00:00Z

8Max Planck Institute for Astronomy, Heidelberg, Germany9Department of Astrophysical Sciences, Princeton University, NJ 08544, USA
10Department of Physics and Astronomy, College of Charleston, 58 Coming St., Charleston, SC
29424, USA11Department of Astronomy and Astrophysics, University of Toronto, 27 King’s College Circle,
Toronto, Ontario, Canada M5S 1A112Eureka Scientic, 2452 Delmer, Suite 100, Oakland CA 96002, USA
13Department of Astronomy, The University of Tokyo, Hongo 7-3-1, Bunkyo-ku, Tokyo 113-0033,
Japan14Institute for Astronomy, University of Hawaii, 640 North A’ohoku Place, Hilo, HI 96720, USA
15Department of Astronomical Science, The Graduate University for Advanced Studies
(SOKENDAI), 2-21-1 Osawa, Mitaka, Tokyo 181-8588, Japan16ExoPlanets and Stellar Astrophysics Laboratory, Code 667, Goddard Space Flight Center,
Greenbelt, MD 20771, USA17Office of the President, Hiroshima University, 1-3-2 Kagamiyama, Higashi-Hiroshima, 739-8511,
Japan18Departamento de Astrofisica, CAB (INTA-CSIC), Instituto Nacional de Tecnica Aeroespacial,
Torrejon de Ardoz, 28850, Madrid, Spain19Jet Propulsion Laboratory, California Institute of Technology, Pasadena, CA, USA
20TMT Observatory Corporation, 1111 South Arroyo Parkway, Pasadena, CA 91105, USA21Institute of Astronomy and Astrophysics, Academia Sinica, P.O. Box 23-141, Taipei 106, Taiwan
22Department of Astronomy, University of Washington, Box 351580 Seattle, WA 98195, USA23Department of Cosmosciences, Hokkaido University, Sapporo 060-0810, Japan
24Astronomical Institute, Tohoku University, Aoba, Sendai 980-8578, Japan
(Received ; accepted )
Abstract
We carried out an imaging survey for extrasolar planets around stars in the
Pleiades (125 Myr, 135 pc) in the H and KS bands using HiCIAO combined with the
adaptive optics, AO188, on the Subaru telescope. We found 13 companion candidates
fainter than 14.5 mag in the H band around 9 stars. Five of these 13 were confirmed
to be background stars by measurement of their proper motion. One was not found
in the second epoch observation, and thus was not a background or companion ob-
ject. One had multi-epoch image, but the precision of its proper motion was not
sufficient to conclude whether it was background object. Four other candidates are
waiting for second epoch observations to determine their proper motion. Finally, the
remaining 2 were confirmed to be 60 MJ brown dwarf companions orbiting around
HD 23514 (G0) and HII 1348 (K5) respectively, as had been reported in previous
2

studies. In our observations, the average detection limit for a point source was 20.3
mag in the H band beyond 1.′′5 from the central star. On the basis of this detection
limit, we calculated the detection efficiency to be 90% for a planet with 6 to 12 Jovian
masses and a semi-major axis of 50–1000 AU. For this we extrapolated the distribu-
tion of planet mass and semi-major axis derived from RV observations and adopted
the planet evolution model of Baraffe et al. (2003). As there was no detection of a
planet, we estimated the frequency of such planets to be less than 17.9% (2σ) around
one star of the Pleiades cluster.
Key words: infrared: stars — methods: statistical — stars: low-mass, brown
dwarfs — stars: planetary systems — techniques: high angular resolution
1. Introduction
Understanding planet-building and their evolutionary process is one of the most chal-
lenging problems in astrophysics. Theoretically, there have been two main competing hypothe-
ses regarding the formation of gas-giant planets: core accretion (e.g., Safronov 1969; Mizuno
1980; Pollack et al. 1996) and disk instability (e.g., Kuiper 1951; Cameron 1978). Planet for-
mation theories have been continuously updated or newly proposed (e.g., Inutsuka et al. 2010),
but these two hypotheses have served as the basis for most studies. On the one hand, in the
core accretion model, relatively small giant planets such as Jupiter and Saturn are thought to
form at about 10 AU or less from a solar-type host star in several Myr (Pollack et al. 1996; Ida
& Lin 2004). On the other hand, in the disk instability model, planets of a few to 10 MJ can
be created within a few 10 to 100 AU from the central star on a dynamical timescale of several
thousand years (Rafikov 2007; Rafikov 2011; Marois et al. 2008; Kratter et al. 2010; Janson et
al. 2012). These formation models therefore predict two populations of giant planets segregated
by orbital distance, with the closer planets formed by core accretion and the outer ones by disk
instability.
However, planets may experience subsequent orbital migration as a result of interaction
with the parent disk either inward or even outward in the case of type III migration (Masset &
Papaloizou 2003). Furthermore, in a system with multiple planets, one can be ejected beyond
the outer radius of the disk through gravitational interaction between planets or their embryos
(e.g. Ida & Lin 2004; Veras et al. 2009; Basu & Vorobyov 2012). In addition, free-floating planets
might be captured at wide orbits, although such widely separated planets are likely rare (on
the order of a few percent, e.g., Kouwenhoven et al. 2010). Thus, a number of mechanisms to
explain the formation and evolution of planets have been theoretically explored, but it is most
important to observationally determine planet frequency over a wide range of orbital distances.
Observationally, more than 830 extrasolar planets have been found to date, of which
about 90% were detected by radial velocity (RV) and transit observations (e.g. Mayor et al.
3

2011; Howard et al. 2010). This rapidly growing sample allows a statistical discussion of planet
frequency based on the properties of the planets and their host stars. However, these observing
methods have a limitation: it is difficult to detect planets that are far from host stars, i.e.,
more than about 10 AU. Direct imaging, however, which is sensitive to such distant regions, can
provide critical and complementary information to that obtained by indirect detection methods
(Marois et al. 2008; Marois et al. 2010; Lagrange et al. 2010; Currie et al. 2011; Carson et al.
2012). Given its importance and with the development of instruments and observing techniques,
direct imaging has been extensively performed in recent years with large-aperture telescopes.
Lafreniere et al. (2007) calculated the planet frequency around a single star as less than 0.1 (for
separations in the range 50–250 AU and planet masses 0.5–13 MJ) on the basis of the Gemini
observations of 85 stars. In Nielsen & Close (2010), the frequency (8.9–911 AU, > 4 MJ)
was estimated to be below 0.2, by compiling the data of 118 stars (Liu 2004; Masciadri et al.
2005; Marois et al. 2006; Biller et al. 2007; Lafreniere et al. 2007). Moreover, Chauvin et al.
(2010) reported VLT observations of 88 targets (10–500 AU, > 1 MJ) that yielded a frequency
of below 0.1. Vigan et al. (2012) reported the frequency of a planet around early type stars
(A–F) to be 8.7+10.1−2.8 (1σ). The result of the previous direct imaging surveys for the frequency
of a planet summarized in Table 1. The problem with direct imaging is that the sample size is
small compared to that of indirect observations.
In these imaging studies, the targets belong to the moving groups and local associations
including the β Pictoris moving group, TW Hya Association, Tucana-Horologium Association,
and AB Doradus group (Lafreniere et al. 2007; Chauvin et al. 2010). Because these associations
are nearby (∼20–100 pc) and young (several to several hundred Myr), their planets are relatively
bright and should be easy to detect. In addition, stars in the same cluster have similar ages
and distances from earth, which statistically improves the accuracy of the age and luminosity
estimates, and hence the derivation of the planetary mass. However, the number of the group
members is not large. For instance, such sparse moving groups have only several dozen members
each, and only a dozen stars have been observed by previous studies (Chauvin et al. 2010). In
contrast, open clusters usually have many more members, which can be an advantage when
discussing the frequency of planets at specific ages, as well as for obtaining relatively accurate
estimates of planetary masses.
We therefore have started an imaging survey of planets in an open cluster, the Pleiades,
in order to constrain the frequency of gas-giant planets at >50 AU around the member stars.
The imaging is conducted with the near-infrared instrument HiCIAO with the AO188 adaptive
optics on the Subaru telescope (Suzuki et al. 2010; Hodapp et al. 2008). Here we report the
imaging results for the first 20 surveyed stars.
4

Table 1. Summary of the direct imaging observations.
Author Sp. Type Target Age Distance Number Investigated range Planet
(median) cluster ∗ (Myr) (pc) Mass Separation† frequency
(median) (median) (MJ) (AU) (%)
Lafreniere et al. (2007) F2–M4 1, 2, 3, 5, 10–300 3.2–34.9 85 0.5–13 50–250 ≤9.3
(K0) 8, 9, 10, (100) (22) (sma)
11, 14
Chauvin et al. (2010) B7–M8 2, 3, 4, 5, 8–100 10–130 88 0.5–15 10–500 < 10
6, 7, 12, 14 () () (pro)
Nielsen & Close (2010) A5–M5 1, 2, 3, 5, 8, 2–8800 3.2–77.0 118 > 4 8.9–911 < 20
(K1) 9, 10, 11, 12, (160) (24) (sma)
12, 13, 14
Vigan et al. (2012) A0–F5 - 8–400 19–84 42 3–14 5–320 8.7+10.1−2.8
(A3) (100) (50) (sma)∗ Moving groups: (1) α Persei; (2) AB Doradus; (3) β Picoris; (4) Carina; (5) Carina-Near; (6) Columba; (7) η Cha; (8)
Hercules-Lyra; (9) IC2391; (10) Local association; (11) Local association subgroup B4; (12) Tucana-Horologium; (13) TW
Hydrae association; (14) Ursa Major.
† Separation: sma: semi-major axis; pro: projected
2. Target selection
Our purpose is to detect extrasolar planets of less than 10 Jovian masses as close as
possible to the central star. Therefore, we selected the Pleiades, a nearby young star cluster
observable from the northern hemisphere. The Pleiades cluster is significantly populous and
thus it provides a better probe of the planet frequency at a given age and for a given common
star-formation history. It is located at 133.5±1.2 pc (An et al. 2007; Soderblom et al. 2005; van
Leeuwen 2009 ) and is 125±8 Myr old (Stauffer et al. 1998). The typical metallicity of the
cluster members is similar to that of the Sun ([Fe/H] = -0.03±0.06; Gratton 2000).
One of the important criteria for choosing an open cluster is the sensitivity for detecting
giant planets of <10 MJ. The luminosity of a planet depends on its age and mass. To be
consistent with previous studies, in our work, we have adopted the evolutionary model of
Baraffe et al. (2003) to predict the brightness of planets. The H-band magnitudes for a planet
at 125 Myr are thus estimated to be 27.9, 22.5, and 20.4 magnitudes (mag) for 1, 5, and
10 MJ, respectively. The typical integration time in our observations is about 30 minutes with
HiCIAO/AO188, as described later, which provides a detection limit (5σ) of 21.5 mag. This
means that it is possible to detect a planet less massive than 10 MJ.
We note that it has been predicted that the formation process itself is also related to
the luminosity evolution of a planet. There are two types of evolutionary models: hot start
5

and cold start. Since the hot-start model assumes higher entropy for giant planets, it may
correspond to planet formation by the collapse of a gaseous disk (Baraffe et al. 1998; Baraffe
et al. 2002; Baraffe et al. 2003; Chabrier & Baraffe 2000), while the cold start condition may
represent core accretion process (Fortney et al. 2005; Fortney et al. 2008; Marley et al. 2007).
It has been shown that higher initial entropy causes a planet to became brighter (Spiegel &
Burrows 2012). Thus, the brightness of a planet at a certain age as derived by the hot start
model serves as an upper limit, while the cold start model represents a lower limit. The model
by Baraffe et al. (2003) is a hot start model. Based on the cold start model (Spiegel & Burrows
2012), the H magnitude is predicted to be 22.6 mag for a planet with 12 MJ, indicating that we
do not have the sensitivity to detect such planets. Since planet mass estimates are dependent
on the evolutionary model that is used, we should be aware of such uncertainties.
Target stars in the Pleiades were selected on the basis of the following three criteria.
1. The star is brighter than 12 mag in the R band.
AO imaging requires a guide star to measure and correct the atmospheric distortion in
optical, so the star should be bright in R to obtain diffraction-limited performance. In the
case of Subaru/AO188, the guide star needs to be located within 30′′ of the target; thus,
the target star itself is normally used as the AO guide star.
2. The membership probability is high.
Cluster membership for the target star is confirmed by using the following three criteria.
First, the membership probability should be higher than 80% based on the proper motion
measurements of Belikov et al. (1998) and the target star should not be classified as a
non-member by the other proper motion tests of Lodieu et al. (2007). Second, if the star
fails to fulfill the first sub-criterion, it needs to have a membership probability (Belikov et
al. 1998) higher than 50% and be determined to be a member according to Lodieu et al.
(2007). Third, if the star does not satisfy the above two sub-criteria, it should be classified
as a Pleiades member on the basis of the proper motion and photometry of Stauffer et al.
(2007).
3. The star has no binary companion that might exert gravitational influence on planet
formation.
The target star should not be identified as a binary in literature (Bouvier et al. 1997;
Raboud & Mermilliod 1998; Lodieu et al. 2007). In addition, there should be no other
bright (<15 mag in the H band) object in the field of view (FoV) of 20′′×20′′ by 2MASS
observation.
Finally, we selected 60 targets out of 455 stars in the Pleiades (Belikov et al. 1998; Micela et
al. 1996; Pinfield et al. 2003; Raboud & Mermilliod 1998).
6

Table 2. Summary of the observations.
Name Sp. Type Date Obs. mode/ H/KS§ R Texp Nexp Ttotal Ang. FoV
Filter (mag) (mag) (sec) (min) (degree)
BD +22 574 F8∗ 2009-10-31 ADI / H 8.854 10.02 10 207 34.5 116.9
HD 23912 F3V∗ 2009-10-31 ADI / H 8.097 8.88 10 30 5 4.1
2010-01-23 ADI / H 10 175 29.2 72.8
2011-01-27 DI / H 10 30 5 -
V1171 Tau G8† 2009-11-01 ADI / H 9.270 10.58 10 30 5 28.1
2012-12-31 DI / H 30 15 7.5 -
HII 2462 G2† 2009-12-22 ADI / H 9.699 10.87 10 60 10 52.8
HD 23863 A7V∗ 2009-12-23 ADI / H 7.599 7.98 10 93 15.5 46.3
HD 282954 G0† 2010-01-24 ADI / H 8.851 9.98 10 223 37.2 90.9
2012-09-12 DI / H 2.5 36 1.5 -
HD 23514 G0∗ 2010-12-01 ADI / H 8.291 8.96 10 204 34 147.6
HD 23247 F3V∗ 2011-01-27 ADI / H 7.811 8.85 10 83 13.8 79.7
2011-12-23 ADI / H 10 65 10.8 -
V855 Tau F8† 2011-01-28 ADI / H 8.337 9.37 10 160 26.7 114.8
2012-01-01 DI / H 10 270 45 -
HD 24132 F2V∗ 2011-01-29 ADI / H 7.930 8.59 10 134 22.3 107.9
HD 23061 F5V∗ 2011-01-30 ADI / H 8.325 9.28 10 149 24.8 103.5
TYC 1800-2144-1 G0V† 2011-01-31 ADI / KS 8.868 10.37 10 58 9.7 72.5
HII 1348 K5† 2011-12-23 ADI / H 9.831 11.92 10 141 23.5 90.4
Melotte 22 SSHJ G214 G2† 2011-12-23 ADI / H 9.634 11.17 10 180 30 59.1
BD +23 514 G5† 2011-12-24 ADI / H 9.528 10.90 10 121 20.2 97.3
Melotte 22 SSHJ G213 G2† 2011-12-24 ADI / H 9.543 10.91 5 410 34.2 31.4
Melotte 22 SSHJ G221 G2IV‡ 2011-12-25 ADI / H 9.311 10.76 10 270 45 41.9
V1054 Tau – 2011-12-30 ADI / H 9.921 11.35 10 150 25.8 105.2
V1174 Tau – 2011-12-30 ADI / H 10.197 11.61 10 170 28.3 21.3
Melotte 22 SSHJ K101 – 2011-12-31 ADI / H 9.959 11.69 10 80 13.3 58.4DI; direct imaging. ADI; angular differential imaging. Texp; integration time of each exposure. Nexp; total number of
exposures. Ttotal; total exposure time. Ang. FoV; rotation angle of field of view during observation.
∗ Wright et al. 2003
† Skiff 2010
‡ Belikov et al. 2002
§ Hmag; Cutri et al. 2003, Rmag; Zacharias et al. 2005
7
3. Observations
Twenty of the 60 selected target stars were observed between October 2009 and January
2012 (Table 2). The imaging observations were carried out as part of the Strategic Explorations
of Exoplanets and Disks with Subaru (SEEDS, Tamura 2009) by using HiCIAO, which is a
high-contrast instrument installed on the Subaru telescope (Suzuki et al. 2010; Hodapp et al.
2008). HiCIAO has a 2048×2048 HgCdTe/HAWAII 2 detector array and its pixel scale is 9.5
mas/pixel; thus, the FoV is ∼ 20′′×20′′. The targets were observed either with the H or KS
filter. The coronagraphic masks were not used.
To obtain the high contrast needed to observe within the close vicinity of a host star,
HiCIAO was used in combination with AO188 (Hayano et al. 2010). By using AO, a FWHM
of 6–10 pixels (0.′′05–0.′′10) was achieved for a point source. In addition, angular differential
imaging (ADI; Marois et al. 2006) was implemented. ADI is an imaging method that allows the
rotation of the FoV with time but fixes the detector plane relative to the pupil plane by using an
image-rotator. As a result, this method can effectively reduce quasi-static noise including the
halo of the star and speckles produced by the telescope, because the noise pattern is fixed on
the detector. The key to obtaining effective noise reduction is a large field rotation; therefore,
the imaging was performed to cover the period of transit of the target stars over the meridian,
giving a rotation angle of 25–150 degrees. Additionally, the target star was placed at the center
of the FoV to provide a wide area for the planet search.
Our observational procedure consisted of three steps. First, 5–10 unsaturated frames
were taken as a reference for the point-spread-function (PSF) of the central star with 1.5 to
2.5 s exposure time to avoid saturation. Second, the ADI observations were performed over an
integration of 5 or 10 s in the individual frames to obtain high sensitivity, but with no smearing
caused by the field rotation. The central star was saturated at the peak by this integration
time, and the saturated area had a radius of 3–6 pixels. Third, several unsaturated frames were
retaken. Table 2 summarizes the information on the observed stars, observing mode, filters,
and exposure times of saturated images.
If sources were detected around a target star, they were considered to be candidate
companions (CCs). For HD 23247, the bright (H < 14.5) companion candidate was detected
at 3.′′7 from the central star. However, we discuss only CCs fainter than 14.5 mag which
corresponds to about 100 MJ (brown dwarf mass), in the subsequent part of this paper since
our focus is not on the stellar regime. The relative positions of CCs against the target star
were measured in the follow-up observations for HD 23912 and V855 Tau to determine whether
they were co-moving. In the follow-up observations, the direct imaging (DI) mode without
field rotation was employed since the CCs have wide angular separation (more than about
3 arcsec). V1171 Tau, BD+22 574, and HD 282954 have been observed with a different camera,
Subaru/CIAO, in 2005, and the same CCs were detected (Itoh et al. 2011). Thus, our HiCIAO
8

observations gave the proper motion measurements combined with the CIAO results. HD 23912
was observed three times (in October 2009, January 2010, and January 2011). Since the field
rotation by ADI was too small (∼ 10 degree) for the first imaging in October 2009, it was
revisited in January 2010.
4. Data reduction
The first step of the image processing was to remove the striped pattern caused by fluc-
tuations in the bias levels in the individual raw images. The stripes consist of two components:
32 horizontal stripes each with a height of 64 pixels, and thin vertical stripes, each 2048 pixels
high, randomly distributed over the image. These patterns vary with time and are independent
among images. We created the striped pattern for the whole FoV by using the sky region in
each frame, and subtracting it from the raw frame, a process corresponding to sky subtraction.
Next, the bad pixels and their clusters were corrected by subtracting the de-striped dark image.
Then, we performed flat-fielding by using the dome-flats. Bad pixels randomly occurring in
arbitrary pixel positions were interpolated from the surrounding pixels. These calibrations were
carried out by using our own reduction tool for HiCIAO data.
The image processing that follows (described below) was performed with IRAF1. Sub-
pixel shifts cannot be avoided during the process of distortion correction and ADI reductions.
They require the interpolation of adjacent pixels, which causes the smearing of pixel values. As
a result, the noise level is reduced. Moreover, the amount of sub-pixel shift was different for each
frame, and we confirmed that the degree of noise reduction could vary among multiple images.
Such a non-uniform process, as well as artificial noise reduction, may affect our discussion of
detection limits. Thus, before applying the distortion correction, all images were smoothed with
a 2-D Gaussian filter with an FWHM of 3 pixels to obtain the same level of noise reduction for
all pixels and images. The distortion was measured by comparison of images of the globular
clusters (M5 and M15) with HiCIAO and HST/STIS (van der Marel et al. 2002). The distortion
was then corrected to obtain a pixel scale of 9.500 ± 0.005 mas/pixel. The precision of the
distortion correction is as described below.
Next, in preparation for the ADI reductions, the stellar position was measured and
matched to the image center for all the frames. The target stars were saturated in areas of 3–6
pixels in radius. For removal of the stellar halo by ADI reductions, we adopted the centroid
position of the halo measured from 10 to 50 pixels in radius as the stellar position. For the
ADI processing, we followed the standard ADI procedures described by Marois et al. (2006).
First, a reference image was created by calculating the median at each pixel position using all
images. Second, the reference was subtracted from the individual frames. The resultant image
1 IRAF is distributed by the National Optical Astronomy Observatories, which are operated by the Association
of Universities for Research in Astronomy, Inc., under cooperative agreement with the National Science
Foundation.
9
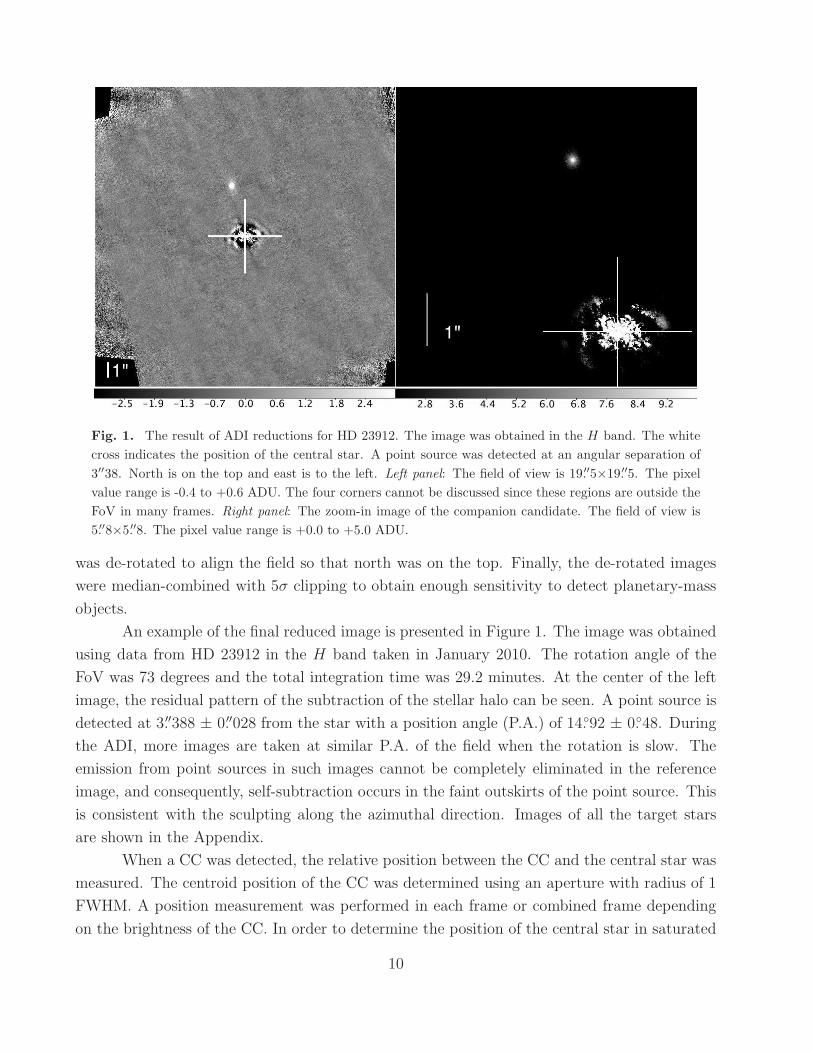
Fig. 1. The result of ADI reductions for HD 23912. The image was obtained in the H band. The white
cross indicates the position of the central star. A point source was detected at an angular separation of
3′′38. North is on the top and east is to the left. Left panel: The field of view is 19.′′5×19.′′5. The pixel
value range is -0.4 to +0.6 ADU. The four corners cannot be discussed since these regions are outside the
FoV in many frames. Right panel: The zoom-in image of the companion candidate. The field of view is
5.′′8×5.′′8. The pixel value range is +0.0 to +5.0 ADU.
was de-rotated to align the field so that north was on the top. Finally, the de-rotated images
were median-combined with 5σ clipping to obtain enough sensitivity to detect planetary-mass
objects.
An example of the final reduced image is presented in Figure 1. The image was obtained
using data from HD 23912 in the H band taken in January 2010. The rotation angle of the
FoV was 73 degrees and the total integration time was 29.2 minutes. At the center of the left
image, the residual pattern of the subtraction of the stellar halo can be seen. A point source is
detected at 3.′′388 ± 0.′′028 from the star with a position angle (P.A.) of 14.◦92 ± 0.◦48. During
the ADI, more images are taken at similar P.A. of the field when the rotation is slow. The
emission from point sources in such images cannot be completely eliminated in the reference
image, and consequently, self-subtraction occurs in the faint outskirts of the point source. This
is consistent with the sculpting along the azimuthal direction. Images of all the target stars
are shown in the Appendix.
When a CC was detected, the relative position between the CC and the central star was
measured. The centroid position of the CC was determined using an aperture with radius of 1
FWHM. A position measurement was performed in each frame or combined frame depending
on the brightness of the CC. In order to determine the position of the central star in saturated
10

images, we first, in unsaturated images, determine the offset between the center derived by
Gaussian fitting and a centroiding algorithm with a mask equal in size to the saturated area
in saturated images. Assuming the same offset holds true in the saturated case, we correct the
measurement derived by this masked centroiding algorithm accordingly. The uncertainty of
the position measurement was checked by the deviation from the rotation center of the field by
ADI. The relative positions were measured in each (combined) image, and the rotation center
was defined as the center of the fitted circular orbit for the CC in multiple images without
de-rotation. Moreover, the deviation between the position of the CC and its fitted circular
path due to the ADI observation was below 0.7 pixels. This deviation encompasses possible
distortions left even after distortion correction (as the shape would not be perfectly circular),
thus showing that as far as any measurable effect exists it is small. The results of the astrometry
measurements are summarized in Table 3.
The magnitude of the CCs was estimated by the target star as the flux calibrator. The
magnitudes of both for the central stars and the CCs were measured by aperture photome-
try. For the central star, photometry was performed by using the unsaturated frames taken
before and after the ADI observations as mentioned in section 3. The background level was
estimated as the centroid of the pixel-values histogram in an annulus with a radius of 50 pixels
and the width of 20 pixels. The aperture size varied from 2 to 40 pixels in radius, and the
converged magnitude, at a radius of about 20 pixels depending on the targets, was taken to
be its magnitudes. By comparing this instrumental magnitude with the 2MASS measurement
under the assumption that the star was not variable, the conversion from ADU to magnitude
was obtained. The photometry for the CCs was performed with the same aperture size as that
for the central star. The flux loss by the image processing including the ADI reductions was
∼ 5%, estimated by embedding an artificial point source at radially equally spaced angles and
distances (interval of 1′′) in the raw image and applying the same reduction procedures. The
flux loss was independent of the separation beyond 1′′. The photometry result obtained for the
CCs was corrected for this flux loss. Finally, the magnitude of the CCs was calculated using the
conversion from ADU to the magnitude derived from the photometry of the central star. To
improve the signal-to-noise ratio (S/N), the photometry for a CC was performed with images
in which 20–40 frames were combined and the results were averaged. The H magnitudes for
the CCs are shown in Table 3.
5. Results
5.1. Detection limits of our observations
The detection limit of our observations is defined by a signal-to-noise ratio (S/N) of 5.
The noise was determined by the standard deviation of the background level in the azimuthal
direction measured at the same distance from the target star. The background level was
11

Table 3. Astrometry and photometry of companion candidates.
Name Separation Angle P.A. H Mass∗ UT Date Status
(′′) (◦ E of N) (mag) (MJ)
V1171 Tau CC1 12.770 ± 0.025 135.50 ± 0.40 18.3 † - 2005-11-17‡ -
12.629 ± 0.028 134.75 ± 0.10 17.8 ± 0.1 22 2009-11-01 -
12.603 ± 0.031 134.08 ± 0.21 17.8 ± 0.3 22 2012-12-31 B
V1171 Tau CC2 12.880 ± 0.027 136.77 ± 0.40 18.3 † - 2005-11-17‡ -
12.744 ± 0.020 136.15 ± 0.10 18.5 ± 0.6 19 2009-11-01 -
12.628 ± 0.031 135.51 ± 0.21 18.5 ± 0.6 19 2012-12-31 B
HD 23912 CC1 3.388 ± 0.028 14.92 ± 0.48 17.4 ± 0.1 26 2010-01-23 -
3.435 ± 0.008 14.52 ± 0.28 17.2 ± 0.2 28 2011-01-27 B
BD +22 574 CC1 3.405 ± 0.025 95.70 ± 0.20 -§ - 2005-11-17 -
3.288 ± 0.033 92.57 ± 0.20 19.2 ± 0.2 13 2009-10-31 Probably B.
BD +22 574 CC2 8.440 ± 0.030 51.82 ± 0.10 18.6 ‖ 14 2005-11-17 -
8.501 ± 0.033 50.01 ± 0.10 17.4 ± 0.2 26 2009-10-31 U
HD 282954 CC1 9.006 ± 0.030 103.82 ± 0.50 16.4 ‖ 33 2005-11-17 -
9.031 ± 0.014 103.23 ± 0.18 14.6 ± 0.1 87 2010-01-23 -
8.943 ± 0.014 103.28 ± 0.20 14.4 ± 0.2 99 2012-09-12 B
V855 Tau CC1 8.05 ± 0.03 19.46 ± 0.21 17.2 ± 0.4 27 2011-01-28 -
- - - - 2012-01-01# ?
HD23514 CC1 2.64 ± 0.02 228.7 ± 1.0 - - 2006-12-10∗∗ -
2.64 ± 0.01 227.8 ± 0.3 - - 2007-10-25∗∗ -
2.62 ± 0.04 227.2 ± 0.5 - - 2008-11-04∗∗ -
2.642 ± 0.040 227.51 ± 0.04 15.61 ± 0.08 52 2009-11-01∗∗ -
2.644 ± 0.002 227.48 ± 0.05 15.39 ± 0.06 58 2010-10-30∗∗ -
2.646 ± 0.033 227.59 ± 0.72 15.37 ± 0.05 58 2010-12-01 C
HII 1348 CC1 1.09 ± 0.02 347.9 ± 0.7 - - 1996-09-25 - 10-01†† -
1.097 ± 0.005 346.8 ± 0.2 15.30 ± 0.09 60 2004-10-03‡‡ -
1.12 ± 0.02 346.8 ± 0.6 - - 2005-11-21§§ -
1.12 ± 0.03 346.1 ± 0.9 15.7 ± 0.4 48 2011-12-23 C
V1054 Tau CC1 7.110 ± 0.014 110.29 ± 0.11 18.1 ± 0.4 20 2011-12-30 N
V1054 Tau CC2 7.361 ± 0.028 76.48 ± 0.22 15.97 ± 0.09 44 2011-12-30 N
V1174 Tau CC1 6.473 ± 0.033 63.68 ± 0.28 18.0 ± 0.4 21 2011-12-30 N
V1174 Tau CC2 9.24 ± 0.03 37.4 ± 0.2 18.5 ± 0.3 17 2011-12-30 NMuch brighter companion candidate was detected within 3.′′7 arcsec for HD 23247. However, only candidates less massive
than the brown-dwarf mass (∼ 100 MJ) are discussed in this paper.
Status sign; U presents ”undefined” due to the uncertainty of the proper motion measurement. B presents the background
object. C presents the co-moving object. N presents that the proper motion has not been measured yet.
∗ The masses are linearly interpolated by reference to Baraffe et al. (2003). † It was impossible to measure the individual
brightness of CC1 and CC2, because they were not spatially separated not well enough for aperture photometry. In addition,
the error was difficult to determine due to the fluctuated PSF because of the poor seeing. ‡ Subaru/CIAO, Subaru/IRCS
(Itoh et al. 2011). § It was impossible to measure the brightness of the CC due to the stellar halo. ‖ K magnitude. It
was impossible to estimate the error due to the variation of PSF because of the inclement weather. # The companion
12

14
16
18
20
22
24
0 1 2 3 4 5
nois
e le
vel (
H m
agni
tude
)
angular separation (arcsec)
Fig. 2. Noise level (1σ) as a function of angular separation. Dotted lines indicate individual observations
obtained from October 2009 to January 2012. The total integration time in each observation is in the
range of 5–45 minutes.
obtained with an aperture size of approximately 2 × FWHM on the median-combined image by
ADI reductions. The relation between the standard deviation (S/N=1) and angular separation
from the central star is plotted in Figure 2. The median of the detection limits for all ADI
observations becomes constant at 20.8 mag for S/N of 3 and 20.3 mag for S/N of 5 in the
region beyond 1.′′5 from the central star. Inside ∼1.′′5, the detection limit is determined by the
subtraction residual of the stellar halo. It is 17.7 mag and 19.7 mag for separations of 0.′′5 and
1.′′0, respectively.
We note that there are other ways to achieve better suppression of the stellar halo
than the classical ADI reductions, such as Locally Optimized Combination of Images (LOCI:
Lafreniere et al. 2007). The LOCI algorithm considers spatial correlations of the stellar halo
and speckle noise with reference images. However, our primary focus in this paper is on the
relatively distant region from the star (more than about 100 AU) where uncorrelated, random
noise is dominant and classical ADI is more effective than LOCI. The results of standard ADI
reductions are thus discussed in this work.
5.2. Astrometry and photometry of companion candidates
Among 13 companion candidates, a CC for HD 23912 is detected in our follow-up imaging
with HiCIAO while the CC of V855 Tau is not found in the follow-up. Another 7 CCs around
5 stars (BD+22 574, V1171 Tau, HD 282954, HD 23514, and HII 1348) were observed with
Subaru/CIAO, Subaru/IRCS, Keck/NIRC2, CFHT/PUEO, Palomar Hale telescope/PHARO,
Keck/OSIRIS at the previous epochs (Itoh et al. 2011; Rodriguez et al. 2012; Bouvier et al.
1997; Geißler et al. 2012). The relative distances to the central stars for these CCs are shown
in Figure 3. The remaining 4 CCs, 2 for V1054 Tau and V1174 Tau respectively, are waiting
for the second epoch observations for proper motion measurements.
13

-9.1
-9.0
-8.9
-8.8
-8.7
8.78.88.99.09.19.2
DE
C o
ffset
(ar
csec
)
RA offset (arcsec)
V1171 Tau cc1
2005.Nov.17 (CIAO)2009.Nov.1 (Present work)2012.Dec.31 (Present work)2012.Dec.31 (Background star)Background star motion
(a) V1171 Tau CC1
-9.4
-9.3
-9.2
-9.1
-9.0
8.68.78.88.99.0
DE
C o
ffset
(ar
csec
)
RA offset (arcsec)
V1171 Tau cc2
2005.Nov.17 (CIAO)2009.Nov.1 (Present work)2012.Dec.31 (Present work)2012.Dec.31 (Background star)Background star motion
(b) V1171 Tau CC2
3.25
3.30
3.35
0.800.850.90
DE
C o
ffset
(ar
csec
)
RA offset (arcsec)
HD 23912 cc1
2010.Jan.232011.Jan.272011.Jan.27 (Background star)Background star motion
(c) HD 23912 CC1
-0.4
-0.3
-0.2
-0.1
3.23.33.43.5
DE
C o
ffset
(ar
csec
)
RA offset (arcsec)
BD+22 574 cc1
2005.Nov.17 (CIAO)2009.Oct.31 (Present work)2009.Oct.31 (Background star)Background star motion
(d) BD+22 574 CC1
Fig. 3. Top left panel: V1171 Tau CC1. Top right panel: V1171 Tau CC2. Lower left panel: HD 23912
CC1. Lower right panel: BD +22 574 CC1.
14

5.2
5.3
5.4
5.5
6.46.56.66.76.8
DE
C o
ffset
(ar
csec
)
RA offset (arcsec)
BD+22 574 cc2
2005 Nov 17 (CIAO)2009 Oct 31 (Present work)2009 Oct 31 (Background star)Background star motion
(e) BD+22 574 CC2
-2.5
-2.4
-2.3
-2.2
-2.1
-2.0
8.58.68.78.88.99.0
DE
C o
ffset
(ar
csec
)
RA offset (arcsec)
HD 282954 cc1
2005.Nov.17 (CIAO)2010.Jan.23 (Present work)2012.Sep.12 (Present work)2012.Sep.12 (Background star)Background star motion
(f) HD 282954 CC1
-1.8
-1.7
-1.6
-1.5
-2.1-2.0-1.9-1.8
DE
C o
ffset
(ar
csec
)
RA offset (arcsec)
HD 23514 cc1
2006.Dec.10 (NIRC2)2007.Oct.25 (NIRC2)2008.Nov.4 (NIRC2)2009.Nov.1 (NIRC2)2010.Oct.30 (NIRC2)2010.Nov.1 (Present work)2010.Nov.1 (Background star)Background star motion
(g) HD 23514 CC1
1.1
1.2
1.3
1.4
-0.5-0.4-0.3-0.2-0.1
DE
C o
ffset
(ar
csec
)
RA offset (arcsec)
HII 1348 cc1
1996.Sep. (PUEO)2004.Oct.03 (PHARO)2005.Nov.21 (PHARO)2011.Dec.23 (Present work)2011.Dec.23 (Background star)Background star motion
(h) HII 1348 CC1
Fig. 3. Continued. Top left panel: BD +22 574 CC2. Top right panel: HD 282954 CC1. Lower left
panel: HD 23514 CC1. Lower right panel: HII 1348 CC1.
15

5.2.1. HD 23514, and HII 1348
HD 23514 and HII 1348 have a co-moving object respectively, which is most likely a
companion gravitationally bound to it (Figure 3(g), and Figure 3(h)). The companion objects
were first identified by the previous astrometry by Rodriguez et al. (2012) for HD 23514, and
by Geißler et al. (2012) for HII 1348. The H magnitudes for the companion were measured to
be 15.39 ± 0.06 mag in October 2010 for HD 23514, and 15.30 ± 0.09 mag in October 2004 for
HII 1348, and their masses are estimated as 60 MJ, which is in the brown dwarf regime.
Rodriguez et al. (2012) measured the separation and the P.A. of HD 23514 as 2.′′642 ±
0.′′003 and 227.◦51 ± 0.◦04 in November 2009, and in October 2010 they were 2.′′644 ± 0.′′002 and
227.◦48 ± 0.◦05, respectively. In our observation in December 2010, the separation was 2.′′646
± 0.′′033 and the P.A. was 227.◦6 ± 0.◦7. The H magnitude of the CC in December 2010 was
15.37 ± 0.05. Our measurements are therefore consistent with those of Rodriguez et al. (2012).
For the companion of HII 1348, Geißler et al. (2012) measured the separation and the
P.A. as 1.′′097 ± 0.′′005 and 346.◦8 ± 0.◦2 in October 2004, and in November 2005 they were 1.′′12
± 0.′′02 and 346.◦8 ± 0.◦6, respectively. In our observation in December 2011, the separation
was 1.′′12 ± 0.′′03 and the P.A. was 346.◦1 ± 0.◦9. The H magnitude of the CC in December
2011 was 15.7 ± 0.4. Our measurements are therefore consistent with those of Geißler et al.
(2012).
5.2.2. V1171 Tau, HD 282954 and BD+22 574
We observed HD 282954 and V1171 Tau two times for measurement of their proper
motions with HiCIAO. We confirmed these 3 CCs were the background stars from comparison of
the astrometry between the two epochs. Two CCs for BD+22 574 show changes in their relative
distances to the central star between the two epochs, and are likely to be background stars. We
consider it likely that the distortion correction is not perfect for the CIAO data because the
distortion map for the CIAO data cannot be preperly generated due to a limited number of the
field stars in Trapezium, which was observed for the distortion correction. However, because
the distortion is small at narrow separation, the CC1 of BD+22 574 (separation ∼ 3.′′3) is
confirmed as the background star. It is not clear whether BD+22 574 CC2 os the companion
or the background star.
5.2.3. V855 Tau, and HD 23912
One CC was detected for V855 Tau in January 2011. Interestingly, however, it was
not detected in January 2012. It is difficult to conclude that we had a false detection in 2011
because it is not one of the known artifacts, it is seen in all of the several combined images,
and its PSF has a reasonable FWHM without any peculiarity in its shape. It may therefore be
a foreground object. HD 23912 also has one CC, but it turned out to be a background star on
the basis of ADI and DI observations with HiCIAO.
16

5.3. Statistical analysis for estimating the frequency of planets
The purpose of this subsection is to constrain the frequency of planets around a star
based on our observations. First, we define and calculate the detection efficiency εn as the
probability of planet detection when host star n has one gas-giant planet.
To begin with, we consider the separation range where we can detect a planet in our
observations with HiCIAO/AO188. The detection limit of a point source far from the central
star is determined solely by the total integration time without being affected by the stellar
halo. As already mentioned in section 5.1, the detection limit of our observations (5σ) was
20.3 magnitudes with an integration time of 5–45 minutes beyond 1.′′5. However, residuals
of the stellar halo remain in the inner (<1.′′5) region as seen in Figure 2. In this area, only
brighter planets, brown dwarfs, and stars can be detected, but we are interested in the region
where planets can be detected if they exist. The minimum separation for planet detection,
which we define as the inner working angle (IWA), can depend not only on the sensitivity but
also on the field rotation of ADI. In this way, the IWA is determined only by the sensitivity
of our observations, which is 0.′′6–1.′′0 arcsec, depending on the amount of suppression of the
stellar halo for each target. Nevertheless, most of the region we consider below is the outer
part (>1.′′5), which is free from the effect of the stellar halo. In the following calculation, Fmin
is defined as the minimum angular separation that a planet with a given mass MP can be
detected.
The H magnitude can be converted to planetary mass by using the evolutionary model
by Baraffe et al. (2003), assuming an age of 125 Myr and a distance of 135 pc for the Pleiades.
Using this relation, the minimum detectable planet mass Mmin can be determined for each
separation.
Next, we calculate the detection efficiency, which is the probability that planets lie in
the detectable parameter space of the observation. The detection efficiency ε(MP, a, e) to find
a planet with a certain orbit in the Pleiades is derived from the planet mass MP, semi-major
axis a, and eccentricity e. Here, we assume that a host star always has one planet that has the
orbital elements; a, e, inclination i (angle between line of sight and normal to the orbital plane),
and azimuth φ (angle between line of sight and periapsis). As the planet moves along its orbit,
the separation angle F from the central star to the planet varies with the true anomaly θ as
described as follows:
F =a(1− e2)
D (1+ ecosθ)
√
cos2 (θ−φ)cos2 i+ sin2 (θ−φ), (1)
where D is the distance to the Pleiades cluster (D =135 pc). We then introduce Td, which is
the time per orbital period TP for a planet of MP being in the range of F >= Fmin. Using Td,
the detection efficiency of a certain orbit is described as g(MP, a, e, i,φ) = Td/TP. Considering
that the line of sight is randomly distributed and independent of a planet orbit the detection
efficiency for one orbit is
17

ε(MP,a,e) =
∫ π/2i=−π/2 sin i
∫ 2πφ=0 g(MP,a,e, i,φ)dφdi
∫ π/2i=−π/2 sin i
∫ 2πφ=0dφdi
. (2)
Accordingly, the detection efficiency εn for a host star n can be obtained from the
distribution of planet mass, semi-major axis, and eccentricity by
εn =
∫Mmax
Mmin
dNdMP
∫ amax
amin
dNda
∫ 10
dNdeε(MP,a,e)dMPdade
∫Mmax
Mmin
dNdMP
∫ amax
amin
dNda
∫ 10
dNdedMPdade
. (3)
Here, we need to consider the number distribution of planet mass, semi-major axis, and eccen-
tricity, which are expressed as dN/dMP, dN/da and dN/de, respectively. The distribution of
planet mass was derived as dN/dMP ∝ M−1.2∼−1.9P by the RV survey for planets with orbital
periods longer than 100 days (Cumming et al. 2008). For the distribution of the semi-major
axis, dN/da ∝ a−0.61 was obtained from the RV survey for planets with long orbital periods
(shorter than 2000 days: Cumming et al. 2008). Finally, the distribution of eccentricity was
derived as dN/de∝ exp(−4.2e) on the basis of data in The Extrasolar Planet Encyclopedia 2.
We assume these distributions in our calculation.
Adopting Baraffe et al. (2003), the minimum detectable mass in our observation was
6–10 MJ at separations larger than 1.′′5. As shown in Figure 2, IWAs are 100 AU for a circular
orbit and 50 AU for an eccentric orbit with an eccentricity of 0.9, respectively. Considering
this result and using equation (3), the detection efficiency εn ranges from 82–96% for a planet
mass of 6–12 MJ and semi-major axis of 50–1000 AU.
In the above discussion, we calculated the detection efficiency for one planet orbiting
one star, εn. In the next step, we consider the probability of detecting at least one planet, pn,
around a star n (n = 1...N). pn is calculated from the detection efficiency εn and the number
frequency of planets around a host star η, since
pn = η× εn. (4)
As noted above, εn is uniquely determined by the orbital distribution of a planet and the
detection separation range in the observations. On the other hand, pn can be constrained by
our imaging results for 20 stars. Therefore, it is possible to constrain the planet frequency η
for a host star.
In the following analytical approach, we employ Bayes’ theorem as described by Vigan
et al. (2012) and Lafreniere et al. (2007). The probability of detecting at least one planet is
η×εn while that of non-detection is (1−η×εn). The likelihood of the data given εn is described
as
L({dn}|η) =N∏
n=1
(1− ηεn)1−dn · (ηεn)
dn , (5)
where dn is the sign of detection, which equals 1 if at least one planet is detected around a
2 http://exoplanet.eu/
18

star n and 0 if no planet is detected. On the left-hand side of the equation, {dn} shows the set
of results from N observations. Using this likelihood, the conditional probability distribution
that the set of events {dn} occurs with frequency η is
p(η|{dn}) =L({dn}|η)p(η)
∫ 10 L({dn}|η)p(η)dη
, (6)
where p(η) is the prior probability of η. Since η is unknown a priori, p(η) = 1.
We can determine the range of η as a confidence interval (CI) on a given confidence level
(CL) α,
α =∫ ηmax
ηmin
p(η|{dn})dη, (7)
where ηmax and ηmin are the maximum and minimum values of η in the case of {dn}.
In our observations, there are 8 companion candidates without proper motion measure-
ments (V1171 Tau CC1, CC2, BD+22 574 CC2, HD 282954 CC1, V1054 Tau CC1, CC2,
V1174 Tau CC1, and CC2). Even if they are companion objects, their masses are larger than
that of planets (> 12MJ). Thus, no planets is found around 20 stars in our observations, re-
sulting in a value of ηmax of about 17.9% (CL = 95%) for planets in the mass range of 6–12 MJ
and the semi-major axis of 50–1000 AU. The minimum value ηmin is always 0 in this case.
6. Discussion
On the basis of our observations of 20 stars, the frequency of planets in the mass range
of 6–12 MJ orbiting at a distance of 50–1000 AU from a host star in the Pleiades (125 Myr,
135 pc) is estimated to be 17.9% as an upper limit (2σ). This is the first time this constraint
has been obtained for a certain age (∼125 Myr).
In a previous direct imaging survey by Lafreniere et al. (2007), the frequency of planets
over the mass and separation ranges of 0.5–13 MJ and 50–250 AU was below 10%, as derived
from observations of 85 stars with the Gemini North telescope. Similarly, the frequency of
planets of > 1 MJ at 40–500 AU was not greater than 9.3% (2σ) by the VLT observations of
88 stars within 100 pc (Chauvin et al. 2010). Therefore, our estimate is consistent with these
previous results, indicating that the planet frequency in the Pleiades is not much higher than
in other moving groups and around field stars.
According to these results, giant planets are very rare at larger separations (more than
about 50 AU), although there are a few known candidate systems (e.g., Marois et al. 2008; Itoh
et al. 2005). Since current formation theory predicts that heavy giant planets can form only
via disk instability at distant regions, it is speculated that such instability is not a major in-
situ formation process for giant planets. Furthermore, our observations cover a wide area even
beyond a few 100 AU which is the typical size of protoplanetary disks (Andrews & Williams
2007), thus it is difficult to expect that planets form in situ at such a distances from a host
star. However, it has been suggested that giant planets or their natal fragments in multiple
19

0.01
0.1
1
0.1 1 10 100
Pla
net f
requ
ency
η
Semi-major axis (AU)
Present studyDirect imaging (Lafreniere+2007)Direct imaging (Chauvin+2010)Direct imaging (NielsenClose2010)Direct imaging (Vigan+2012)Radial velocity (Cumming+2008)Microlensing (Cassan+2012)
0.01
0.1
1
0.1 1 10
Pla
net f
requ
ency
η
Mass (MJ)
Present studyDirect imaging (Lafreniere+2007)Direct imaging (Chauvin+2010)Direct imaging (NielsenClose2010)Direct imaging (Vigan+2012)Radial velocity (Cumming+2008)Microlensing (Cassan+2012)
Fig. 4. Planet frequency η as a function of semi-major axis (left panel) and planet mass (right panel). The
circle shows our work (50–1000 AU, 6–12 MJ), while the square indicates the direct imaging (50–250 AU,
0.5–13 MJ; Lafreniere et al. 2007). The rice symbol, the triangle and the pentagon shows other direct
imaging (10–500 AU, 0.5–15 MJ; Chauvin et al. 2010), (8.9–911 AU, >4 MJ; Nielsen & Close 2010) and
(5–320 AU, 3–14 MJ; Vigan et al. 2012), respectively. The triangle denotes the radial velocity (0.03–3 AU,
0.3–10 MJ; Cumming et al. 2008), and the diamond shows microlensing (0.5–10AU, 0.3–10 MJ; Cassan et
al. 2012). The dotted lines in the two panels indicate the distribution of the frequency of planets that is
derived from our observations. The slopes of the lines are −1.31 and −0.61 in the left and right panels,
respectively.
planetary systems can be ejected into very wide orbits (102–105 AU) through gravitational
interaction (Basu & Vorobyov 2012; Veras et al. 2009). At present, the observed rareness is not
inconsistent with theoretical predictions that invoke planet–planet scattering.
In other planet surveys of the region near host stars using microlensing (OGLE: Beaulieu
et al. 2006; Kubas et al. 2008, MOA: Sumi et al. 2010), the frequency of planets with 0.3–10 MJ
at 0.5–10 AU was 17+6−9% (Cassan et al. 2012). In addition, the frequency of planets more massive
than 0.3–10 MJ over 0.03–3 AU was 10.5 ±1.7% by RV survey (Cumming et al. 2008). Though
the detectable separation in these other surveys was different from that in direct imaging, the
frequency of planets according to our survey does not seem to be higher than those obtained
by microlensing and RV surveys (Figure 4, Table 4).
In our observations, point sources fainter than 14.5 mag are detected around 9 of 20
(40%) target stars whether or not they are real companion objects. The detection limit is 20.3
mag in the H band at the separation of 1.′′5–10′′. This possibility of finding other point sources
is consistent with previous direct imaging studies with similar survey depth and size of the
field of view. For instance, CCs were detected toward 32 stars (44%) in the galactic latitude
20

Table 4. Comparison of observations for planet frequency.
Observation Ref. Distribution index Planet frequency
method Mass (α) Semi-major axis (β) (η)
dN/dMP ∝ (MP)α dN/da∝ aβ
Direct Imaging Present work -1.31 -0.61 ≤ 17.9 %
Direct Imaging Lafreniere et al. 2007 -1.2 -1.0 ≤ 9.3 %
Radial velocity Cumming et al. 2008 -1.31 -0.61 10.5± 1.7 %
Microlensing Cassan et al. 2012 -1.68 -1.0 17+6−9 %
Our use of β is taken from Cumming et al. (2008). In direct imaging by Lafreniere et al. (2007), α and β were the
values extrapolated from RV observations. Lafreniere et al. (2007) and Cassan et al. (2012) assumed a flat distribution in
logarithmic semi-major axis space.
of > |10| degrees in the imaging by Chauvin et al. (2010). Among them, 5 stars have already
been confirmed as background objects while 78% remain to have their proper motion observed.
It is highly likely that most of them are background stars, but we would like to point out that
as a by-product, deep direct imaging would also be useful to discuss galactic models. This,
however, is beyond the scope of our paper.
7. Summary
We have carried out a SEEDS imaging survey for detection of extrasolar gas-giant planets
in the Pleiades with the near-infrared imaging instrument HiCIAO and the adaptive optics
instrument AO188 on the Subaru telescope between October 2009 and January 2012. Thirteen
companion candidates were found around 9 host stars in H band by using ADI observations.
The detection limit of our observations (5σ) was 20.3 magnitudes with an integration time of 5–
45 minutes beyond 1.′′5. For HD 23514 and HII 1348, we confirmed a brown dwarf respectively,
which were detected by a previous study with proper motion measurement (Rodriguez et al.
2012; Geißler et al. 2012). Five of the 13 candidates were confirmed to be background stars on
the basis of proper motion. One was not found in the second epoch observation; thus, this was
unlikely to be a background or companion object. Only one it was not confirmed whether or
not it is background star, as the precision of their proper motions was not sufficient. Four of
the 13 remain to be observed to confirm whether they are co-moving.
We determined the detection efficiency, which is the probability of finding a 6–12 Jovian-
mass planet at 50–1000 AU from the host star in the Pleiades, to be about 90% on the basis
of our detection limit. Because there was no detection of such a planet, we estimated that the
frequency of stars having gas-giant planets in the Pleiades is less than 17.9%. This result is
consistent with previous direct imaging studies, indicating that planet frequency in the Pleiades
is not considerably higher than those obtained in moving groups and field stars.
21

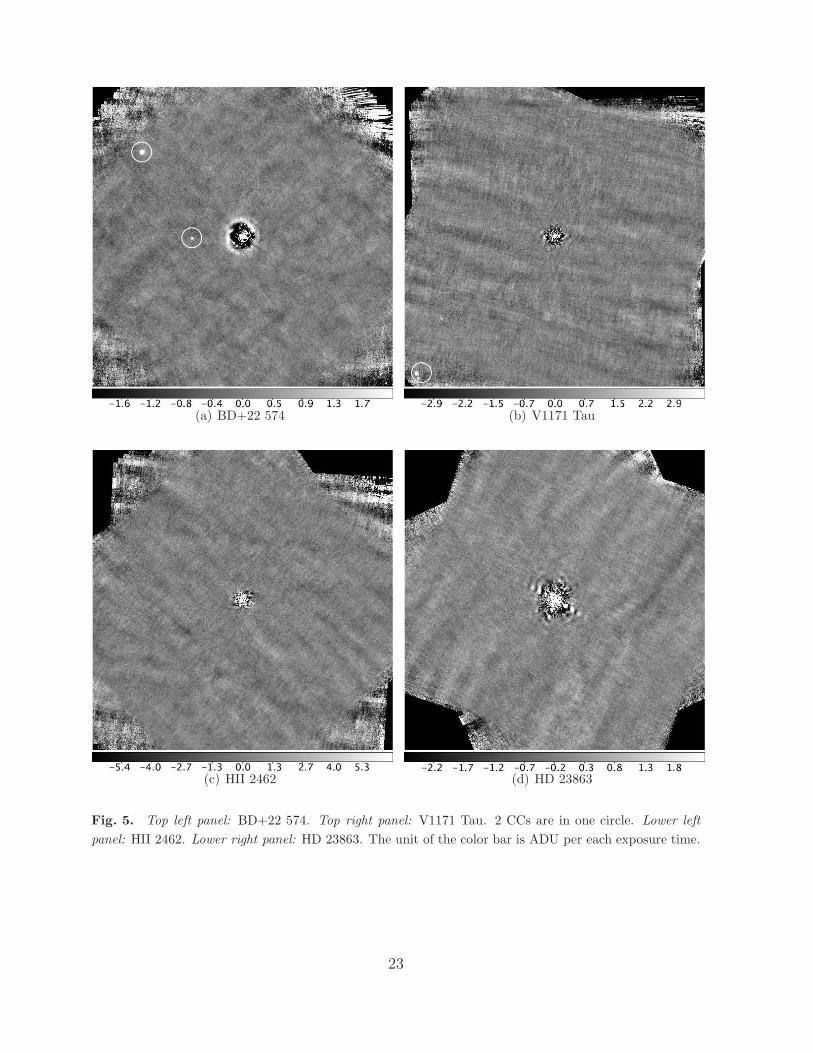
Appendix. Observation images
Details regarding the images and reduction are described in Table 2 and section 4. All
images are obtained through ADI reduction in the H and KS (only Figure 5(l); TYC 1800-
2144-1). The field of view of all images is 19.′′5 × 19.′′5. The circle in images represents the
position of the companion candidates (CCs).
22
(a) BD+22 574 (b) V1171 Tau
(c) HII 2462 (d) HD 23863
Fig. 5. Top left panel: BD+22 574. Top right panel: V1171 Tau. 2 CCs are in one circle. Lower left
panel: HII 2462. Lower right panel: HD 23863. The unit of the color bar is ADU per each exposure time.
23
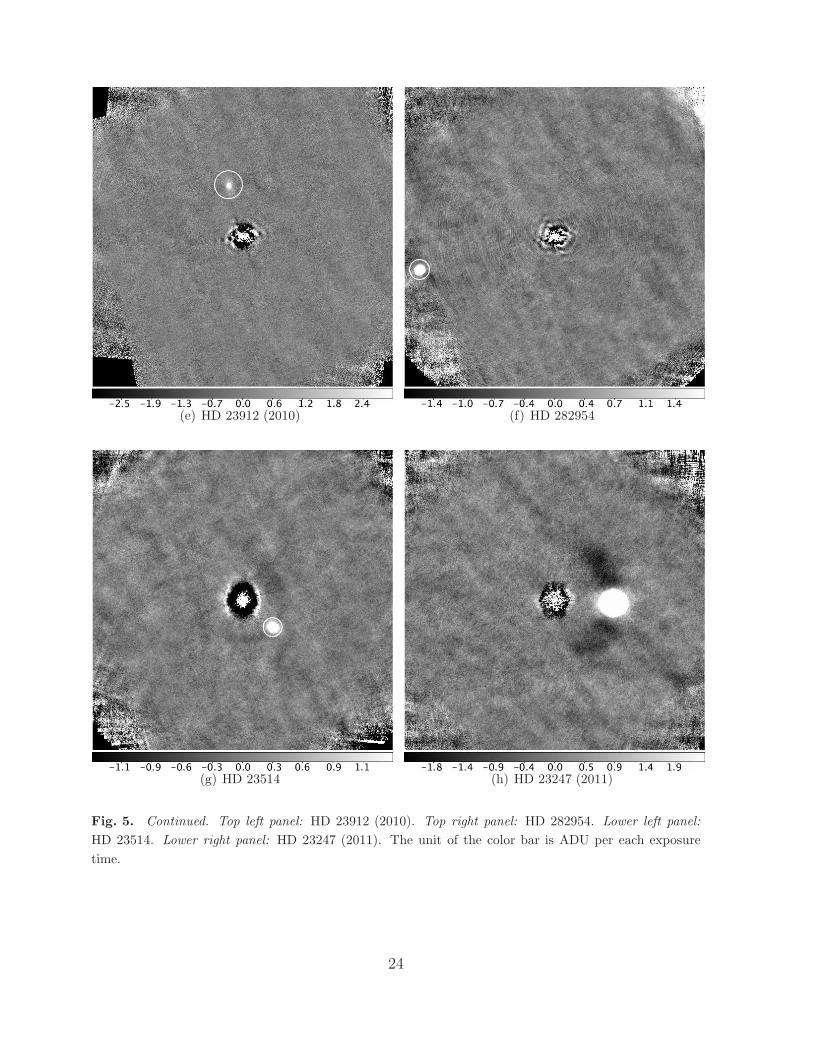
(e) HD 23912 (2010) (f) HD 282954
(g) HD 23514 (h) HD 23247 (2011)
Fig. 5. Continued. Top left panel: HD 23912 (2010). Top right panel: HD 282954. Lower left panel:
HD 23514. Lower right panel: HD 23247 (2011). The unit of the color bar is ADU per each exposure
time.
24

(i) V855 Tau (2011) (j) HD 24132
(k) HD 23061 (l) TYC 1800-2144-1
Fig. 5. Continued. Top left panel: V855 Tau (2011). Top right panel: HD 24132. Lower left panel:
HD 23061. Lower right panel:TYC 1800-2144-1. The unit of the color bar is ADU per each exposure time.
25
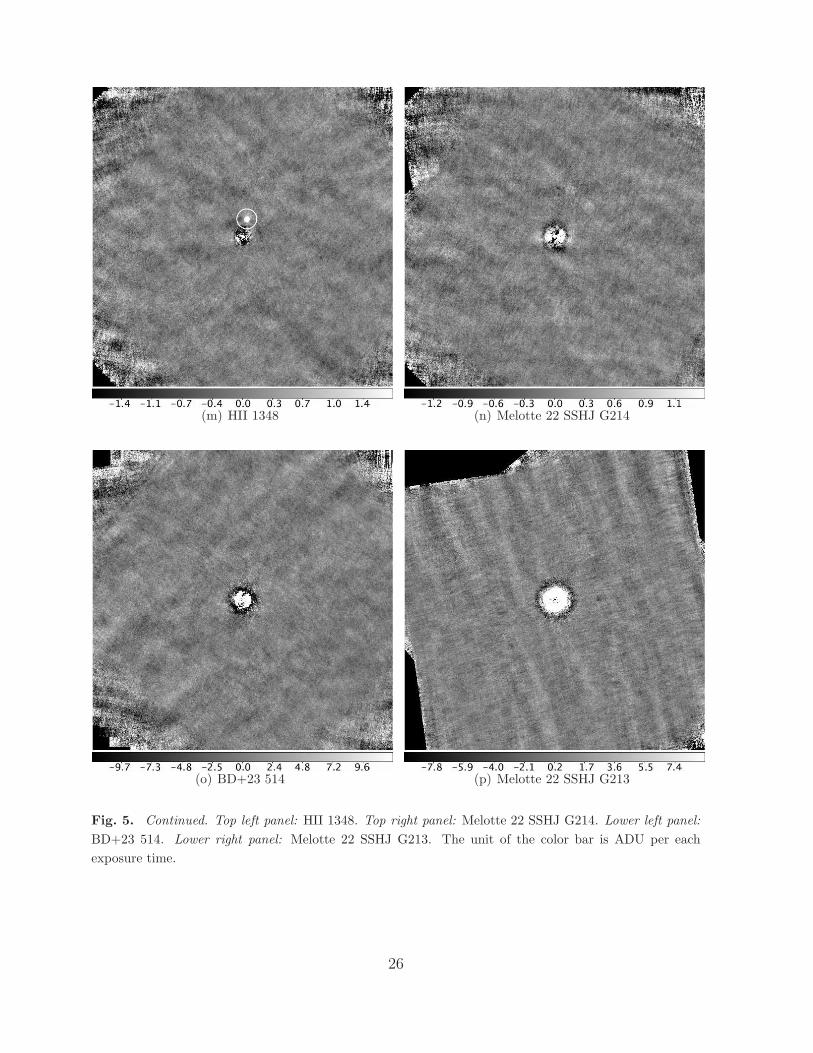
(m) HII 1348 (n) Melotte 22 SSHJ G214
(o) BD+23 514 (p) Melotte 22 SSHJ G213
Fig. 5. Continued. Top left panel: HII 1348. Top right panel: Melotte 22 SSHJ G214. Lower left panel:
BD+23 514. Lower right panel: Melotte 22 SSHJ G213. The unit of the color bar is ADU per each
exposure time.
26
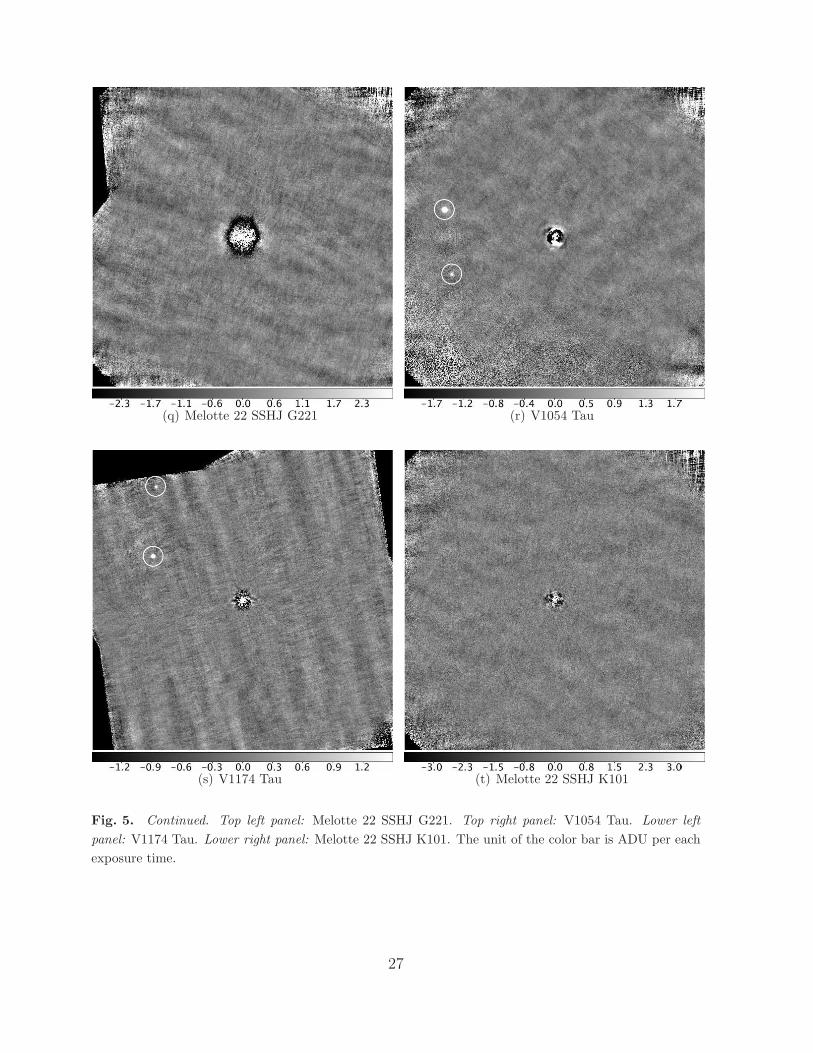
(q) Melotte 22 SSHJ G221 (r) V1054 Tau
(s) V1174 Tau (t) Melotte 22 SSHJ K101
Fig. 5. Continued. Top left panel: Melotte 22 SSHJ G221. Top right panel: V1054 Tau. Lower left
panel: V1174 Tau. Lower right panel: Melotte 22 SSHJ K101. The unit of the color bar is ADU per each
exposure time.
27

References
An, D., Terndrup, D. M., Pinsonneault, M. H., Paulson, D. B., Hanson, R. B., & Stauffer, J. R. 2007,
ApJ, 655, 233
Andrews, S. M., & Williams, J. P. 2007, ApJ, 659, 705
Baraffe, I., Chabrier, G., Allard, F., & Hauschildt, P. H. 1998, A&A, 337, 403
Baraffe, I., Chabrier, G., Allard, F., & Hauschildt, P. H. 2002, A&A, 382, 563
Baraffe, I., Chabrier, G., Barman, T. S., Allard, F., & Hauschildt, P. H. 2003, A&A, 402, 701
Basu, S., & Vorobyov, E. I. 2012, ApJ, 750, 30
Beaulieu, J. P., et al. 2006, Nature, 439, 437
Belikov, A. N., Hirte, S., Meusinger, H., Piskunov, A. E., & Schilbach, E. 1998, A&A, 332, 575
Belikov, A. N., Kharchenko, N. V., Piskunov, A. E., Schilbach, E., Scholz, R. D., & Yatsenko, A. I.
2002, A&A, 384, 145
Biller, B. A., et al. 2007, ApJS, 173, 143
Bouvier, J., Rigaut, F., & Nadeau, D. 1997, A&A, 323, 139
Cameron, A. G. W. 1978, Moon Planets, 18, 5
Carson, J., et al. 2012, eprint arXiv:1211.3744
Cassan, A., et al. 2012, Nature, 481, 167
Chabrier, G., & Baraffe, I. 2000, ARA&A, 38, 337
Chauvin, G., et al. 2010, A&A, 509, 52
Cumming, A., Butler, R. P., Marcy, G. W., Vogt, S. S., Wright, J. T., & Fischer, D. A. 2008, PASP,
120, 531
Currie, T., et al. 2011, ApJ, 729, 128
Cutri, R. M., et al. 2003, 2MASS All Sky Catalog of Point Sources (The IRSA
2MASS All-Sky Point Source Catalog, NASA/IPAC Infrared Science Archive.
http://irsa.ipac.caltech.edu/applications/Gator/)
Fortney, J. J., Marley, M. S., Hubickyj, O., Bodenheimer, P., & Lissauer, J. J. 2005, Astron. Nachr.,
326, 925
Fortney, J. J., Marley, M. S., Saumon, D., & Lodders, K. 2008, ApJ, 683, 1104
Gratton, R. 2000, ASPC, 198, 225
Geißler, K., Metchev, S. A., Pham, A., Larkin, J. E., McElwain, M., & Hillenbrand, L. A. 2012, ApJ,
746, 44
Hayano, Y., et al. 2010, Proc. SPIE, 7736, 21
Hodapp, K. W., et al. 2008, Proc. SPIE, 7014, 42
Howard, A. W., et al. 2010, Science, 330, 653
Ida, S. & Lin, D. N. C. 2004, ApJ, 604, 388
Inutsuka, S., Machida, M. N., & Matsumoto, T. 2010, ApJ, 718, 58
Itoh, Y., et al. 2005, ApJ, 620, 984
Itoh, Y., Oasa, Y., Funayama, H., Hayashi, M., Fukagawa, M., Hashiguchi, T., & Currie, T. 2011,
Research in Astron. Astrophys., 11, 335
Janson, M., Bonavita, M., Klahr, H., & Lafreniere, D. 2012, ApJ, 745, 4
28
Kouwenhoven, M. B. N., Goodwin, S. P., Parker, R. J., Davices, M. B., Malmberg, D., & Kroupa, P.
2010, MNRAS, 404, 1835
Kratter, K. M., Murray-Clay, R. A., & Youdin, A. N. 2010, ApJ, 710, 1375
Kubas, D., et al. 2008, A&A, 483, 317
Kuiper, G. P. 1951, Proc. Natl. Acad. Sci., 37, 1
Lafreniere, D., et al. 2007, ApJ, 670, 1367
Lagrange, A.-M., et al. 2010, Science, 329, 57
Liu, M. C. 2004, Science, 305, 1442
Lodieu, N., Dobbie, P. D., Deacon, N. R., Hodgkin, S. T., Hambly, N. C., & Jameson, R. F. 2007,
MNRAS, 380, 712
Marley, M. S., Fortney, J. J., Hubickyj, O., Bodenheimer, P., & Lissauer, J. J. 2007, ApJ, 655, 541
Marois, C., Lafreniere, D., Doyon, R., Macintosh, B., & Nadeau, D. 2006, ApJ, 641, 556
Marois, C., Macintosh, B., Barman, T., Zuckerman, B., Song, I., Patience, J., Lafreniere, D., &
Doyon, R. 2008, Science, 322, 1348
Marois, C, Zuckerman, B., Konopacky, Q. M., Macintosh, B., & Barman, T. 2010, Nature, 468, 1080
Masciadri, R., Mundt, R., Henning, Th., Alvarez, C., & Barrado y Navascues, D. 2005 ApJ, 625, 1004
Masset, F. S., & Papaloizou, J. C. B. 2003 ApJ, 588, 494
Mayor, M., et al. 2011, arXiv, 1109.2497
Micela, G., Sciortino, S., Kashyap, V., Harnden, F. R., Jr., & Rosner, R. 1996, ApJS, 102, 75
Mizuno, H. 1980, Prog. Theor. Phys., 64, 544
Nielsen, E. L., & Close, L. M. 2010, ApJ, 717, 878
Pinfield, D. J., Dobbie, P. D., Jameson, R. F., Steele, I. A., Jones, H. R. A., & Katsiyannis, A. C.
2003, MNRAS, 342, 1241
Pollack, J. B., Hubickyj, O., Bodenheimer, P., Lissauer, J. J., Podolak, M., & Greenzweig, Y. 1996,
Icarus, 124, 62
Raboud, D., & Mermilliod, J.-C. 1998, A&A, 329, 101
Rafikov, R. R. 2007, ApJ, 662, 642
Rafikov, R. R. 2011, ApJ, 727, 86
Rodriguez, D. R., Marois, C., Zuckerman, B., Macintosh, B., & Melis, C. 2012, ApJ, 748, 30
Soderblom, D. R., Nelan, E., Benedict, G. F., McArthur, B., Ramirez, I., & Spiesman, W. 2005, AJ,
129, 1616
Safronov, V. 1969, Evolution of the Protoplanetary Cloud and Formation of the Earth and Planets
Skiff, B. A. 2010, VizieR Online Data Catalog, 1, 2023
Spiegel, D. S., & Burrows, A. 2012, ApJ, 745, 174
Stauffer, J. R., Schultz, G., & Kirkpatrick, J. D. 1998, ApJ, 499, 199
Stauffer, J. R., et al. 2007, ApJS, 172, 663
Sumi, T., et al. 2010, ApJ, 710, 1641
Suzuki, R., et al. 2010, SPIE, 7735.101S
Tamura, M. 2009, American Institute of Physics Conference Series, 1158, 11
van der Marel, R. P., Gerssen, J., Guhathakurta, P., Peterson, R. C., & Gebhardt, K. 2002, AJ, 124,
3255
29

van Leeuwen, F. 2009, A&A, 497, 209
Veras, D., Crepp, J., & Ford, E. B. 2009, ApJ, 696, 1600
Vigan, A., et al. 2012, A&A, 544, 9
Wright, C. O., Egan, M. P., Kraemer, K. E., & Price, S. D. 2003, AJ, 125, 359
Zacharias, N., Monet, D. G., Levine, S. E., Urban, S. E., Gaume, R., & Wycoff, G. L. 2004, A&AS,
205,4815
30