Embed Size (px)
Citation preview
1
PrOpCom
Making Nigerian Agricultural Markets Work for the Poor
Monograph Series # 15
Mapping of Ofada Rice Production Area
By
A.M. Omotayo. K. Elemo and J. Oyedepo
Agricultural Media Resources and Extension Centre (AMREC) University of Agriculture Abeokuta
March 2007
Funding for this programme is provided by the United Kingdom’s Department for International Development (DFID)
40 Mississippi Street, Maitama, Abuja, Nigeria • Tel: +(234) 9 413 8291/2 • Fax: +(234) 9 413 829

2
3
Disclaimer
The PrOpCom Monograph Series seeks to provide a broader dissemination of the information and views collected through the efforts of the various service providers and consultants undertaking work in support of the PrOpCom programme. We believe this information will be useful in informing the policy dialogue in Nigeria and for improving the planning and execution of agricultural and agribusiness activities within the country. The documents in this series represent the final deliverables as presented by the engaged service providers or consultants in responds to terms of reference of contracts let by PrOpCom in execution of its programme. They have not been further edited or editorially polished. Consequently, there is wide variation in the editorial quality of these documents. Nevertheless, the information contained in these document is deems useful for policy and planning purposes. The views and opinions expressed in these documents are solely those of the authors of the document and do not necessarily represent the views of PrOpCom, SAII Associates, Chemonics International or PrOpCom’s funding agent, the Government of the United Kingdom’s Department for International Development (DFID) Information from these documents can be freely used and quoted on condition that it is properly sourced to the concerned document.

4
5
MAPPING OF OFADA RICE PRODUCTION AREAS
BY
A.M. Omotayo. K. Elemo and J. Oyedepo Agricultural Media Resources and Extension Centre (AMREC)
University of Agriculture PMB 2240, Abeokuta, Nigeria
REPORT OF A STUDY COMMISSIONED BY
PropCom
40 Mississippi St., Maitama, Abuja, Nigeria
March, 2007

6
7
List of Acronyms ADPs Agricultural Development programmes AMREC Agricultural Media Resources and Extension Centre GIS Geographical Information Systems GPS Global positioning Systems TOR Terms of Reference LGA Local Government Area FAO Food and Agricultural Organisation PropCom Promoting pro-poor opportunities in the service and commodity market FGD Focus Group Discussion FORMECU Forestry Monitoring, Evaluation and Coordinating Unit LANDSAT Land Satellite

8
9
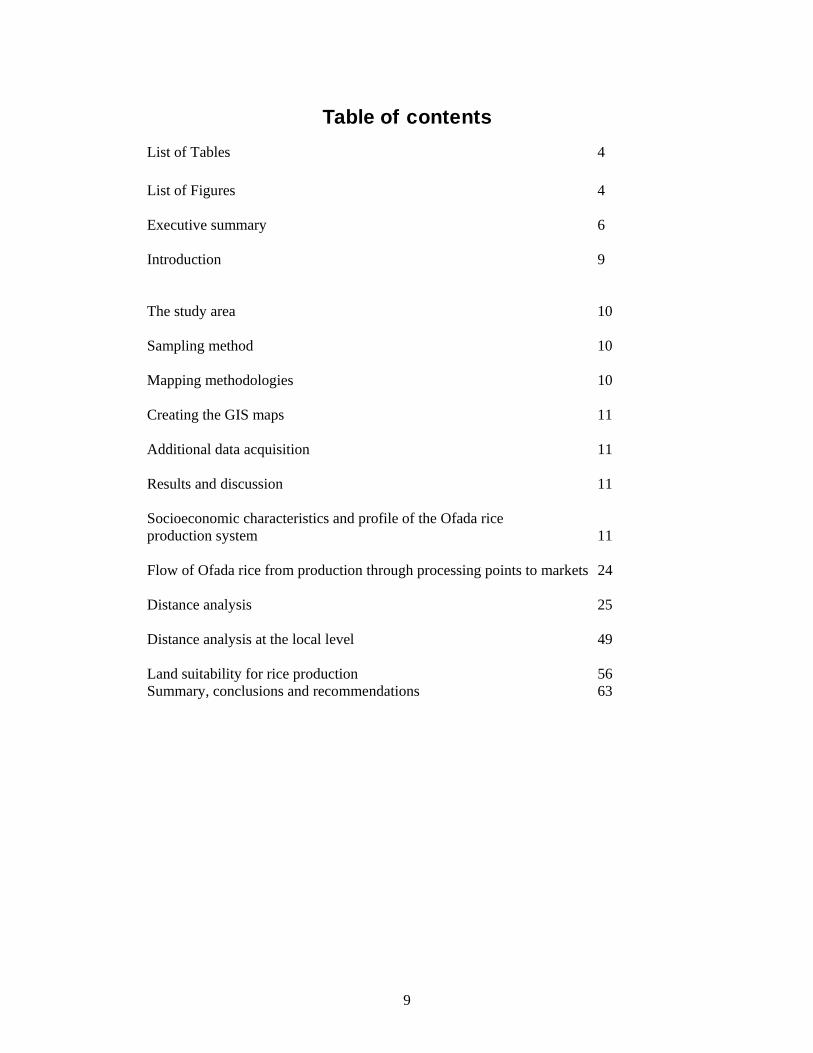
Table of contents
List of Tables 4 List of Figures 4 Executive summary 6 Introduction 9 The study area 10 Sampling method 10 Mapping methodologies 10 Creating the GIS maps 11 Additional data acquisition 11 Results and discussion 11 Socioeconomic characteristics and profile of the Ofada rice production system 11 Flow of Ofada rice from production through processing points to markets 24 Distance analysis 25 Distance analysis at the local level 49 Land suitability for rice production 56 Summary, conclusions and recommendations 63

10
11
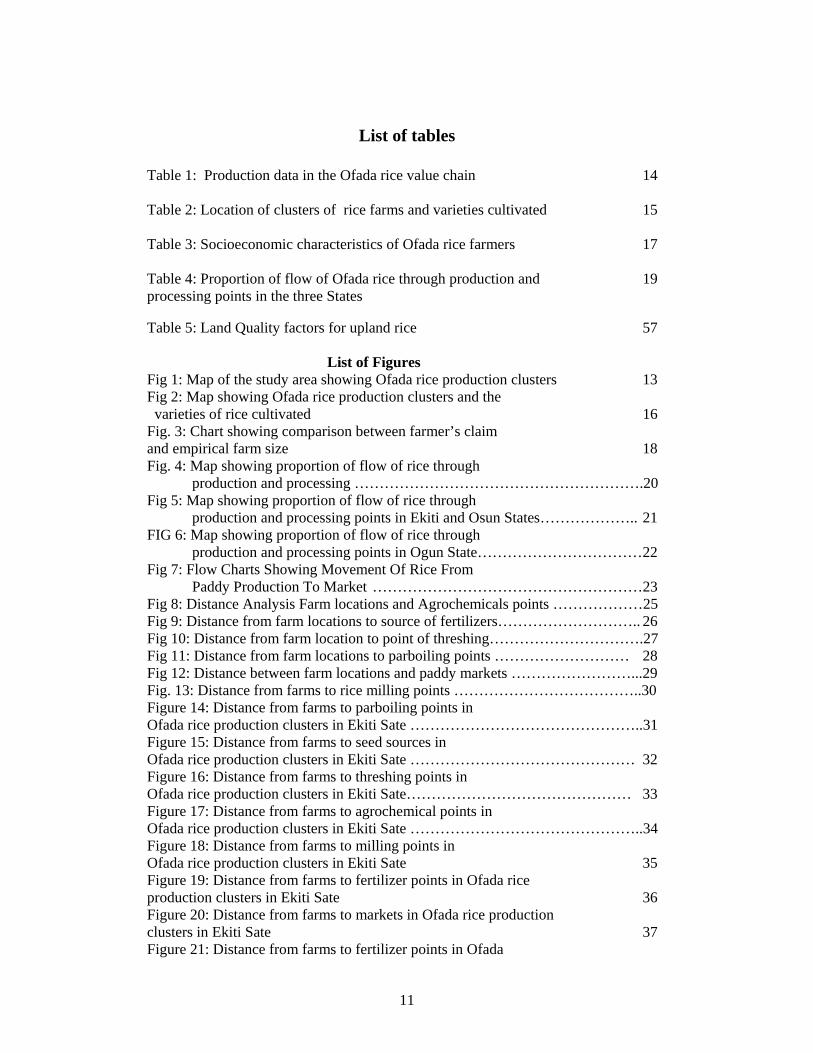
List of tables Table 1: Production data in the Ofada rice value chain 14 Table 2: Location of clusters of rice farms and varieties cultivated 15 Table 3: Socioeconomic characteristics of Ofada rice farmers 17 Table 4: Proportion of flow of Ofada rice through production and 19 processing points in the three States Table 5: Land Quality factors for upland rice 57 List of Figures Fig 1: Map of the study area showing Ofada rice production clusters 13 Fig 2: Map showing Ofada rice production clusters and the varieties of rice cultivated 16 Fig. 3: Chart showing comparison between farmer’s claim and empirical farm size 18 Fig. 4: Map showing proportion of flow of rice through
production and processing ………………………………………………….20 Fig 5: Map showing proportion of flow of rice through
production and processing points in Ekiti and Osun States……………….. 21 FIG 6: Map showing proportion of flow of rice through
production and processing points in Ogun State…………………………… 22 Fig 7: Flow Charts Showing Movement Of Rice From
Paddy Production To Market ………………………………………………23 Fig 8: Distance Analysis Farm locations and Agrochemicals points ………………25 Fig 9: Distance from farm locations to source of fertilizers……………………….. 26 Fig 10: Distance from farm location to point of threshing………………………….27 Fig 11: Distance from farm locations to parboiling points ……………………… 28 Fig 12: Distance between farm locations and paddy markets ……………………...29 Fig. 13: Distance from farms to rice milling points ………………………………..30 Figure 14: Distance from farms to parboiling points in Ofada rice production clusters in Ekiti Sate ………………………………………..31 Figure 15: Distance from farms to seed sources in Ofada rice production clusters in Ekiti Sate ……………………………………… 32 Figure 16: Distance from farms to threshing points in Ofada rice production clusters in Ekiti Sate……………………………………… 33 Figure 17: Distance from farms to agrochemical points in Ofada rice production clusters in Ekiti Sate ………………………………………..34 Figure 18: Distance from farms to milling points in Ofada rice production clusters in Ekiti Sate 35 Figure 19: Distance from farms to fertilizer points in Ofada rice production clusters in Ekiti Sate 36 Figure 20: Distance from farms to markets in Ofada rice production clusters in Ekiti Sate 37 Figure 21: Distance from farms to fertilizer points in Ofada
12
rice production clusters at Erin –Ijesha, OsunSate 38 Figure 22: Distance from farms to seed sources in rice production clusters in Erin Oke, Osun Sate 39 Figure 23: Distance from farms to parboiling points at Erin Oke, Osun Sate 40 Figure 24: Distance from farms to milling points at Erin Oke, Osun Sate 41 Figure 25: Distance from farms to fertilizer source at Erin Oke, Osun Sate 42 Figure 26: Distance from farms to milled rice markets in Ogun Sate 43 Figure 27: Distance from farms to Agrochemical points in Ogun Sate 44 Figure 28: Distance from farms to sources of seeds in Ogun Sate 45 Figure 29: Distance from farms to fertilizer source in Ogun Sate 45 Figure 30: Distance from farms to rice milling points in Ogun Sate 46 Figure 31: Distance from farms to rice parboiling points in Ogun Sate 47 Figure 32: Distance from farms to rice threshing points in Ogun Sate 48 Figure 33: Distance from farms to paddy markets in Ogun State 49 Figure 34: Map of land use and land cover of Osun State 50 Figure 35: Map of land use and land cover in rice producing areas of Osun State (Erin Oke) 51 Figure 36: Map of land use and land cover of Ekiti State 52 Figure 37: Map of land use and land cover in rice producing areas of Ekiti State 53 Figure 38: Map of land use and land cover of Ogun State 54 Figure 39: Map of land use and land cover in rice production of Ogun State 55 Fig. 40: Land suitability map for rice production in Ekiti State 59 Fig. 41: Land suitability map for rice production in Osun State 60 Fig. 42: Land suitability map for rice production in Ogun State 61 Appendices 66
13
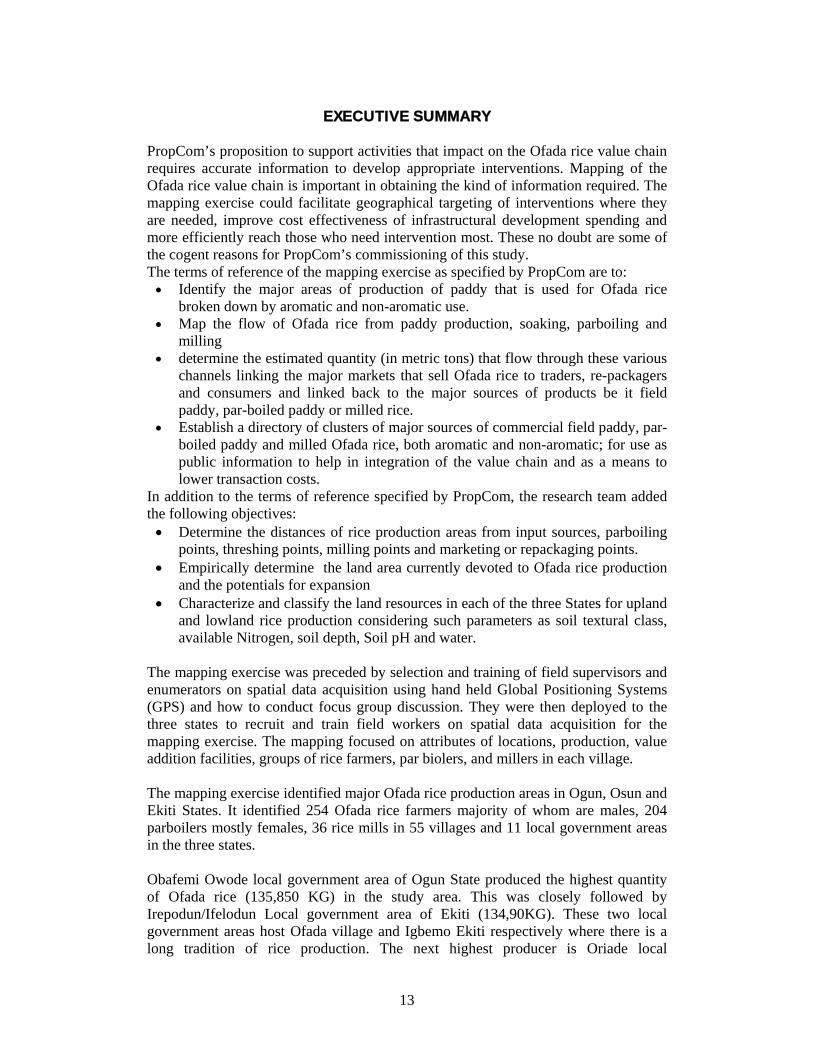
EXECUTIVE SUMMARY
PropCom’s proposition to support activities that impact on the Ofada rice value chain requires accurate information to develop appropriate interventions. Mapping of the Ofada rice value chain is important in obtaining the kind of information required. The mapping exercise could facilitate geographical targeting of interventions where they are needed, improve cost effectiveness of infrastructural development spending and more efficiently reach those who need intervention most. These no doubt are some of the cogent reasons for PropCom’s commissioning of this study. The terms of reference of the mapping exercise as specified by PropCom are to: • Identify the major areas of production of paddy that is used for Ofada rice
broken down by aromatic and non-aromatic use. • Map the flow of Ofada rice from paddy production, soaking, parboiling and
milling • determine the estimated quantity (in metric tons) that flow through these various
channels linking the major markets that sell Ofada rice to traders, re-packagers and consumers and linked back to the major sources of products be it field paddy, par-boiled paddy or milled rice.
• Establish a directory of clusters of major sources of commercial field paddy, par-boiled paddy and milled Ofada rice, both aromatic and non-aromatic; for use as public information to help in integration of the value chain and as a means to lower transaction costs.
In addition to the terms of reference specified by PropCom, the research team added the following objectives: • Determine the distances of rice production areas from input sources, parboiling
points, threshing points, milling points and marketing or repackaging points. • Empirically determine the land area currently devoted to Ofada rice production
and the potentials for expansion • Characterize and classify the land resources in each of the three States for upland
and lowland rice production considering such parameters as soil textural class, available Nitrogen, soil depth, Soil pH and water.
The mapping exercise was preceded by selection and training of field supervisors and enumerators on spatial data acquisition using hand held Global Positioning Systems (GPS) and how to conduct focus group discussion. They were then deployed to the three states to recruit and train field workers on spatial data acquisition for the mapping exercise. The mapping focused on attributes of locations, production, value addition facilities, groups of rice farmers, par biolers, and millers in each village. The mapping exercise identified major Ofada rice production areas in Ogun, Osun and Ekiti States. It identified 254 Ofada rice farmers majority of whom are males, 204 parboilers mostly females, 36 rice mills in 55 villages and 11 local government areas in the three states. Obafemi Owode local government area of Ogun State produced the highest quantity of Ofada rice (135,850 KG) in the study area. This was closely followed by Irepodun/Ifelodun Local government area of Ekiti (134,90KG). These two local government areas host Ofada village and Igbemo Ekiti respectively where there is a long tradition of rice production. The next highest producer is Oriade local
14
government area in Osun State which recorded a production level of 70,100 KG. The highest quantity of rice parboiled and milled was 109,800 Kg and this is from Obafem Owode Local government area. The lowest quantity parboiled and milled was 7, 670 Kg and this is from Ijero local government area of Ekiti State. The quantity of Ofada rice sold in paddy form was 21,110 Kg in Ogun Waterside local government area of Ogun State and 15,700 Kg in Ekiti West Local government area of Ekiti State. The total quantity of rice sold in paddy form was 36, 813Kg. The distance analyses data consistently show that facilities for rice threshing, parboiling, milling, were readily available at local levels and within a short distance (between 2 and 4 kilometres) of the farmers’ farm or residence. Although urban markets may appear to be very far away from rice production locations according to the distance analysis data, farmers did not seem to have problems selling their paddy or milled rice as buyers came directly to these locations to buy. The data further show that locations of Ofada rice production inputs such as seeds, agrochemicals and fertilizer were far away from farmers’ field and residence (between 5 and 30 kilometres) and may not be readily available to the majority of rice farmers. This situation points to the need for direct intervention to improve access of farmers to all rice production inputs.
The total arable crop land in rice production areas of Ekiti state is 100,524.411Ha. This represents about 84 percent of the total arable land area in the four local governments where rice is produced. Less than 10 percent of this is currently under rice cultivation. In Osun state, Oriade local government area identified as the rice production area has 47,710Ha (79%) arable land. In Ogun state apart from 67% (337,180Ha) of land available as arable land with possibility for upland rice cultivation, about 625,62Ha or (12.5%) of the land area was categorised as wetland. This area could be explored for lowland rice cultivation within the five local government areas studied. It was established that the soils around Aramoko, Ijero Ekiti up to Ifaki were highly suitable for upland rice cultivation while the soils around Ado-Ekiti, Iyin Ekiti, Igede Ekiti and Igbemo are marginally suitable. The soils around Efon Alaye, and Oke Imesi were classified as moderately suitable. The implication of this is that rice farmers in Igbemo Ekiti would require special attention in soil management and land amendment practices to guarantee steady and improved productivity. In Osun state soils close to Ilesha, particularly Erin Oke was classified as highly suitable, but over 79% of the arable land are categorised as marginal. Ogun state presents a unique feature especially around Obafemi Owode local government where almost 50% of the arable soil is considered as highly suitable for the cultivation of upland rice. This is a bit surprising given the long years of rice cultivation in the area one would expect the soil to be generally deficient in critical rice soil nutrients. It could be that most farmers in this area who adopt the well known use of rotational fallow system have somehow perfected this form of land management strategy for ensuring quick replenishment of lost soil nutrients Ijebu North Local government area presents a slightly different picture. One half of the area is categorised as marginally suitable while the other half is classified as moderately suitable. Soils of Ijebu water-side are mostly deficient in nitrogen and phosphorus. The focus in this area should be development of lowland rice production.
15
In conclusion, the distance analysis maps reveal the importance of spatial targeting and prioritization of interventions. It is hoped that this result will be utilized by PropCom in developing, prioritizing and targeting interventions to positively impact the Ofada rice value chain in south western Nigeria. A number of issues related to the Ofada rice value chain require further research and analysis. This mapping exercise was carried out when there was no crop growing on the field. A more detailed mapping of the production system with empirical farm management data would reveal more comprehensively the problems associated with each stage of the Ofada rice production system.

16
17
MAPPING OF OFADA RICE PRODUCTION AREAS
INTRODUCTION Rice (Oryza sativa L.) which was once considered a special treat during festivals in most homes in Nigeria has assumed the position of one of the most important staple foods in recent years. While domestic production of the commodity estimated at 4.6 metric tonnes has not kept pace with the increasing demand, the country has had to resort to massive importation over the years. The domestic production levels remained either stagnant or even depressed in some cases due to crude and back breaking methods still employed by most producers, weak infrastructural base, high production costs and numerous market imperfections. Ofada rice is commonly assumed to be a type of rice that has long been cultivated and produced in a community called Ofada in Ogun State. Its rise to eminence as a popular type of rice is associated with what has been described as its characteristic bold, short, mouth-filling, palate caressing, red coated karnel in its unpolished form. Although many varieties of rice produced locally fit the description of Ofada rice, each type comes with different kinds of local names associated with either the communities where such varieties are produced or the original source of the variety. For instance some local rice called Igbemo rice, Kogi rice, etc fit the Ofada rice description. The term Ofada rice therefore refers generically to mean any locally produced rice that fits the description profiled above irrespective of where the rice is produced in the three states where this study was carried out. As noted in one of PropCom’s documents, Ofada rice has recently become popular as specialty rice often served at parties and other status events by the elites; sold in fast food restaurants, and also in ½ kg boxes by marketers in Lagos, Ibadan Abeokuta and other cities in the South West with spread effects to other parts of the country. The proposition by PropCom to support activities that impact on the entire Ofada rice value chain is a step in the right direction. However information is required to support decision making and develop appropriate interventions. Mapping of the Ofada rice value chain is important in developing a decision support mechanism for the overall improvement of the rice production system. Mapping will facilitate geographical targeting of interventions where they are needed, improve cost effectiveness of infrastructural development spending and more efficiently reach those who need intervention most. The terms of reference of the mapping exercise as specified by PropCom are to: • Identify the major areas of production of paddy that is used for Ofada rice
broken down by aromatic and non-aromatic use. • Map the flow of Ofada rice from paddy production, soaking, parboiling and
milling • determine the estimated quantity (in metric tons) that flow through these various
channels linking the major markets that sell Ofada rice to traders, re-packagers and consumers and linked back to the major sources of products be it field paddy, par-boiled paddy or milled rice.
18
• Establish a directory of clusters of major sources of commercial field paddy, par-boiled paddy and milled Ofada rice, both aromatic and non-aromatic; for use as public information to help in integration of the value chain and as a means to lower transaction costs.
In addition to the terms of reference specified by PropCom, the research team added the following objectives: • Determine the distances of rice production areas from input sources, parboiling
points, threshing points, milling points and marketing or repackaging points. • Empirically determine the land area currently devoted to Ofada rice production
and the potentials for expansion • Characterize and classify the land resources in each of the three States for upland
and lowland rice production considering such parameters as soil textural class, available Nitrogen, soil depth, Soil pH and water.
Study Area The mapping exercise covered Ofada rice production communities in the five (5) rice production areas of Ogun state, namely, Obafemi Owode, Abeokuta North, Ogun Water side, Ifo, Ewekoro and Ijebu-North Local government areas. Also included are the rice production clusters of Igbemo, Ijero, Aramoko, Efon Alaye Afawo, Are, Erio all in Ekiti State and Erin-Ijesha and Erin -Oke in Osun State. Sampling method A combination of purposive and multi-stage random sampling procedure was used in selecting the sample for this study. States were selected purposively based on the terms of reference provided by PropCom. The Local government areas were also selected purposively based on the terms of reference and the local governments identified by the State ADP for rice cultivation. Villages and farmers in the local government areas were selected based on the proportional volume of rice production activities. In some communities and villages, complete enumeration of rice farmers, parboilers, and millers were carried out depending on the number of such people in each community or village. Mapping Methodologies The mapping exercise was preceded by selection and training of field supervisors or enumerators on the use of Global Positioning Systems (GPS) and how to conduct focus group discussion. Field supervisors were then deployed to the three states to recruit and train field workers on the use of GPS in the acquisition of spatial data for the mapping exercise and on how to conduct focus group discussions. The focus group discussions involved groups of rice farmers, parbiolers, and millers in each village and it centred on types and varieties of rice cultivated, farm size, length of period of rice cultivation, paddy yield, quantities of paddy sold as paddy, quantity milled, etc. The following spatial variables were used for the mapping exercise: Variable Source Distance to and from production and value addition facilities GPS coordinates Empirical farm size GPS coordinates of farm perimeter
19
Soil Fertility/characterization of land resources Soil samples analyzed + FAO Digital Soil Map of the World Land use/Land cover Geomatics of Canada Ofada rice paddy production sites GPS coordinates Ofada rice milling and per boiling sites GPS coordinates Quantity of Ofada rice through value chain Fieldwork data Directory of commercial paddy/milled rice Fieldwork data Creating the GIS maps
Trained enumerators obtained the coordinates of locations needed for creating the maps using high precision GPS receivers (Garmin 12+, Garmin Etrex and Megalin receivers). The coordinates were incorporated into geo-referenced map of the study areas. Location of farms, markets, roads, and value addition infrastructure were incorporated into the maps. These data, including the geographic location of farmers’ residence and farms form the farmers’ GIS directory. Other data considered useful for spatial analysis were also collected. The full attributes of the area were captured through observation, Focus Group Discussion FGD, key informant interviews, discussion with rice growers association in each State and secondary sources.
Soil samples were collected from the top (15cm from the top) and sub-soil (Beyond 15cm from the top) of selected sample of farms in each local government area and the geographical coordinates of points where soil samples were collected was obtained.
The attributes were then put into a relational database in a Geographical Information System (GIS). Spatial data were analysed using Arc view 3.2a
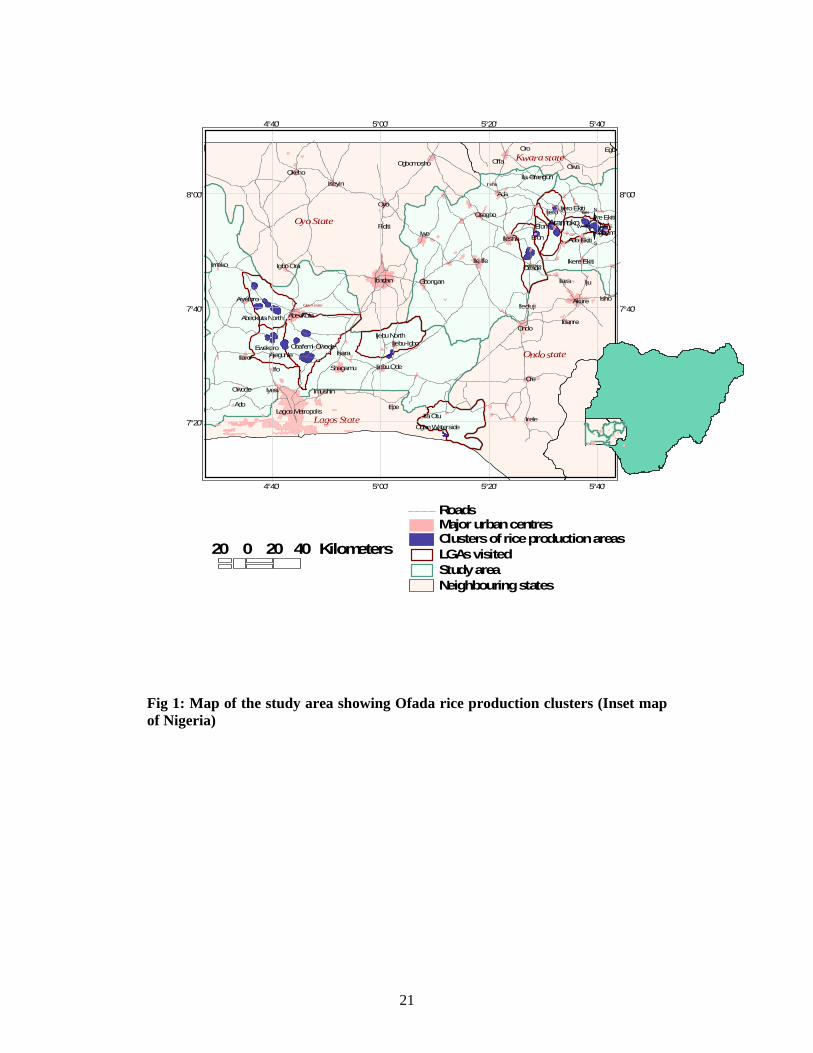
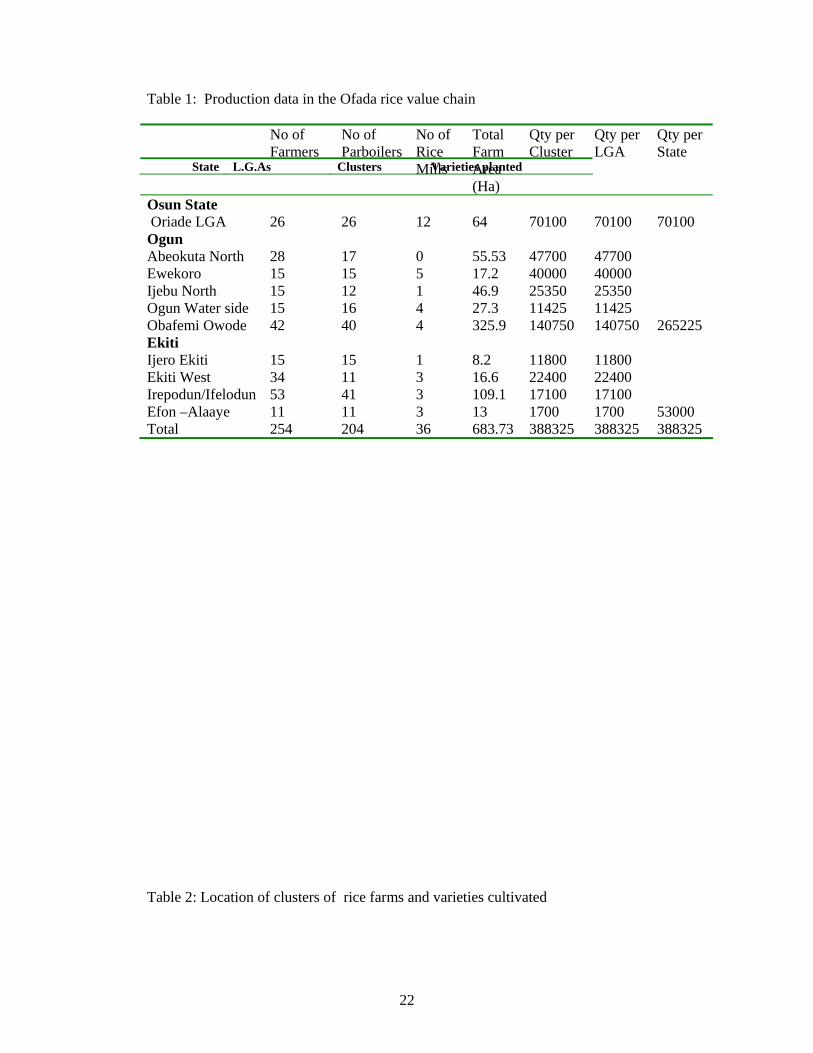
Additional data acquisition Additional data were obtained from secondary sources such as Satellite remote sensing data, Topographical map sheets, census/farm household list of the Agricultural Development Programmes.(ADPs). Socioeconomic and production data were analyzed using descriptive statistics. Results and discussion Socioeconomic characteristics and profile of the Ofada rice production system A total of 254 farmers, 204 parboilers, 36 rice mills, were contacted in 55 villages and 11 local government areas in the three states where Ofada rice is produced in south western Nigeria. These data are presented in Table 1 below. Figure 1 is the map of the study area showing clusters of Ofada rice production areas in Ogun Osun and Ekiti States. Table 2 shows the socio-economic characteristics of Ofada rice farmers. The data show that over 70percent of the farmers are below the age of fifty years. This is an indication that most of them are in their very active years. This age structure is not typical of the farming populace in Nigeria as many previous studies indicate that most farmers are over fifty years. Table 2 shows that many other varieties of rice other than Ofada were cultivated in the rice production areas in south western Nigeria. Even in Ogun State where Ofada rice is very popular and is the dominant variety in some local government areas, some local varieties of rice such as Mokwa, Igbemo with similar characteristics to that of Ofada were cultivated.
20
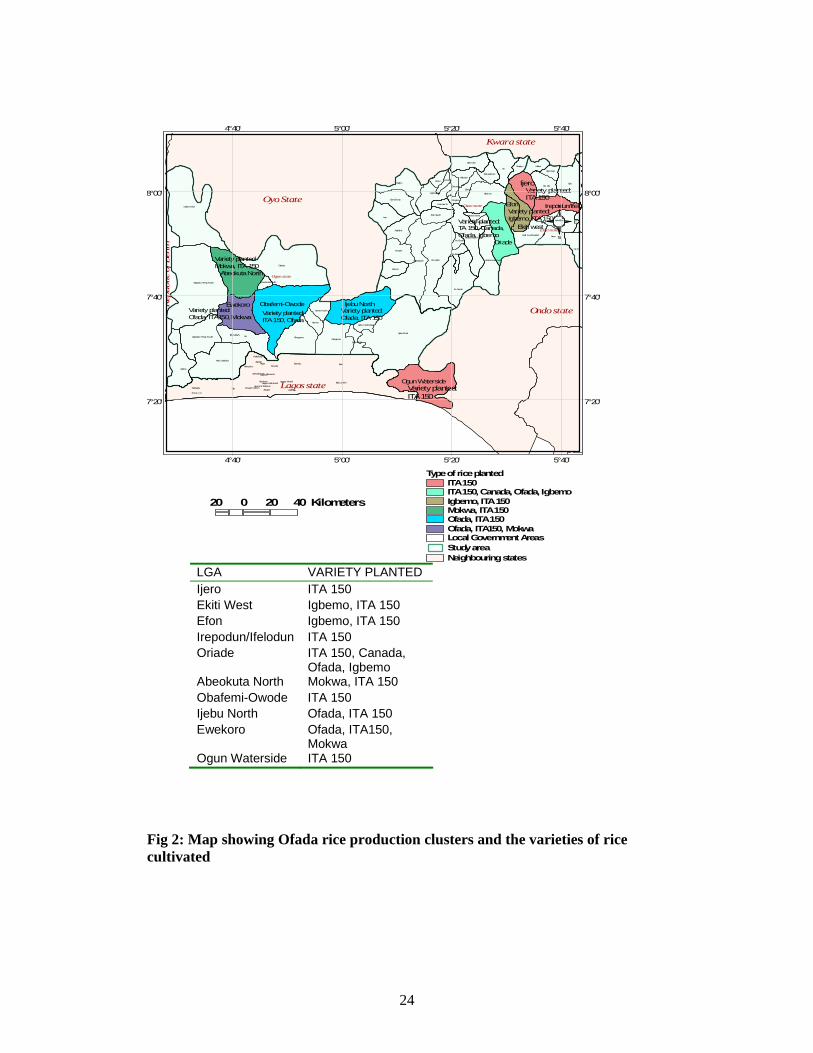
The data in Table 3 also show that over 78 percent of Ofada rice farmers are men while the remaining 22 percent are women. Most of the farmers are small scale producers as over 80 percent of them cultivated less than 1 hectare. This issue of farm size was explored empirically by taking GPS perimeter coordinates of a random sample of at least ten farms in each local government area. This was done to obtain the actual size of the farm using GIS area measurement menu in ArcView 3.2a. The average farm size across the three States was 3.95 Ha from what farmers reported, while the average farm size from empirical measurement was 0.72 Ha. There was very low correlation between what the farmer reported and the results obtained from empirical measurement. This is depicted in Figure 3. Only a small proportion (4%) of the farmers used mechanized land preparation. The data in Table 3 also indicate very low external input in the Ofada rice production system as less than 20 percent of the farmers used fertilizers, improved seeds and all the farmers threshed their rice manually. Most (68%) Ofada rice farmers sourced their seeds from their previous harvests. A prominent deficiency in the Ofada rice production system is the lack of commercial seed production. Farmers convert part of their grains to seed year after year. This may be partly responsible for the characteristic low yield associated with Ofada rice.
21
Ibadan
Lagos Metropolis
Akure
Iwo
Ile Ife
Ilesha
Ondo
Abeokuta
Offa
Oyo
Shagamu
Ada
Ilaro
Osogbo
Ado Ekiti
Epe
Irele
Iseyin
Ijebu Ode
Ore
Ogbomosho
Isho
Ikere Ekiti
Idanre
Ijebu-Igbo
Imushin
Ileoluji
Iju
Okeho
Igo Obaz
Ilara
Ajegunle
Ifo
Aiyetoro
Gbongan
Owa
Ijero Ekiti
Igbo Ora
Egbe
Iyesi
Oro
Ado
Owode
Ila Orangun
Fiditi
Ita Otu
Isara
Imeko
Inisha
Ipetu Ijesha
Are EkitiAramoko
Ifaki
Oyo State
Ondo state
Kwara state
Ogun state
Igbemo
Ijebu North
Efon
Oriade
Lagos State
Obafemi-Owode
Ijero
Ewekoro
Ogun Waterside
Abeokuta North
Efon
Neighbouring statesStudy areaLGAs visited Clusters of rice production areas Major urban centresRoads
20 0 20 40 Kilometers
S
N
EW
7°20' 7°20'
7°40' 7°40'
8°00' 8°00'
4°40'
4°40'
5°00'
5°00'
5°20'
5°20'
5°40'
5°40'
Ondo st ate
Ek iti s ta te Ika re A ko ko
Fig 1: Map of the study area showing Ofada rice production clusters (Inset map of Nigeria)
22
Table 1: Production data in the Ofada rice value chain
Table 2: Location of clusters of rice farms and varieties cultivated
No of Farmers
No of Parboilers
No of Rice Mills
Total Farm Area (Ha)
Qty per Cluster
Qty per LGA
Qty per State
Osun State Oriade LGA 26 26 12 64 70100 70100 70100 Ogun Abeokuta North 28 17 0 55.53 47700 47700 Ewekoro 15 15 5 17.2 40000 40000 Ijebu North 15 12 1 46.9 25350 25350 Ogun Water side 15 16 4 27.3 11425 11425
Obafemi Owode 42 40 4 325.9 140750 140750 265225 Ekiti Ijero Ekiti 15 15 1 8.2 11800 11800 Ekiti West 34 11 3 16.6 22400 22400 Irepodun/Ifelodun 53 41 3 109.1 17100 17100
Efon –Alaaye 11 11 3 13 1700 1700 53000 Total 254 204 36 683.73 388325 388325 388325
State L.G.As Clusters Varieties planted

23
Ekiti Efon –Alaye Efon –Alaye Igbemo, Ofada, ITA 150 Ijero Ijero-Ekiti Igbemo, Ofada, ITA 150 Irepodun/Ifelodun Afao Igbemo, Ofada, ITA 150 Are Igbemo, ,ITA 150 Igbemo Igbemo, ITA 150 Iworoko Igbemo, ITA 150 Ekiti west Erio Igbemo, ITA 150 Aramoko Igbemo, , ITA 150 Osun Oriade Erinoke/Erin
Ijesha ITA150,Canada,Ofada,Igbemo
Ogun Abeokuta north Alamala
Baracks ITA150, Mokwa
Ijale papa ITA150, Mokwa Anigbado ITA150, Mokwa Tibo-Akungun ITA150, Mokwa Ewekoro Onibotuje Adekunle-Sigo
road
Mosan Egan Ijebu North Aparaki Imope Odosapo Obafemi owode Ogboloko Ofada, ITA 150, Ofada-Abaren Moloku Asipa Ogun waterside Odeomi Lago Island Mufere island
24
Rep
ubl
ic o
f Ben
in
Oyo State
Ondo state
Kwara state
Lagos stateBadagry LGA
Ifo LGA
Osun state
Ekiti state
Ogun state
Epe
Ijebu East
Odeda
Ifo
Ila
Imeko-Afon
Oye
Ife NorthAiyedaade
Egbado /Yewa North
Iwo
Ipokia
Ife South
Ado Odo/Ota
Obokun
Shagamu
Ejigbo
Badagry Ojo
Odogbolu
Ikorodu
Ibeju Lekki
Irewole
Ikere
Ise /Oru
Ido-Osi
Ado-Ekiti
Atakumosa East
Aiyedire
Atakumosa West
Ola-Oluwa
Egbado /Yewa South
Egbedore
Odo-Otin
Isokan
Eti-Osa
Moba
Ede South
Boripe
Ikenne
Lagos Island
Ekiti South-West
Ijebu-Ode
Ifelodun
Alimosho
Orolu
Ifedayo
Remo-North
Ife East
Amuwo Odofin
BoluwaduroIlejemeje
Kosofe
Olorunda
Ikeja
Ede North
Ijebu North-East
Ilesha East
Irepodun
Osogbo
Ife Central
Apapa
Ilesha West
Abeokuta South
Surulere
Ifako/Ijaye
Oshodi/Isolo
Agege
MushinShomolu
Lagos MainlandAjeromi/ Ifelodun
Ijero
Ekiti west
Ogun Waterside
Obafemi-Owode Ijebu NorthEwekoro
Abeokuta North
Efon Irepodun/Ifelo
Oriade
Variety planted:ITA 150, Ofada
Variety planted:Ofada, ITA 150
Variety planted:Mokwa, ITA 150
Variety planted:TA 150, Canada, Ofada, Igbemo
Variety planted:Igbemo, ITA 150
Variety planted:Ofada, ITA150, Mokwa
Variety planted:ITA 150
Variety planted:ITA 150
Neighbouring statesStudy areaLocal Government Areas
Type of rice plantedITA 150ITA 150, Canada, Ofada, IgbemoIgbemo, ITA 150Mokwa, ITA 150Ofada, ITA 150Ofada, ITA150, Mokwa
20 0 20 40 Kilometers
S
N
EW
7°20' 7°20'
7°40' 7°40'
8°00' 8°00'
4°40'
4°40'
5°00'
5°00'
5°20'
5°20'
5°40'
5°40'
Fig 2: Map showing Ofada rice production clusters and the varieties of rice cultivated
LGA VARIETY PLANTED Ijero ITA 150 Ekiti West Igbemo, ITA 150 Efon Igbemo, ITA 150 Irepodun/Ifelodun ITA 150 Oriade ITA 150, Canada,
Ofada, Igbemo Abeokuta North Mokwa, ITA 150 Obafemi-Owode ITA 150 Ijebu North Ofada, ITA 150 Ewekoro Ofada, ITA150,
Mokwa Ogun Waterside ITA 150

25
Table 3: Socioeconomic characteristics of Ofada rice farmers VARIABLE FREQUENCY PERCENTAGE Age <30 31-40 41-50 51-60 >60 Total
27 62 52 43 13 197
13.7 31.5 26.4 21.8 6.6 100
Sex Female Male Total
42 155 197
21.3 78.7 100
Marital Status Married Single Total
184 13 197
93.4 6.6 100
Household size 1-5 6-10 >10 Total
59 126 12 197
29.9 64.0 6.1 100
Farm size <2.5 2.6-5.0 >5.0 Total
162 32 3 197
82.2 16.2 1.5 100
Method of Land Preparation Manual & Mechanized Manual Mechanized Total
1 188 8 197
0.5 95.4 4.1 100
Fertilizer usage No Yes Total
157 40 197
79.9 20.3 100
Weeding Interval Once Twice More than twice Total
25 120 52 197
12.7 60.9 26.4 100
Sources of seeds Agro services Previous harvest Fellow farmers Open market Total
35 134 27 1 197
17.8 68.0 13.7 0.5 100
. VARIABLE FREQUENCY PERCENTAGE Marketed rice form Milled form Paddy form Total
171 26 197
86.8 13.2 100
Type of thresher Manual
197
100
26
0
2
4
6
8
10
12
14
16
18
AREA__HA_ Farms
Farn
siz
e (H
a)
Farmer's claimEmpirical measurement
Fig. 3: Chart showing comparison between farmer’s claim and empirical farm size
27
Table 4: Proportion of flow of Ofada rice through production and processing points in the three States State Local
Government Areas
Quantity produced (kg)
Quantity soaked (kg)
Quantity parboiled (kg)
Quantity sold as paddy (kg)
Quantity milled (kg)
Quantity of whole grain rice recovered (kg)
Ekiti Ijero 11800.00 0.00 7670.00 0.00 7670.00 4985.50
Ekiti Ekiti West 45900.00 0.00 29835.00 15700.00 29835.00 19392.75
Ekiti Efon –Alaye 17000.00 0.00 17000.00 0.00 15550.00 11070.50
Ekiti Irepodun/Ifelodun 134900.00 0.00 87685.00 0.00 87685.00 56995.25
Osun Oriade 70100.00 64100.00 64100.00 0.00 64100.00 41665.00
Ogun Abeokuta North 41250.00 0.00 36260.00 0.00 36260.00 23569.00
Ogun Obafemi-Owode 135850.00 0.00 109850.00 0.00 109850.00 71402.50
Ogun Ijebu North 42000.00 0.00 42000.00 0.00 42000.00 27300.00
Ogun Ewekoro 40000.00 0.00 24708.00 0.00 24708.00 16060.53
Ogun Ogun Waterside 31710.00 0.00 9004.00 21113.00 9004.00 5852.60
277330.3
28
Oyo State
Ondo state
Kwara stateKo
Edo state
Obafemi-Owode LGA
Ijero
Ijebu North LGAEwekoro LGA
Ogun Waterside
Abeokuta North LGA
Ekiti West
Irepodun/Ifelodun
Efon
Oriade
Lagos State
Osun State
Neighbouring statesStudy area
Proportions of flow of rice in processing pointsQty ProducedQty. SoakedQty. ParboiledQty sold as paddyQty. MilledQty. of Brown rice
LGAs visited
20 0 20 40 Kilometers
S
N
EW
7°20' 7°20
7°40' 7°40
8°00' 8°00
4°40'
4°40'
5°00'
5°00'
5°20'
5°20'
5°40'
5°40'
FIG. 4: Map showing proportion of flow of rice through production and processing points in the three States
29
Ikole
Ila
Oye
Obokun
Gboyin
Emure
Ikere
Ise /Orun
Ido-Osi
Ado-Ekiti
Atakumosa East
Atakumosa West
Odo-OtinMoba
Boripe
Ekiti South-West
Ifelodun
Ifedayo
BoluwaduroIlejemeje
Ilesha East
Ilesha West
Oriade
Ijero
Efon
Ekiti West
Irepodun/IfelodunOsun state
Ekiti state
Ondo state
Are cluster
Erio clusterEfon cluster
Iworoko cluster
Ijero cluster
Erinoke_Erinijesha cluster
Aramoko cluster
Igbemo cluster
Neighbouring statesStudy areaLocal Government AreasOfada rice productuion areasClusters of rice production areas
Proportion of rice flow ProducedSoakedParboiledMilled20 0 20 Kilometers
S
N
EW
7°20' 7°20'
7°40' 7°40'
8°00' 8°00'
5°00'
5°00'
5°20'
5°20'
Fig 5: Map showing proportion of flow of rice through production and processing points in Ekiti and Osun States
Local Government Areas
Quantity produced (kg)
Quantity soaked (kg)
Quantity parboiled (kg)
Quantity milled (kg)
Ijero 11800 7670 7670Ekiti West 45900 29835 29835Efon - Alaye 17000 17000 15550Irepodun/ Ifelodun
134900 87685 87685
Oriade/ Osun State
70100 64100 64100 64100
30
Rep
ubl
ic o
f B
enin
Oyo State
Lagos state
Badagry LGA
Ifo LGA
Oriade
Obafemi-Owode LGA
Ijebu North LGA
Ewekoro LGA
Ogun Waterside
Abeokuta North LGA
EfOsun state
Ogun state
Oyo state
Neighbouring statesStudy area
Proportions of flow of rice in processing pointsQty ProducedQty. SoakedQty. ParboiledQty sold as paddyQty. MilledQty. of Brown rice
40 0 40 Kilometers
S
N
EW
6°40' 6°40'
7°00' 7°00'
7°20' 7°20'
3°20'
3°20'
3°40'
3°40'
4°00'
4°00'
FIG 6: Map showing proportion of flow of rice through production and processing points in Ogun State
Local Government Areas
Quantity produced (kg)
Quantity parboiled (kg)
Quantity milled (kg)
Abeokuta North
41250.00 36260.00 36260.00
Obafemi-Owode
135850.00 109850.00 109850.00
Ijebu North 42000.00 42000.00 42000.00Ewekoro 40000.00 24708.00 24708.00Ogun Waterside
31710.00 9004.00 9004.00
31
FIG 7: FLOW CHARTS SHOWING MOVEMENT OF RICE FROM PADDY PRODUCTION TO MARKET
MILING PADDY RICE TAKEN TO THE MILL (426,662 KG)
MIILED RICE SOLD IN THE MARKET 2772344,03Kg
RICE SOLD IN PADDY FORM 36,813 KG
RE-PACKAGERS
PARBOILING PADDY RICE PARBOILING (428,112.5 KG)
STORAGE PADDY RICE STORED (59,710 KG)
FARM PADDY RICE PRODUCTION (570,510 KG)
FARM IMPUTS SEEDS (6959.7KG) LABOUR FERTILISER AGROCHEMICALS
SOAKING PADDY RICE SOAKED FOR AROMATIC RICE (64 100KG)
PRO
CES
SIN
G
OTHER USES
RICE MARKET
RICE SOLD IN RE-PACKAGED
1/2kg + 1kg FORM
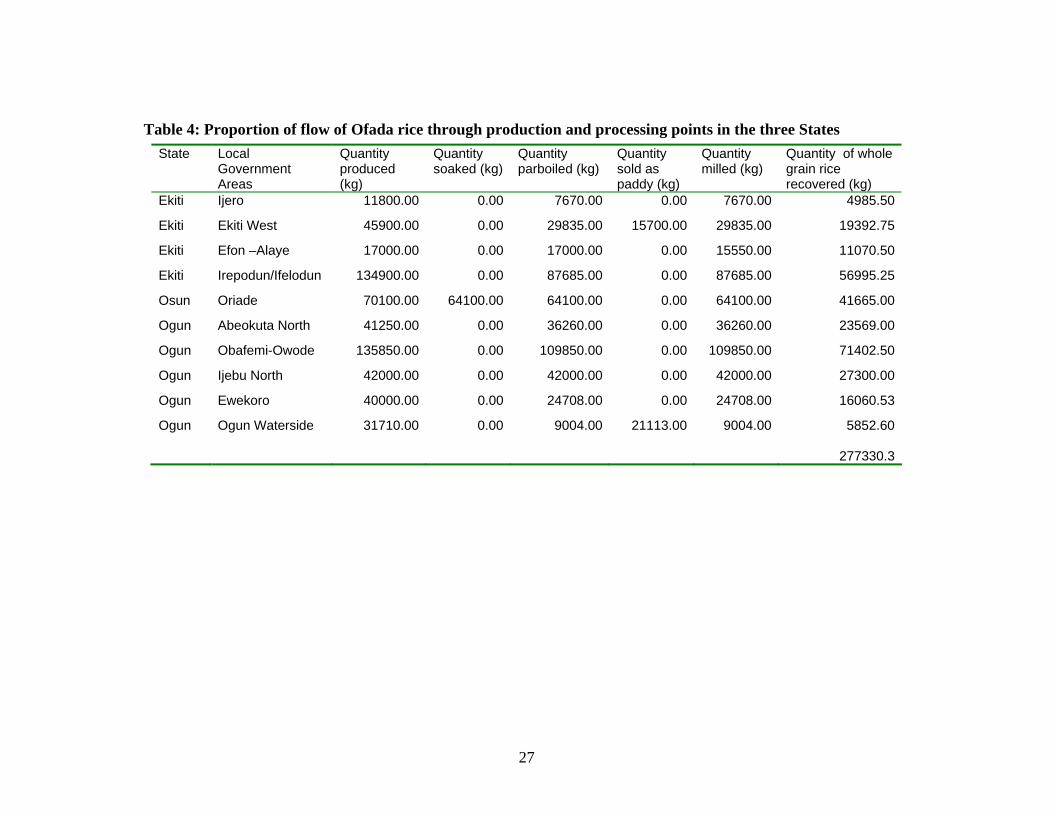
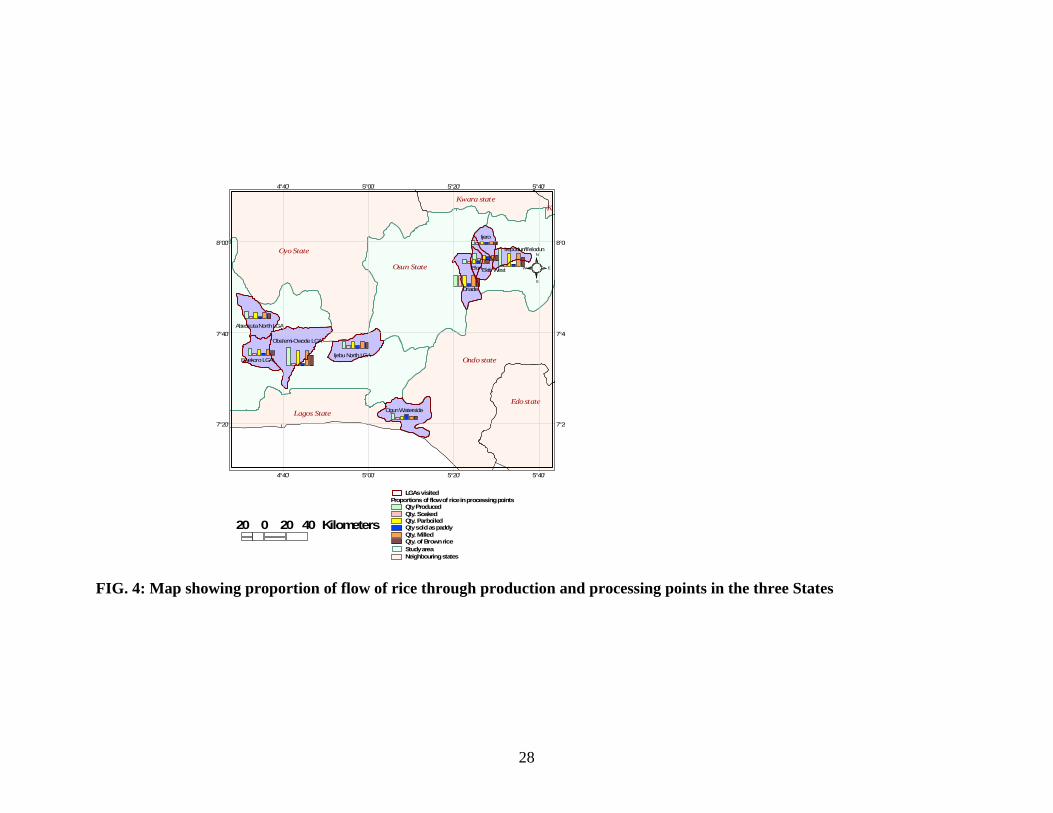
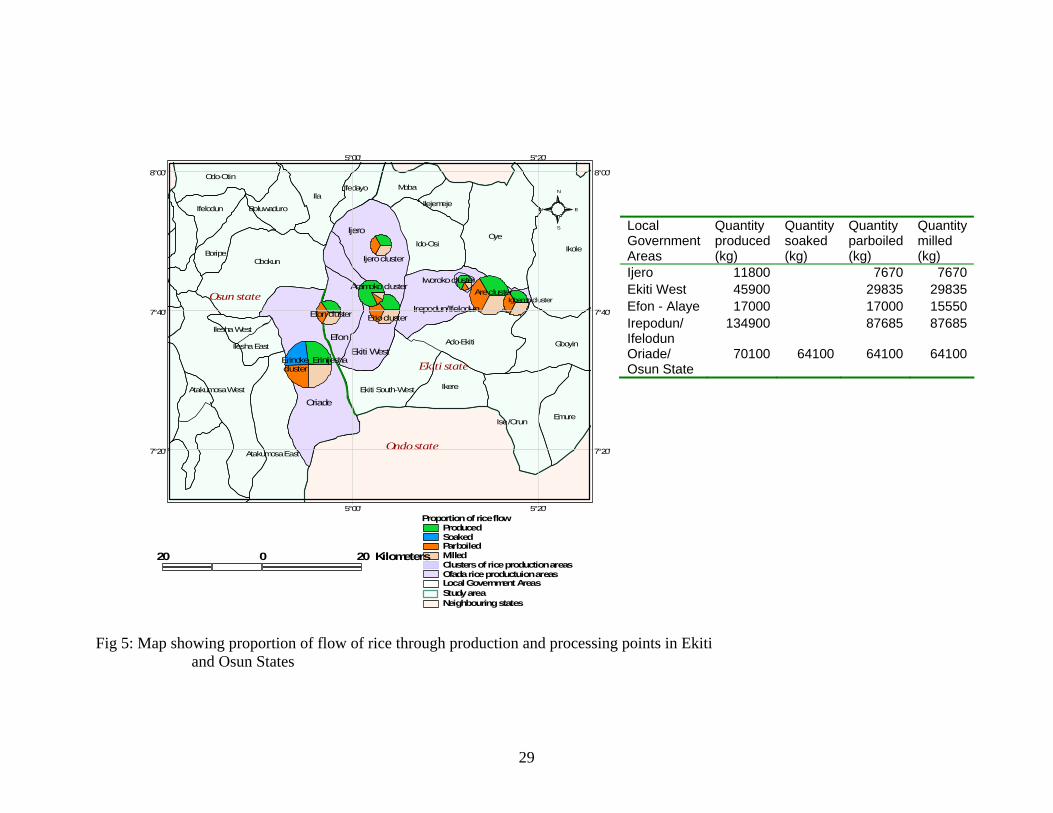
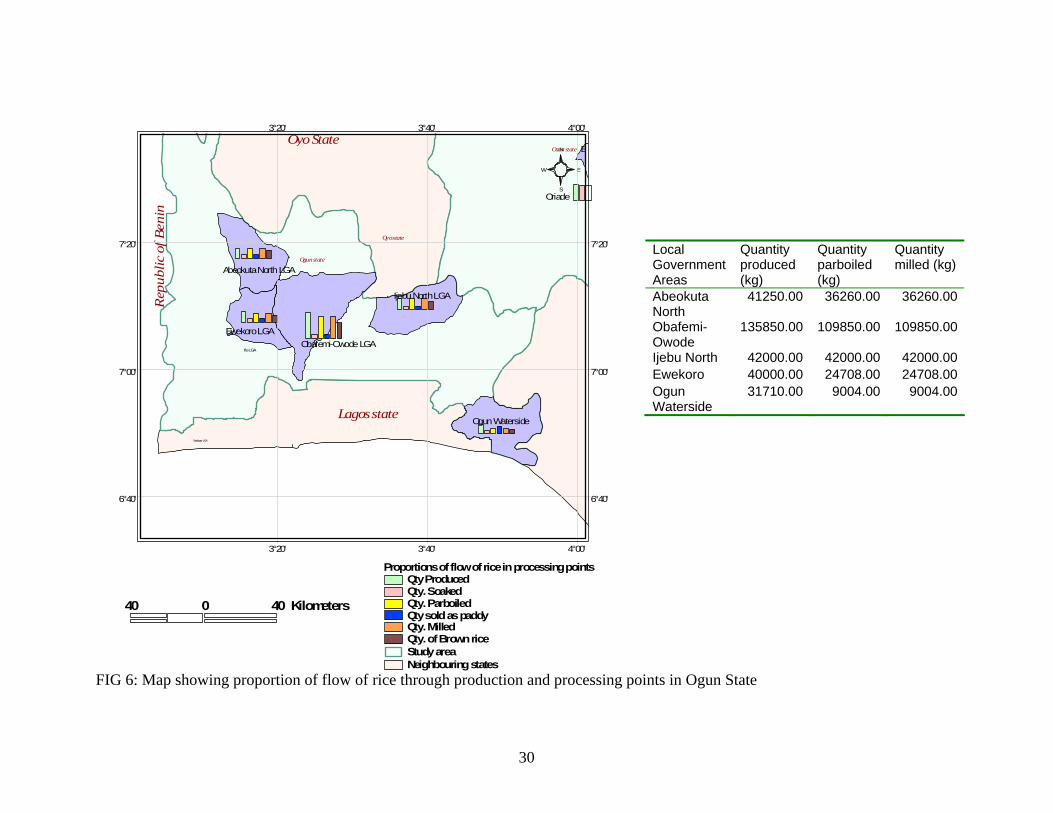
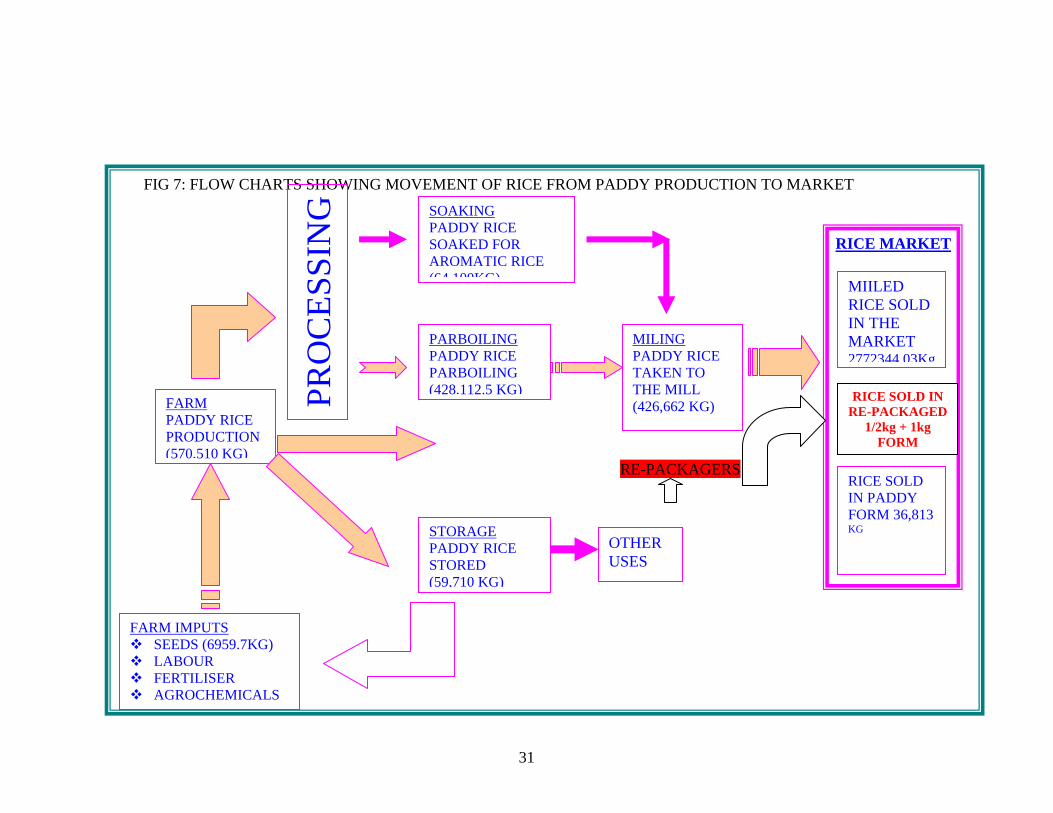
FLOW OF OFADA RICE FROM PRODUCTION THROUGH PROCESSING POINTS TO MARKETS Data in Table 4 and Figures 4-7 show the flow of Ofada rice from production through processing points to markets in the three States. Table 4 shows the quantities of rice produced, soaked, parboiled, sold as paddy and milled. The data indicates that Obafemi Owode local government area of Ogun State produces the highest quantity of Ofada rice (135,850 KG) in the study area. This is closely followed by Irepodun/Ifelodun Local government area of Ekiti (134,90KG). These two local government areas host Ofada village and Igbemo Ekiti respectively where there is a long tradition of rice production. The next highest producer according to the data in Table 4 is Oriade local government area in Osun State which recorded production level of 70,100 KG. Erin-Oke is the leading rice producing village in the local government area and it happens to be the only place where “aromatic” Ofada rice was produced. “Aromatic” Ofada rice is produced by soaking the rice for three to five days for it to ferment before parboiling. Generally, soaking rice for a few hours before parboiling appears to be a common practice in rice processing. The quantity of rice soaked at Erin Oke for the production of “aromatic” rice was 64,100 Kg. The quantities of rice parboiled and the quantities taken to mills are the same in all the local government areas surveyed. This perhaps is because parboiling is a necessary and important stage in processing rice into edible forms. The highest quantity of rice parboiled and milled was 109,800 Kg and this is from Obafem Owode Local government area. The lowest quantity parboiled and milled was 7, 670 Kg and this is from Ijero local government area of Ekiti State. Some producers sold some quantities of rice in paddy form. These are usually sold to marketers and packagers or re-packagers who later parboil, mill and package in 1/2Kg and 1Kg packets. The quantity of Ofada rice sold in paddy form was 21,110 Kg in Ogun Waterside local government area of Ogun State and 15,700 Kg in Ekiti West Local government area of Ekiti State. The total quantity of rice sold in paddy form was 36, 813Kg as shown in the flow chart in Fig 7. The quantity of whole grain Ofada rice recovered from milling is 65% of the quantity of parboiled paddy sent for milling. In cases where there is a wide disparity between the quantity recovered and quantity sent for milling, it would be as a result of quality of milling machine, the state of parboiled rice, and the variety of rice being milled. The quantity of whole grain rice recovered was 295,856.13Kg, as shown in Fig 7.
33
#
##
###### ### ## ##
#########
################
################
### ###### ##### ######
###
##
###
#
##
############
######### ####
## #############
######
##### ################
##
# ##
#
##
Abeokuta
Ijebu-Igbo
Ita Otu
Ilesha
Ikole Ekiti
Aiyetotro
Ilorin
Ibadan
Lagos Metropolis
Akure
Iwo
Ile Ife
Ilesha
OndoAbeokuta
Yola
Saki
Offa
Oyo
IdahOwo
Shagamu
Ada
Ilaro
Ado Ekit iOkene
Epe
Ilobu
Irele
Iseyin
Lokoja
Kishi
Ore
Kabba
Ogbomosho
Ijebu-Igbo
OkpoIju
Okeho
Igbeti
Omi
Ajaokuta
Ifon
Lafiagi
Owa
Ijero Ekit i
Igbo Ora
Ikole Ekiti
Igboho
Manfu
Egume
Okuta
Fiditi
Ise Ekit i
Share
Ita Otu
Kosubosu
Pategi
Onukpo
Ayede
Bakumi
Alakuko
Aiyetotro Gbede
Ekiti Rice Producing AreaOsun Rice Producing AreaOgun Rice Producing Area
4 km Buffer of Farm location48121620242832
# Farm location# Agro.shp
Neigbouring states.shpMajor RoadsMajor Towns
N
50 Km
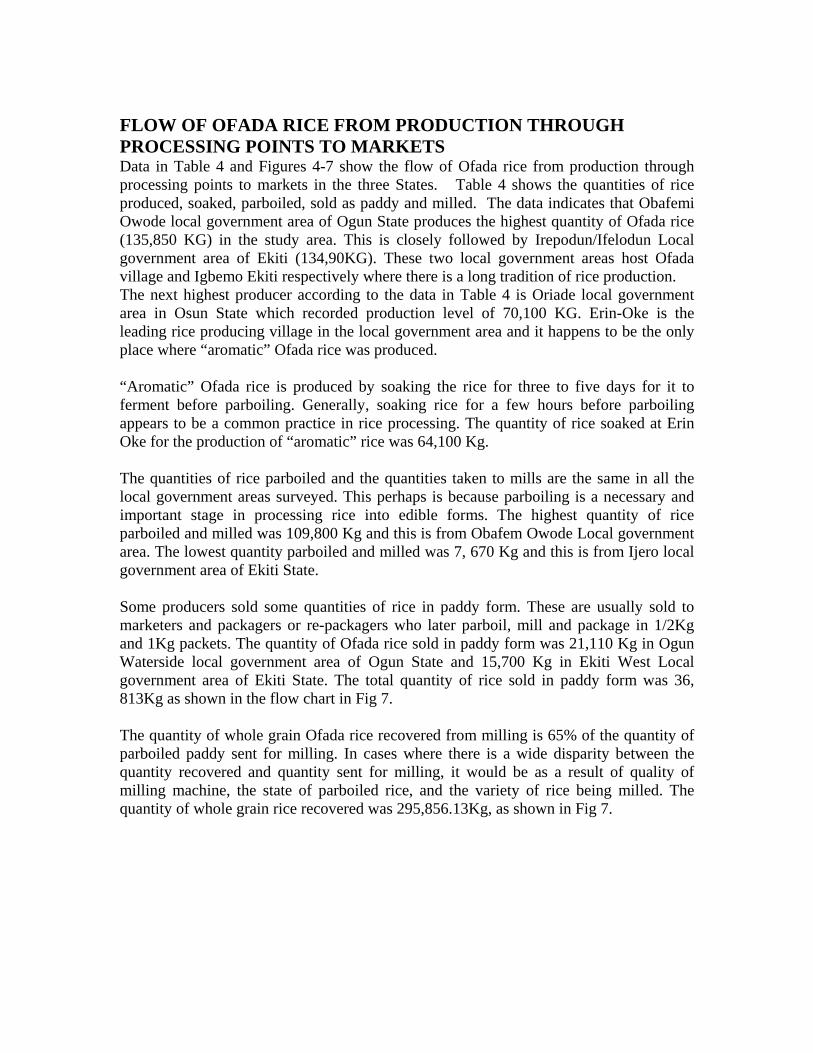
DISTANCE ANALYSIS Distance to and from production facilities determines to a large extent access to those facilities, quality of final products and transactional costs. Distances from and to facilities across the three States were analysed and are presented in Figures 8-13. More distance analyses maps focusing on rice production at the local level in each State are presented in Figures 14 to 32
Fig8: Distance Analysis Farm locations and Agrochemicals points
Buffer zone (KM) Agrochemicals % 0-4 2 28.6 5-8 2 28.6 9-12 2 28.6 13 and above 1 14.2
34
#
##
########
### ##
#########
################
###############
##
## ###### ##### ######
###
##
###
#
##
############
######### ####
###############
######
##### ################
#
##
#
##
#
##Aiyetotro
Ikole Ekiti
Ilesha
Ita Otu
Ijebu-Igbo
Abeokuta
Ilorin
Ibadan
Lagos Metropolis
Akure
Iwo
Ile Ife
Ilesha
OndoAbeokuta
Yola
Saki
Offa
Oyo
IdahOwo
Shagamu
Ada
Ilaro
Ado EkitiOkene
Epe
Ilobu
Irele
Iseyin
Lokoja
Kishi
Ore
Kabba
Ogbomosho
Ijebu-Igbo
OkpoIju
Okeho
Igbeti
Omi
Ajaokuta
Ifon
Lafiagi
Owa
Ijero Ekiti
Igbo Ora
Ikole Ekiti
Igboho
Manfu
Egume
Okuta
Fiditi
Ise Ekiti
Share
Ita Otu
Kosubosu
Pategi
Onukpo
Ayede
Bakumi
Alakuko
Aiyetotro Gbede
Ekiti lgaOsun lgaOgun lga
3 km Buffer of Farm locations3691215182124
# Farm locations# Fertilizer
Neigbouring states.shpMajor roads.shpMajor towns.shp
OGUN STATE
N
50 Km
Figure 8 and the table attached to it indicate that only about 28 percent of Ofada rice farmers were within four kilometre range of source of Agrochemicals across the three States. Over seventy percent of the farmers would need to travel at least between 5-12 kilometres to obtain agro-chemicals
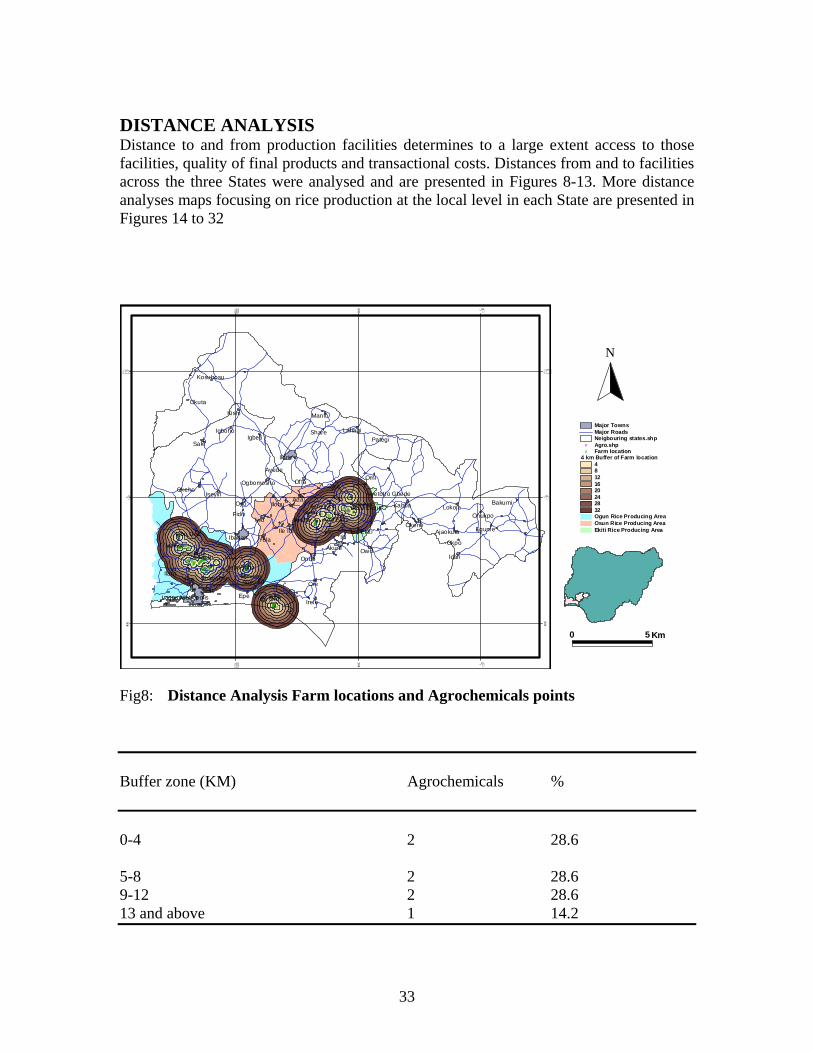
Fig 9: Distance from farm locations to source of fertilizers Buffer zone (KM) Fertilizers % 0-10 3 37.5 11-20 5 62.5 As for distance to fertilizer points, about 40 percent of Ofada rice farmers would need to travel at least 10 kilometres as shown in Figure 9, in order to obtain fertilizer. This finding seems to partly explain the reason for the very few numbers of farmers who actually used fertilizer in rice production as reported in the earlier section of this report.
35
%
%%
%%%
%%%%%
%%%%%
%%%%%%%%%
%%%%%%%%%%%%%%%%
%%%%%%%%%%%%%%%
%%
%%%%
%%%% %%%%% %%%%%%%
%%
%%
%%%
%
%%
%%%%%%%%%%%%
%%%%%%%%% %%%%
%%%%%%%%%%%%%%%
%%%%%%
%%%%%%%%
%%%%%%%%%%%%%
%
##
### ###### ##
####################
#######
####
###
#
##
########
####
######### ####
###############
######
########
#############Aiyetotro
Ikole Ekiti
Ilesha
Ita Otu
Ijebu-Igbo
Abeokuta
Ilorin
Ibadan
Lagos Metropolis
Akure
IwoIle Ife
Ilesha
OndoAbeokuta
Saki
Offa
Oyo
IdahOwo
Shagamu
Ada
Ilaro
Ado EkitiOkene
Epe
Ilobu
Irele
Iseyin
Lokoja
Kishi
Ore
Kabba
Ogbomosho
Okpo
Igbeti
Omi
Ifon
Iwere
Lafiagi
Owa
Ijero Ekiti
Igbo Ora
Igboho
Manfu
Egume
Okuta
Ise Ekiti
Share
Ita Otu
Iroko
Kosubosu
Pategi
Onukpo
Isara
Ayede
Bakumi
Alakuko
Ago Owu Ekiti Rice Producing AreaOsun Rice Producing AreaOgun Rice Producing AreaNeigbouring states
2 Km Buffer of Farm location246810
% Farm location# Threshing
Major roadsMajor Towns
OGUN STATE
OSUN STATE
EKITI STATE
N
0 5 Km
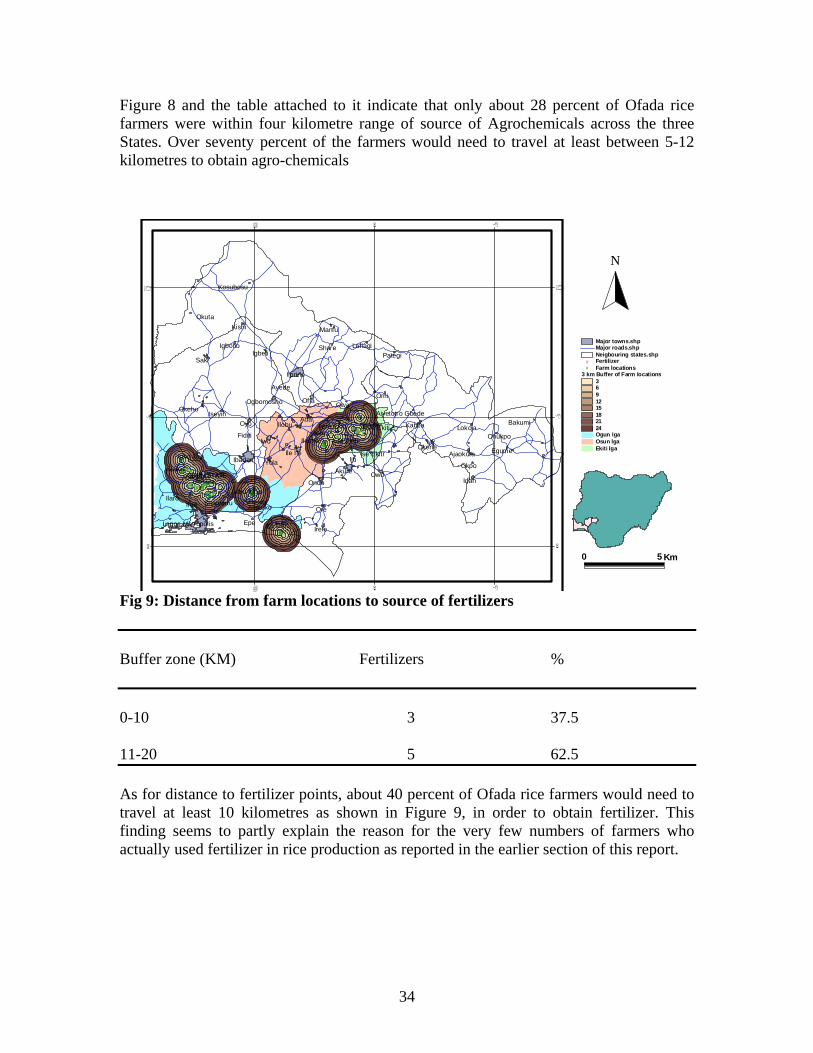
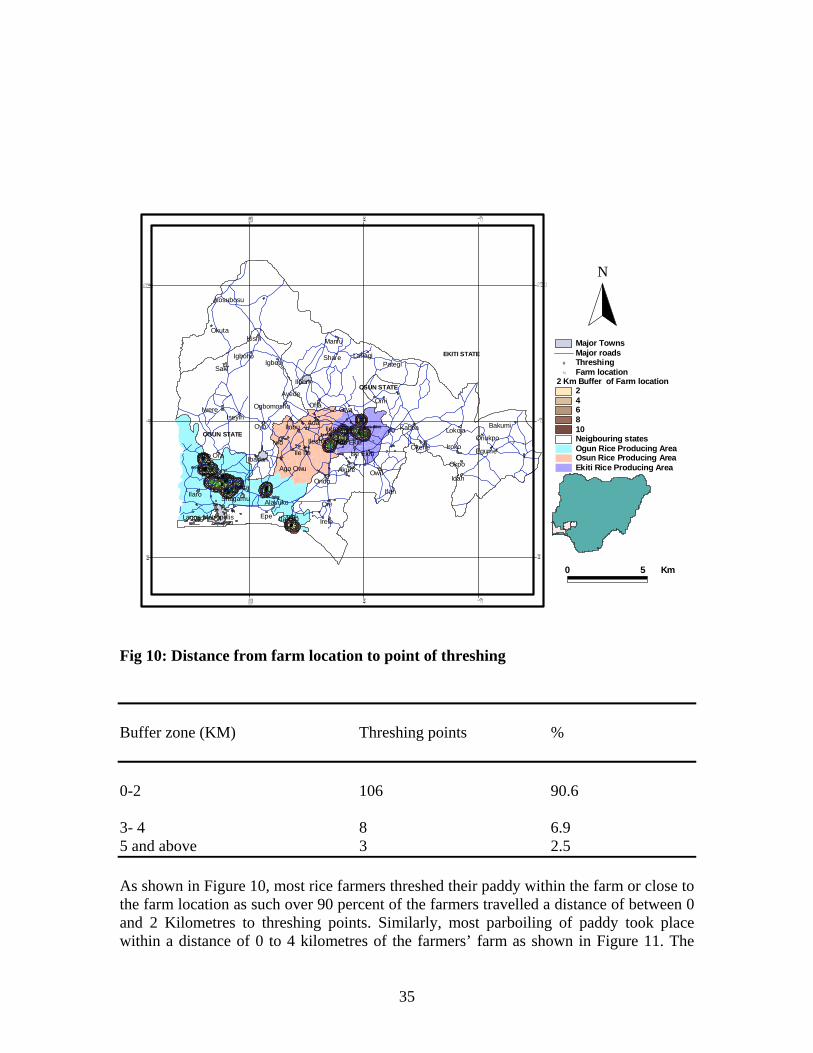
Fig 10: Distance from farm location to point of threshing Buffer zone (KM) Threshing points % 0-2 106 90.6 3- 4 8 6.9 5 and above 3 2.5 As shown in Figure 10, most rice farmers threshed their paddy within the farm or close to the farm location as such over 90 percent of the farmers travelled a distance of between 0 and 2 Kilometres to threshing points. Similarly, most parboiling of paddy took place within a distance of 0 to 4 kilometres of the farmers’ farm as shown in Figure 11. The
36
##### ###### ##
#################
###########
######
###
#
###
#
##
############
######### ### #
###############
#### ############
#
##
###### ### ## ##
#########################
###############
#### ##
#### ##### #########
##
###
#
##
############
######### ####
###############
######
##### ### #############
#
Aiyetotro
Ikole Ekiti
Ilesha
Ita Otu
Ijebu-Igbo
Abeokuta
Ilorin
Ibadan
Lagos Metropolis
Akure
Iwo
Ile Ife
Ilesha
OndoAbeokuta
Yola
Saki
Offa
Oyo
IdahOwo
Shagamu
Ada
Ilaro
Ado EkitiOkene
Epe
Ilobu
Irele
Iseyin
Lokoja
Kishi
Ore
Kabba
Ogbomosho
Ijebu-Igbo
OkpoIju
Okeho
Igbeti
Omi
Ajaokuta
Ifon
Lafiagi
Owa
Ijero Ekiti
Igbo Ora
Ikole Ekiti
Igboho
Manfu
Egume
Okuta
Fiditi
Ise Ekiti
Share
Ita Otu
Kosubosu
Pategi
Onukpo
Ayede
Bakumi
Alakuko
Aiyetotro Gbede
Ogun Rice Producing AreaOsun Rice Producing AreaEkiti Rice Producing Area
Buffer 1 of Farm location.shp24681012
# Parboiling Points# Farm location
Neigbouring states.shpMajor roadsMajor Towns
OGUN STATE
OSUN STATEEKITI STATE
N
0 Km5
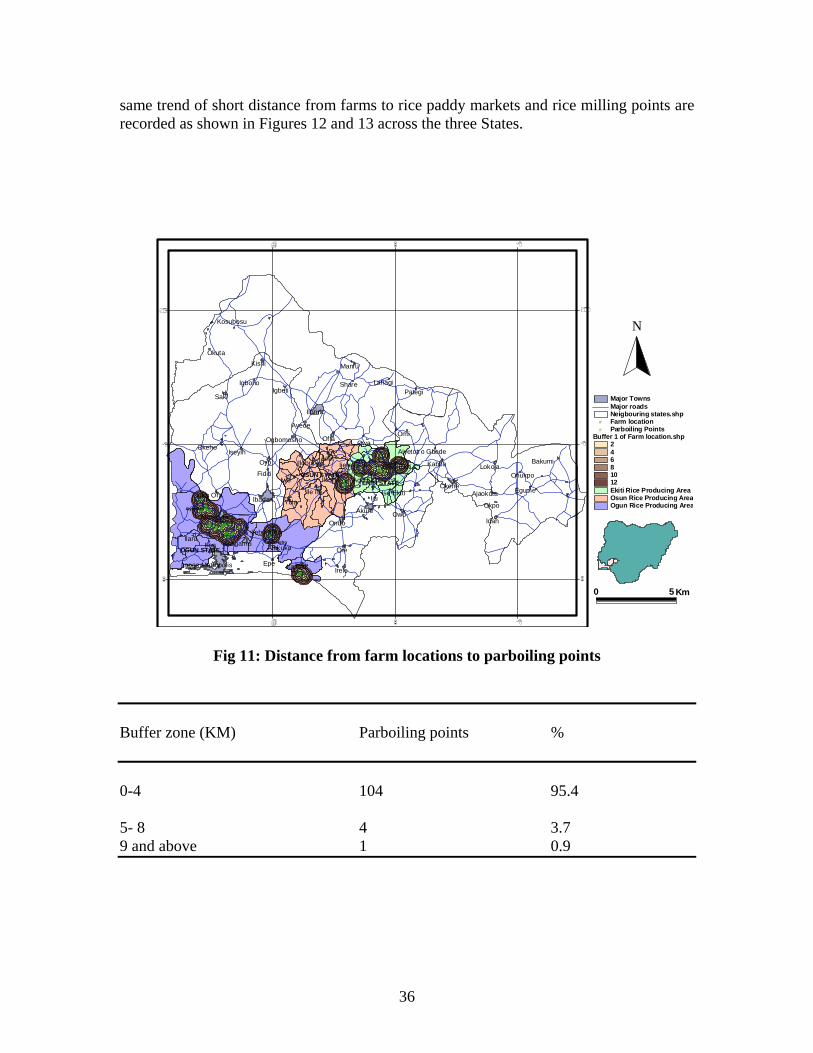
same trend of short distance from farms to rice paddy markets and rice milling points are recorded as shown in Figures 12 and 13 across the three States.
Fig 11: Distance from farm locations to parboiling points Buffer zone (KM) Parboiling points % 0-4 104 95.4 5- 8 4 3.7 9 and above 1 0.9
37
#
##
########
### ##
#########################
###############
##
## ###### ##### ######
###
##
###
#
##
############
######### ####
###############
######
##### ################
#####
####### ##### #
### ################
#
####
#
#
##
#
###Aiyetotro
Ikole Ekiti
Ilesha
Ita Otu
Ijebu-Igbo
Abeokuta
Ilorin
Ibadan
Lagos Metropolis
Akure
Iwo
Ile Ife
Ilesha
OndoAbeokuta
Yola
Saki
Offa
Oyo
IdahOwo
Shagamu
Ada
Ilaro
Ado EkitiOkene
Epe
Ilobu
Irele
Iseyin
Lokoja
Kishi
Ore
Kabba
Ogbomosho
Ijebu-Igbo
OkpoIju
Okeho
Igbeti
Omi
Ajaokuta
Ifon
Lafiagi
Owa
Ijero Ekiti
Igbo Ora
Ikole Ekiti
Igboho
Manfu
Egume
Okuta
Fiditi
Ise Ekiti
Share
Ita Otu
Kosubosu
Pategi
Onukpo
Ayede
Boria
Bakumi
Meko
Alakuko
Aiyetotro Gbede
Ekiti Rice Producing AreaOsun Rice Producing AreaOgun Rice Producing Area
2 km Buffer of Farm location246810121416
# Farm location# Milling points
Neigbouring states.shpMajor RoadsMajor Towns
N
50 Km
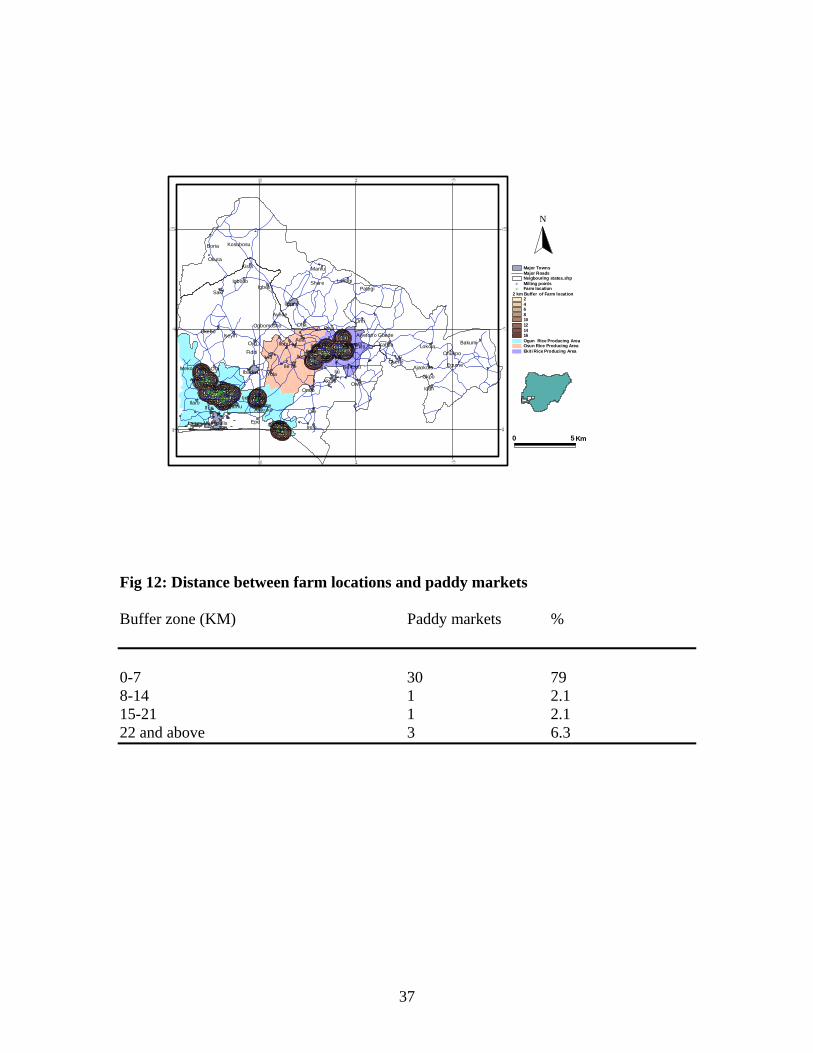
Fig 12: Distance between farm locations and paddy markets Buffer zone (KM) Paddy markets % 0-7 30 79 8-14 1 2.1 15-21 1 2.1 22 and above 3 6.3

38
#
##
########
### ##
#########
################
################
### ###### ##### ######
###
##
###
#
##
############
######### ####
###############
######
##### ################
#
#####
#
##
#
##
######
##
#
#
#
# #########
# ### #
Aiyetotro
Ikole Ekiti
Ilesha
Ita Otu
Ijebu-Igbo
Abeokuta
Ilorin
Ibadan
Lagos Metropolis
Akure
Iwo
Ile Ife
Ilesha
OndoAbeokuta
Saki
Offa
Oyo
IdahOwo
Shagamu
Ada
Ilaro
Ado EkitiOkene
Epe
Ilobu
Irele
Iseyin
Lokoja
Kishi
Ore
Kabba
Ogbomosho
Ijebu-Igbo
OkpoIju
Okeho
Igbeti
Omi
Ajaokuta
Ifon
Lafiagi
Owa
Ijero Ekiti
Igbo Ora
Igboho
Manfu
Egume
Okuta
Ise Ekiti
Share
Ita Otu
Kosubosu
Pategi
Onukpo
Ayede
Bakumi
Alakuko
Ago Owu
Aiyetotro Gbede
Ekiti Rice Producing AreaOsun Rice Producing AreaOgun Rice Producing Area
# Farm location# Paddy Market
Neigbouring states.shpMajor roads.shp
7 km Buffer of Farm location71421283542495663
Major towns.shp
N
50 Km
Fig. 13: Distance from farms to rice milling points Buffer zone (KM) Rice milling points % 0-4 40 81.7 5- 8 6 12.2 9 and above 3 6.0

39
##
###
#
##
###
###%%
%
%%%
%%%
%%
%
%% %
%
OyeIjero
Efon
Ido-Osi
Ado-Ekiti
Ekiti West
Irepodun/Ifelodun
Ilejemeje
Distance to parboiling points2468
# Parboiling points% Rice farms
7 0 7 Kilometers
S
N
EW
7°40' 7°40'
5°00'
5°00'
5°20'
5°20'
Figure 14: Distance from farms to parboiling points in Ofada rice production clusters in Ekiti Sate
Distance (km)
No of farmers
% of Farmers
2 9 56.25 4 2 12.5 6 5 31.5
40
#
#
##
##
#
##
%%
%
%%%
%%%
%%
%
%% %
%
OyeIjero
Efon
Ido-Osi
Ado-Ekiti
Ekiti West
Irepodun/Ifelodun
Distance to seed sources (Km).2468
# Seed sources.% Rice farms
7 0 7 Kilometers
S
N
EW
7°40' 7°40'
5°00'
5°00'
5°20'
5°20'
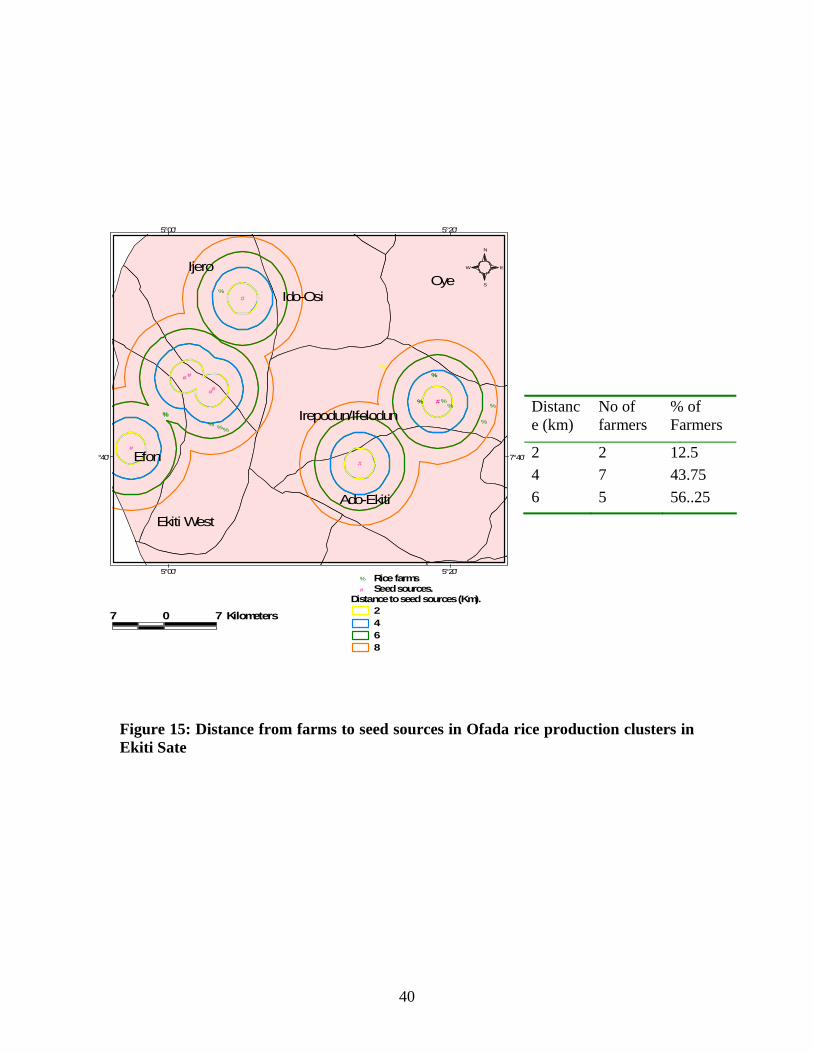
Figure 15: Distance from farms to seed sources in Ofada rice production clusters in Ekiti Sate
Distance (km)
No of farmers
% of Farmers
2 2 12.5 4 7 43.75 6 5 56..25
41
##
##
#
##
## # #
##
%%
%
%%
%
%%
%
%%
%
%% %
%
OyeIjero
Ido-Osi
Ado-Ekiti
Irepodun/Ifelodun
Ekiti l h
Distance to threshing points (Km)123
# Threshing points% Rice farms
6 0 6 Kilometers
S
N
EW
7°40' 7°40'
5°00'
5°00'
5°20'
5°20'
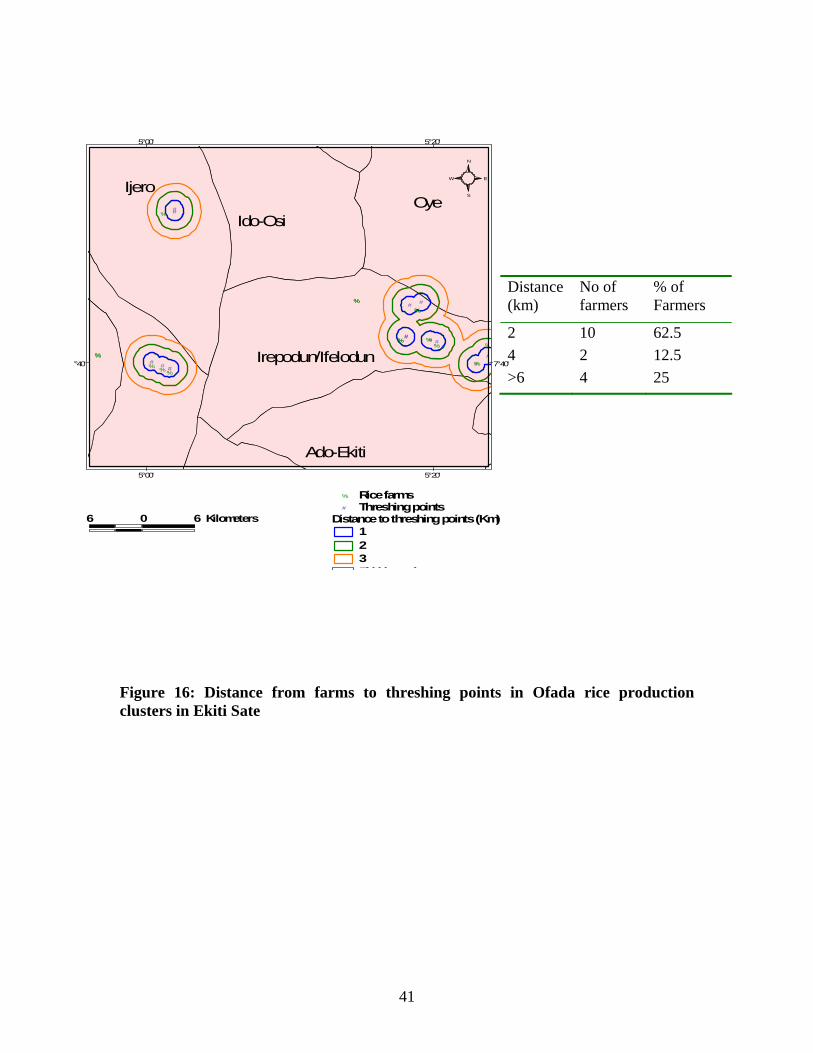
Figure 16: Distance from farms to threshing points in Ofada rice production clusters in Ekiti Sate
Distance (km)
No of farmers
% of Farmers
2 10 62.5 4 2 12.5 >6 4 25
42
%%
%
%%%
%%%
%%
%
%% %
%
#
##
#
#
OyeIjero
Efon
Ido-Osi
Ado-Ekiti
Ekiti West
Irepodun/Ifelodun
Ilejemeje
Distance to Agrochemical points (Km)2468
% Rice farms# Agrochemical points.
7 0 7 Kilometers
S
N
EW
7°40' 7°40'
5°00'
5°00'
5°20'
5°20'
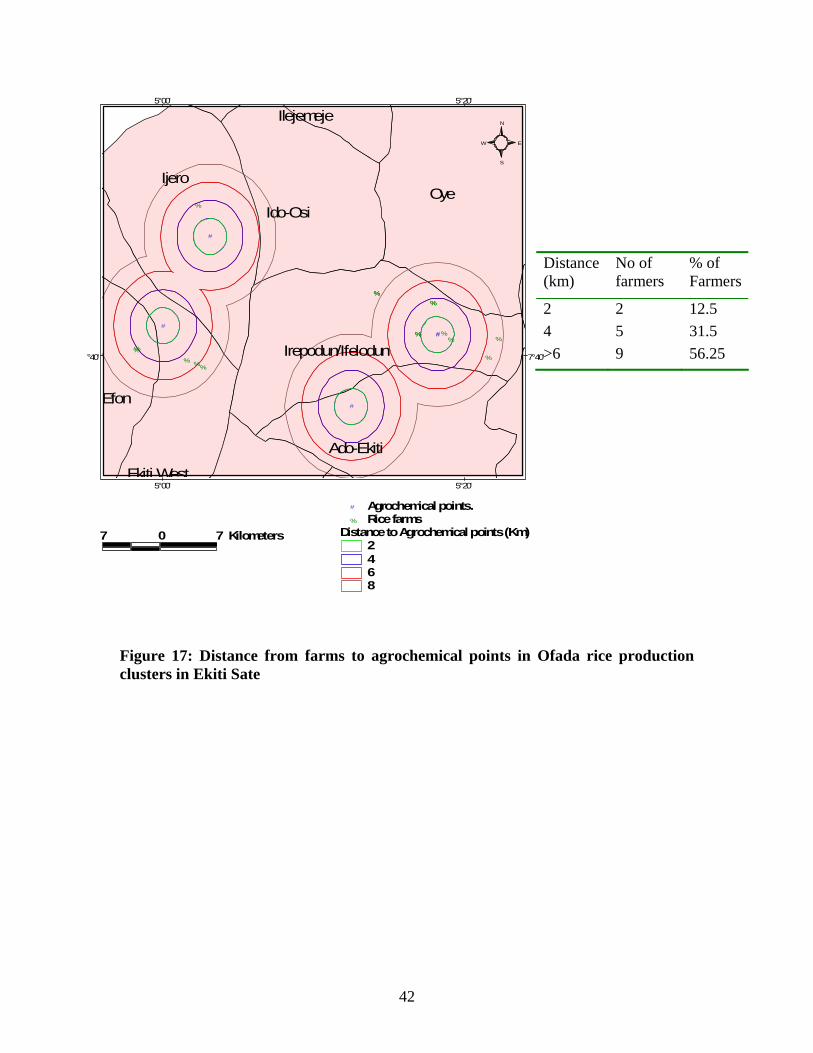
Figure 17: Distance from farms to agrochemical points in Ofada rice production clusters in Ekiti Sate
Distance (km)
No of farmers
% of Farmers
2 2 12.5 4 5 31.5 >6 9 56.25
43
$$$
$
$$$$$
$$
$$$
$$
$%%
%
%%
%
%%
%
%%
%
%% %
%
OyeIjero
Ido-Osi
Irepodun/Ifelodun
Ilejemeje
Ekiti l h
Buffer 1 of Milling points246
$ Milling points% Rice farms
6 0 6 Kilometers
S
N
EW
7°40' 7°40
5°00'
5°00'
5°20'
5°20'
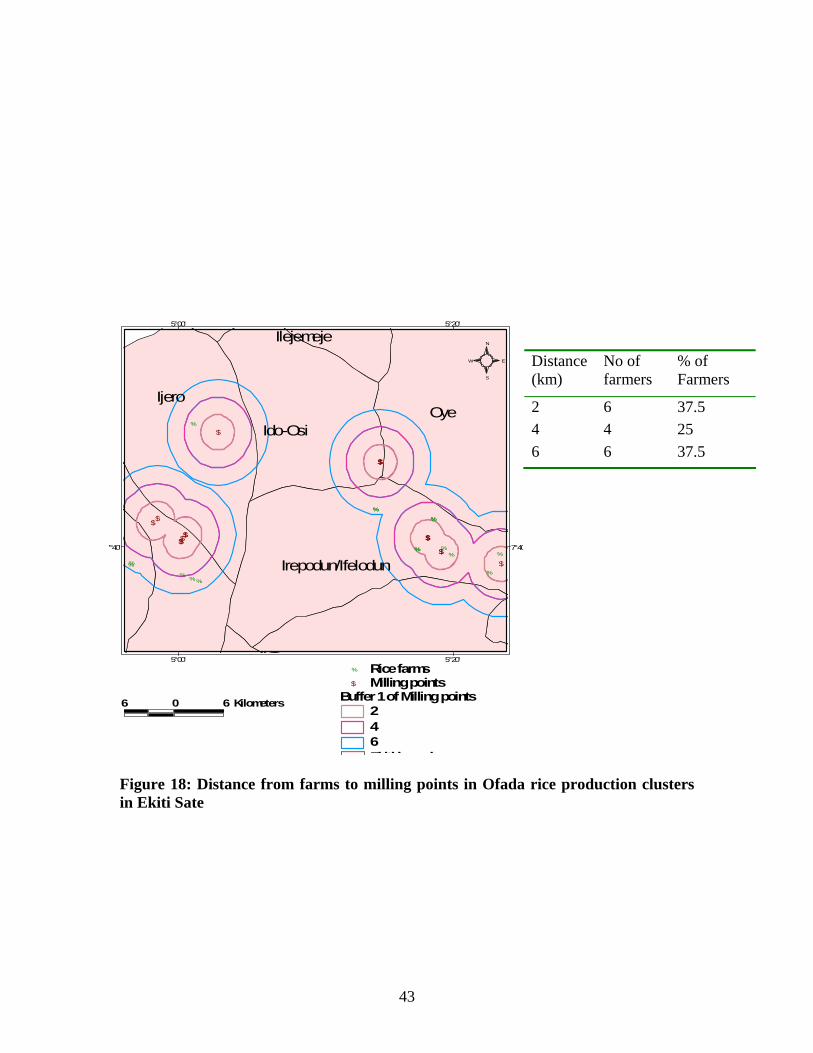
Figure 18: Distance from farms to milling points in Ofada rice production clusters in Ekiti Sate
Distance (km)
No of farmers
% of Farmers
2 6 37.5 4 4 25 6 6 37.5
44
%%
%
%%%
%%%
%%
%
%% %
%
&&
Oye
Ijero
Ikere
Efon
Ise/Or
Ido-Osi
Ado-Ekiti
Ekiti West
Irepodun/Ifelodun
Ekiti South-West
IleshaAISA, Ado Ekiti
Osun state
Ekiti state
Distance to fertiliser points (kM)10203040
% Rice farms& Fertiliser points
10 0 10 Kilometers
S
N
EW
7°40' 7°40'
5°00'
5°00'
5°20'
5°20'
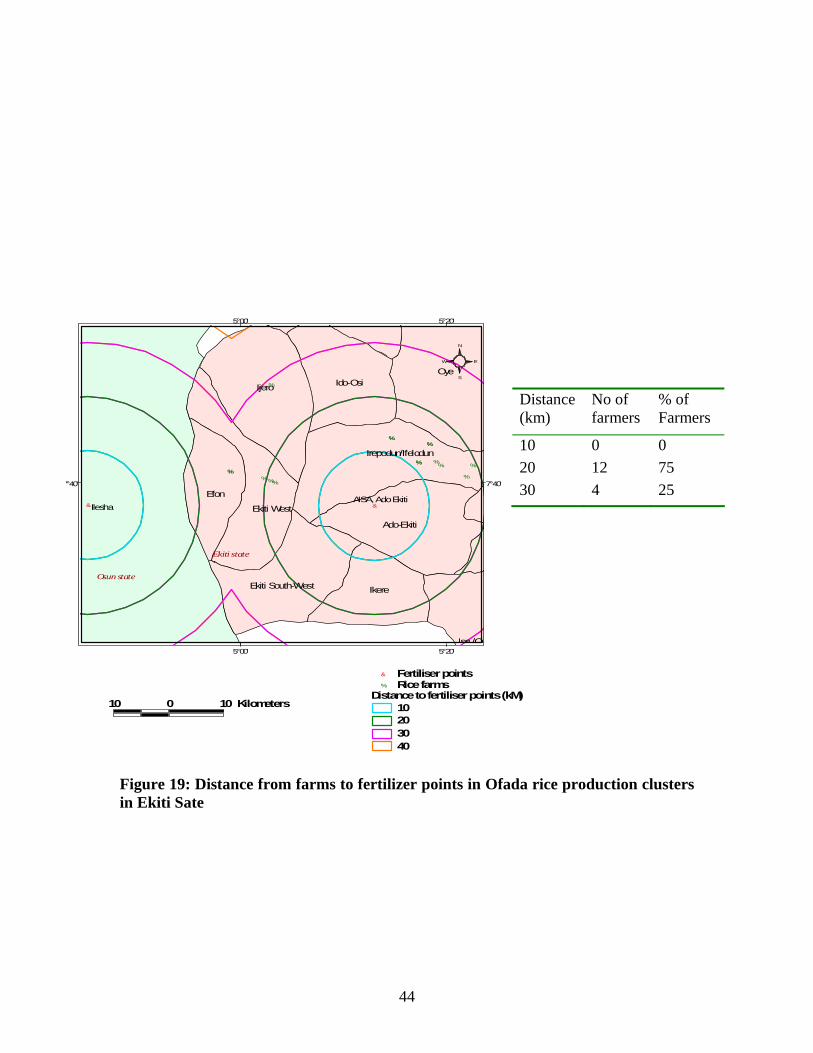
Figure 19: Distance from farms to fertilizer points in Ofada rice production clusters in Ekiti Sate
Distance (km)
No of farmers
% of Farmers
10 0 0 20 12 75 30 4 25
45
%%
%
%%%
%%%
%%
%
%% %
%
'
'
'''
'
Oye
Ijero
Ikere
Efon
Ise/Or
Ido-Osi
Ado-Ekiti
Ekiti West
Irepodun/Ifelodun
Ekiti South-WestOsun state
Ekiti state
Ekiti t t
Distance to rice markets (Km)10203040
% Rice farms' Rice markets
10 0 10 Kilometers
S
N
EW
7°40' 7°40'
5°00'
5°00'
5°20'
5°20'
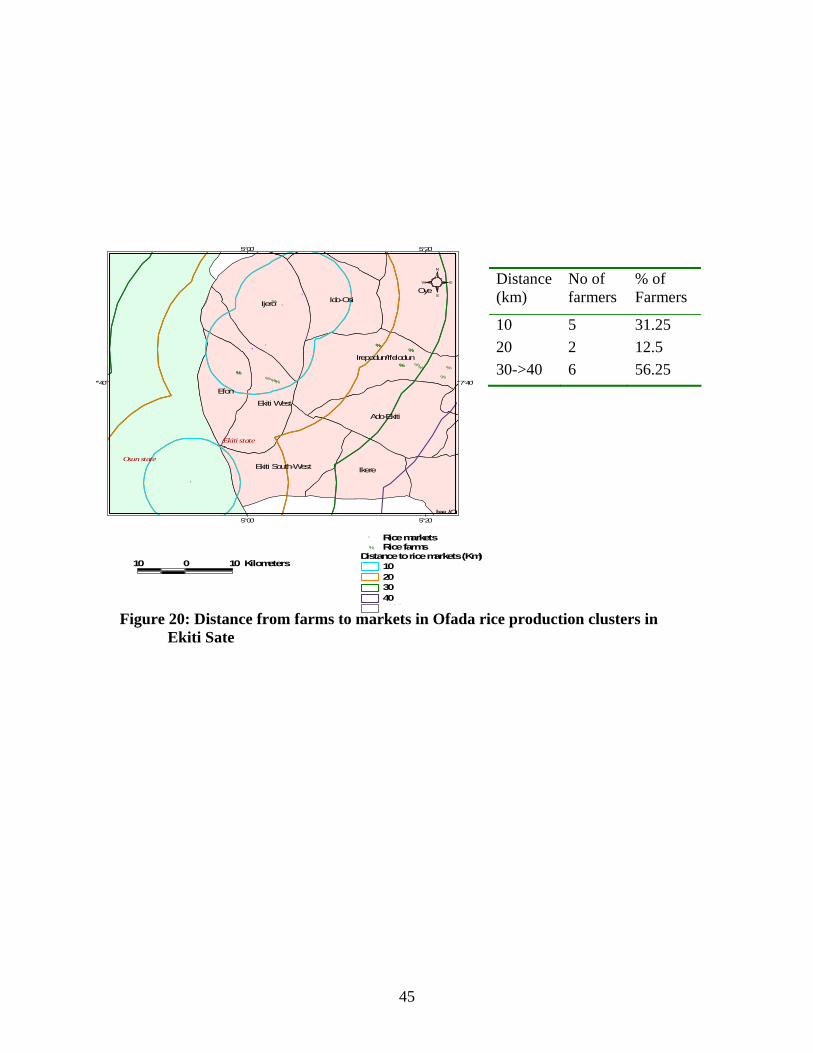
Figure 20: Distance from farms to markets in Ofada rice production clusters in Ekiti Sate
Distance (km)
No of farmers
% of Farmers
10 5 31.25 20 2 12.5 30->40 6 56.25
46
%U
$
$$
$
$$
$
$
$
$
$
$$
$$
$$
$
$
$
$
$$
$
$
Oriade
Ilesha East
Agric Imput Supply Agency Ilesha
Atakumosa East
Atakumosa West
17 Km
18 Km
19 Km
20 Km
22 Km
Distance to fertiliser point181920
%U Fertiliser point$ Rice farms
3 0 3 Kilometers
S
N
EW
°40' 7°40
5°00'
5°00'
5°20'
5°20'
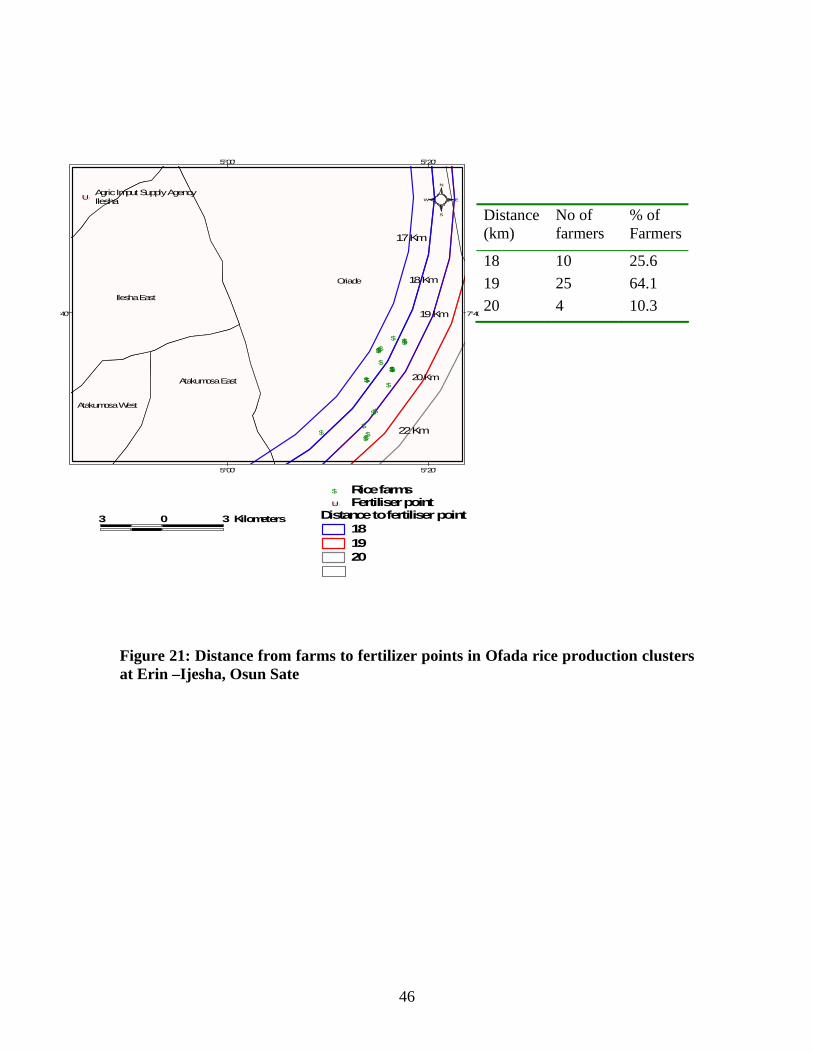
Figure 21: Distance from farms to fertilizer points in Ofada rice production clusters at Erin –Ijesha, Osun Sate
Distance (km)
No of farmers
% of Farmers
18 10 25.6 19 25 64.1 20 4 10.3
47
%U
$
$$
$
$$
$
$
$
$
$
$$
$$
$$
$
$
$
$
$$
$
$
Oriade
Ilesha East
Atakumosa East
Atakumosa West
17 Km
18 Km
19 Km
20 Km
22 Km
ha, Agricultural Imput Supply Agency
O t t
Distance to seed source181920
%U Seed source $ Rice farms
3 0 3 Kilometers
S
N
EW
°40' 7°40
5°00'
5°00'
5°20'
5°20'
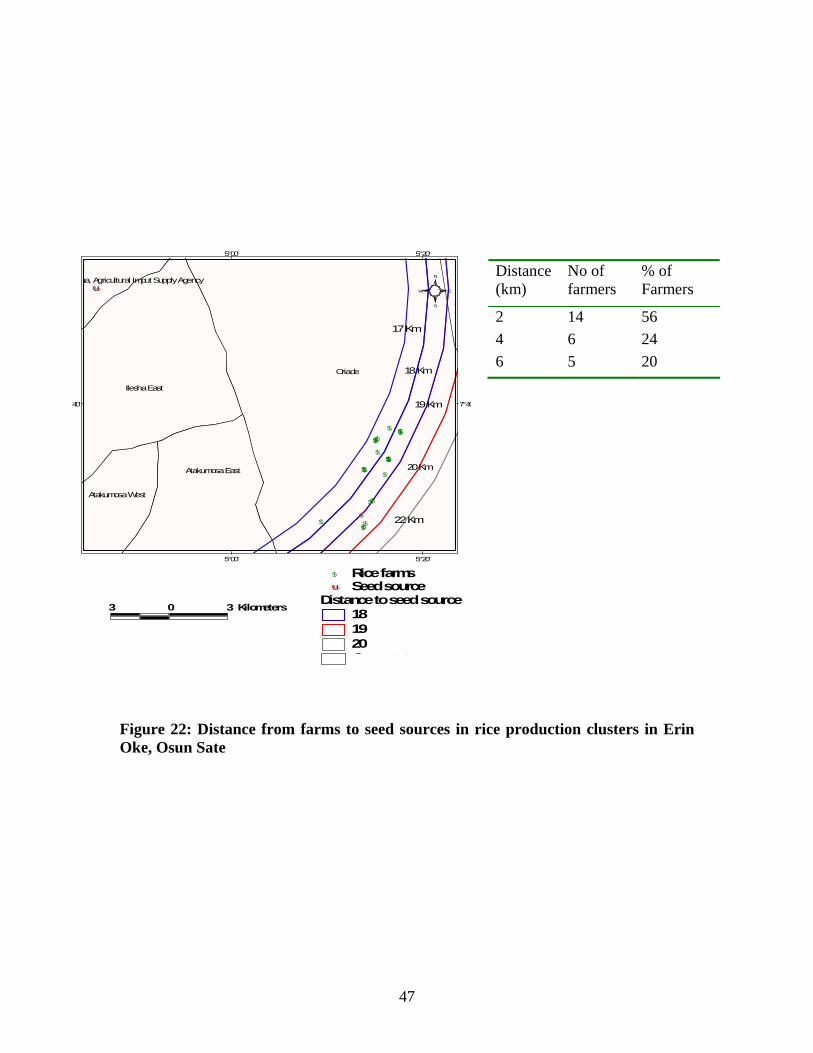
Figure 22: Distance from farms to seed sources in rice production clusters in Erin Oke, Osun Sate
Distance (km)
No of farmers
% of Farmers
2 14 56 4 6 24 6 5 20
48
%U%U%U%U%U%U %U%U%U%U%U%U%U%U%U %U%U
$
$
$
$
$$
$
$
$
$
$
$
$
$$
$$
$
$
$
$
$
$
$
$
Erin Oke
Distance to parboiling points246
%U Parboiling points $ Rice farms
1 0 1 Kilometers
S
N
EW
7°40' 7°40
5°00'
5°00'
5°20'
5°20'
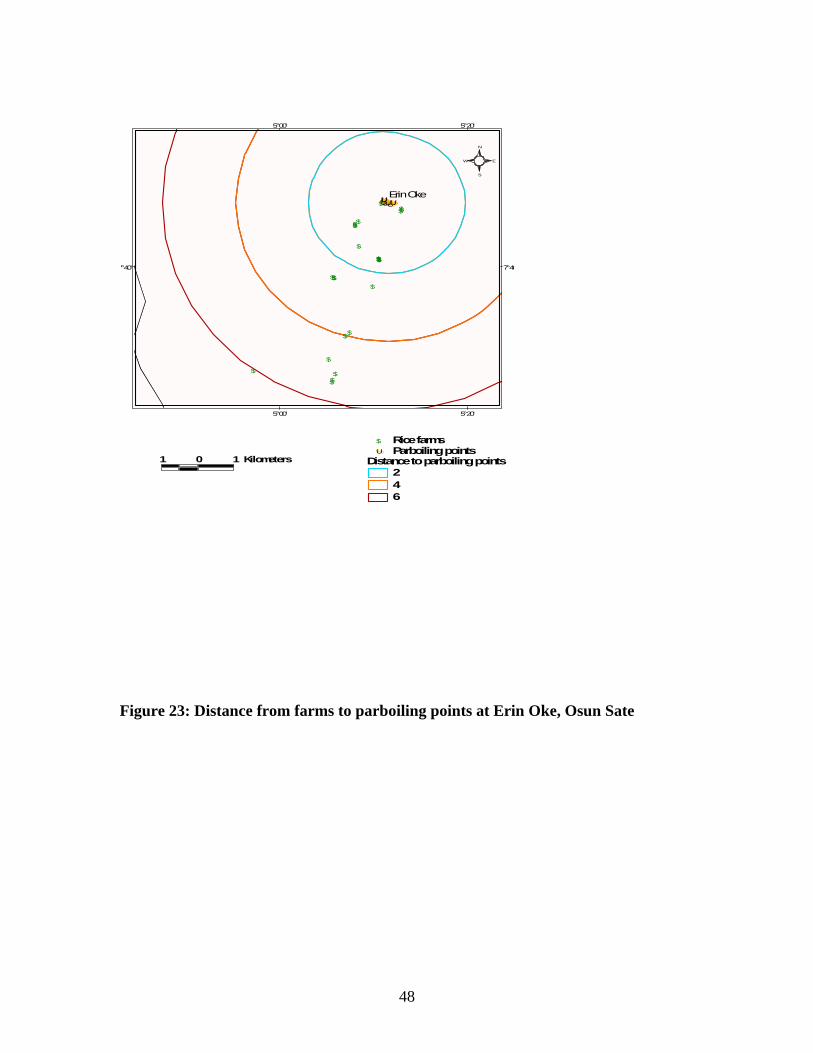
Figure 23: Distance from farms to parboiling points at Erin Oke, Osun Sate
49
% %% %%%% %% %%% %%
%%%%
%
$
$
$
$
$$
$
$
$
$
$
$
$
$$
$$
$
$
$
$
$
$
$
$
Erin Oke
Distance to milling points246
% Milling points$ Rice farms
1 0 1 Kilometers
S
N
EW
°40' 7°40
5°00'
5°00'
5°20'
5°20'
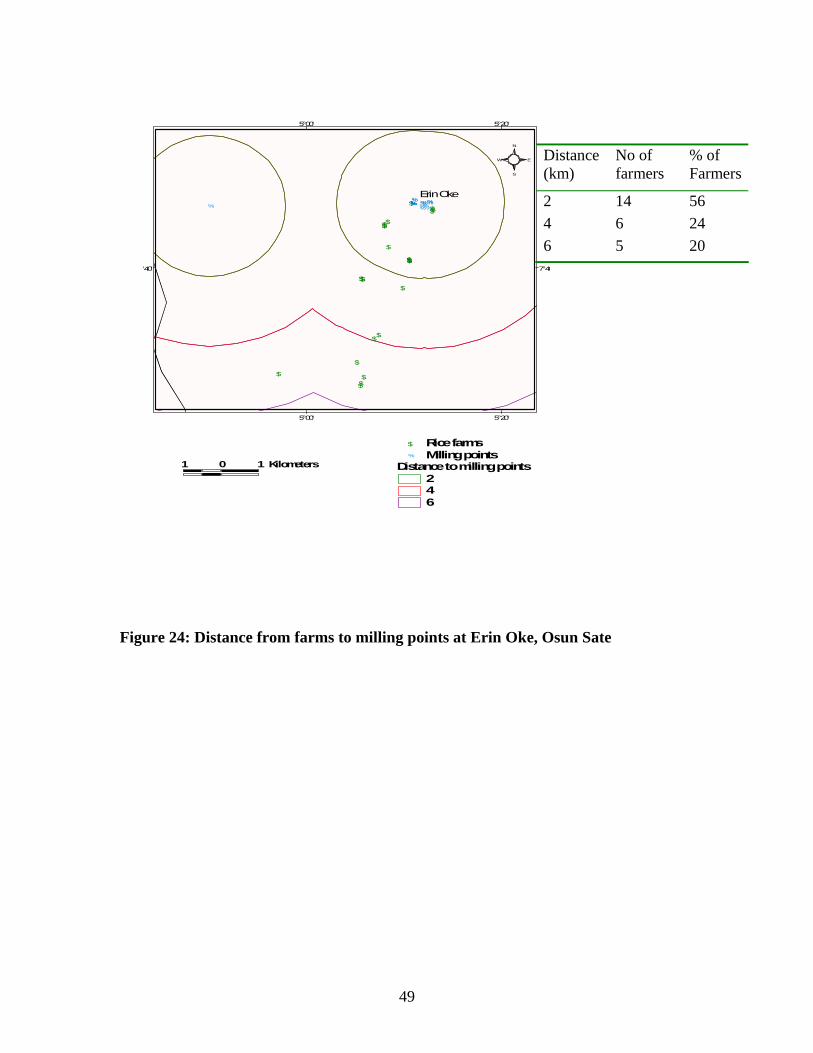
Figure 24: Distance from farms to milling points at Erin Oke, Osun Sate
Distance (km)
No of farmers
% of Farmers
2 14 56 4 6 24 6 5 20
50
$
$$
$
$$
$
$
$
$
$
$$
$$
$$
$
$
$
$
$$
$
$
#S
Ilesha East
Atakumosa East
Atakumosa West
17 Km
18 Km
19 Km
20 Km
22 Km
a West
Erin Oke
Ilesha Agric Imput Supply Agency
O t t
Distance Fertiliser point181920
$ Rice farms #S Fertiliser points
3 0 3 Kilometers
S
N
EW
7°40' 7°40'
5°00'
5°00'
5°20'
5°20'
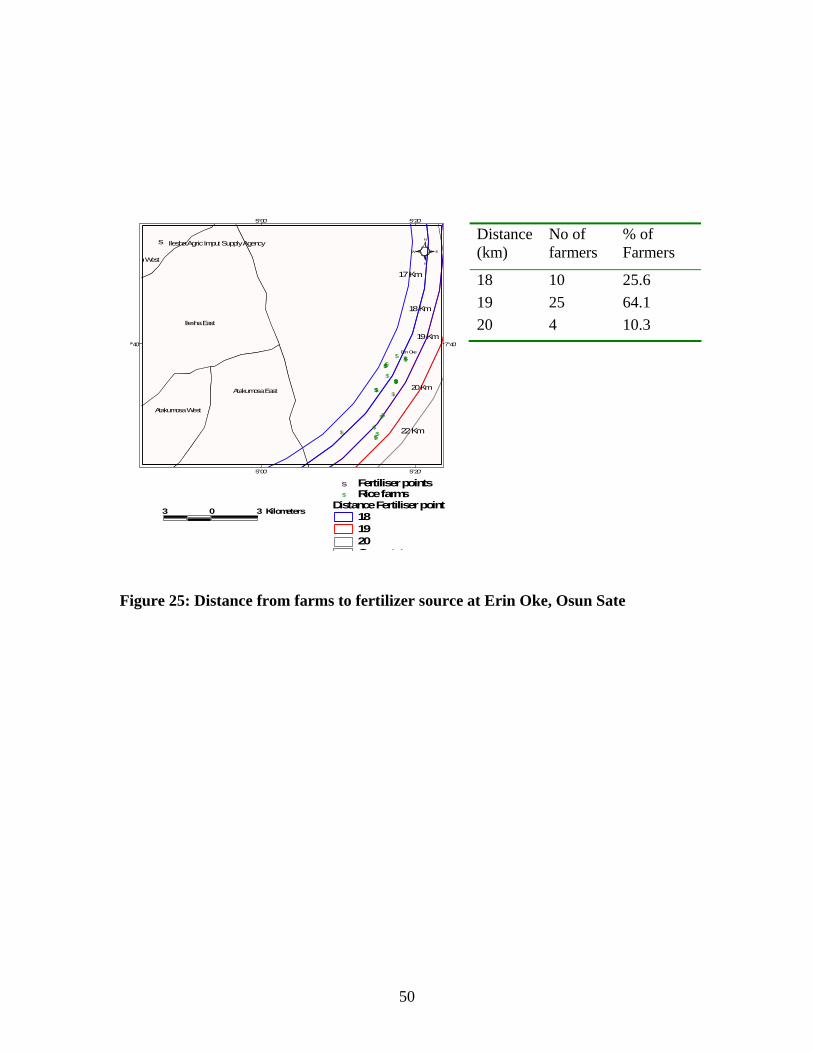
Figure 25: Distance from farms to fertilizer source at Erin Oke, Osun Sate
Distance (km)
No of farmers
% of Farmers
18 10 25.6 19 25 64.1 20 4 10.3
51
%[ %[%[%[
%[%[%[ %[
%[%[%[%[%[%[%[
%[
%[
%[%[
%[%[
%[%[ %[%[%[%[
%[%[%[ %[%[%[ %[%[%[
%[
%[%[
%[
%[
%[%[%[
%[
%[%[
%[%[%[%[%[%[%[%[
%[%[%[%[
%[%[%[%[
%[%[%[
%[%[ %[ %[
%[%[
%[%[
%[
%[%[%[%[%[%[%[%[%[ %[%[%[
%[%[%[%[%[%[
%[%[%[%[%[
%[%[%[
%[%[%[%[%[%[%[%[%[
%[%[%[%[
#
#
#
#
#
##
#
#
## #
#
###
####
######
Ogun state
Distance to milled rice markets1530456075
%[ Farm locations# Milled rice markets
20 0 20 40 Kilometers
S
N
EW
6°30' 6°30'
7°00' 7°00'
3°00'
3°00'
3°30'
3°30'
4°00'
4°00'
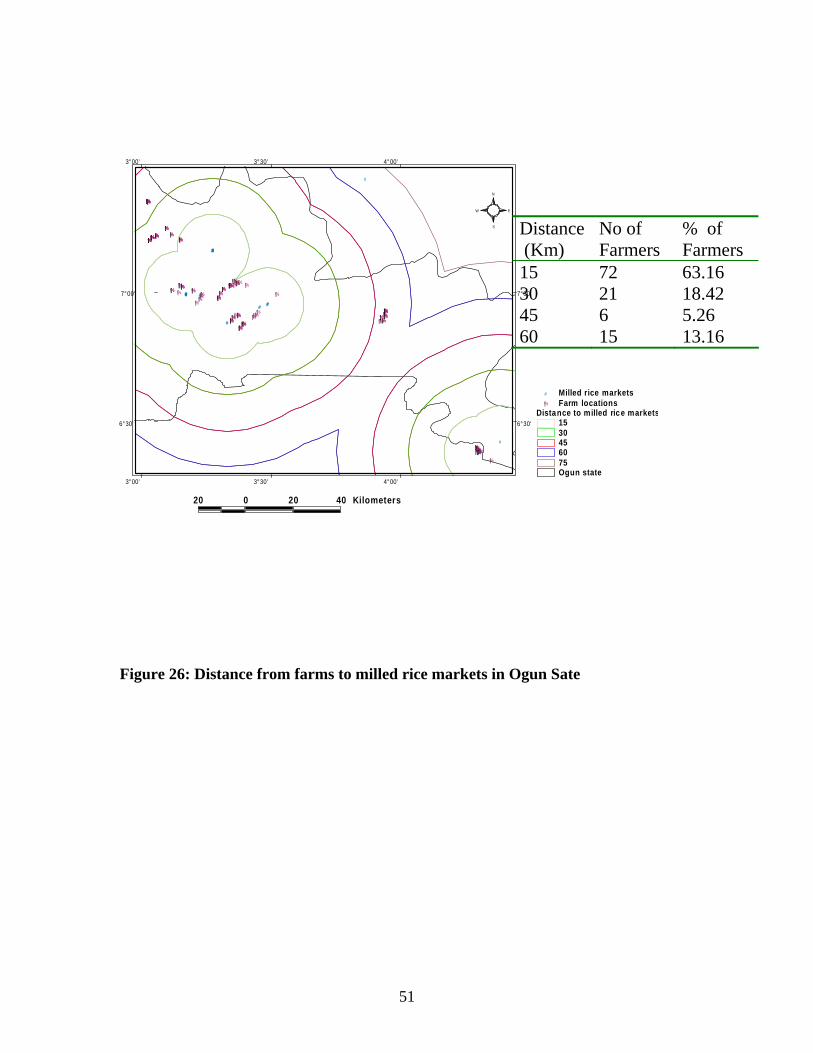
Figure 26: Distance from farms to milled rice markets in Ogun Sate
Distance (Km)
No of Farmers
% of Farmers
15 72 63.16 30 21 18.42 45 6 5.26 60 15 13.16
52
%[ %[%[%[
%[%[%[ %[
%[%[%[%[%[%[%[
%[
%[
%[%[
%[%[
%[%[ %[%[
%[%[%[%[
%[ %[%[%[ %[%[%[
%[
%[%[
%[
%[
%[%[%[
%[
%[%[
%[%[%[%[%[%[%[%[
%[%[%[%[
%[%[%[
%[
%[%[%[
%[%[ %[ %[
%[%[
%[%[
%[
%[%[%[%[%[%[%[%[ %[ %[%[%[
%[%[%[%[%[%[
%[%[%[%[%[
%[%[%[
%[%[%[%[%[%[%[%[%[
%[%[%[%[#
#
Ogun state
Distance to Agrochemical points255075100125
%[ Farm locations# Agrochemical points
20 0 20 40 Kilometers
S
N
EW
6°30' 6°30'
7°00' 7°00'
3°00'
3°00'
3°30'
3°30'
4°00'
4°00'
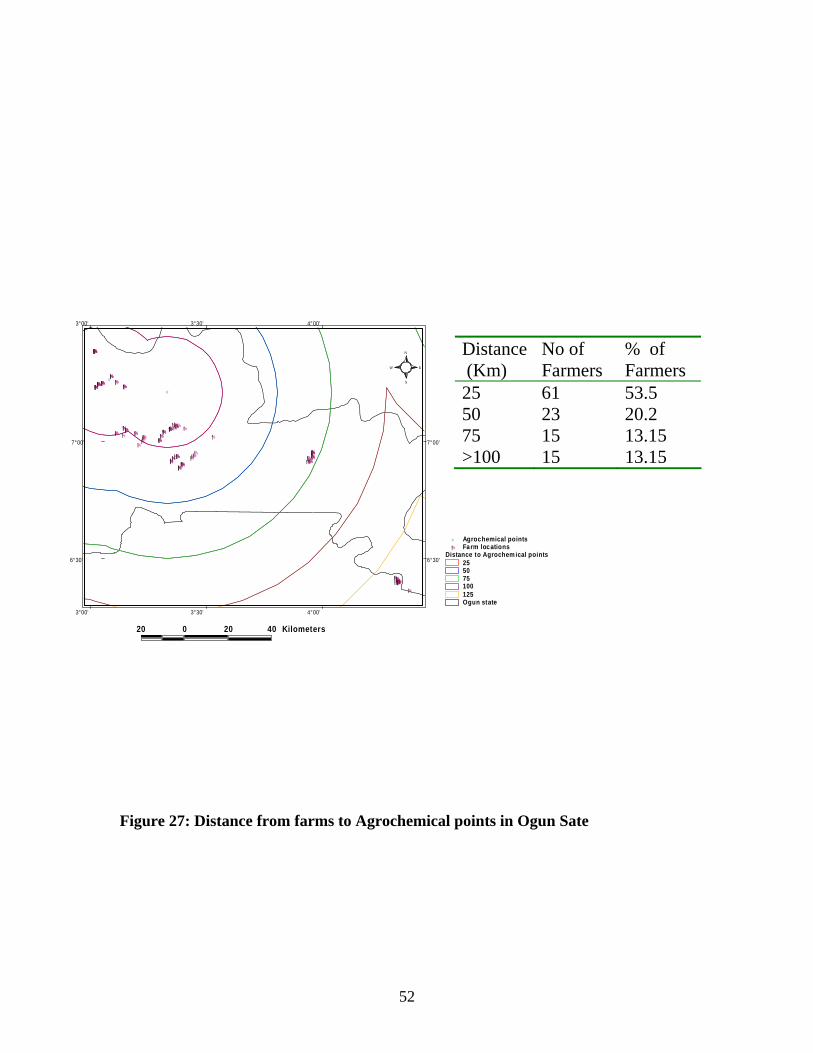
Figure 27: Distance from farms to Agrochemical points in Ogun Sate
Distance (Km)
No of Farmers
% of Farmers
25 61 53.5 50 23 20.2 75 15 13.15 >100 15 13.15

53
%[ %[%[%[
%[%[%[%[%[%[%[%[%[%[%[
%[
%[
%[%[
%[%[
%[%[ %[%[%[%[
%[%[%[ %[%[%[ %[%[%[
%[
%[%[
%[
%[
%[%[%[
%[
%[%[
%[%[%[%[%[%[%[%[
%[%[%[%[
%[%[%[
%[
%[%[%[
%[%[ %[ %[
%[%[
%[%[
%[
%[%[%[%[%[%[%[%[%[ %[%[%[
%[%[%[%[%[%[
%[%[%[%[%[
%[%[%[
%[%[%[%[%[%[%[%[%[
%[%[%[%[
%%%%%%
%%%%%
%%%%%%
%
%%
%
%%
%
%%%%
%%%
%%%
%
%%%
%%
%
%
%
Ogun state
Distance to seed sources51015202550
%[ Farm locations% Seed sources
20 0 20 40 Kilometers
S
N
EW
6°30' 6°30'
7°00' 7°00'
3°00'
3°00'
3°30'
3°30'
4°00'
4°00'
%[ %[%[%[
%[%[%[%[%[%[%[%[%[%[%[
%[
%[
%[%[%[%[
%[%[ %[%[%[%[
%[%[%[ %[%[%[ %[%[%[
%[
%[%[
%[
%[
%[%[%[
%[
%[%[
%[%[%[%[%[%[%[%[
%[%[%[%[
%[%[%[%[
%[%[%[
%[%[ %[ %[%[
%[
%[%[%[
%[%[%[%[%[%[%[%[%[ %[%[%[
%[%[%[%[%[%[
%[%[%[%[%[%[%[%[
%[%[%[%[%[%[%[%[%[
%[%[%[%[#
#
#
#
#
Ogun state
Distance to fertiliser points20406080100
%[ Farm locations# Fertil iser points.
20 0 20 40 Kilometers
S
N
EW
6°30' 6°30'
7°00' 7°00'
3°00'
3°00'
3°30'
3°30'
4°00'
4°00'
Figure 28: Distance from farms to sources of seeds in Ogun Sate
Figure 29: Distance from farms to fertilizer source in Ogun Sate
Distance (Km)
No of Farmers
% of Farmers
5 66 10 17 20 8 25 2
Distance (Km)
No of Farmers
% of Farmers
20 69 60.5 40 14 12.28 60 16 14 >100 15 13.1
54
%[ %[%[%[
%[%[%[%[%[%[%[%[%[%[%[
%[
%[
%[%[
%[%[
%[%[ %[%[
%[%[%[%[%[ %[%[%[ %[%[%[
%[
%[%[
%[
%[
%[%[%[
%[
%[%[
%[%[%[%[%[%[%[%[
%[%[%[%[
%[%[%[
%[
%[%[%[
%[%[ %[ %[
%[%[
%[%[%[
%[%[%[%[%[%[
%[%[%[ %[%[%[
%[%[%[%[%[%[
%[%[%[%[%[
%[%[%[
%[%[%[%[%[%[%[%[%[
%[%[%[%[
#Y
#Y#Y#Y#Y
#Y
#Y
#Y
#Y
#Y
#Y#Y#Y
Ogun state
Distance of farm to milling points 5101520253035
%[ Farm locat ions#Y Milling points
20 0 20 40 Kilometers
S
N
EW
6°30' 6°30'
7°00' 7°00'
3°00'
3°00'
3°30'
3°30'
4°00'
4°00'
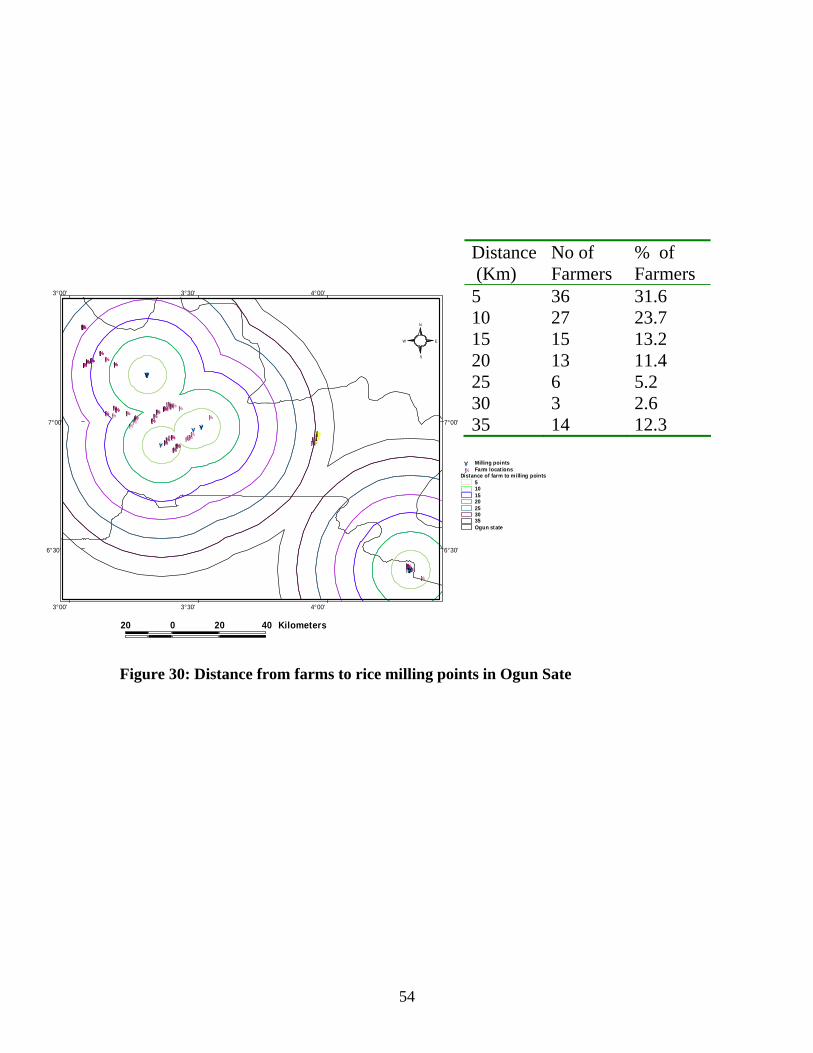
Figure 30: Distance from farms to rice milling points in Ogun Sate
Distance (Km)
No of Farmers
% of Farmers
5 36 31.6 10 27 23.7 15 15 13.2 20 13 11.4 25 6 5.2 30 3 2.6 35 14 12.3
55
%[ %[%[%[
%[%[%[%[%[%[%[%[%[%[%[
%[
%[
%[%[
%[%[
%[%[ %[%[%[%[
%[%[%[ %[%[%[ %[%[%[
%[
%[%[
%[
%[
%[%[%[
%[
%[%[
%[%[%[%[%[%[%[%[
%[%[%[%[
%[%[%[
%[
%[%[%[
%[%[ %[ %[
%[%[
%[%[
%[
%[%[%[%[%[%[%[%[ %[ %[%[%[
%[%[%[%[%[%[
%[%[%[%[%[
%[%[%[
%[%[%[%[%[%[%[%[%[
%[%[%[%[
%%%%%%%%
%%
%
%%%%%
%
%%
%
%
%%%
%
%%
%%%%%%%%
%%%%
%%%%%%%
%% %%
%%
%%%%%%%%%%
%
%%%%
%
%%
% %%%%%%%%
%%%%
Ogun state
Distance to parboiling points36912
%[ Farm locations% Parboiling points
20 0 20 40 Kilometers
S
N
EW
6°30' 6°30'
7°00' 7°00'
3°00'
3°00'
3°30'
3°30'
4°00'
4°00'
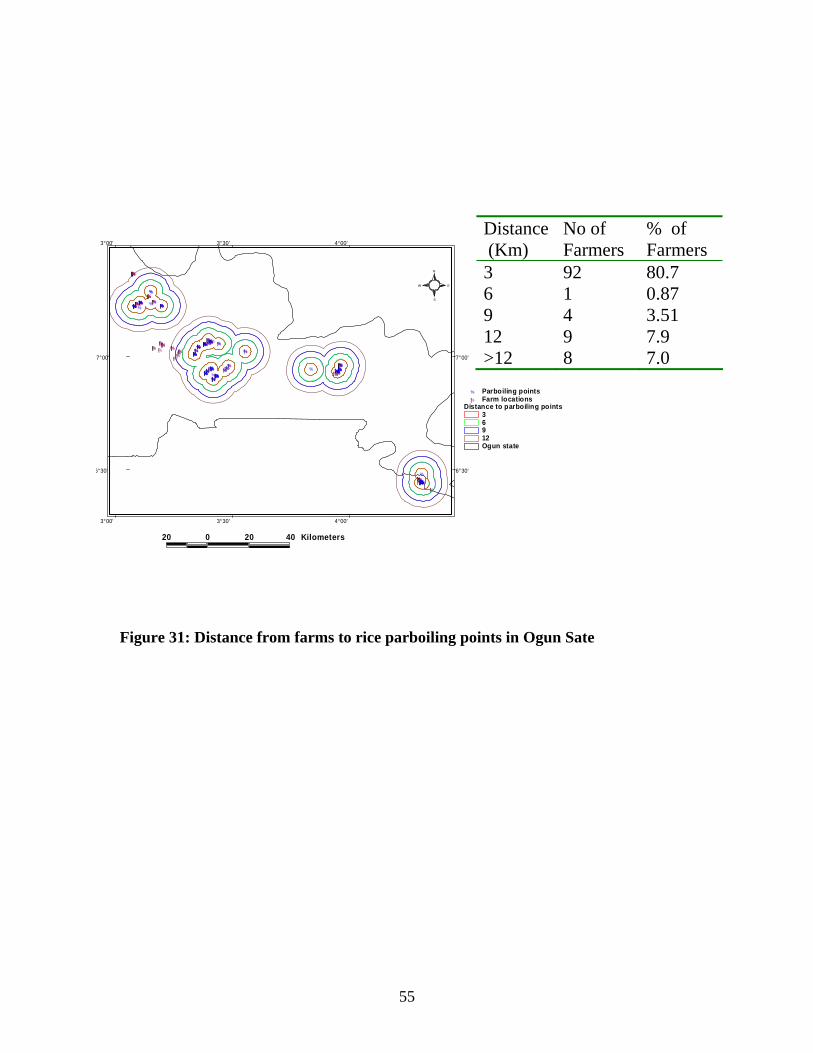
Figure 31: Distance from farms to rice parboiling points in Ogun Sate
Distance (Km)
No of Farmers
% of Farmers
3 92 80.7 6 1 0.87 9 4 3.51 12 9 7.9 >12 8 7.0
56
%[ %[%[%[
%[%[%[%[%[%[%[%[%[%[%[
%[
%[
%[%[
%[%[
%[%[ %[%[%[%[
%[%[%[ %[%[%[ %[%[%[
%[
%[%[
%[
%[
%[%[%[
%[
%[%[
%[%[%[%[%[%[%[%[
%[%[%[%[
%[%[%[
%[
%[%[%[
%[%[ %[ %[
%[%[
%[%[
%[
%[%[%[%[%[%[%[%[%[ %[%[%[
%[%[%[%[%[%[
%[%[%[%[%[
%[%[%[
%[%[%[%[%[%[%[%[%[
%[%[%[%[
%%%%%%%%%%%%%%%%%%
%%
%%%%%%
%
%%
%
%
%%%
%
%%
%%%%%
%%%
%%%%
%%%%
%%%
%% %%
%%
%%%%%%%%%%
%
%%%%
%%%%%%
%%%%%
%%%
%%%%%%%%%
%%%%
Ogun state
Distan ce o f farm to threshing po ints2468
%[ Farm locatio ns% Thresh in g p oin ts
20 0 20 40 Kilometers
S
N
EW
6°30' 6°30'
7°00' 7°00'
3°00'
3°00'
3°30'
3°30'
4°00'
4°00'
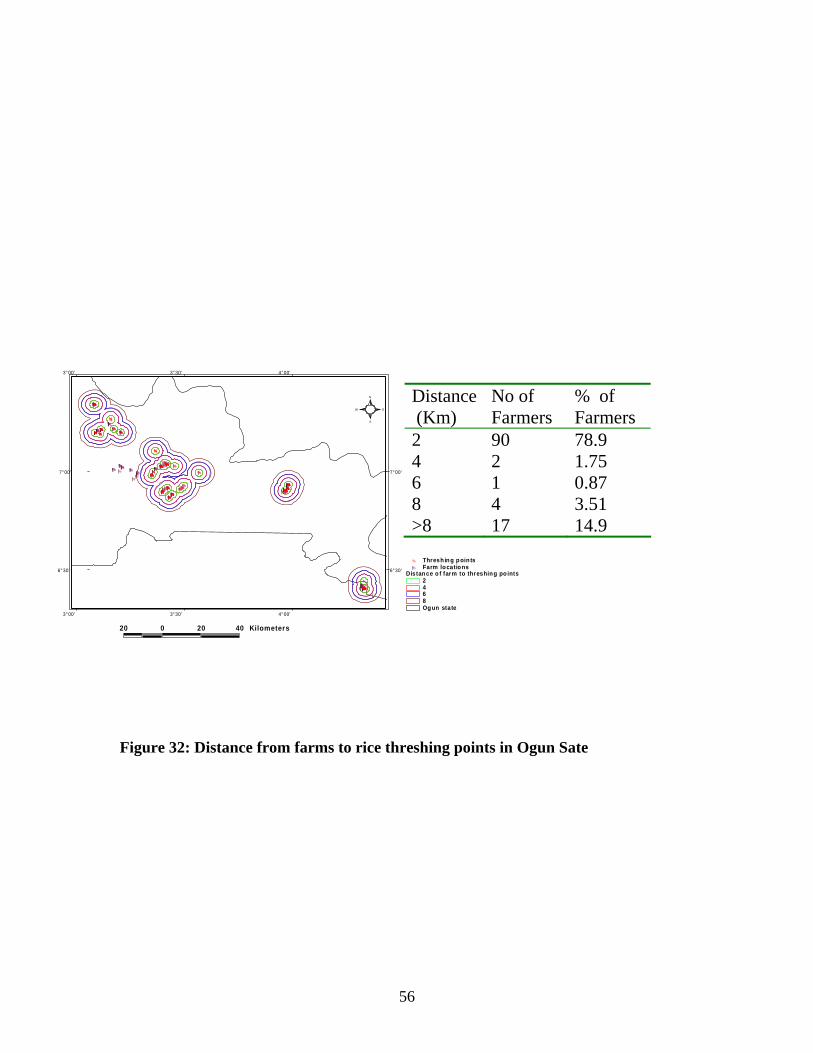
Figure 32: Distance from farms to rice threshing points in Ogun Sate
Distance (Km)
No of Farmers
% of Farmers
2 90 78.9 4 2 1.75 6 1 0.87 8 4 3.51 >8 17 14.9
57
%[ %[%[%[
%[%[%[ %[
%[%[%[%[%[%[%[
%[
%[
%[%[
%[%[
%[%[ %[%[
%[%[%[%[
%[ %[%[%[ %[%[%[
%[
%[%[
%[
%[
%[%[%[
%[
%[%[
%[%[%[%[%[%[%[%[%[%[%[%[
%[%[%[
%[
%[%[%[
%[%[ %[ %[
%[%[
%[%[
%[
%[%[%[%[%[%[%[%[ %[ %[%[%[
%[%[%[%[%[%[
%[%[%[%[%[
%[%[%[
%[%[%[%[%[%[%[%[%[
%[%[%[%[
#
#
#
######
#
#
#
#
#
# ###
##
###
#
####
#
Ogun state
Distance to Paddy m arket510152025
%[ Farm locations# Paddy rice markets.
20 0 20 40 Kilometers
S
N
EW
6°30' 6°30'
7°00' 7°00'
3°00'
3°00'
3°30'
3°30'
4°00'
4°00'
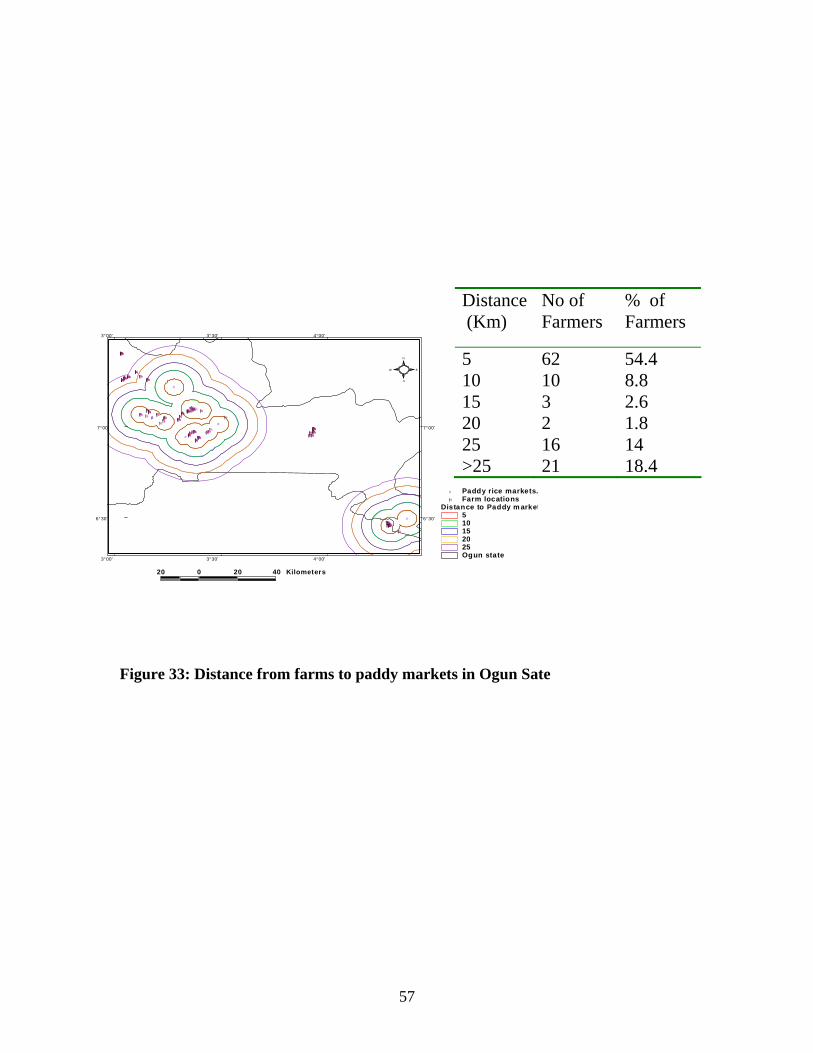
Figure 33: Distance from farms to paddy markets in Ogun Sate
Distance (Km)
No of Farmers
% of Farmers
5 62 54.4 10 10 8.8 15 3 2.6 20 2 1.8 25 16 14 >25 21 18.4

58
DISTANCE ANALYSIS AT THE LOCAL LEVEL The distance analyses data presented in Figures 13 to 33 consistently show that facilities for rice threshing, parboiling, milling, were readily available at local levels and within a short distance (between 2 and 4 kilometres) of the farmers’ farm or residence. Although urban markets may appear to be very far away from these rice production locations according to the distance analysis data, farmers did not seem to have problems selling their paddy or milled rice as buyers come directly to these locations to buy. The same data show that points of production inputs such as seeds, agrochemicals and fertilizer were far away from farmers’ field and residence (between 5 and 30 kilometres) and may not be readily available to the majority of rice farmers. This point to the need for direct intervention by agencies concerned to improve access of farmers to all production inputs.
59
Iwo
Ile Ife
Ilesha
O ndo
Yola
Ada
Osog bo
Ilob u
Ede
Ileo lu ji
G bon gan
In isha
Ila O ran gun
Ip etu Ije sha
Ib oku n
Ife te do
O de Om un
Efon Alaye
Ago O wu
O ke Im eshi
Ijeb u Je sha
Ila
Ife NorthAiyedaade
Iwo
Ife South
O bokun
Ejigbo
Irewo le
Atakum osa East
AiyedireAtakum osa W est
O la-O luw aEgbedore
O do-O tin
Isokan
Ede South
Boripe
Ife lodunO rolu
Ifedayo
Ife East
Bo luwaduro
O lorunda
Ede North
Ilesha E ast
Irepodun
O sogbo
Ife Centra l
Ilesha W est
Ofada R ice Produ ct ion Area
Major settlements
Land co ver typesForest/Tree crop p lantationGrasslandGrassland /woodlandMarsh /wetlandsRain ForestRain fed arable cro psRock outcropSettlementWaterbo dies
Other LGAsOfada rice production areaRoads.
20 0 20 Kilometers7°00' 7°00'
7°10' 7°10'
7°20' 7°20'
7°30' 7°30'
7°40' 7°40'
7°50' 7°50'
8°00' 8°00'
4°00'
4°00'
4°10'
4°10'
4°20'
4°20'
4°30'
4°30'
4°40'
4°40'
4°50'
4°50'
5°00'
5°00'
5°10'
5°10'
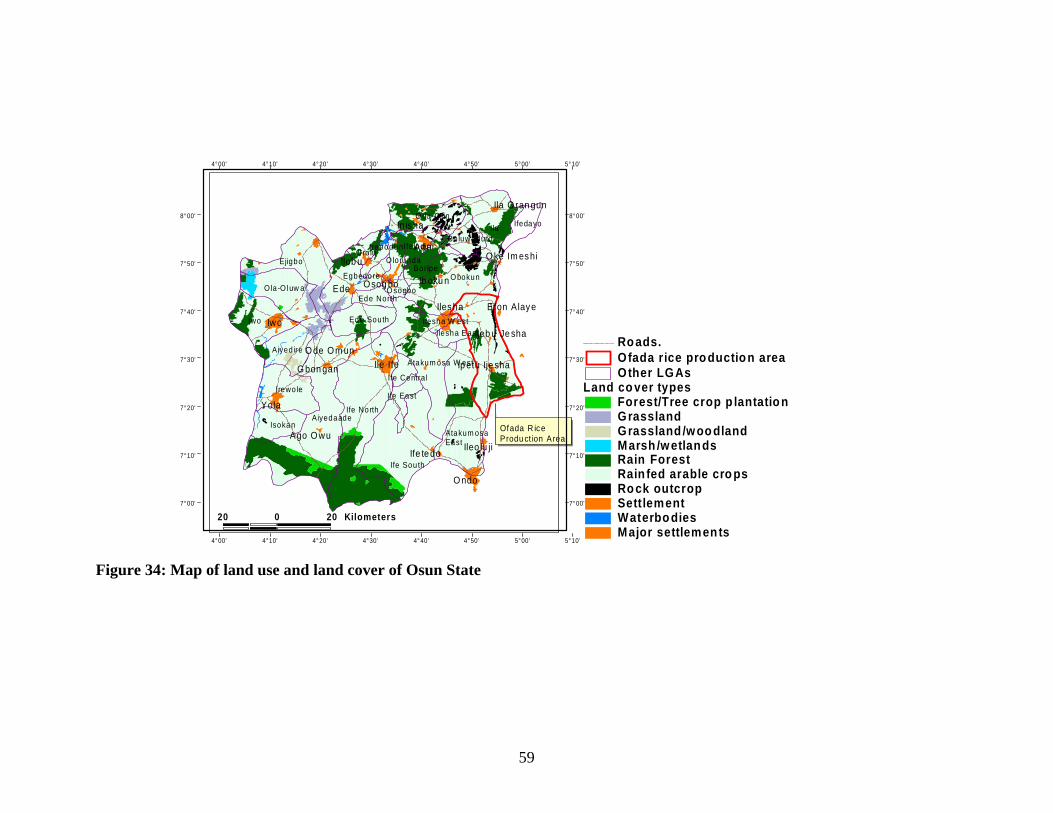
Figure 34: Map of land use and land cover of Osun State
60
Ilesha
Ipetu Ijesha
Efon Alaye
Ijebu Jesha
Ogotun
Landcover types in Oriade LGARain ForestRainfed arable cropsRock outcropSettlement
Ofada rice production areaRoads
10 0 10 20 Kilometers
S
N
EW
7°20' 7°20'
7°24' 7°24'
7°28' 7°28'
7°32' 7°32'
7°36' 7°36'
7°40' 7°40'
7°44' 7°44'
4°40'
4°40'
4°44'
4°44'
4°48'
4°48'
4°52'
4°52'
4°56'
4°56'
5°00'
5°00'
5°4'
5°4'
5°12'
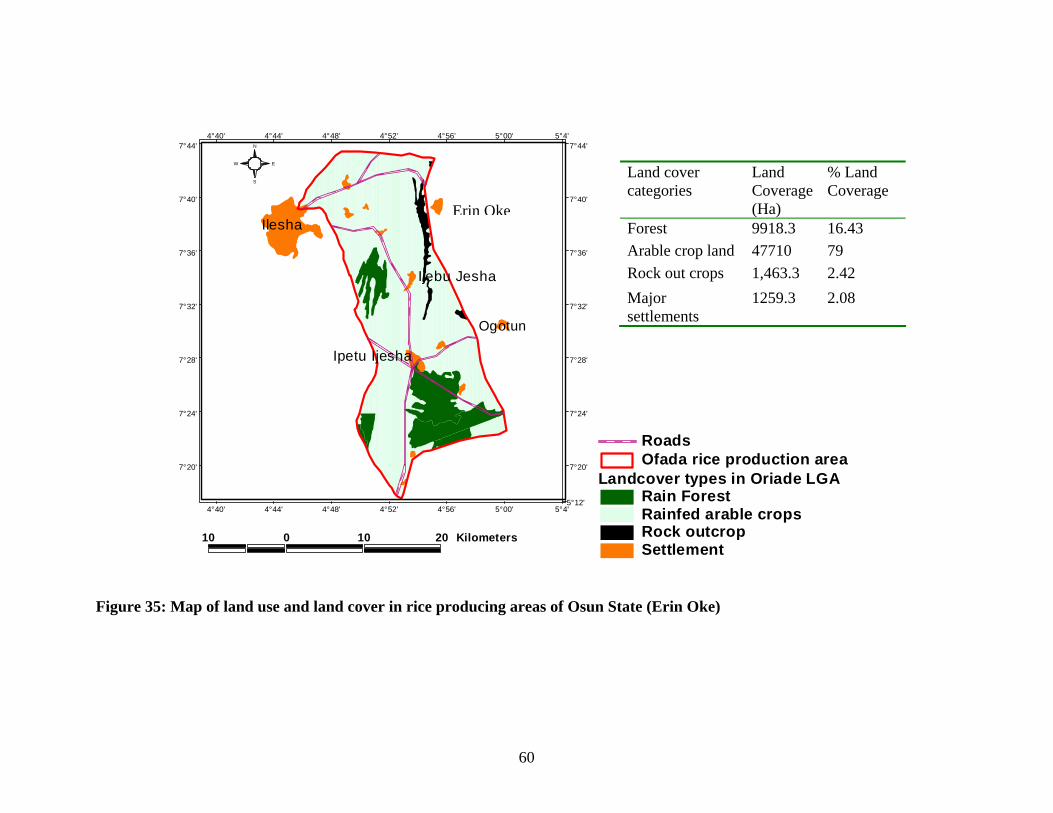
Figure 35: Map of land use and land cover in rice producing areas of Osun State (Erin Oke)
Land cover categories
Land Coverage (Ha)
% Land Coverage
Forest 9918.3 16.43 Arable crop land 47710 79 Rock out crops 1,463.3 2.42 Major settlements
1259.3 2.08
Erin Oke
61
Ado Ekiti
Ikere Ekiti
Ijero Ekiti Oye Ikole Ek iti
Iloro
Ifaki
Ise Ekiti
Ushi
Ilaw e Ekit i
Ayede
Emure Ekit i
Iyin Ekiti
Igbara O do
Ire Ekit i
Aram ok o Ekit i
Aisegba
Igbem o Ekit i
Ijero
Efon
Ekiti W est
Irepodun/Ifelodun
Ijero
Ofada Rice Produc tion Areas
Land covetypesForest plantationGrasslandGrassland/woodlandGulliesIrrigation projectMining areasRain ForestRainfed arable c ropsRiparian forestRock outcropSettlementTree/forest plantationUndisturbed forestWater bodies
Other LGAsOfada rice production areas
30 0 30 Kilometers
S
N
EW
7°30' 7°30'
8°00' 8°00'
5°00'
5°00'
5°30'
5°30'
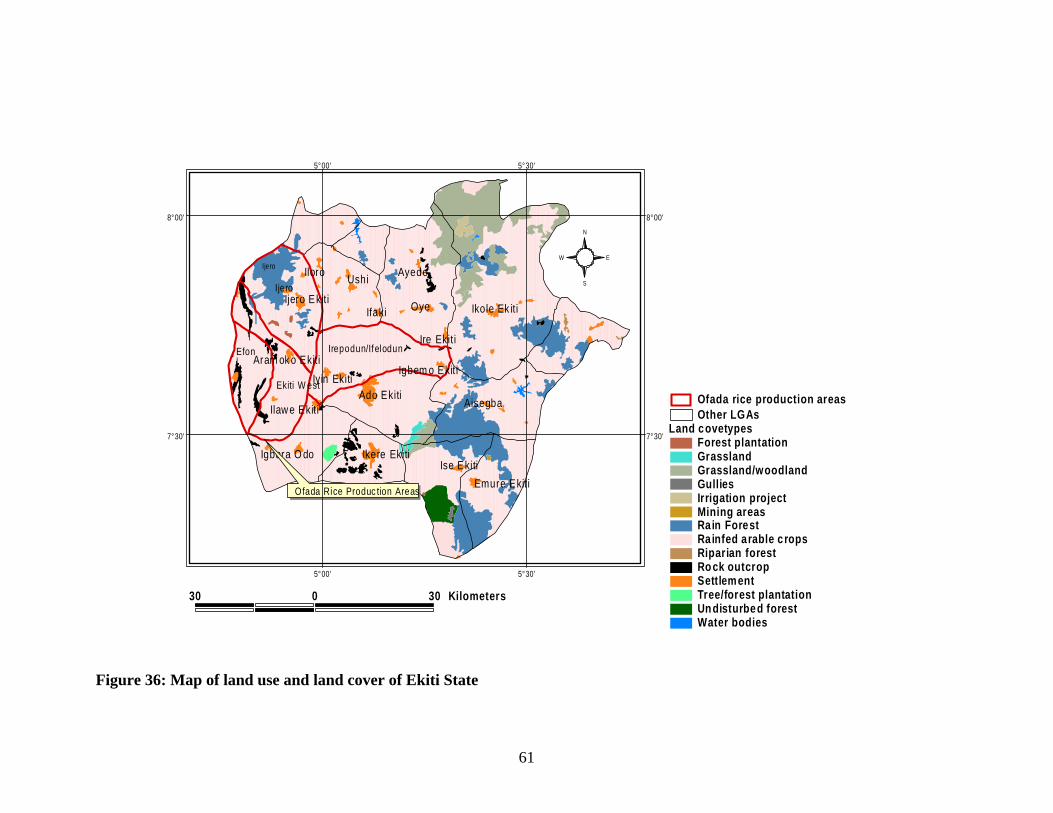
Figure 36: Map of land use and land cover of Ekiti State
62
Ado Ekiti
Ikere Ekiti
Ijero Oye Ikole
Iloro
Ifaki
IseEkiti
Ushi
Ilawe Ekiti
Ayede
Iyin Ekiti
Igbara Odo
Ire Ekiti
Aramoko Ekiti
Aisegba
Igbemo EkitiIgede Ekiti
Efon Alaye
Egusi
IkoroOke Imeshi
Ogotun
Ub i ki i h
Land cover ekiti rice production areaForest reserve/Agric. tree plantationRain ForestRainfed arable crop landRock outcropSettlement
Ofada rice production areas7 0 7 14 Kilometers
S
N
EW
7°30' 7°30'
7°40' 7°40'
7°50' 7°50'
5°00'
5°00'
5°10'
5°10'
5°20'
5°20'
5°30'
5°30'
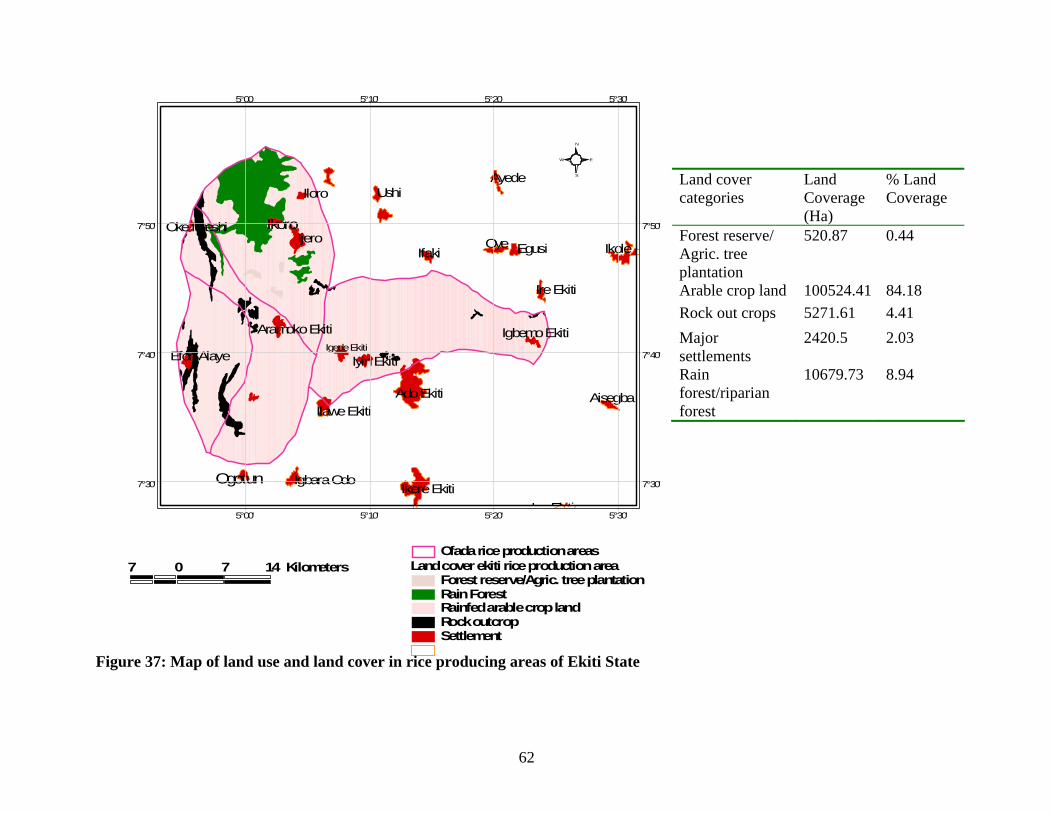
Figure 37: Map of land use and land cover in rice producing areas of Ekiti State
Land cover categories
Land Coverage (Ha)
% Land Coverage
Forest reserve/ Agric. tree plantation
520.87 0.44
Arable crop land 100524.41 84.18 Rock out crops 5271.61 4.41 Major settlements
2420.5 2.03
Rain forest/riparian forest
10679.73 8.94
63
Figure 38: Map of land use and land cover of Ogun State
64
Abeokuta
Shagamu Ijebu Ode
Ijebu-Igbo
AjegunleIperu
Ita Otu
Isara
AlakukoIfo
Ago Iwoye
Ilaro
Aiyetotro
Owode
S ttl t
Landcover typesForest reserve /Agricultural tree PlantationRain forest/Riparian forestRainfed arable crop landSettlementSwamp/wetlandWater bodies
Ofada Rice Production AreasRoads
20 0 20 Kilometers
S
N
EW
6°30' 6°30'
7°00' 7°00'
3°00'
3°00'
3°30'
3°30'
4°00'
4°00'
4°30'
4°30'
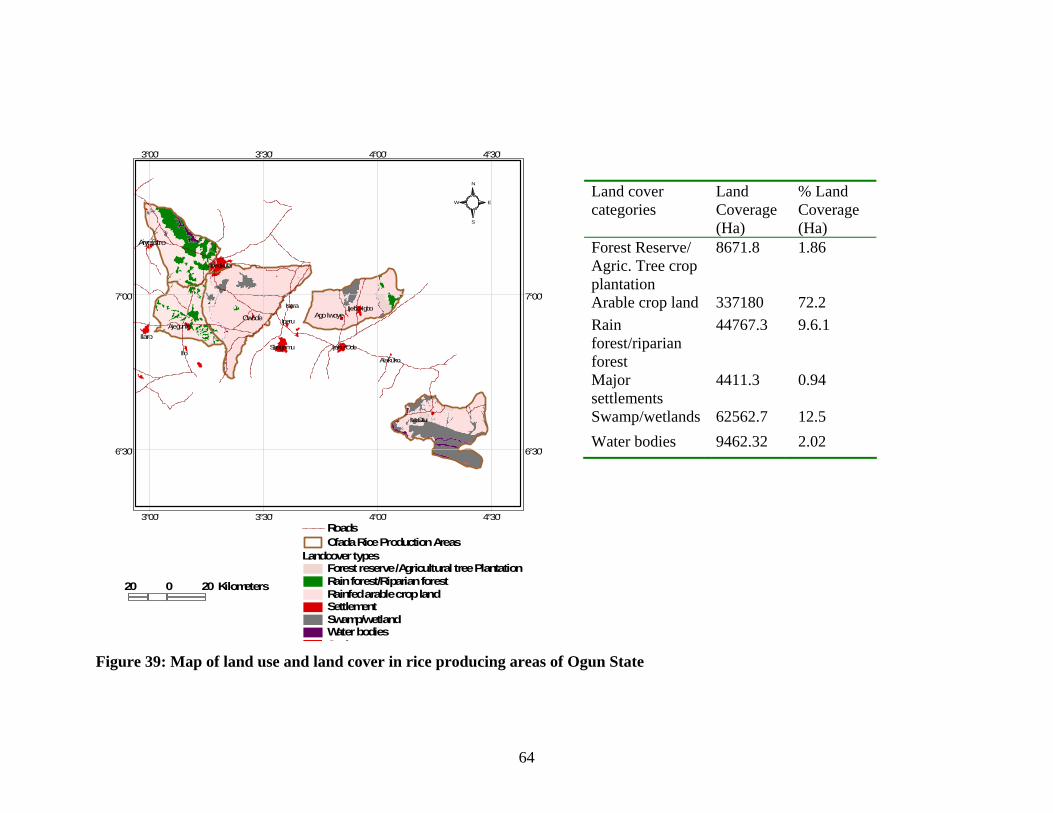
Figure 39: Map of land use and land cover in rice producing areas of Ogun State
Land cover categories
Land Coverage (Ha)
% Land Coverage (Ha)
Forest Reserve/ Agric. Tree crop plantation
8671.8 1.86
Arable crop land 337180 72.2 Rain forest/riparian forest
44767.3 9.6.1
Major settlements
4411.3 0.94
Swamp/wetlands 62562.7 12.5 Water bodies 9462.32 2.02
65
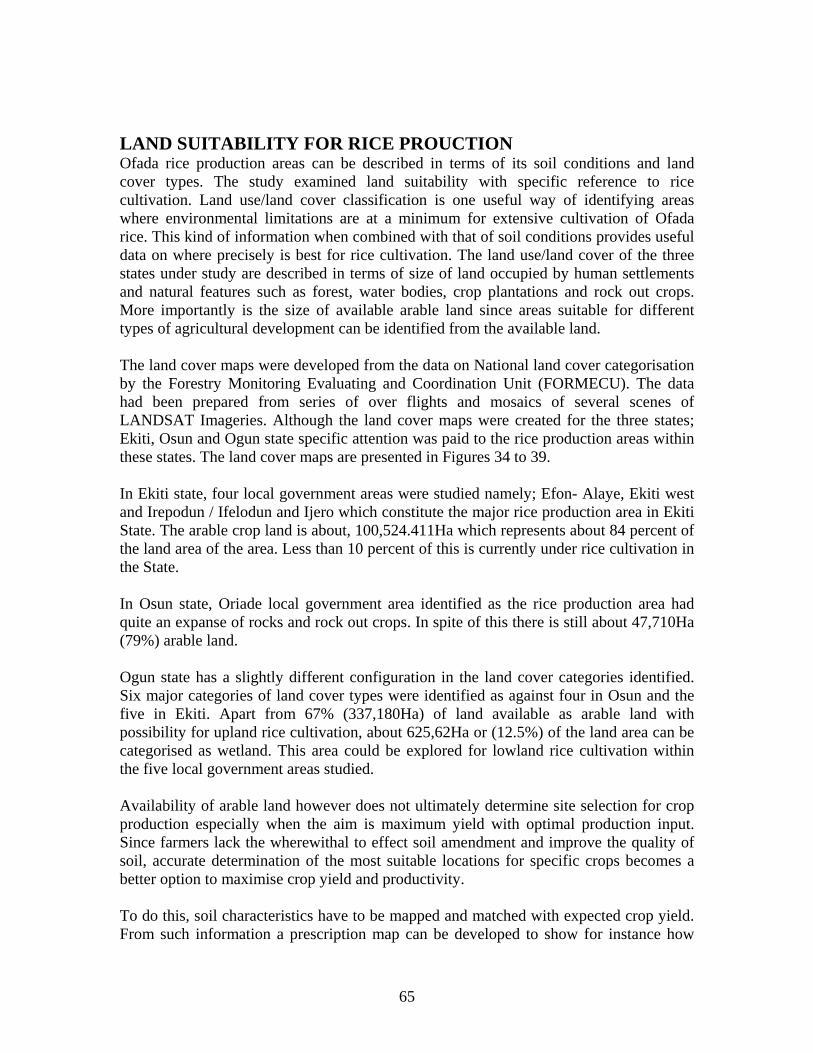
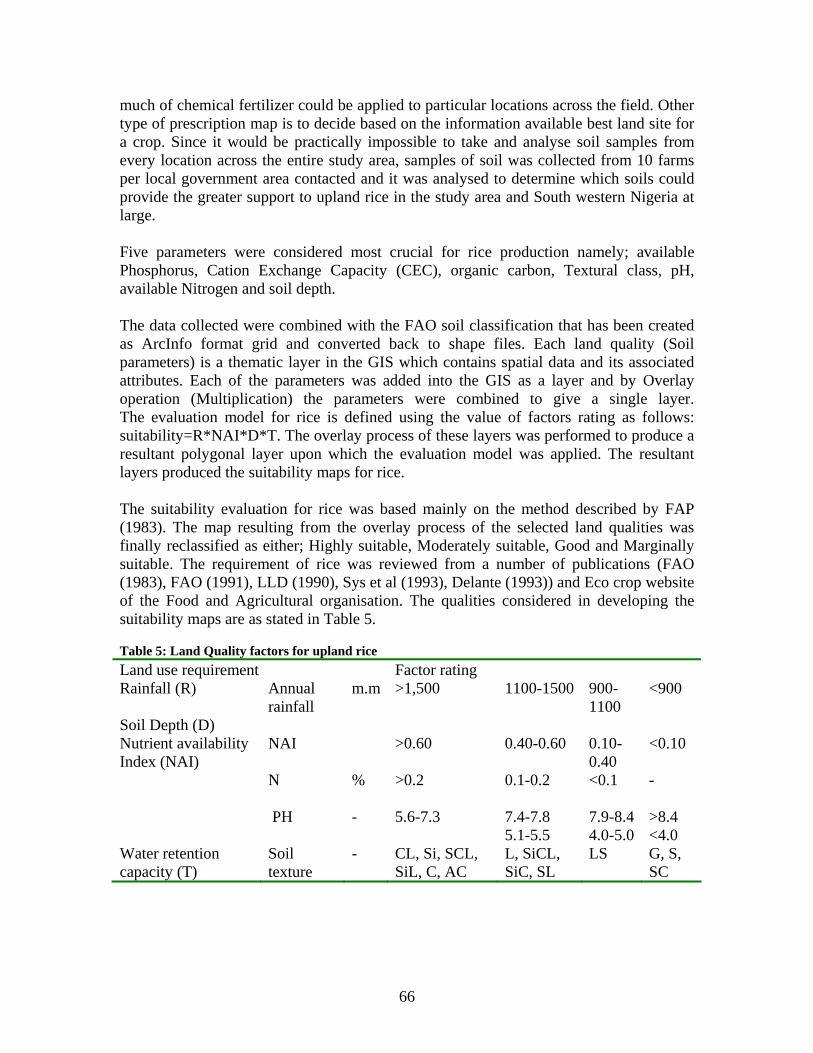
LAND SUITABILITY FOR RICE PROUCTION Ofada rice production areas can be described in terms of its soil conditions and land cover types. The study examined land suitability with specific reference to rice cultivation. Land use/land cover classification is one useful way of identifying areas where environmental limitations are at a minimum for extensive cultivation of Ofada rice. This kind of information when combined with that of soil conditions provides useful data on where precisely is best for rice cultivation. The land use/land cover of the three states under study are described in terms of size of land occupied by human settlements and natural features such as forest, water bodies, crop plantations and rock out crops. More importantly is the size of available arable land since areas suitable for different types of agricultural development can be identified from the available land. The land cover maps were developed from the data on National land cover categorisation by the Forestry Monitoring Evaluating and Coordination Unit (FORMECU). The data had been prepared from series of over flights and mosaics of several scenes of LANDSAT Imageries. Although the land cover maps were created for the three states; Ekiti, Osun and Ogun state specific attention was paid to the rice production areas within these states. The land cover maps are presented in Figures 34 to 39. In Ekiti state, four local government areas were studied namely; Efon- Alaye, Ekiti west and Irepodun / Ifelodun and Ijero which constitute the major rice production area in Ekiti State. The arable crop land is about, 100,524.411Ha which represents about 84 percent of the land area of the area. Less than 10 percent of this is currently under rice cultivation in the State. In Osun state, Oriade local government area identified as the rice production area had quite an expanse of rocks and rock out crops. In spite of this there is still about 47,710Ha (79%) arable land. Ogun state has a slightly different configuration in the land cover categories identified. Six major categories of land cover types were identified as against four in Osun and the five in Ekiti. Apart from 67% (337,180Ha) of land available as arable land with possibility for upland rice cultivation, about 625,62Ha or (12.5%) of the land area can be categorised as wetland. This area could be explored for lowland rice cultivation within the five local government areas studied. Availability of arable land however does not ultimately determine site selection for crop production especially when the aim is maximum yield with optimal production input. Since farmers lack the wherewithal to effect soil amendment and improve the quality of soil, accurate determination of the most suitable locations for specific crops becomes a better option to maximise crop yield and productivity. To do this, soil characteristics have to be mapped and matched with expected crop yield. From such information a prescription map can be developed to show for instance how
66
much of chemical fertilizer could be applied to particular locations across the field. Other type of prescription map is to decide based on the information available best land site for a crop. Since it would be practically impossible to take and analyse soil samples from every location across the entire study area, samples of soil was collected from 10 farms per local government area contacted and it was analysed to determine which soils could provide the greater support to upland rice in the study area and South western Nigeria at large. Five parameters were considered most crucial for rice production namely; available Phosphorus, Cation Exchange Capacity (CEC), organic carbon, Textural class, pH, available Nitrogen and soil depth. The data collected were combined with the FAO soil classification that has been created as ArcInfo format grid and converted back to shape files. Each land quality (Soil parameters) is a thematic layer in the GIS which contains spatial data and its associated attributes. Each of the parameters was added into the GIS as a layer and by Overlay operation (Multiplication) the parameters were combined to give a single layer. The evaluation model for rice is defined using the value of factors rating as follows: suitability=R*NAI*D*T. The overlay process of these layers was performed to produce a resultant polygonal layer upon which the evaluation model was applied. The resultant layers produced the suitability maps for rice. The suitability evaluation for rice was based mainly on the method described by FAP (1983). The map resulting from the overlay process of the selected land qualities was finally reclassified as either; Highly suitable, Moderately suitable, Good and Marginally suitable. The requirement of rice was reviewed from a number of publications (FAO (1983), FAO (1991), LLD (1990), Sys et al (1993), Delante (1993)) and Eco crop website of the Food and Agricultural organisation. The qualities considered in developing the suitability maps are as stated in Table 5. Table 5: Land Quality factors for upland rice Land use requirement Factor rating Rainfall (R) Annual
rainfall m.m >1,500 1100-1500 900-
1100 <900
Soil Depth (D) NAI >0.60 0.40-0.60 0.10-
0.40 <0.10 Nutrient availability
Index (NAI) N PH
% -
>0.2 5.6-7.3
0.1-0.2 7.4-7.8 5.1-5.5
<0.1 7.9-8.4 4.0-5.0
- >8.4 <4.0
Water retention capacity (T)
Soil texture
- CL, Si, SCL, SiL, C, AC
L, SiCL, SiC, SL
LS G, S, SC

67
Temperature and rainfall are generally adequate and well distributed and almost uniform over south western Nigeria. Hence temperature in particular was not considered in the land suitability calculation. The land suitability maps for rice production clusters in the three States are presented in Figures 40 to 42
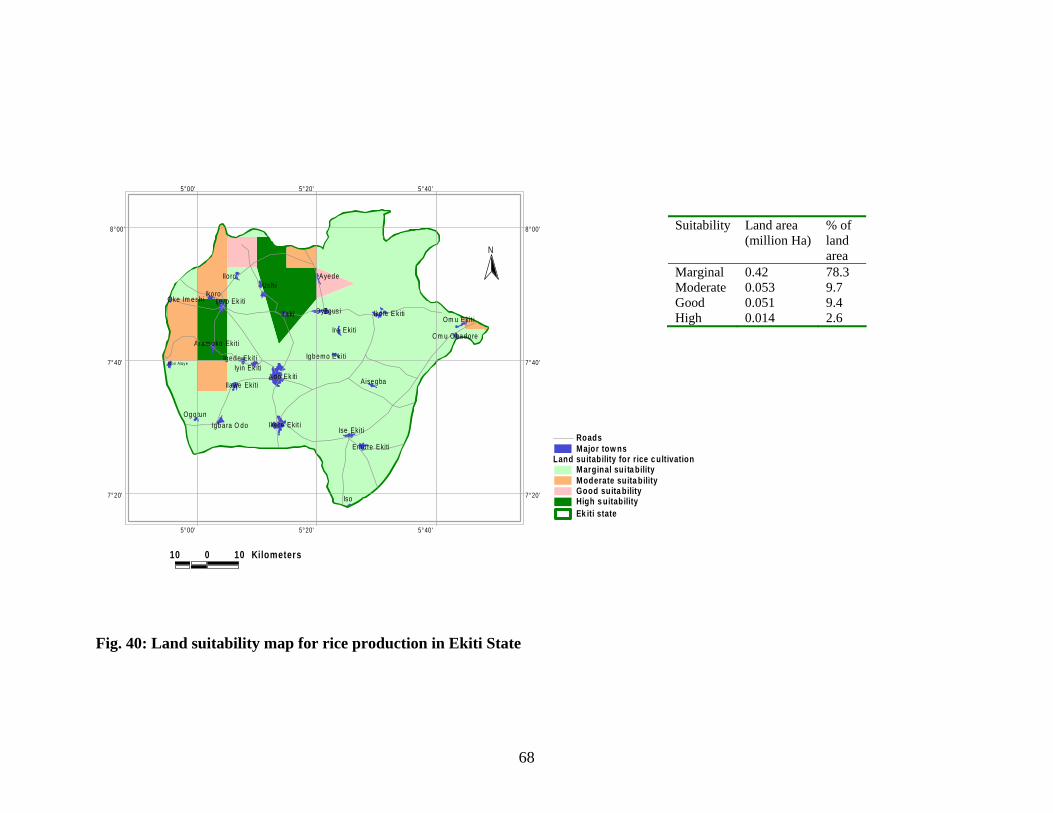
68
Ado Ek it i
Ikere Ekit i
Ije ro Ek itiOye Iko le E kiti
Ilo ro
Ifaki
Ise Ekit i
Us h i
Egus i
Ilawe Ekit i
Ikoro
Ayede
Em ure Ekiti
Iyin Ek iti
Igbara O do
Ire EkitiOm u Ekit i
Aramoko Ekit i
Igede Ek it i
Aisegba
Ogotun
Igbemo E kiti
Iso
Om u O badore
Oke Im esh i
Efon A lay e
Ek iti state
Land suitability for rice c ultivationMarginal sui ta bilityModerate suita bilityGood suita bilityHigh s uitability
Major tow nsRoads
10 0 10 Kilometers
N
7°20' 7°20'
7°40' 7°40'
8°00' 8°00'
5°00'
5°00'
5°20'
5°20'
5°40'
5°40'
Fig. 40: Land suitability map for rice production in Ekiti State
Suitability Land area (million Ha)
% of land area
Marginal 0.42 78.3 Moderate 0.053 9.7 Good 0.051 9.4 High 0.014 2.6
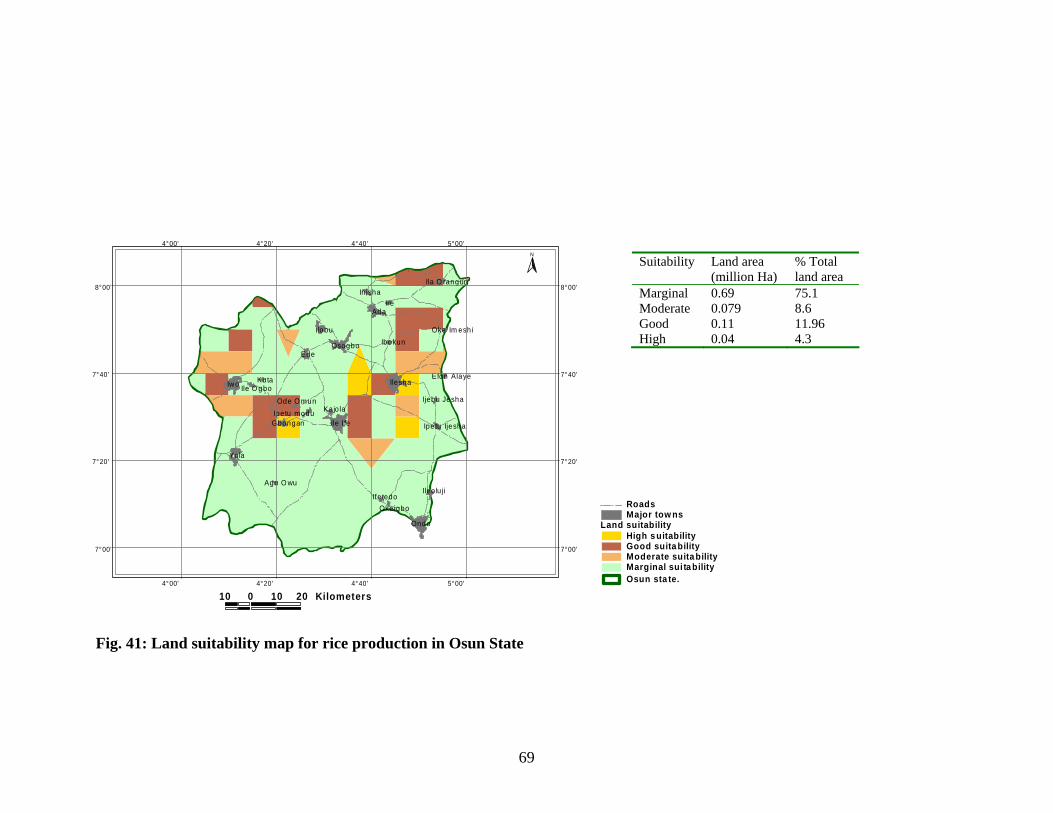
69
Iwo
Ile I fe
Ilesha
Ondo
Yola
Ada
Osogbo
Ilobu
Ede
Ileolu ji
Ire
Gbongan
InishaIla O rangun
Kajola
Kuta
Ipetu modu
Ipetu Ijesha
Ile O gbo
Ibokun
Ifetedo
Ode O mun
Efon Alaye
Okeigbo
Ago O wu
Oke Im esh i
Ijebu Jesha
Osun sta te.
Land suitability High s uitabilityGood suita bilityModerate suita bilityMarginal sui ta bility
Major tow nsRoads
10 0 10 20 Kilometers
N
7°00' 7°00'
7°20' 7°20'
7°40' 7°40'
8°00' 8°00'
4°00'
4°00'
4°20'
4°20'
4°40'
4°40'
5°00'
5°00'
Fig. 41: Land suitability map for rice production in Osun State
Suitability Land area (million Ha)
% Total land area
Marginal 0.69 75.1 Moderate 0.079 8.6 Good 0.11 11.96 High 0.04 4.3

70
Ab eo k u ta
Sh ag a m u
Ila ro
Ije b u O de
Ije b u- Ig b o
A jeg u n le
Ifo
A iyeto tr o
Id iro ko
Ip e ru
Ad o- Od o
Ow o d e
Ita O tu
Ilish an
Isa ra
Im e k o
Iw o p in
Ag o Iw o ye
A lak u ko
O ja O d a n
O gu n state .
R ic e su ita b ili ty H ig h su ita bi lit yM od era te s ui ta bi lityG oo d su ita b ili tyM arg in al s uitab il ityInlan d W ater
M ajor tow nsRoa d s
20 0 20 40 Kilom eters
N
6°30' 6°30'
7° 00' 7°00'
7°30' 7°30'
8° 00' 8°00'
3° 00'
3° 00'
3° 30'
3° 30'
4° 00'
4° 00'
4° 30'
4° 30'
Fig. 42: Land suitability map for rice production in Ogun State
Suitability Land area (million Ha)
% Total area
Marginal 0.53 26.49 Moderate 0.7 35.37 Good 0.43 21.63 High 0.33 16.51
71
In Ekiti west local government area, it was established that the soils around Aramoko and Ijero Ekiti up to Ifaki were highly suitable for upland rice cultivation while the soils around Ado-Ekiti, Iyin Ekiti Igede Ekiti and Igbemo are marginally suitable for rice cultivation. The soils around Efon Alaye, and Oke Imesi have moderate suitability. The implication of this is that rice farmers in Igbemo Ekiti would require special attention in soil management and land amendment practices to guarantee steady and improved productivity. In Osun state soils close to Ilesha, particularly Erin Oke was classified as highly suitable, but over 79% of the arable land are categorised as marginal. Ogun state shows a little exception especially around Obafemi Owode local government where almost 50% of the arable soil is considered as highly suitable for the cultivation of upland rice. This is a bit surprising given the long years of rice cultivation in the area one would expect the soil to be generally deficient in critical rice soil nutrients. The explanation could be that most farmers adopting the rotational fallow system have somehow perfected a form of land management strategy that ensured quick replenishment of soil nutrients Ijebu North Local government area presents a slightly different picture. One half of the area is categorised as marginally suitable while the other half is classified as moderately suitable. Soils of Ijebu water-side are mostly deficient in nitrogen and phosphorus Generally soils of south-western Nigeria have been described by Moss (1957), Smyth and Montgomery (1962). The parent material is a major determinant of soil characteristics. Soils of the study area are predominantly forest soils derived from metamorphic and igneous rocks (basement complex). An exemption is the Ijebu water-side dominated by deltaic deposits, fresh water swamp soils and saline mangrove soils. Soils of the basement complex parent material have red to brown upper subsoil with higher clay content than the surface or lower sub-soil. The soils are characterized with slight to moderate leaching. Nitrogen response may not be obtained on soils that are newly cleared from about 10 years of bush fallow. Total N is generally above 0.1% (considered minimum for rice) while organic matter is usually above 1.5%. Because these soils have high Phosphorus adsorption capacity, phosphorus deficiency could present a serious problem. Since most of the phosphorus is in organic form, a high proportion of the available P is released through mineralization of organic phosphorus. The potassium status of these soils could vary widely. In high rainfall areas, economic response to K could be obtained after a year as a result of erosion, low mineral reserves and wide variation in the mineral composition of the parent material. There is a general decline in the initial soil fertility under continuous cultivation.
72
Summary, conclusions and recommendations PropCom’s proposition to support activities that impact on the Ofada rice value chain requires accurate information to develop appropriate interventions. Mapping of the Ofada rice value chain is important in obtaining the kind of information required. The mapping exercise is expected to facilitate geographical targeting of interventions where they are needed, improve cost effectiveness of infrastructural development spending and more efficiently reach those who need intervention most. These no doubt are some of the cogent reasons for PropCom’s commissioning of this study. The mapping exercise identified major Ofada rice production areas in Ogun, Osun and Ekiti States. It identified 254 Ofada rice farmers majority of whom are males, 204 parboilers mostly females, 36 rice mills in 55 villages and 11 local government areas in the three states. Obafemi Owode local government area of Ogun State produced the highest quantity of Ofada rice (135,850 KG) in the study area. This was closely followed by Irepodun/Ifelodun Local government area of Ekiti (134,90KG). These two local government areas host Ofada village and Igbemo Ekiti respectively where there is a long tradition of rice production. The next highest producer is Oriade local government area in Osun State which recorded production level of 70,100 KG. The highest quantity of rice parboiled and milled was 109,800 Kg and this is from Obafem Owode Local government area. The lowest quantity parboiled and milled was 7, 670 Kg and this is from Ijero local government area of Ekiti State. The quantity of Ofada rice sold in paddy form was 21,110 Kg in Ogun Waterside local government area of Ogun State and 15,700 Kg in Ekiti West Local government area of Ekiti State. The total quantity of rice sold in paddy form was 36, 813Kg. The distance analyses data consistently show that facilities for rice threshing, parboiling, milling, were readily available at local levels and within a short distance (between 2 and 4 kilometres) of the farmers’ farm or residence. Although urban markets may appear to be very far away from rice production locations according to the distance analysis data, farmers did not seem to have problems selling their paddy or milled rice as buyers come directly to these locations to buy. The data further show that locations of Ofada rice production inputs such as seeds, agrochemicals and fertilizer were far away from farmers’ field and residence (between 5 and 30 kilometres) and may not be readily available to the majority of rice farmers. This situation points to the need for direct interventions to improve access of farmers to all rice production inputs.
The total arable crop land in the rice production areas of Ekiti state is 100,524.411Ha. This represents about 84 percent of the total land area. Less than 10 percent of this is currently under rice cultivation in the State. In Osun state, Oriade local government area identified as the rice production area has 47,710Ha (79%) arable land. In Ogun state apart from 67% (337,180Ha) of land available as arable land with possibility for upland rice cultivation, about 625,62Ha or (12.5%) of the land area was categorised as wetland. This area could be explored for lowland rice cultivation within the five local government areas studied.
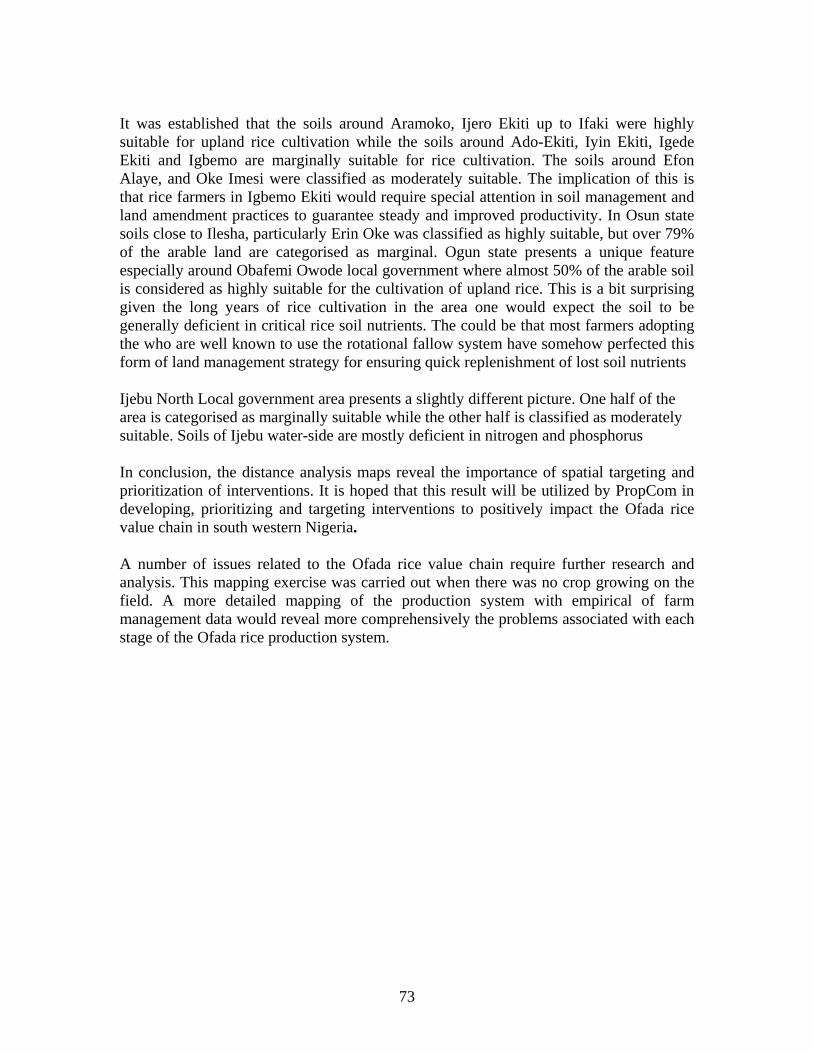
73
It was established that the soils around Aramoko, Ijero Ekiti up to Ifaki were highly suitable for upland rice cultivation while the soils around Ado-Ekiti, Iyin Ekiti, Igede Ekiti and Igbemo are marginally suitable for rice cultivation. The soils around Efon Alaye, and Oke Imesi were classified as moderately suitable. The implication of this is that rice farmers in Igbemo Ekiti would require special attention in soil management and land amendment practices to guarantee steady and improved productivity. In Osun state soils close to Ilesha, particularly Erin Oke was classified as highly suitable, but over 79% of the arable land are categorised as marginal. Ogun state presents a unique feature especially around Obafemi Owode local government where almost 50% of the arable soil is considered as highly suitable for the cultivation of upland rice. This is a bit surprising given the long years of rice cultivation in the area one would expect the soil to be generally deficient in critical rice soil nutrients. The could be that most farmers adopting the who are well known to use the rotational fallow system have somehow perfected this form of land management strategy for ensuring quick replenishment of lost soil nutrients Ijebu North Local government area presents a slightly different picture. One half of the area is categorised as marginally suitable while the other half is classified as moderately suitable. Soils of Ijebu water-side are mostly deficient in nitrogen and phosphorus In conclusion, the distance analysis maps reveal the importance of spatial targeting and prioritization of interventions. It is hoped that this result will be utilized by PropCom in developing, prioritizing and targeting interventions to positively impact the Ofada rice value chain in south western Nigeria. A number of issues related to the Ofada rice value chain require further research and analysis. This mapping exercise was carried out when there was no crop growing on the field. A more detailed mapping of the production system with empirical of farm management data would reveal more comprehensively the problems associated with each stage of the Ofada rice production system.
74
References Bo-heng Li, 1990. Application of Remote Sensing and GIS, China's Land Survey, Evaluation and Administration. Proceeding of the 11th ACRS vol 11Nov. 15-21, 1990 Guangzhou, China.
Delante, V.Z., 1993, Land Suitability Classification for Cassava, pineapple and rubber using GIS in A, Pluak Daeng, Rayong Prov. M.Sc. Res. Study, AIT Thailand. FAO. 1983. Guidelines: Land Evaluation for Rainfed agriculture soils Bulletin No. 52 Rome: 237. FAO. 1991. Guidelines: Land Evaluation for Extensive Grazing. FAO Soils Bulletin No.58. Rome: Land Development, 1990. Land Evaluation for Economic crops. Min. of Agriculture and cooperatives. Moss. R. P. 1957. Report of the classification of soil found sedimentary rocks. In western Nigeria Soil Survey Report. No. 67 Radcliffe D.J. and Rochette L. Maize in Angonia. 1983. An analysis of factors production. Field Report 30, FAO/UNDP MOZ/75/011, Maputo. Ver. 22. Smyth A. J. and R. F. Montgomery, 1962. Soils and Land Use in Central Western Nigeria. Government Press Ibadan
Sys. C, Ranst. V Debaveye. J. and Beenaert. F. 1993. Land Evaluation Part III crop requirements. Agr. Publication No. 7, ITC Ghent.
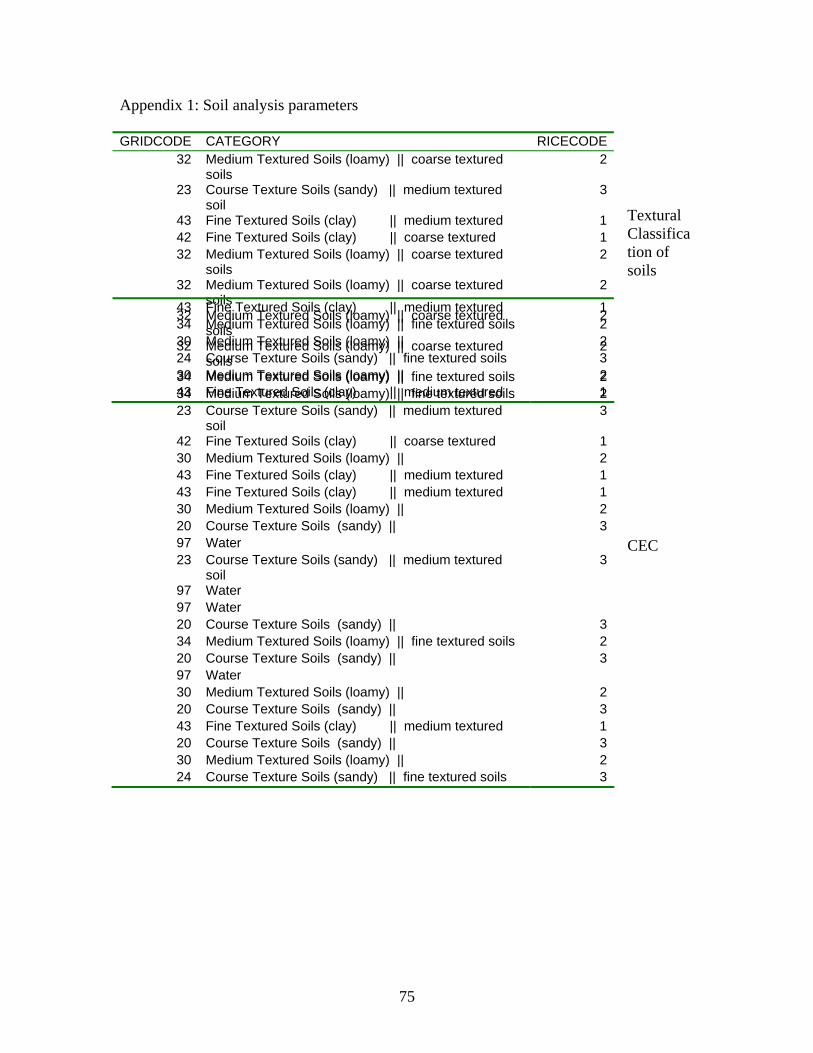
75
Appendix 1: Soil analysis parameters Textural Classification of soils CEC
GRIDCODE CATEGORY RICECODE 32 Medium Textured Soils (loamy) || coarse textured
soils 2
23 Course Texture Soils (sandy) || medium textured soil
3
43 Fine Textured Soils (clay) || medium textured 1 42 Fine Textured Soils (clay) || coarse textured 1 32 Medium Textured Soils (loamy) || coarse textured
soils 2
32 Medium Textured Soils (loamy) || coarse textured soils
2
32 Medium Textured Soils (loamy) || coarse textured soils
2
32 Medium Textured Soils (loamy) || coarse textured soils
2
34 Medium Textured Soils (loamy) || fine textured soils 2 34 Medium Textured Soils (loamy) || fine textured soils 2 23 Course Texture Soils (sandy) || medium textured
soil 3
42 Fine Textured Soils (clay) || coarse textured 1 30 Medium Textured Soils (loamy) || 2 43 Fine Textured Soils (clay) || medium textured 1 43 Fine Textured Soils (clay) || medium textured 1 30 Medium Textured Soils (loamy) || 2 20 Course Texture Soils (sandy) || 3 97 Water 23 Course Texture Soils (sandy) || medium textured
soil 3
97 Water 97 Water 20 Course Texture Soils (sandy) || 3 34 Medium Textured Soils (loamy) || fine textured soils 2 20 Course Texture Soils (sandy) || 3 97 Water 30 Medium Textured Soils (loamy) || 2 20 Course Texture Soils (sandy) || 3 43 Fine Textured Soils (clay) || medium textured 1 20 Course Texture Soils (sandy) || 3 30 Medium Textured Soils (loamy) || 2 24 Course Texture Soils (sandy) || fine textured soils 3
43 Fine Textured Soils (clay) || medium textured 1 34 Medium Textured Soils (loamy) || fine textured soils 2 30 Medium Textured Soils (loamy) || 2 24 Course Texture Soils (sandy) || fine textured soils 3 30 Medium Textured Soils (loamy) || 2 43 Fine Textured Soils (clay) || medium textured 1
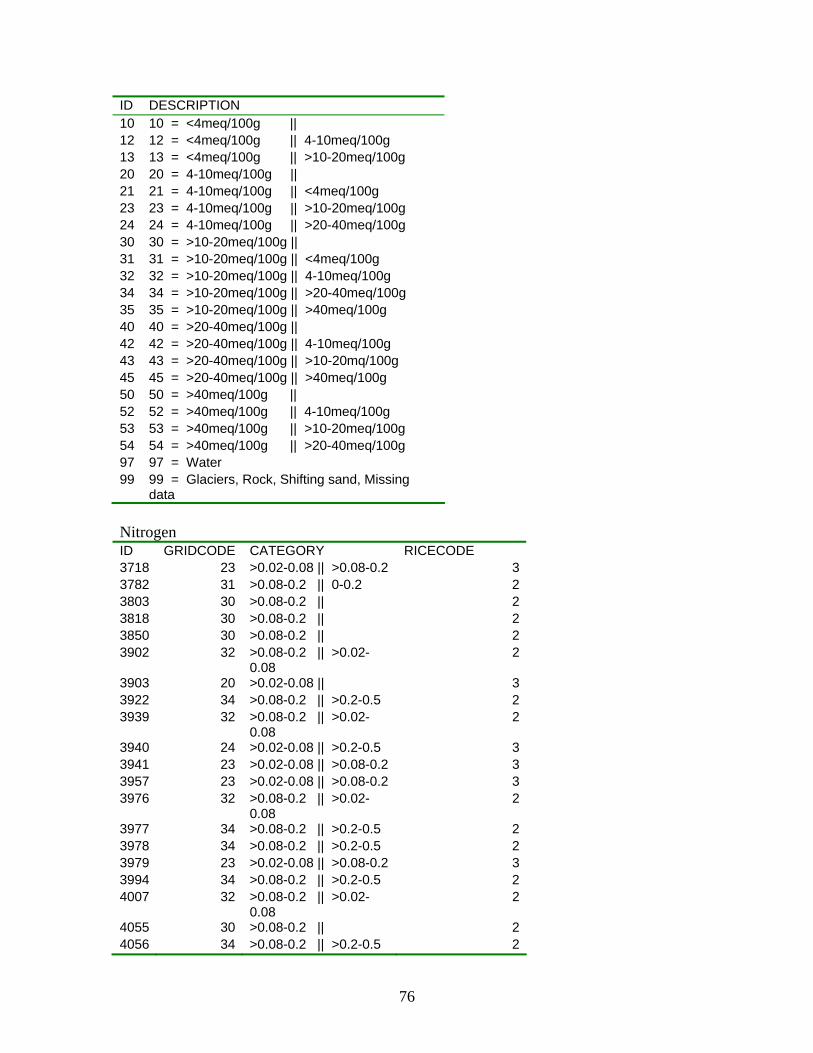
76
ID DESCRIPTION 10 10 = <4meq/100g || 12 12 = <4meq/100g || 4-10meq/100g 13 13 = <4meq/100g || >10-20meq/100g 20 20 = 4-10meq/100g || 21 21 = 4-10meq/100g || <4meq/100g 23 23 = 4-10meq/100g || >10-20meq/100g 24 24 = 4-10meq/100g || >20-40meq/100g 30 30 = >10-20meq/100g || 31 31 = >10-20meq/100g || <4meq/100g 32 32 = >10-20meq/100g || 4-10meq/100g 34 34 = >10-20meq/100g || >20-40meq/100g 35 35 = >10-20meq/100g || >40meq/100g 40 40 = >20-40meq/100g || 42 42 = >20-40meq/100g || 4-10meq/100g 43 43 = >20-40meq/100g || >10-20mq/100g 45 45 = >20-40meq/100g || >40meq/100g 50 50 = >40meq/100g || 52 52 = >40meq/100g || 4-10meq/100g 53 53 = >40meq/100g || >10-20meq/100g 54 54 = >40meq/100g || >20-40meq/100g 97 97 = Water 99 99 = Glaciers, Rock, Shifting sand, Missing
data Nitrogen ID GRIDCODE CATEGORY RICECODE 3718 23 >0.02-0.08 || >0.08-0.2 33782 31 >0.08-0.2 || 0-0.2 23803 30 >0.08-0.2 || 23818 30 >0.08-0.2 || 23850 30 >0.08-0.2 || 23902 32 >0.08-0.2 || >0.02-
0.08 2
3903 20 >0.02-0.08 || 33922 34 >0.08-0.2 || >0.2-0.5 23939 32 >0.08-0.2 || >0.02-
0.08 2
3940 24 >0.02-0.08 || >0.2-0.5 33941 23 >0.02-0.08 || >0.08-0.2 33957 23 >0.02-0.08 || >0.08-0.2 33976 32 >0.08-0.2 || >0.02-
0.08 2
3977 34 >0.08-0.2 || >0.2-0.5 23978 34 >0.08-0.2 || >0.2-0.5 23979 23 >0.02-0.08 || >0.08-0.2 33994 34 >0.08-0.2 || >0.2-0.5 24007 32 >0.08-0.2 || >0.02-
0.08 2
4055 30 >0.08-0.2 || 24056 34 >0.08-0.2 || >0.2-0.5 2
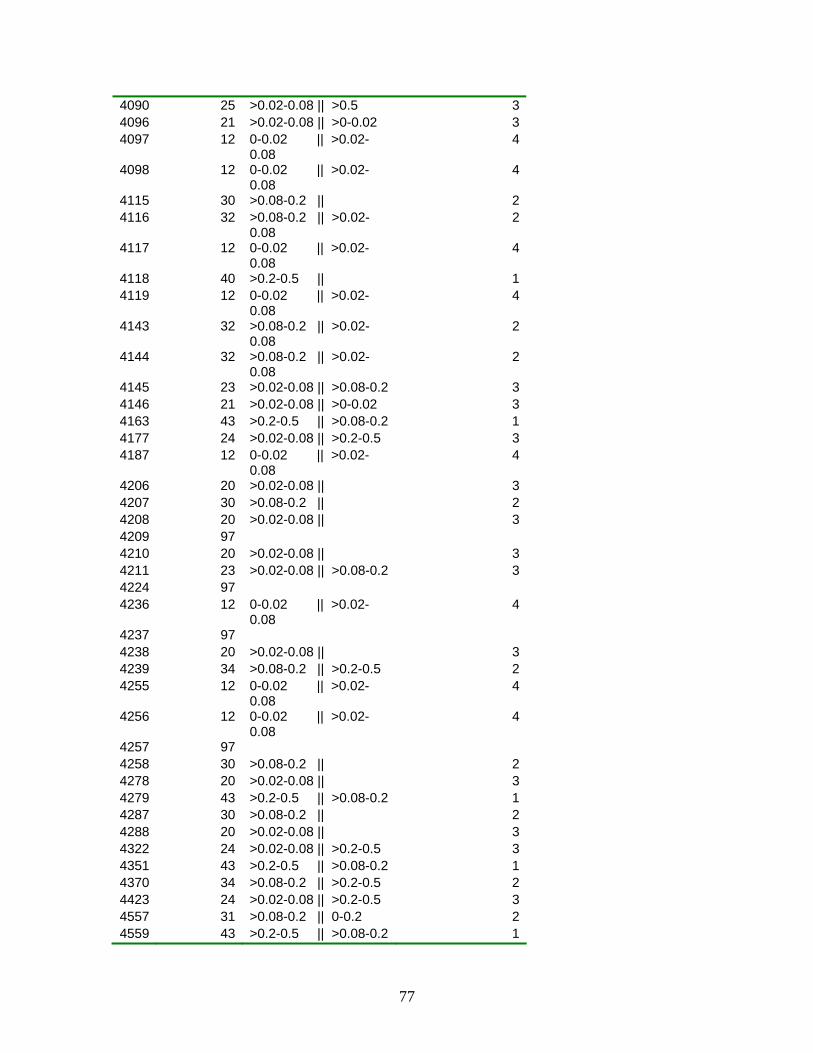
77
4090 25 >0.02-0.08 || >0.5 34096 21 >0.02-0.08 || >0-0.02 34097 12 0-0.02 || >0.02-
0.08 4
4098 12 0-0.02 || >0.02-0.08
4
4115 30 >0.08-0.2 || 24116 32 >0.08-0.2 || >0.02-
0.08 2
4117 12 0-0.02 || >0.02-0.08
4
4118 40 >0.2-0.5 || 14119 12 0-0.02 || >0.02-
0.08 4
4143 32 >0.08-0.2 || >0.02-0.08
2
4144 32 >0.08-0.2 || >0.02-0.08
2
4145 23 >0.02-0.08 || >0.08-0.2 34146 21 >0.02-0.08 || >0-0.02 34163 43 >0.2-0.5 || >0.08-0.2 14177 24 >0.02-0.08 || >0.2-0.5 34187 12 0-0.02 || >0.02-
0.08 4
4206 20 >0.02-0.08 || 34207 30 >0.08-0.2 || 24208 20 >0.02-0.08 || 34209 97 4210 20 >0.02-0.08 || 34211 23 >0.02-0.08 || >0.08-0.2 34224 97 4236 12 0-0.02 || >0.02-
0.08 4
4237 97 4238 20 >0.02-0.08 || 34239 34 >0.08-0.2 || >0.2-0.5 24255 12 0-0.02 || >0.02-
0.08 4
4256 12 0-0.02 || >0.02-0.08
4
4257 97 4258 30 >0.08-0.2 || 24278 20 >0.02-0.08 || 34279 43 >0.2-0.5 || >0.08-0.2 14287 30 >0.08-0.2 || 24288 20 >0.02-0.08 || 34322 24 >0.02-0.08 || >0.2-0.5 34351 43 >0.2-0.5 || >0.08-0.2 14370 34 >0.08-0.2 || >0.2-0.5 24423 24 >0.02-0.08 || >0.2-0.5 34557 31 >0.08-0.2 || 0-0.2 24559 43 >0.2-0.5 || >0.08-0.2 1
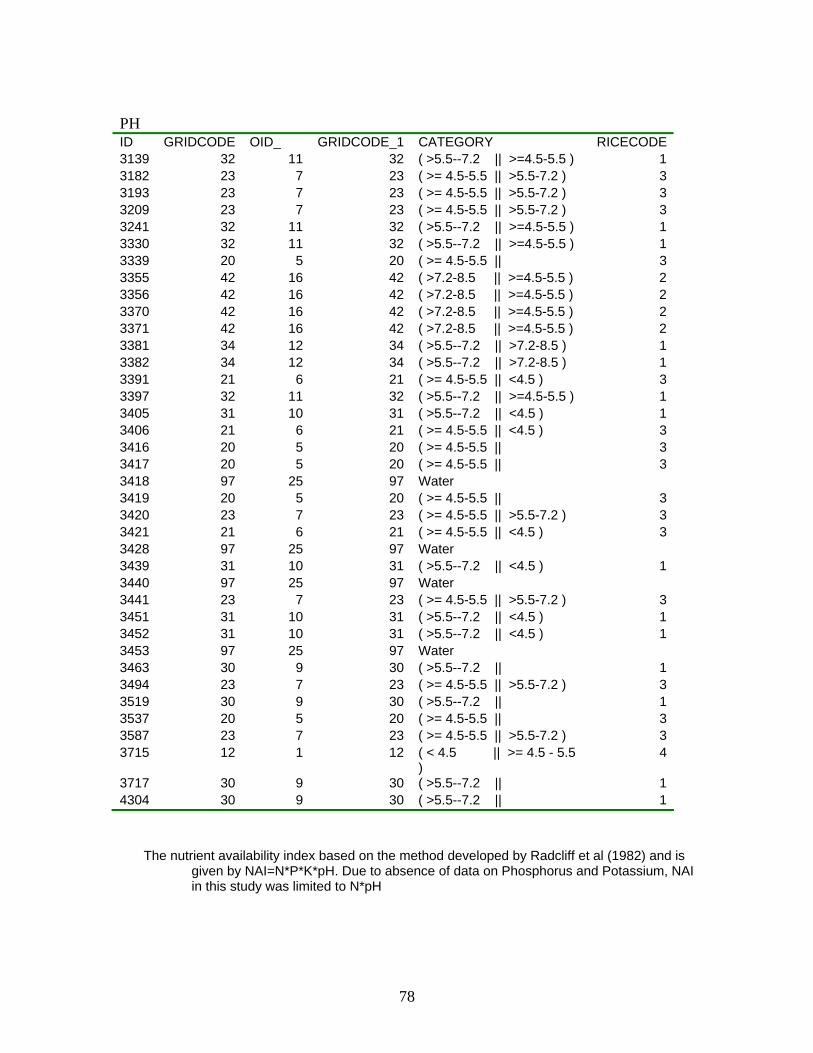
78
PH ID GRIDCODE OID_ GRIDCODE_1 CATEGORY RICECODE3139 32 11 32 ( >5.5--7.2 || >=4.5-5.5 ) 13182 23 7 23 ( >= 4.5-5.5 || >5.5-7.2 ) 33193 23 7 23 ( >= 4.5-5.5 || >5.5-7.2 ) 33209 23 7 23 ( >= 4.5-5.5 || >5.5-7.2 ) 33241 32 11 32 ( >5.5--7.2 || >=4.5-5.5 ) 13330 32 11 32 ( >5.5--7.2 || >=4.5-5.5 ) 13339 20 5 20 ( >= 4.5-5.5 || 33355 42 16 42 ( >7.2-8.5 || >=4.5-5.5 ) 23356 42 16 42 ( >7.2-8.5 || >=4.5-5.5 ) 23370 42 16 42 ( >7.2-8.5 || >=4.5-5.5 ) 23371 42 16 42 ( >7.2-8.5 || >=4.5-5.5 ) 23381 34 12 34 ( >5.5--7.2 || >7.2-8.5 ) 13382 34 12 34 ( >5.5--7.2 || >7.2-8.5 ) 13391 21 6 21 ( >= 4.5-5.5 || <4.5 ) 33397 32 11 32 ( >5.5--7.2 || >=4.5-5.5 ) 13405 31 10 31 ( >5.5--7.2 || <4.5 ) 13406 21 6 21 ( >= 4.5-5.5 || <4.5 ) 33416 20 5 20 ( >= 4.5-5.5 || 33417 20 5 20 ( >= 4.5-5.5 || 33418 97 25 97 Water 3419 20 5 20 ( >= 4.5-5.5 || 33420 23 7 23 ( >= 4.5-5.5 || >5.5-7.2 ) 33421 21 6 21 ( >= 4.5-5.5 || <4.5 ) 33428 97 25 97 Water 3439 31 10 31 ( >5.5--7.2 || <4.5 ) 13440 97 25 97 Water 3441 23 7 23 ( >= 4.5-5.5 || >5.5-7.2 ) 33451 31 10 31 ( >5.5--7.2 || <4.5 ) 13452 31 10 31 ( >5.5--7.2 || <4.5 ) 13453 97 25 97 Water 3463 30 9 30 ( >5.5--7.2 || 13494 23 7 23 ( >= 4.5-5.5 || >5.5-7.2 ) 33519 30 9 30 ( >5.5--7.2 || 13537 20 5 20 ( >= 4.5-5.5 || 33587 23 7 23 ( >= 4.5-5.5 || >5.5-7.2 ) 33715 12 1 12 ( < 4.5 || >= 4.5 - 5.5
) 4
3717 30 9 30 ( >5.5--7.2 || 14304 30 9 30 ( >5.5--7.2 || 1
The nutrient availability index based on the method developed by Radcliff et al (1982) and is given by NAI=N*P*K*pH. Due to absence of data on Phosphorus and Potassium, NAI in this study was limited to N*pH
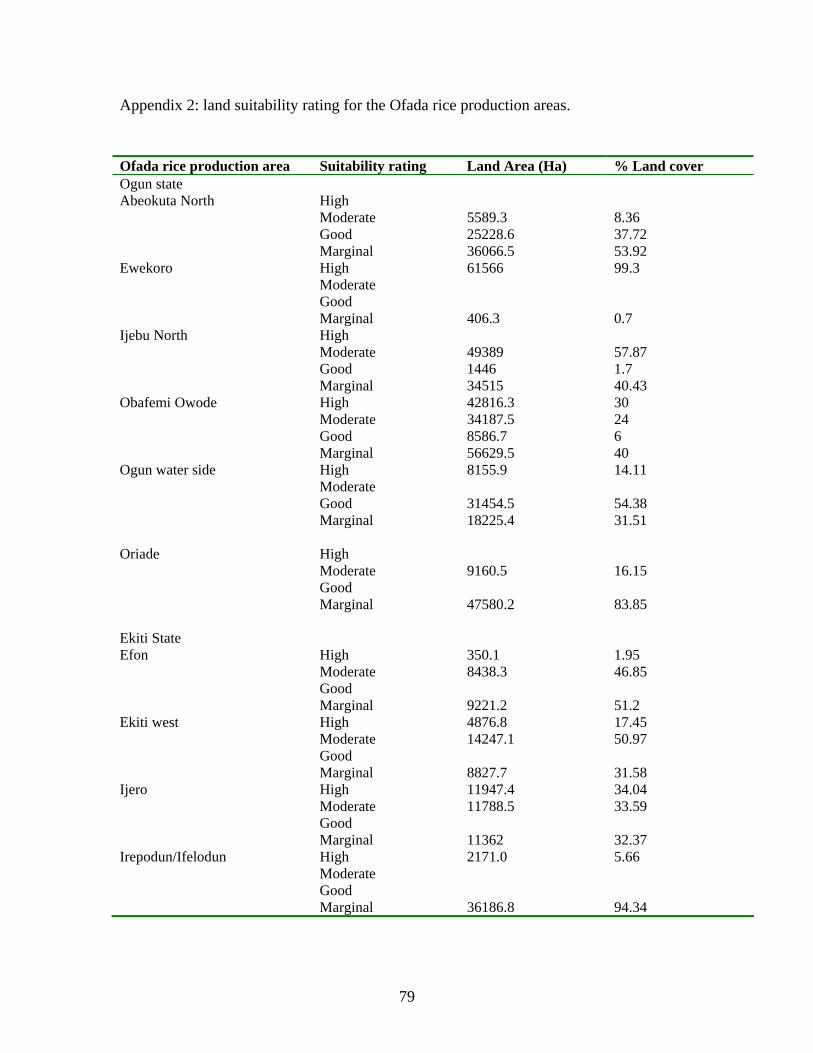
79
Appendix 2: land suitability rating for the Ofada rice production areas.
Ofada rice production area Suitability rating Land Area (Ha) % Land cover Ogun state Abeokuta North High Moderate 5589.3 8.36 Good 25228.6 37.72 Marginal 36066.5 53.92 Ewekoro High 61566 99.3 Moderate Good Marginal 406.3 0.7 Ijebu North High Moderate 49389 57.87 Good 1446 1.7 Marginal 34515 40.43 Obafemi Owode High 42816.3 30 Moderate 34187.5 24 Good 8586.7 6 Marginal 56629.5 40 Ogun water side High 8155.9 14.11 Moderate Good 31454.5 54.38 Marginal 18225.4 31.51 Oriade High Moderate 9160.5 16.15 Good Marginal 47580.2 83.85 Ekiti State Efon High 350.1 1.95 Moderate 8438.3 46.85 Good Marginal 9221.2 51.2 Ekiti west High 4876.8 17.45 Moderate 14247.1 50.97 Good Marginal 8827.7 31.58 Ijero High 11947.4 34.04 Moderate 11788.5 33.59 Good Marginal 11362 32.37 Irepodun/Ifelodun High 2171.0 5.66 Moderate Good Marginal 36186.8 94.34