Embed Size (px)
Citation preview

Does size matter? Investigating the impact of mobile phone screen size on users’ perceived usability,
effectiveness and efficiency. Dimitrios Raptis1, Nikolaos Tselios1,2, Jesper Kjeldskov1, Mikael Skov1 1Aalborg University
Dept. of Computer Science, Selma Lagerlofs Vej 300, 9220, Aalborg, Denmark.
{raptis, jesper, dubois}cs.aau.dk
2University of Patras Dept. of Educational Sciences and Early
Childhood Education, 26500, Rio, Patras, Greece. [email protected]
ABSTRACT Given the wide adoption of smartphones, an interesting debate is taking place regarding their optimal screen size and specifically whether possible portability issues counterbalance the obvious benefits of a larger screen. Moreover, the lack of scientific evidence about the concrete impact of mobile phones’ screen size on usability raises questions both to practitioners and researchers. In this paper, we investigate the impact of a mobile phone’s screen size on users’ effectiveness, efficiency and perceived usability as measured using System Usability Scale (SUS). An experiment was conducted with 60 participants, which interacted with the same information seeking application on three different devices of the same brand that differed on their screen size. A significant effect of screen size on efficiency was derived, leading to an important finding that users who interact with larger than 4.3in screens are more efficient during information seeking tasks.
Author Keywords Mobile devices; perceived usability; effectiveness; efficiency; screen size; attractiveness; brand; SUS; prior experience; desire.
ACM Classification Keywords H.5.m Information Interfaces and Presentation (e.g. HCI): Miscellaneous.
General Terms Experimentation, Measurement
INTRODUCTION Over the recent years mobile phones have been transformed from simple devices used just for calls and text messaging to powerful personal computing artifacts. Nowadays, activities such as web browsing, document processing, social networking, media reproduction and gaming
constitute the typical usages of a mobile phone. Moreover, traditional mobile input paradigms, such as using a reduced set of keys, or a stylus are fading out in favor of touch interaction. Consequently, in relation to interaction, a modern mobile phone is characterized by its screen, a few physical buttons and a casing.
While users interact with their personal mobile phone and use mobile applications they are affected by various parameters such as the attractiveness of the device, the attractiveness of the applications, the brand of the device, their prior experience, etc. Even though there is a significant research effort directed on discovering the effect that all these parameters have on user experience, surprisingly there is a little volume of research in investigating if users are affected by specific mobile device characteristics (for example screen size, position and size of the physical buttons, materials used for the casing, etc.). Such a research goal is of significant importance for the community given the wide range of mobile phones’ characteristics and the fact that we know very little on how they may shape and/or alter the actual user experience with a mobile application.
This paper is an initial step in the process of understanding mobile device characteristics and we chose to focus on the effect of screen size. Towards this end an experiment was designed and conducted to measure the effect of screen size on usability metrics (effectiveness and efficiency) and perceived usability, while interacting with a test application on 3 devices with representative screen sizes. We believe that our results will help designers and practitioners in better understanding how screen size affects their subjects, when they design and evaluate mobile applications.
The rest of the paper is organized as follows: First an overview of the related work is provided, followed by the detailed description of the experimental design. Subsequently, details about the participants, their characteristics, the used materials and the experimental setting are also presented. Then the obtained data are discussed and analyzed with respect to the research goals. Finally, the results and their implications are discussed in comparison with other related studies.
RELATED WORK The focus of this research is to investigate the impact of a mobile device screen size on usability. We studied in our experiment both perceived usability, as it is obtained by evaluation questionnaires, and specific usability metrics (effectiveness, efficiency) by applying the ISO 9241 definition of usability [3].
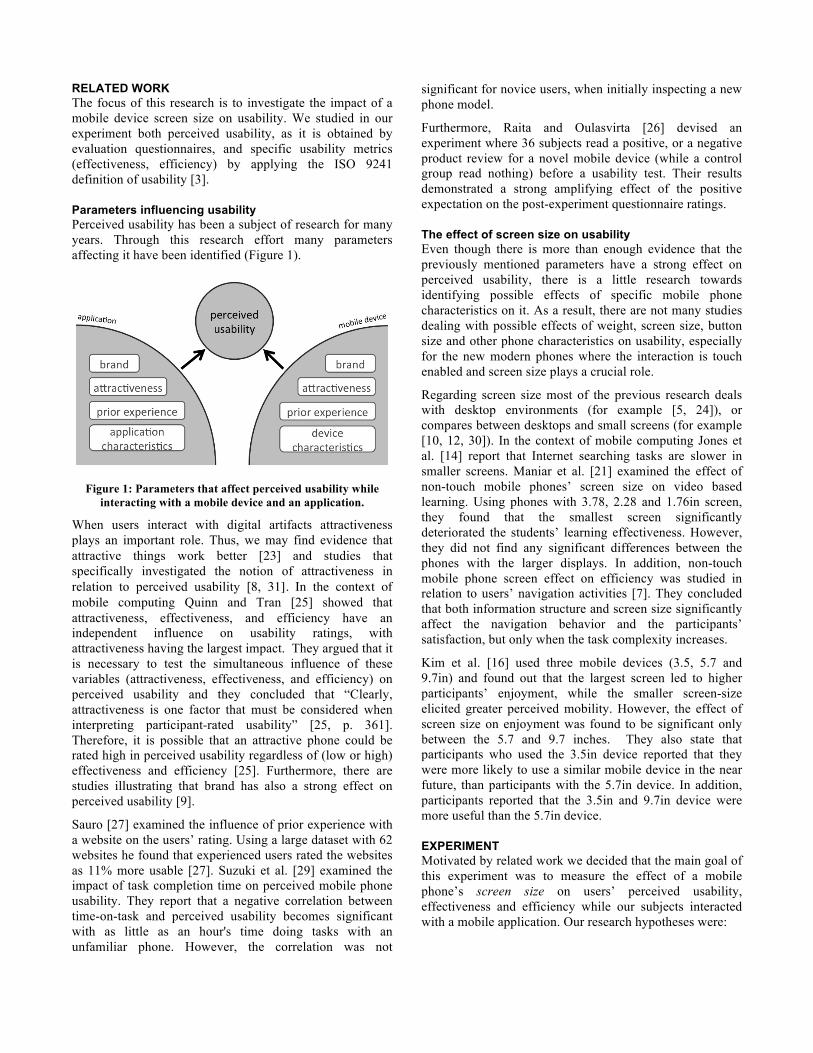
Parameters influencing usability Perceived usability has been a subject of research for many years. Through this research effort many parameters affecting it have been identified (Figure 1).
Figure 1: Parameters that affect perceived usability while interacting with a mobile device and an application.
When users interact with digital artifacts attractiveness plays an important role. Thus, we may find evidence that attractive things work better [23] and studies that specifically investigated the notion of attractiveness in relation to perceived usability [8, 31]. In the context of mobile computing Quinn and Tran [25] showed that attractiveness, effectiveness, and efficiency have an independent influence on usability ratings, with attractiveness having the largest impact. They argued that it is necessary to test the simultaneous influence of these variables (attractiveness, effectiveness, and efficiency) on perceived usability and they concluded that “Clearly, attractiveness is one factor that must be considered when interpreting participant-rated usability” [25, p. 361]. Therefore, it is possible that an attractive phone could be rated high in perceived usability regardless of (low or high) effectiveness and efficiency [25]. Furthermore, there are studies illustrating that brand has also a strong effect on perceived usability [9].
Sauro [27] examined the influence of prior experience with a website on the users’ rating. Using a large dataset with 62 websites he found that experienced users rated the websites as 11% more usable [27]. Suzuki et al. [29] examined the impact of task completion time on perceived mobile phone usability. They report that a negative correlation between time-on-task and perceived usability becomes significant with as little as an hour's time doing tasks with an unfamiliar phone. However, the correlation was not
significant for novice users, when initially inspecting a new phone model.
Furthermore, Raita and Oulasvirta [26] devised an experiment where 36 subjects read a positive, or a negative product review for a novel mobile device (while a control group read nothing) before a usability test. Their results demonstrated a strong amplifying effect of the positive expectation on the post-experiment questionnaire ratings.
The effect of screen size on usability Even though there is more than enough evidence that the previously mentioned parameters have a strong effect on perceived usability, there is a little research towards identifying possible effects of specific mobile phone characteristics on it. As a result, there are not many studies dealing with possible effects of weight, screen size, button size and other phone characteristics on usability, especially for the new modern phones where the interaction is touch enabled and screen size plays a crucial role.
Regarding screen size most of the previous research deals with desktop environments (for example [5, 24]), or compares between desktops and small screens (for example [10, 12, 30]). In the context of mobile computing Jones et al. [14] report that Internet searching tasks are slower in smaller screens. Maniar et al. [21] examined the effect of non-touch mobile phones’ screen size on video based learning. Using phones with 3.78, 2.28 and 1.76in screen, they found that the smallest screen significantly deteriorated the students’ learning effectiveness. However, they did not find any significant differences between the phones with the larger displays. In addition, non-touch mobile phone screen effect on efficiency was studied in relation to users’ navigation activities [7]. They concluded that both information structure and screen size significantly affect the navigation behavior and the participants’ satisfaction, but only when the task complexity increases.
Kim et al. [16] used three mobile devices (3.5, 5.7 and 9.7in) and found out that the largest screen led to higher participants’ enjoyment, while the smaller screen-size elicited greater perceived mobility. However, the effect of screen size on enjoyment was found to be significant only between the 5.7 and 9.7 inches. They also state that participants who used the 3.5in device reported that they were more likely to use a similar mobile device in the near future, than participants with the 5.7in device. In addition, participants reported that the 3.5in and 9.7in device were more useful than the 5.7in device.
EXPERIMENT Motivated by related work we decided that the main goal of this experiment was to measure the effect of a mobile phone’s screen size on users’ perceived usability, effectiveness and efficiency while our subjects interacted with a mobile application. Our research hypotheses were:
• H1: The mobile phone’s screen size will have an effect on participants’ perceived usability (a larger screen will increase the perceived usability ratings).
• H2: The mobile phone’s screen size will have an effect on participants’ task completion times (a larger screen will increase efficiency).
• H3: The mobile phone’s screen size will have an effect on participants’ task completion rates (a larger screen will increase effectiveness).
In order to investigate these hypotheses we adopted a between-groups experimental design [19] where we asked three groups of users to interact with the same application on three different devices and then formulate their view about it (each group interacted with one device).
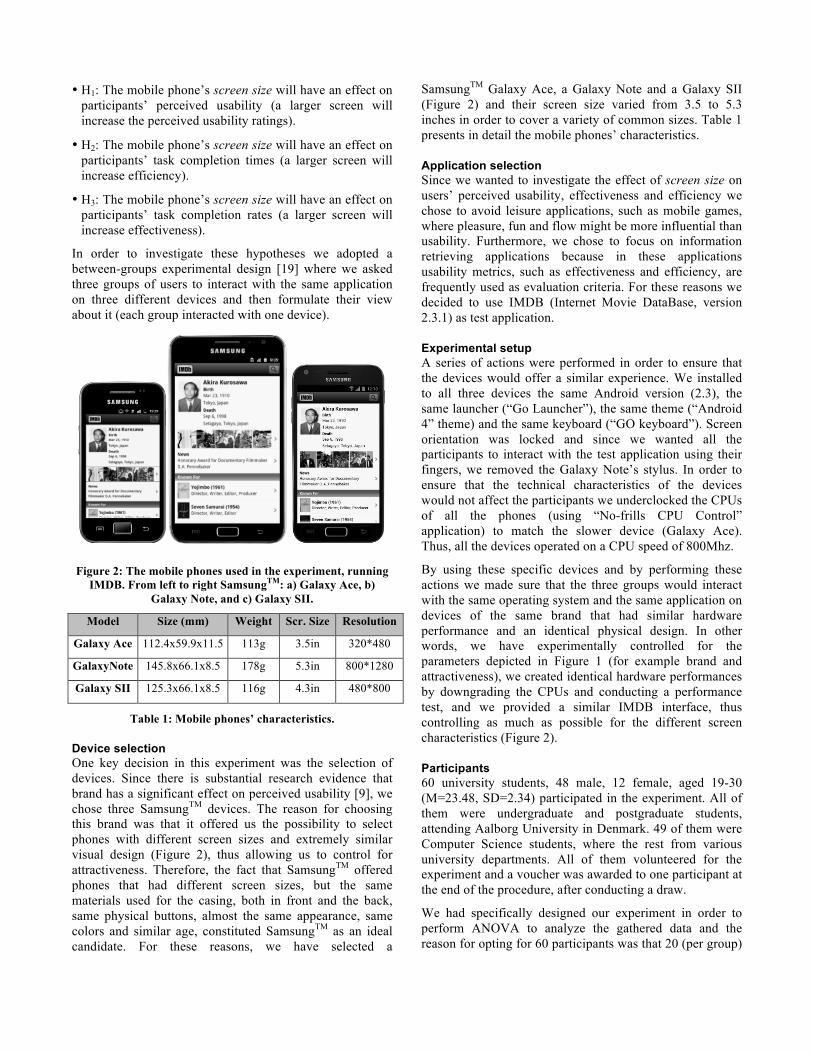
Figure 2: The mobile phones used in the experiment, running IMDB. From left to right SamsungTM: a) Galaxy Ace, b)
Galaxy Note, and c) Galaxy SII.
Model Size (mm) Weight Scr. Size Resolution
Galaxy Ace 112.4x59.9x11.5 113g 3.5in 320*480
GalaxyNote 145.8x66.1x8.5 178g 5.3in 800*1280
Galaxy SII 125.3x66.1x8.5 116g 4.3in 480*800
Table 1: Mobile phones’ characteristics.
Device selection One key decision in this experiment was the selection of devices. Since there is substantial research evidence that brand has a significant effect on perceived usability [9], we chose three SamsungTM devices. The reason for choosing this brand was that it offered us the possibility to select phones with different screen sizes and extremely similar visual design (Figure 2), thus allowing us to control for attractiveness. Therefore, the fact that SamsungTM offered phones that had different screen sizes, but the same materials used for the casing, both in front and the back, same physical buttons, almost the same appearance, same colors and similar age, constituted SamsungTM as an ideal candidate. For these reasons, we have selected a
SamsungTM Galaxy Ace, a Galaxy Note and a Galaxy SII (Figure 2) and their screen size varied from 3.5 to 5.3 inches in order to cover a variety of common sizes. Table 1 presents in detail the mobile phones’ characteristics.
Application selection Since we wanted to investigate the effect of screen size on users’ perceived usability, effectiveness and efficiency we chose to avoid leisure applications, such as mobile games, where pleasure, fun and flow might be more influential than usability. Furthermore, we chose to focus on information retrieving applications because in these applications usability metrics, such as effectiveness and efficiency, are frequently used as evaluation criteria. For these reasons we decided to use IMDB (Internet Movie DataBase, version 2.3.1) as test application.
Experimental setup A series of actions were performed in order to ensure that the devices would offer a similar experience. We installed to all three devices the same Android version (2.3), the same launcher (“Go Launcher”), the same theme (“Android 4” theme) and the same keyboard (“GO keyboard”). Screen orientation was locked and since we wanted all the participants to interact with the test application using their fingers, we removed the Galaxy Note’s stylus. In order to ensure that the technical characteristics of the devices would not affect the participants we underclocked the CPUs of all the phones (using “No-frills CPU Control” application) to match the slower device (Galaxy Ace). Thus, all the devices operated on a CPU speed of 800Mhz.
By using these specific devices and by performing these actions we made sure that the three groups would interact with the same operating system and the same application on devices of the same brand that had similar hardware performance and an identical physical design. In other words, we have experimentally controlled for the parameters depicted in Figure 1 (for example brand and attractiveness), we created identical hardware performances by downgrading the CPUs and conducting a performance test, and we provided a similar IMDB interface, thus controlling as much as possible for the different screen characteristics (Figure 2).
Participants 60 university students, 48 male, 12 female, aged 19-30 (M=23.48, SD=2.34) participated in the experiment. All of them were undergraduate and postgraduate students, attending Aalborg University in Denmark. 49 of them were Computer Science students, where the rest from various university departments. All of them volunteered for the experiment and a voucher was awarded to one participant at the end of the procedure, after conducting a draw.
We had specifically designed our experiment in order to perform ANOVA to analyze the gathered data and the reason for opting for 60 participants was that 20 (per group)
is the minimum number of participants to safely conduct it [28]. Additionally, the fact that we chose participants that belonged to same age group eliminated the possible effect of participants’ age on perceived usability as identified by [2].
When the students expressed online their interest to participate to the experiment they provided us with details about their personal mobile phone. We found out that 8 participants had previous experience with SamsungTM phones and among them, 4 had experience with the Galaxy SII. These participants were distributed among the three groups. The rest were assigned randomly.
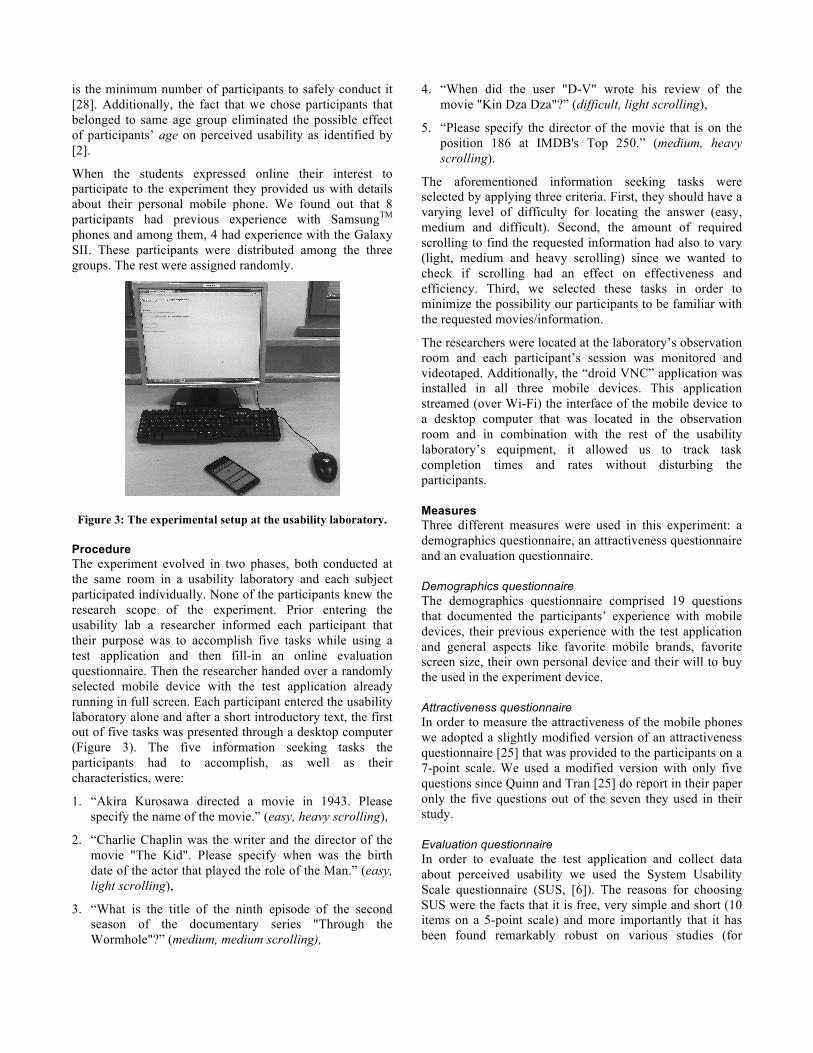
Figure 3: The experimental setup at the usability laboratory.
Procedure The experiment evolved in two phases, both conducted at the same room in a usability laboratory and each subject participated individually. None of the participants knew the research scope of the experiment. Prior entering the usability lab a researcher informed each participant that their purpose was to accomplish five tasks while using a test application and then fill-in an online evaluation questionnaire. Then the researcher handed over a randomly selected mobile device with the test application already running in full screen. Each participant entered the usability laboratory alone and after a short introductory text, the first out of five tasks was presented through a desktop computer (Figure 3). The five information seeking tasks the participants had to accomplish, as well as their characteristics, were:
1. “Akira Kurosawa directed a movie in 1943. Please specify the name of the movie.” (easy, heavy scrolling),
2. “Charlie Chaplin was the writer and the director of the movie "The Kid". Please specify when was the birth date of the actor that played the role of the Man.” (easy, light scrolling),
3. “What is the title of the ninth episode of the second season of the documentary series "Through the Wormhole"?” (medium, medium scrolling),
4. “When did the user "D-V" wrote his review of the movie "Kin Dza Dza"?” (difficult, light scrolling),
5. “Please specify the director of the movie that is on the position 186 at IMDB's Top 250.” (medium, heavy scrolling).
The aforementioned information seeking tasks were selected by applying three criteria. First, they should have a varying level of difficulty for locating the answer (easy, medium and difficult). Second, the amount of required scrolling to find the requested information had also to vary (light, medium and heavy scrolling) since we wanted to check if scrolling had an effect on effectiveness and efficiency. Third, we selected these tasks in order to minimize the possibility our participants to be familiar with the requested movies/information.
The researchers were located at the laboratory’s observation room and each participant’s session was monitored and videotaped. Additionally, the “droid VNC” application was installed in all three mobile devices. This application streamed (over Wi-Fi) the interface of the mobile device to a desktop computer that was located in the observation room and in combination with the rest of the usability laboratory’s equipment, it allowed us to track task completion times and rates without disturbing the participants.
Measures Three different measures were used in this experiment: a demographics questionnaire, an attractiveness questionnaire and an evaluation questionnaire.
Demographics questionnaire The demographics questionnaire comprised 19 questions that documented the participants’ experience with mobile devices, their previous experience with the test application and general aspects like favorite mobile brands, favorite screen size, their own personal device and their will to buy the used in the experiment device.
Attractiveness questionnaire In order to measure the attractiveness of the mobile phones we adopted a slightly modified version of an attractiveness questionnaire [25] that was provided to the participants on a 7-point scale. We used a modified version with only five questions since Quinn and Tran [25] do report in their paper only the five questions out of the seven they used in their study.
Evaluation questionnaire In order to evaluate the test application and collect data about perceived usability we used the System Usability Scale questionnaire (SUS, [6]). The reasons for choosing SUS were the facts that it is free, very simple and short (10 items on a 5-point scale) and more importantly that it has been found remarkably robust on various studies (for
example [1, 2, 4, 20]). The SUS questionnaire was used with the modification proposed by [11] (replacing the word “cumbersome” with “awkward”) and the word “system” was replaced by the word “IMDB”.
DATA ANALYSIS AND RESULTS
Extracted variables The collected data were organized and analyzed using Excel 2010 and SPSS v19.0. The following subsections present the variables that we extracted from the questionnaires and used for the data analysis.
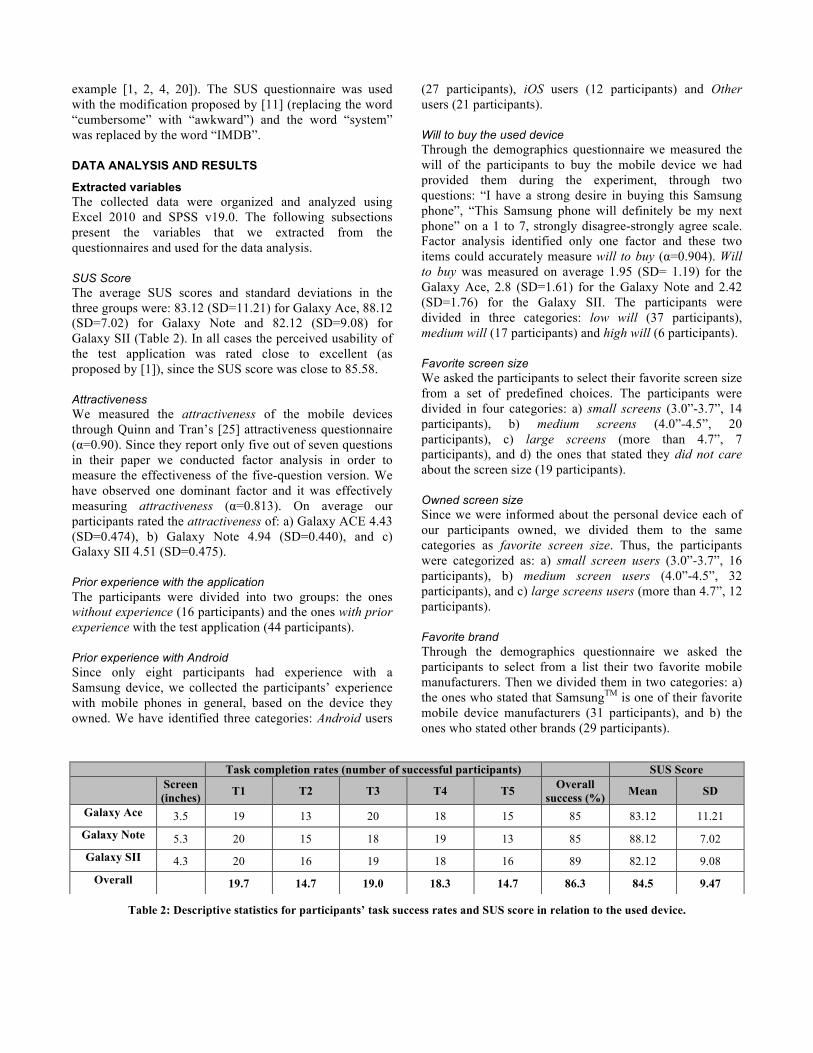
SUS Score The average SUS scores and standard deviations in the three groups were: 83.12 (SD=11.21) for Galaxy Ace, 88.12 (SD=7.02) for Galaxy Note and 82.12 (SD=9.08) for Galaxy SII (Table 2). In all cases the perceived usability of the test application was rated close to excellent (as proposed by [1]), since the SUS score was close to 85.58.
Attractiveness We measured the attractiveness of the mobile devices through Quinn and Tran’s [25] attractiveness questionnaire (α=0.90). Since they report only five out of seven questions in their paper we conducted factor analysis in order to measure the effectiveness of the five-question version. We have observed one dominant factor and it was effectively measuring attractiveness (α=0.813). On average our participants rated the attractiveness of: a) Galaxy ACE 4.43 (SD=0.474), b) Galaxy Note 4.94 (SD=0.440), and c) Galaxy SII 4.51 (SD=0.475).
Prior experience with the application The participants were divided into two groups: the ones without experience (16 participants) and the ones with prior experience with the test application (44 participants).
Prior experience with Android Since only eight participants had experience with a Samsung device, we collected the participants’ experience with mobile phones in general, based on the device they owned. We have identified three categories: Android users
(27 participants), iOS users (12 participants) and Other users (21 participants).
Will to buy the used device Through the demographics questionnaire we measured the will of the participants to buy the mobile device we had provided them during the experiment, through two questions: “I have a strong desire in buying this Samsung phone”, “This Samsung phone will definitely be my next phone” on a 1 to 7, strongly disagree-strongly agree scale. Factor analysis identified only one factor and these two items could accurately measure will to buy (α=0.904). Will to buy was measured on average 1.95 (SD= 1.19) for the Galaxy Ace, 2.8 (SD=1.61) for the Galaxy Note and 2.42 (SD=1.76) for the Galaxy SII. The participants were divided in three categories: low will (37 participants), medium will (17 participants) and high will (6 participants).
Favorite screen size We asked the participants to select their favorite screen size from a set of predefined choices. The participants were divided in four categories: a) small screens (3.0”-3.7”, 14 participants), b) medium screens (4.0”-4.5”, 20 participants), c) large screens (more than 4.7”, 7 participants), and d) the ones that stated they did not care about the screen size (19 participants).
Owned screen size Since we were informed about the personal device each of our participants owned, we divided them to the same categories as favorite screen size. Thus, the participants were categorized as: a) small screen users (3.0”-3.7”, 16 participants), b) medium screen users (4.0”-4.5”, 32 participants), and c) large screens users (more than 4.7”, 12 participants).
Favorite brand Through the demographics questionnaire we asked the participants to select from a list their two favorite mobile manufacturers. Then we divided them in two categories: a) the ones who stated that SamsungTM is one of their favorite mobile device manufacturers (31 participants), and b) the ones who stated other brands (29 participants).
Table 2: Descriptive statistics for participants’ task success rates and SUS score in relation to the used device.
Task completion rates (number of successful participants) SUS Score
Screen (inches) T1 T2 T3 T4 T5 Overall
success (%) Mean SD
Galaxy Ace 3.5 19 13 20 18 15 85 83.12 11.21 Galaxy Note 5.3 20 15 18 19 13 85 88.12 7.02 Galaxy SII 4.3 20 16 19 18 16 89 82.12 9.08
Overall 19.7 14.7 19.0 18.3 14.7 86.3 84.5 9.47
Adjective rating The adjective rating was proposed by [1] as a qualitative replacement for the SUS questionnaire. This variable is measured through one question: “Overall I would rate the user-friendliness of IMDB as:” on a 1 to 7, worst imaginable-best imaginable scale. Overall IMDB was rated on average 5.55 (SD=0.70).
The effect of attractiveness The first step in data analysis was to check if the mobile phones were rated differently in relation to attractiveness, despite the fact that they were intentionally selected to have extremely similar designs. In order to test how the three groups perceived the attractiveness of the devices we conducted one-way between subjects ANOVA having one independent variable (device) and one dependent variable (attractiveness). No significant effects were observed: F(2,57)=1.532, p=.225. The attractiveness of the devices was treated in a similar way among the three groups, a result that verified that our selection of three devices with extremely similar design (Figure 2) was effective. However, attractiveness has been included to our data analysis in order to control for possible interaction effects.
The effect of screen size on perceived usability (SUS) The next step was to investigate the effect of screen size on the SUS score and test our first hypothesis (H1). The variables that were included to this part of data analysis were the screen size (independent variable), the SUS score (dependent variable) and the demographic variables of attractiveness, favorite brand, prior experience with the application, prior experience with Android, will to buy the used device, favorite screen size and owned screen size. We did not include age in our analysis since all our participants belonged to the same age group. A General Lineal Model was applied to analyze the collected data. The first approach was to treat all the demographic variables as covariates (a variable that can be observed along the dependent variable, but is not possible to be experimentally controlled) and perform ANCOVA. Since ANCOVA loses power when many covariates are included, we reduced their number by performing principle component analysis (regression method). Two components were extracted, reducing the number of covariates from six to two. The first component was prior experience and it was extracted from prior experience with Android and prior experience with the application. The second component was extracted from the rest of the demographic variables (attractiveness, will to buy the used device, favorite screen size and favorite brand) and it was named as desire for the device. After checking that homogeneity of variance, homogeneity of regression and normality assumptions were not violated, we have performed ANCOVA with prior experience and desire for the device as covariates. Results showed that there was no main effect of screen size (F(2,55)=.978, p=.383), but there was a significant effect of prior experience (F(1,55)=5.890,
p=.019*) and desire for the device (F(1,55)=4.910, p=.031*), at the p<.05 level. Furthermore, from the answers the 44 participants with prior experience with the test application had provided in four questions (“how often do you use IMDB: in general, to find data about actors, to find data about movies, to rate movies”, 1-5, rarely-often scale) we observed that they had diverse experiences. Therefore we further divided them in two categories: the ones with low experience (23 participants) and the ones with high experience (21 participants). We repeated the same ANCOVA analysis and had similar results as before for screen size (F(2,55)=.855, p=.431), prior experience (F(1,55)=4.391, p=.041*) and desire for the device (F(1,55)=4.635, p=.036*).
one way ANOVA
screen size on attractiveness F(2,57)=1.532 p=.225
ANCOVA
screen size on SUS F(2,55)=.978 p=.383
covariate 1: (prior experience) F(1,55)=5.890 p=.019*
covariate 2: (desire for the device) F(1,55)=4.910 p=.031*
two way ANOVA
screen size * favorite screen size on SUS F(6,48)=3.663 p=.004**
screen size on SUS F(3,48)=5.887 p=.002**
favorite screen size on SUS F(2,48)=6.525 p=.003**
3x5 mixed design
ANOVA
screen size on task completion times F(2.37,57)=10.3 p<.001**
one way ANOVA
screen size on task completion times
(per task)
1) F(2,57)=2.855 p=.066
2) F(2,57)=0.583 p=.562
3) F(2,57)=6.016 p=.004**
4) F(2,57)=0.237 p=.789
5) F(2,57)=4.559 p=.015*
Chi-Square
test
screen size on task completion rates
(per task)
1)χ2(2,N=60)=8.17 p=.98
2)χ2(2,N=60)=3.83 p=.85
3)χ2(2,N=60)=5.94 p=.94
4)χ2(2,N=60)=8.03 p=.98
5)χ2(2,N=60)=3.83 p=.85
Table 3: Data analysis results.
Subsequently, we investigated the possibility the participants’ SUS scores to be influenced by the mobile device they own and/or their favorite screen size. Initially, we performed a Chi-Square test between favorite screen size and owned screen size in order to check if the participants’ selection for their favorite screen size was biased by the device they owned. Our results showed that a statistical significant association between owned screen size and favorite screen size (χ2(6, N=60)=23.154, p=.001**). Then we have performed a two-way ANOVA between
favorite screen size and screen size on SUS score, having always in mind that through this approach we risked to exclude influential interactions from the analysis. Significant effects were observed (F(6, 48) = 3.663, p = .004**). Data analysis showed that favorite screen size had an effect (F(3, 48) = 5.887, p = .002**) and the same was the case with screen size (F(2, 48) = 6.525, p = .003**).
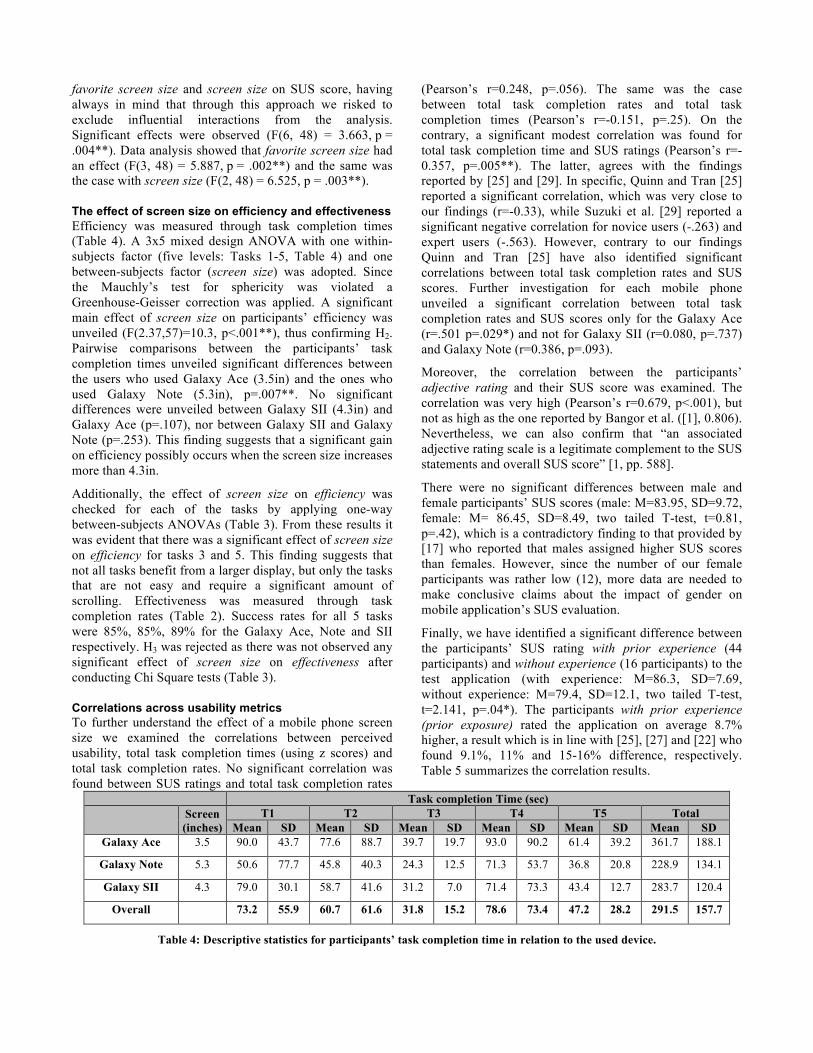
The effect of screen size on efficiency and effectiveness Efficiency was measured through task completion times (Table 4). A 3x5 mixed design ANOVA with one within-subjects factor (five levels: Tasks 1-5, Table 4) and one between-subjects factor (screen size) was adopted. Since the Mauchly’s test for sphericity was violated a Greenhouse-Geisser correction was applied. A significant main effect of screen size on participants’ efficiency was unveiled (F(2.37,57)=10.3, p<.001**), thus confirming H2. Pairwise comparisons between the participants’ task completion times unveiled significant differences between the users who used Galaxy Ace (3.5in) and the ones who used Galaxy Note (5.3in), p=.007**. No significant differences were unveiled between Galaxy SII (4.3in) and Galaxy Ace (p=.107), nor between Galaxy SII and Galaxy Note (p=.253). This finding suggests that a significant gain on efficiency possibly occurs when the screen size increases more than 4.3in.
Additionally, the effect of screen size on efficiency was checked for each of the tasks by applying one-way between-subjects ANOVAs (Table 3). From these results it was evident that there was a significant effect of screen size on efficiency for tasks 3 and 5. This finding suggests that not all tasks benefit from a larger display, but only the tasks that are not easy and require a significant amount of scrolling. Effectiveness was measured through task completion rates (Table 2). Success rates for all 5 tasks were 85%, 85%, 89% for the Galaxy Ace, Note and SII respectively. H3 was rejected as there was not observed any significant effect of screen size on effectiveness after conducting Chi Square tests (Table 3).
Correlations across usability metrics To further understand the effect of a mobile phone screen size we examined the correlations between perceived usability, total task completion times (using z scores) and total task completion rates. No significant correlation was found between SUS ratings and total task completion rates
(Pearson’s r=0.248, p=.056). The same was the case between total task completion rates and total task completion times (Pearson’s r=-0.151, p=.25). On the contrary, a significant modest correlation was found for total task completion time and SUS ratings (Pearson’s r=-0.357, p=.005**). The latter, agrees with the findings reported by [25] and [29]. In specific, Quinn and Tran [25] reported a significant correlation, which was very close to our findings (r=-0.33), while Suzuki et al. [29] reported a significant negative correlation for novice users (-.263) and expert users (-.563). However, contrary to our findings Quinn and Tran [25] have also identified significant correlations between total task completion rates and SUS scores. Further investigation for each mobile phone unveiled a significant correlation between total task completion rates and SUS scores only for the Galaxy Ace (r=.501 p=.029*) and not for Galaxy SII (r=0.080, p=.737) and Galaxy Note (r=0.386, p=.093).
Moreover, the correlation between the participants’ adjective rating and their SUS score was examined. The correlation was very high (Pearson’s r=0.679, p<.001), but not as high as the one reported by Bangor et al. ([1], 0.806). Nevertheless, we can also confirm that “an associated adjective rating scale is a legitimate complement to the SUS statements and overall SUS score” [1, pp. 588].
There were no significant differences between male and female participants’ SUS scores (male: M=83.95, SD=9.72, female: M= 86.45, SD=8.49, two tailed T-test, t=0.81, p=.42), which is a contradictory finding to that provided by [17] who reported that males assigned higher SUS scores than females. However, since the number of our female participants was rather low (12), more data are needed to make conclusive claims about the impact of gender on mobile application’s SUS evaluation.
Finally, we have identified a significant difference between the participants’ SUS rating with prior experience (44 participants) and without experience (16 participants) to the test application (with experience: M=86.3, SD=7.69, without experience: M=79.4, SD=12.1, two tailed T-test, t=2.141, p=.04*). The participants with prior experience (prior exposure) rated the application on average 8.7% higher, a result which is in line with [25], [27] and [22] who found 9.1%, 11% and 15-16% difference, respectively. Table 5 summarizes the correlation results.
Task completion Time (sec)
Screen (inches)
T1 T2 T3 T4 T5 Total Mean SD Mean SD Mean SD Mean SD Mean SD Mean SD
Galaxy Ace 3.5 90.0 43.7 77.6 88.7 39.7 19.7 93.0 90.2 61.4 39.2 361.7 188.1
Galaxy Note 5.3 50.6 77.7 45.8 40.3 24.3 12.5 71.3 53.7 36.8 20.8 228.9 134.1
Galaxy SII 4.3 79.0 30.1 58.7 41.6 31.2 7.0 71.4 73.3 43.4 12.7 283.7 120.4
Overall 73.2 55.9 60.7 61.6 31.8 15.2 78.6 73.4 47.2 28.2 291.5 157.7
Table 4: Descriptive statistics for participants’ task completion time in relation to the used device.
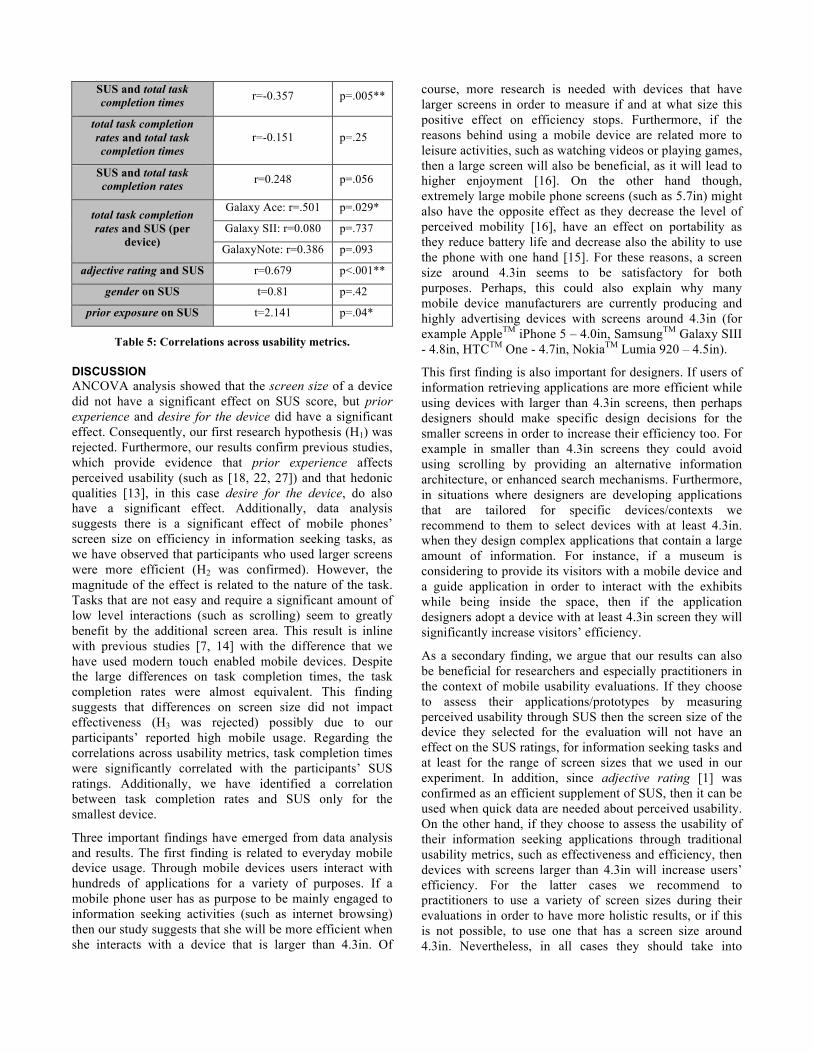
SUS and total task completion times r=-0.357 p=.005**
total task completion rates and total task completion times
r=-0.151 p=.25
SUS and total task completion rates r=0.248 p=.056
total task completion rates and SUS (per
device)
Galaxy Ace: r=.501 p=.029*
Galaxy SII: r=0.080 p=.737
GalaxyNote: r=0.386 p=.093
adjective rating and SUS r=0.679 p<.001**
gender on SUS t=0.81 p=.42
prior exposure on SUS t=2.141 p=.04*
Table 5: Correlations across usability metrics.
DISCUSSION ANCOVA analysis showed that the screen size of a device did not have a significant effect on SUS score, but prior experience and desire for the device did have a significant effect. Consequently, our first research hypothesis (H1) was rejected. Furthermore, our results confirm previous studies, which provide evidence that prior experience affects perceived usability (such as [18, 22, 27]) and that hedonic qualities [13], in this case desire for the device, do also have a significant effect. Additionally, data analysis suggests there is a significant effect of mobile phones’ screen size on efficiency in information seeking tasks, as we have observed that participants who used larger screens were more efficient (H2 was confirmed). However, the magnitude of the effect is related to the nature of the task. Tasks that are not easy and require a significant amount of low level interactions (such as scrolling) seem to greatly benefit by the additional screen area. This result is inline with previous studies [7, 14] with the difference that we have used modern touch enabled mobile devices. Despite the large differences on task completion times, the task completion rates were almost equivalent. This finding suggests that differences on screen size did not impact effectiveness (H3 was rejected) possibly due to our participants’ reported high mobile usage. Regarding the correlations across usability metrics, task completion times were significantly correlated with the participants’ SUS ratings. Additionally, we have identified a correlation between task completion rates and SUS only for the smallest device.
Three important findings have emerged from data analysis and results. The first finding is related to everyday mobile device usage. Through mobile devices users interact with hundreds of applications for a variety of purposes. If a mobile phone user has as purpose to be mainly engaged to information seeking activities (such as internet browsing) then our study suggests that she will be more efficient when she interacts with a device that is larger than 4.3in. Of
course, more research is needed with devices that have larger screens in order to measure if and at what size this positive effect on efficiency stops. Furthermore, if the reasons behind using a mobile device are related more to leisure activities, such as watching videos or playing games, then a large screen will also be beneficial, as it will lead to higher enjoyment [16]. On the other hand though, extremely large mobile phone screens (such as 5.7in) might also have the opposite effect as they decrease the level of perceived mobility [16], have an effect on portability as they reduce battery life and decrease also the ability to use the phone with one hand [15]. For these reasons, a screen size around 4.3in seems to be satisfactory for both purposes. Perhaps, this could also explain why many mobile device manufacturers are currently producing and highly advertising devices with screens around 4.3in (for example AppleTM iPhone 5 – 4.0in, SamsungTM Galaxy SIII - 4.8in, HTCTM One - 4.7in, NokiaTM Lumia 920 – 4.5in).
This first finding is also important for designers. If users of information retrieving applications are more efficient while using devices with larger than 4.3in screens, then perhaps designers should make specific design decisions for the smaller screens in order to increase their efficiency too. For example in smaller than 4.3in screens they could avoid using scrolling by providing an alternative information architecture, or enhanced search mechanisms. Furthermore, in situations where designers are developing applications that are tailored for specific devices/contexts we recommend to them to select devices with at least 4.3in. when they design complex applications that contain a large amount of information. For instance, if a museum is considering to provide its visitors with a mobile device and a guide application in order to interact with the exhibits while being inside the space, then if the application designers adopt a device with at least 4.3in screen they will significantly increase visitors’ efficiency.
As a secondary finding, we argue that our results can also be beneficial for researchers and especially practitioners in the context of mobile usability evaluations. If they choose to assess their applications/prototypes by measuring perceived usability through SUS then the screen size of the device they selected for the evaluation will not have an effect on the SUS ratings, for information seeking tasks and at least for the range of screen sizes that we used in our experiment. In addition, since adjective rating [1] was confirmed as an efficient supplement of SUS, then it can be used when quick data are needed about perceived usability. On the other hand, if they choose to assess the usability of their information seeking applications through traditional usability metrics, such as effectiveness and efficiency, then devices with screens larger than 4.3in will increase users’ efficiency. For the latter cases we recommend to practitioners to use a variety of screen sizes during their evaluations in order to have more holistic results, or if this is not possible, to use one that has a screen size around 4.3in. Nevertheless, in all cases they should take into

consideration the parameters that can influence usability (Figure 1).
Finally, if we focus on the two-way ANOVA results (with its limitations since we excluded many variables from the analysis) we have a third, preliminary finding that favorite screen size or owned screen size has a strong effect on perceived usability, since our participants rated IMDB significantly differently when they used a device that had the same screen size as the one they owned, possibly due to familiarity. Of course, due to our experimental setup, which was not designed to study this phenomenon, this result needs to be further studied in detail, but nevertheless we have preliminary evidence that owned screen size might play a crucial role in our interpretation of mobile perceived usability. If more research is conducted on this issue and our result is verified, then there might be a need for an extension of the Quinn and Tran study [25], which demonstrated that attractiveness affects perceived usability. Due to the fact that Quinn and Tran [25] used a variety of mobile devices, if these devices had a variety of screen sizes then owned screen size might have also affected perceived usability, besides attractiveness.
CONCLUSION In this experiment we have tried either to control for, or take into consideration the parameters that might affect usability (Figure 1) in order to measure the effect of screen size on perceived usability, effectiveness and efficiency. We have experimentally controlled for brand, attractiveness and application and device characteristics and statistically controlled for prior experience and desire for the device. We had three research hypotheses: screen size would have an effect on perceived usability (H1), on efficiency (H2) and effectiveness (H3). H1 and H3 were rejected. On the contrary, there was a significant effect of screen size on efficiency (H2 was confirmed).
Three important findings have emerged. The first one is related to everyday mobile device use. Mobile users that interact with a device with the purpose of mainly performing information seeking tasks, such as Internet browsing, will be more efficient if they use a device with a screen larger than 4.3in. The same is the case for users that want to mainly use their device to play games, or watch media, as the larger screen size will lead to higher enjoyment, but with the counter argument that very large screens decrease the portability of the device and reduce the ability to use the phone with one hand. Therefore a mobile device with a screen size around 4.3in seems to be beneficial for both cases. Our second finding is related to usability evaluations of information retrieving applications. According to our results, researchers that measure perceived usability through SUS will not observe any differences if they evaluate an application on devices with different screen sizes. On the contrary, researchers that assess usability through usability metrics, such as
effectiveness and efficiency will observe that larger screens will lead to higher efficiency.
Our findings do show that screen size matters. It matters for the typical everyday mobile users, since it can have an effect on their efficiency in many of their everyday information seeking activities and it matters also for practitioners and researchers as it can influence their design decisions, as well as, the way they conduct mobile usability evaluations.
As a future work we plan to continue at the same direction and study the effect of screen size on a more expanded set of tasks, such as map navigation, in order to cover more of the common tasks that people do with their devices. We would like also to use devices with larger screens in order to measure if and when the identified positive effect on efficiency stops. Additionally, we plan to investigate in detail our third preliminary finding that the participants of a mobile usability evaluation might be influenced on their SUS scores when they are asked to evaluate an application using a mobile device that has the same screen size as the one they own. Finally, another direction could be the study of the screen size effect over time, as the familiarity with a device and an application increases.
ACKNOWLEDGMENTS We would like to thank all the participants in this experiment and Kasper Hornbæk for his valuable comments. The research behind this paper was partly financed by the Danish Research Councils (grand number 09-065143).
REFERENCES 1. Bangor, A., Kortum, P., and Miller, J. An empirical
evaluation of the system usability scale. International Journal of Human-Computer Interaction, 24, 6 (2008), 574–594.
2. Bangor, A., Kortum, P., and Miller, J. Determining What Individual SUS Scores Mean: Adding an Adjective Rating Scale. Journal of Usability Studies, 4, 3 (2009), 114-123.
3. Bevan, N. International Standards for Usability should be more widely used. Journal of Usability Studies, 4, 3 (2009), 106-113.
4. Borsci, S., Federici, S., and Lauriola, M. On the dimensionality of the System Usability Scale: A test of alternative measurement models. Cognitive processing, 10, 3 (2009), 193-197.
5. Bridgeman, B., Lennon, M.L., and Jackenthal, A. Effects of Screen Size, Screen Resolution, and Display Rate on Computer-Based Test Performance. Applied Measurement in Education, 16, 3 (2003), 191-205.
6. Brooke, J. SUS – A quick and dirty usability scale. In P.W. Jordan, B. Thomas, B.A. Weerdmeester, and I.L.
McClelland (eds.), Usability evaluation in industry. Taylor and Francis (1996), London, UK, 189-194.
7. Chae, M., and Kim, J. Do size and structure matter to mobile users? An empirical study of the effects of screen size, information structure, and task complexity on user activities with standard web phones. Behaviour and Information Technology, 23, 3 (2004), 165-181.
8. Chawda, B., Craft, B., Cairns, P., Rüger, S., and Heech, D. Do attractive things work better? An exploration of search tool visualizations. In Proc. HCI 2005, 2 (2005), 46-51.
9. De Angeli, A., Hartmann, J. and Sutcliffe, A. The effect of brand on the evaluation of websites. In Proc. Interact 2009, Part II (2009), 638 – 651.
10. Findlater, L., and McGrenere, J. Impact of screen size on performance, awareness, and user satisfaction with adaptive graphical user interfaces. In Proc. CHI 2008, ACM Press (2008), 1247-1256.
11. Finstad, K. The System Usability Scale and Non-Native English Speakers. Journal of Usability Studies, 4, 1 (2006), 185-188.
12. Grabea, M.E., Lombard, M., Reich, R.D., Bracken, C.C., and Ditton, T.B. The role of screen size in viewer experiences of media content. Visual Communication Quarterly, 6, 2 (1999), 4-9.
13. Hassenzahl, M. The Interplay of Beauty, Goodness, and Usability in Interactive Products. Human-Computer Interaction, 19, 4 (2004), 319–349.
14. Jones, M., Buchanan, G., and Thimbleby, H. Improving web search on small screen devices. Interacting with Computers 15, 4 (2003), 479-495.
15. Karlson, A.K., Bederson, B.B., and Contreras-Vidal, J.L. Understanding One-Handed Use of Mobile Devices. Handbook of Research on User Interface Design and Evaluation for Mobile Technology, (2002), 86-101.
16. Kim, K.J., Sundar, S.S., and Park, E. The effect of Screen-Size and Communication Modality on Psychology of Mobile Device Users. In Proc. CHI 2011, ACM Press (2011), 1207-1212.
17. Kobsa, A., Sonawalla, R., Tsudik, G., Uzun, E., and Wang, Y. Serial hook-ups: A comparative usability study of secure device pairing methods. In Proc. SOUPS ‘09: 5th Symposium on Usable Privacy and Security, ACM Press (2009), Article No10.
18. Langdon, P.M., Lewis, T., and Clarkson, P.J. The effects of prior experience on the use of consumer products. Universal Access in the Information Society, 6, 2 (2007), 179-191.
19. Lazar, J., Feng, J.H., and Hochheiser, H. Research methods in human-computer interaction. Wiley & Sons, West Sussex, UK, 2010.
20. Lewis, J.R., and Sauro, J. The Factor Structure of the System Usability Scale. In Proc. HCII 2009, Springer-Verlag (2009), 94-103.
21. Maniar, N., Bennett, E., Hand, S., and Allan, G. The effect of mobile phone screen size on video based learning. Journal of Software, 3, 4 (2008), 51-61.
22. McLellan, S., Muddimer, A., and Peres S.C. The effect of experience on System Usability Scale Ratings. Journal of Usability Studies, 7, 2 (2012), 56-67.
23. Norman, D.A. Emotional design: Why we love (or hate) everyday things. Basic Books, New York, USA, 2004.
24. Polys, N.F., Kim, S., and Bowman, D.A. Effects of information layout, screen size, and field of view on user performance in information-rich virtual environments. In Proc. VRST 2005, ACM Press (2005), 46-55.
25. Quinn, J.M., and Tran, T.Q. Attractive phones don't have to work better: independent effects of attractiveness, effectiveness, and efficiency on perceived usability. In Proc. CHI 2010, ACM Press (2010), 353-362.
26. Raita, E., and Oulasvirta, A. Too good to be bad: Favorable product expectations boost subjective usability ratings. Interacting with Computers, 23, 4 (2010), 363-371.
27. Sauro, J. Does Prior Experience Affect Perceptions Of Usability? (2011) Available online: http://www.measuringusability.com/blog/prior-exposure.php
28. Simmons, J.P., Nelson, L.D., and Simonsohn, U. False-Positive Psychology: Undisclosed Flexibility in Data Collection and Analysis Allows Presenting Anything as Significant. Psychological Science, 22, 11 (2011), 1359 -1366.
29. Suzuki, S., Bellotti, V., Yee, N., John, B.E., Nakao, Y., Asahi, T., and Fukuzumi, S. Variation in importance of time-on-task with familiarity with mobile phone models. In Proc. CHI 2011, ACM Press (2011), 2551-2554.
30. Sweeney, S., and Crestani, F. Effective search results summary size and device screen size: Is there a relationship? Information Processing and Management, 42, 4 (2006), 1056-1074.
31. Tractinsky, N., Katz, A.S., and Ikar, D. What is beautiful is usable. Interacting with Computers, 13, 2 (2000), 127-145.


![Does size matter? Investigating the impact of mobile phone ...people.cs.aau.dk/~jesper/pdf/conferences/Kjeldskov-C69.pdf · [10, 12, 30]). In the context of mobile computing Jones](https://img.pdfslide.tips/doc/110x75/5ff5d2a1ec55582c9378a47a/does-size-matter-investigating-the-impact-of-mobile-phone-jesperpdfconferenceskjeldskov-c69pdf.jpg)