Embed Size (px)
Citation preview
Dual Role of Superoxide Dismutase 2 Induced in ActivatedMicrogliaOXIDATIVE STRESS TOLERANCE AND CONVERGENCE OF INFLAMMATORY RESPONSES*
Received for publication, April 14, 2015, and in revised form, July 28, 2015 Published, JBC Papers in Press, July 31, 2015, DOI 10.1074/jbc.M115.659151
Yasuhiro Ishihara‡1, Takuya Takemoto‡, Kouichi Itoh§, Atsuhiko Ishida‡, and Takeshi Yamazaki‡
From the ‡Laboratory of Molecular Brain Science, Graduate School of Integrated Arts and Sciences, Hiroshima University, Higashi-Hiroshima 739-8521, Japan and the §Laboratory for Brain Science, Kagawa School of Pharmaceutical Sciences, Tokushima BunriUniversity, Kagawa, 769-2193, Japan
Background: The redox state can affect the proinflammatory responses of microglia.Results: Superoxide dismutase 2 (SOD2) knockdown in activated microglia increased the production of reactive oxygen species(ROS) as well as inflammatory cytokines.Conclusion: SOD2 negatively regulates the inflammatory cytokine expression via ROS elimination.Significance: Our findings demonstrate a novel mechanism regulating microglial proinflammatory responses via oxidativestress.
Microglia are activated quickly in response to external patho-gens or cell debris and clear these substances via the inflamma-tory response. However, excessive activation of microglia can beharmful to host cells due to the increased production of reactiveoxygen species and proinflammatory cytokines. Superoxide dis-mutase 2 (SOD2) is reportedly induced under various inflamma-tory conditions in the central nervous system. We herein dem-onstrated that activated microglia strongly express SOD2 andexamined the role of SOD2, focusing on regulation of the micro-glial activity and the susceptibility of microglia to oxidativestress. When rat primary microglia were treated with LPS,poly(I:C), peptidoglycan, or CpG oligodeoxynucleotide, respec-tively, the mRNA and protein levels of SOD2 largely increased.However, an increased expression of SOD2 was not detected inthe primary neurons or astrocytes, indicating that SOD2 is spe-cifically induced in microglia under inflammatory conditions.The activated microglia showed high tolerance to oxidativestress, whereas SOD2 knockdown conferred vulnerability tooxidative stress. Interestingly, the production of proinflamma-tory cytokines was increased in the activated microglia treatedwith SOD2 siRNA compared with that observed in the controlsiRNA-treated cells. Pretreatment with NADPH oxidase inhib-itors, diphenylene iodonium and apocynin, decreased in notonly reactive oxygen species generation but also the proinflam-matory cytokine expression. Notably, SOD2 knockdown largelypotentiated the nuclear factor �B activity in the activated micro-glia. Taken together, increased SOD2 conferred tolerance tooxidative stress in the microglia and decreased proinflamma-
tory cytokine production by attenuating the nuclear factor �Bactivity. Therefore, SOD2 might regulate neuroinflammation bycontrolling the microglial activities.
Microglia constitute the primary immune cells of the centralnervous system (CNS) and are activated quickly in response toexternal pathogens or cell debris, after which they act by releas-ing inflammatory factors and/or engulfing foreign bodies tomediate the inflammatory response. However, excessive activa-tion of microglia may be harmful to host cells; for example,microglia can promote the development of various neuronaldiseases by producing large amounts of inflammatory mole-cules, such as tumor necrosis factor-� (TNF�), interleukin-1�(IL-1�), and reactive oxygen species (ROS).2 Indeed, microgliawith abnormal activity reportedly induce neuroinflammationand are implicated in the pathogenesis of Parkinson disease,Alzheimer disease, brain ischemia-reperfusion injury, trauma,epilepsy, depression, and schizophrenia (1–5). Therefore,understanding the mechanisms that control the microglialactivity is critical, not only for comprehending the physiology ofmicroglia but also for developing new therapeutic approachesto treating neuroinflammation and/or neurodegenerativediseases.
The main source of ROS in microglia is NADPH oxidase(6). NADPH oxidase is a multisubunit enzyme complex thattransfers electrons to molecular oxygen from NADPH or, toa lesser extent, NADH (7), resulting in the formation ofsuperoxide anions as the primary product. Earlier investiga-tions have demonstrated the relevant role of NADPH oxi-dase in the acute inflammatory response induced by neutro-phils, with evidence showing its participation in respiratory
* This work was supported in part by KAKENHI Grants 26740024, 30291149,and 22310041 from the Ministry of Education, Culture, Sports, Science, andTechnology of Japan (to Y. I., K. I., and T. Y.); a grant from the Fujii Founda-tion (to Y. I.); and a grant from the Hiroshima University Education andResearch Support Foundation (to Y. I.). The authors declare that they haveno conflicts of interest with the contents of this article.
1 To whom correspondence should be addressed: Laboratory of MolecularBrain Science, Graduate School of Integrated Arts and Sciences, Hiro-shima University, 1-7-1, Kagamiyama, Higashi-Hiroshima, Hiroshima739-8521, Japan. Tel.: 81-82-424-6500; Fax: 81-82-424-0759; E-mail:[email protected].
2 The abbreviations used are: ROS, reactive oxygen species; AP-1, activatorprotein-1; DHE, dihydroethidium; DPI, diphenylene iodonium; MAP2,microtubule-associated protein 2; MCP-1, monocyte chemotactic pro-tein-1; NF-�B, nuclear factor �B; PGN, peptidoglycan(s); SOD2, superoxidedismutase 2; TLR, toll-like receptor; CAPE, caffeic acid phenylethyl ester;ANOVA, analysis of variance.
crossmarkTHE JOURNAL OF BIOLOGICAL CHEMISTRY VOL. 290, NO. 37, pp. 22805–22817, September 11, 2015
© 2015 by The American Society for Biochemistry and Molecular Biology, Inc. Published in the U.S.A.
SEPTEMBER 11, 2015 • VOLUME 290 • NUMBER 37 JOURNAL OF BIOLOGICAL CHEMISTRY 22805
at HIR
OSH
IMA
UN
IVE
RSIT
Y on Septem
ber 14, 2015http://w
ww
.jbc.org/D
ownloaded from
bursts killing pathogens (8, 9). Mitochondria are anothersource of ROS inside activated microglia. Copper chloridehas been shown to stimulate mitochondrial superoxide pro-duction in murine BV-2 microglial cells (10). Lipopolysac-charide (LPS), an endotoxin found in the outer membrane ofGram-negative bacteria, also elicits mitochondrial superox-ide production, which is regulated by the mitochondrialchaperone glucose-regulated protein 75 (Grp75/mortalin)(11). Naik and Dixit (12) suggested that alterations in theredox environment of the plasma membrane could causemitochondrial ROS formation. Therefore, ROS derived fromNADPH oxidase are closely linked to mitochondrial ROSproduction.
Proinflammatory cytokines and chemokines are transcrip-tionally activated by several inflammatory transcription factors,including activator protein-1 (AP-1) and nuclear factor �B (NF-�B), that act downstream of pattern-recognition receptors,such as Toll-like receptors (TLRs) in microglia. Growing evi-dence has shown that the ROS generated within microglia canincrease the expression of proinflammatory mediators, sug-gesting that ROS are a modulator of microglial activation.Indeed, LPS, interferon �, and amyloid �(1– 42) stimulate ROSproduction by NADPH oxidase, especially NOX1, NOX2, andNOX4, and increases in ROS subsequently induce the expres-sion of several proinflammatory molecules, such as TNF�,IL-1�, inducible nitric-oxide synthase, prostaglandin E2, andmonocyte chemotactic protein-1 (MCP-1) (13–18). Further-more, the antioxidant molecule �-tocopherol has been re-ported to decrease the levels of proinflammatory and adhesionmolecules and elicit microglial ramification by scavenging ROS(19 –22). Therefore, the redox balance is thought to regulate aseries of neuroinflammatory processes mediated by microglia.
Superoxide dismutase (SOD) is a major antioxidant enzymein aerobic organisms and dismutates superoxide anions to formhydrogen peroxide and molecular oxygen. SOD1 (Cu/Zn-SOD)is present in the cytoplasm, nucleus, and peroxisomes of allmammalian cells, where it scavenges superoxide. SOD2 (Mn-SOD) is localized within mitochondria and efficiently elimi-nates the superoxide generated from molecular oxygen in therespiratory chain. SOD2 is reportedly induced in the CNSunder inflammatory conditions. Notably, the intraventricularinjection of LPS has been shown to increase the SOD2 expres-sion in the whole brains of rats (23), and treatment of mesen-cephalic cultures with LPS has been demonstrated to elicitSOD2 expression, probably in astrocytes (24). Moreover, thereare a few reports in which mouse primary microglia or themurine microglial cell line, BV-2, showed an increased expres-sion of SOD2 after treatment with LPS (25, 26), and inducibleSOD2 is thought to attenuate oxidative injury (25, 27). How-ever, if the redox environment regulates microglial inflamma-tory processes, SOD2 might also modulate the microglial activ-ity. In this study, we demonstrated that activated microgliastrongly express SOD2. We then examined the role of theSOD2 induced in microglia, focusing on the sensitivity of thesecells to oxidative stress as well as regulation of the microglialactivity.
Experimental Procedures
Materials—LPS from Escherichia coli 026:B6, peptidoglycan(PGN), SP600125, acetyl cytochrome c, xanthine oxidase, anddiphenylene iodonium (DPI) were obtained from Sigma-Al-drich. U0126 and hydrogen peroxide were purchased fromWako Pure Chemical Industries, Ltd. (Osaka, Japan). Poly(I:C)was obtained from Tocris (Minneapolis, MN). Caffeic acid phe-nylethyl ester (CAPE) was purchased from Cayman Chemical(Ann Arbor, MI). Dihydroethidium (DHE) was purchased fromMolecular Probes, Inc. (Eugene, OR). Apocynin was purchasedfrom Nacalai Tesque (Kyoto, Japan). Xanthine was obtainedfrom Merck Millipore. Single-stranded DNA molecules con-taining unmethylated CpG dinucleotides (CpG DNA) weresynthesized by Eurofins Genomics (Huntsville, AL). WP9QYwas purchased from AnaSpec, Inc. (Fremont, CA). IL-1RA wasobtained from Bioworld Technology (St. Louis Park, MN). Allother chemicals were obtained from Wako Pure ChemicalIndustries or Sigma-Aldrich and were of reagent grade.
Animals—All animal procedures were performed in accord-ance with the Fundamental Guidelines for Proper Conduct ofAnimal Experiments and Related Activities in AcademicResearch Institutions under the jurisdiction of the Ministry ofEducation, Culture, Sports, Science, and Technology (Tokyo,Japan) and the Animal Care and Use Committee of HiroshimaUniversity (Hiroshima, Japan). Pregnant Wistar rats and maleICR mice were obtained from Kyudo (Kumamoto, Japan) andmaintained in a temperature-controlled animal facility with a12-h light/dark cycle.
Isolation and Culture of Rat Primary Microglia—Cultures ofprimary microglia were prepared from 1–3-day-old Wistarrats, according to our previous report (28). Briefly, the forebrainwas dissociated, and the cells were plated in a poly-L-lysine-coated plastic culture flask with tissue culture medium, whichconsisted of Dulbecco’s modified Eagle’s medium (DMEM)supplemented with 10% fetal bovine serum (FBS) and 5 �g/mlinsulin. After 9 –12 days, microglia were harvested by shakingthe flask and seeded at a density of 1 � 105 cells/cm2. Theculture medium was changed to remove non-adherent cells 30min after seeding. The cultures of isolated microglia were uni-formly immunopositive for CD11b and contained �95%microglial cells.
Total RNA Extraction and Real-time PCR—Determination ofthe mRNA levels was performed according to our previousreport (29). The primer sequences are shown in Table 1. Theamount of mRNA was normalized to that of glyceraldehyde-3-phosphate dehydrogenase (GAPDH), and the values for thetreated samples were divided by those for the untreated sam-ples to calculate the relative mRNA levels.
Immunoblotting—Microglia were collected and lysed withradioimmune precipitation assay buffer (25 mM Tris-HCl, pH7.6, 150 mM NaCl, 1% Nonidet P-40, 1% sodium deoxycholate,and 0.1% SDS). Equal amounts of protein were loaded and sep-arated via SDS-PAGE using 10 or 12% (w/v) polyacrylamidegels and then transferred onto polyvinylidene difluoride mem-branes. The blocked membranes were incubated with the fol-lowing primary antibodies: anti-SOD2 (ADI-SOD-111 rabbit,Enzo Life Sciences, Farmingdale, NY) and anti-�-tubulin
Regulation of Microglial Proinflammatory Responses by SOD2
22806 JOURNAL OF BIOLOGICAL CHEMISTRY VOLUME 290 • NUMBER 37 • SEPTEMBER 11, 2015
at HIR
OSH
IMA
UN
IVE
RSIT
Y on Septem
ber 14, 2015http://w
ww
.jbc.org/D
ownloaded from

(T5168 mouse, Sigma-Aldrich). Finally, the membranes wereincubated in solutions of peroxide-conjugated secondary anti-bodies (Thermo Fisher Scientific) and then visualized usingperoxide substrates (SuperSignal West Femto, Thermo FisherScientific). The band intensity was quantified using the ImageJsoftware program (National Institutes of Health, Bethesda,MD).
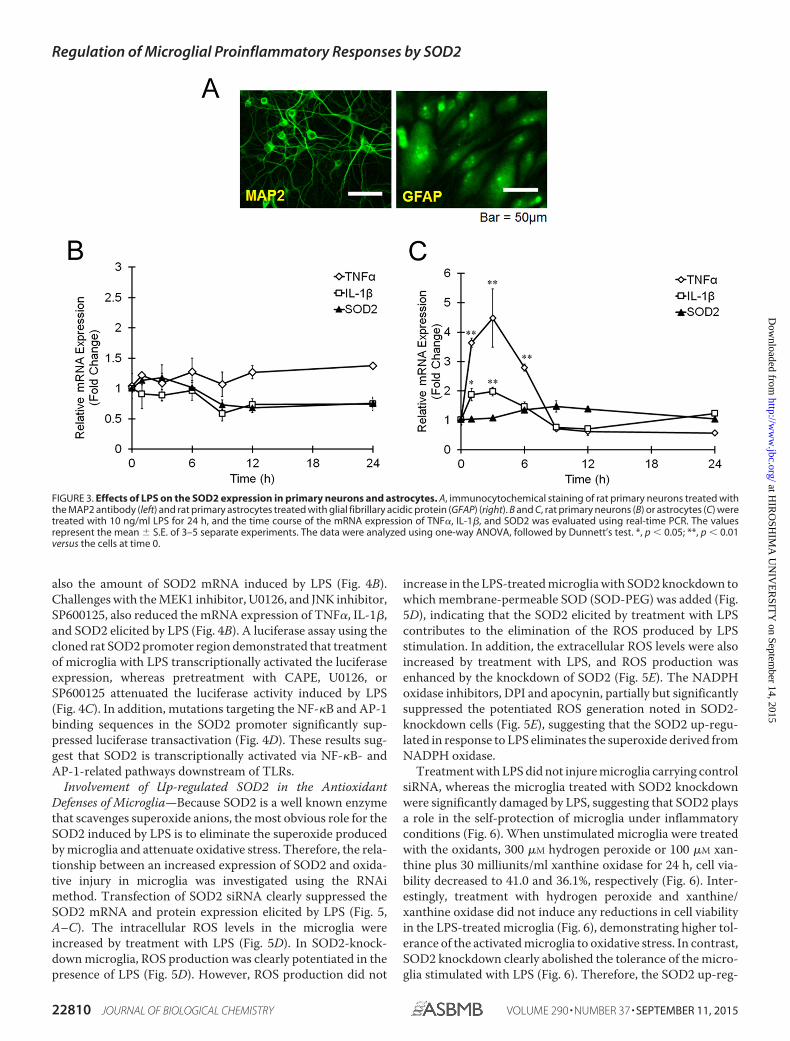
Culture of Rat Primary Cortical Neurons—Rat primary cor-tical neurons were prepared from Wistar rats on the 17th day ofgestation, as reported previously with minor modifications(30). The cortex was separated, and the meninges wereremoved. The tissues were cut into small pieces and then dis-sociated using a papain dissociation system (Worthington).The resulting cell suspension was filtered through a cell strainer(40 �m, Falcon) and plated on polyethyleneimine-coateddishes at a density of 5 � 105 cells/ml with Neurobasal mediumand B27 supplement (Gibco). After 2 days of culture, cytosine�-D-arabinofuranoside was added to inhibit glial proliferation(final concentration, 1 �M), and the medium was changed com-pletely after 2 days to remove the cytosine �-D-arabinofurano-side. The purity of the neurons was assayed using microtubule-associated protein 2 (MAP2) staining, and �95% of cells in theculture showed MAP2 immunoreactivity (Fig. 3A).
Culture of Rat Primary Cortical Astrocytes—Cultures of pri-mary astrocytes were prepared from the cerebral cortex of 1–2-day-old male Wister rats (31). The cerebral hemispheres wereexcised, and the meninges were removed. The cerebral cortexwas cut into small pieces and treated with 2.5% trypsin and 0.5%DNase I for 20 min at 37 °C. The cells then were plated at adensity of 8 � 105 cells/well in 6-well plates coated with poly-L-lysine using DMEM containing 10% FBS. The medium waschanged every 2 days after shaking the plates at 250 rpm toremove other glial cells. Finally, the purity of the astrocyte-enriched cultures was confirmed by staining with antibodiesagainst the astrocyte-specific marker, glial fibrillary acidic pro-tein, and �95% of the cultured astrocytes showed immunore-activity to glial fibrillary acidic protein (Fig. 3A).
RNA Interference—SOD2 siRNAs included three selectedsiRNA constructs against rat SOD2, provided by the InvitrogenStealth Select RNAi library (Invitrogen). The catalogue num-bers of the constructs are RSS302728, RSS302727, andRSS302729. A mixture of two control siRNAs (12935-300and 12935-200, Invitrogen) was used as a control. SOD2 siRNAand control siRNA were transfected into primary microglialcells using Lipofectamine 2000 reagent (Invitrogen), as recom-
mended by the manufacturer. The cells were used in furtherexperiments 24 h after transfection.
Measurement of the ROS Levels—ROS generated inside themicroglia were detected with DHE, a fluorescent dye, accordingto our previous method, with slight modifications (32). Cellswere treated with 10 �M DHE for 10 min in a humidified CO2incubator at 37 °C. Fluorescent images were obtained using aBZ-9000 inverted fluorescent microscope (Keyence, Osaka,Japan) at 540 � 25-nm excitation, with a 605 � 55-nm bandpass filter.
The amount of superoxide anion produced by the microgliawas quantified using acetylated cytochrome c (33). Briefly, 60�M acetylated cytochrome c was added to the culture and incu-bated for another 5 min in the presence of 100 �M diethyldi-thiocarbamate and 100 units/ml of catalase. The amount ofreduced acetylated cytochrome c was determined based on thedifference in absorbance between 550 and 557 nm. The totalamount of superoxide anions in the culture medium was calcu-lated using the absorption coefficient of reduced acetylatedcytochrome c (�550 –557 � 21.0 mM�1 cm�1).
Measurement of Cell Viability—The degree of cell viabilitywas determined by comparing the percentage of the lactate de-hydrogenase activity in the medium and cell lysates, accordingto our previous report (33).
Cloning and Site-directed Mutagenesis of the Rat SOD2 Pro-moter Region—Rat genomic DNA was extracted from rat wholebrains using the DNeasy blood and tissue kit (Qiagen, Valencia,CA). The SOD2 promoter region (1,267 bp) was amplified withPlatinum Taq DNA polymerase high fidelity (Invitrogen; prim-ers: 5�-CAGGAACAGCCACTACAGTAT-3� (forward) and5�-ACCGCTGCTCTCCTCAGAA-3� (reverse)) and ligatedinto pGL4.24 to create pGL4.24-SOD2Prom, which contains aSOD2Prom-luc transcriptional fusion. Mutation of the AP-1and NF-�B binding sites in pGL4.24-SOD2Prom wasperformed via site-directed mutagenesis using the QuikChangekit (Stratagene, Santa Clara, CA; primers: AP-1 Se, 5�-CAGG-GCATAAATTAAGTGAGTTGGAAGGACCCTG-3�; NF-�BSe, 5�-GGAGGAAAGTCTCCGCCGCTTTCCAGAACC-AGG-3�); the mutants were named pGL4.24-SOD2Prom AP-1m, pGL4.24-SOD2Prom NF-�Bm, and pGL4.24-SOD2PromAP-1m NF-�Bm, respectively.
Luciferase Assay—The constructs of pGL4.24-SOD2Prom,pGL4.24-SOD2Prom AP-1m, pGL4.24-SOD2Prom NF-�Bm,pGL4.24-SOD2Prom AP-1m NF-�Bm, and pNL3.2.NF-�B-RE(Promega, Madison, WI) were transfected into rat primary
TABLE 1List of rat primers for real-time PCR used in this study
Forward (5�–3�) Reverse (5�–3�)
TNF� AGCCCTGGTATGAGCCCATGTA CCGGACTCCGTGATGTCTAAGTIL-1� CACCTCTCAAGCAGAGCACAGA ACGGGTTCCATGGTGAAGTCCOX-2 TTTGTTGAGTCATTCACCAGACAGAT ACGATGTGTAAGGTTTCAGGGAGAAGMCP-1 TGTCTCAGCCAGATGCAGTT CAGCCGACTCATTGGGATCAMIP-2� CCCTCCTGTGCTCAAGACTC CCACAACAACCCCTGTACCCSOD1 TTCGAGCAGAAGGCAAGCGGTG TCTTCATCCGCTGGACCGCCASOD2 GCGCTGGCCAAGGGAGATGTT ATGGCCCCCGCCATTGAACTTCatalase CGTGCTCGCGTGGCCAACTA AGTTGGGAGCACCACCCTGGTGPx1 TCGGACATCAGGAGAATGGCAAGAA GCTGGCAAGGCATTCCGCAGGlutathione reductase GTGGTCTTCAGCCACCCGCC ATCGGGGTGAAGGCGGTCGAThioredoxin reductase TCCGTCAGGCCTCGCATCCA CCGCCGCCCTATGAGCAAGGGAPDH AACGACCCCTTCATTGACCT CCTTGACTGTGCCGTTGAACT
Regulation of Microglial Proinflammatory Responses by SOD2
SEPTEMBER 11, 2015 • VOLUME 290 • NUMBER 37 JOURNAL OF BIOLOGICAL CHEMISTRY 22807
at HIR
OSH
IMA
UN
IVE
RSIT
Y on Septem
ber 14, 2015http://w
ww
.jbc.org/D
ownloaded from
microglia using Lipofectamine 2000 (Invitrogen) according tothe manufacturer’s instructions. Twenty-four hours aftertransfection, the cells were used in the experiments. The lucif-erase activity was measured using the Luciferase Assay System(Promega) for the pGL4 vector or the Nano-Glo LuciferaseAssay System (Promega) for the pNL vector with a GloMax20/20 Luminometer (Promega).
Enzyme-linked Immunosorbent Assay—The levels of TNF�and IL-1� in the culture supernatants of the microglia wereevaluated using the TNF� and IL-1� Mini ELISA DevelopmentKit (PeproTech, Rocky Hill, NJ), according to the manufactu-rer’s instructions.
Evaluation of the NF-�B Binding Activity—Nuclear extractswere prepared according to our previous report with slightmodifications (34). Briefly, cells were suspended in buffer A (10mM HEPES, pH 7.8, 10 mM KCl, 2 mM MgCl2, 0.1 mM EDTA, 0.5mM DTT, and protease inhibitor mixture) and incubated on icefor 15 min. Nonidet P-40 at a final concentration of 0.6% wasadded to the cell suspension, which was immediately vortexedand centrifuged. The resulting white pellets were washed withbuffer A, and nuclear proteins were extracted with buffer B (50mM HEPES, pH 7.8, 50 mM KCl, 300 mM NaCl, 0.1 mM EDTA,0.5 mM DTT, 10% (v/v) glycerol). The specific DNA bindingactivity of NF-�B p65 was measured using the NF-�B (p65)transcription factor assay kit (Cayman Chemical), according tothe manufacturer’s instructions.
Intracerebroventricular Injection of LPS—Eight-week-oldmale ICR mice were initially anesthetized for surgery using amixture of 1.5–2.0% isoflurane (160 ml/min, Wako) and oxy-gen. The head was skinned, and a 27-gauge injection needle wasinserted into the cerebroventricular region (anterior, 0.5 mm;lateral, 1.0 mm; ventral, 5.0 mm from bregma). LPS was injectedat a volume of 2 �l over 2 min using a Hamilton syringe, and theneedle was left in place for an additional 1 min. The mice werekilled 3 h after injection. RNA was extracted from the cerebralcortex, and the cDNA was synthesized via RT-PCR, followed byreal-time PCR using the specific primers listed in Table 2.
Statistical Analyses—All data are expressed as the means �S.E. The statistical analyses were performed using a one-wayanalysis of variance (ANOVA), followed by Student’s t test orDunnett’s test. The Holm or Bonferroni methods were used tocorrect for multiple comparisons. p values of �0.05 were con-sidered to be statistically significant.
Results
SOD2 Up-regulation Occurs Downstream of TLRs in Micro-glia—When the rat primary microglia were stimulated withLPS for 6 h, the mRNA expression of proinflammatory mole-cules, such as TNF�, IL-1�, COX-2 (cyclooxygenase-2),MCP-1, and MIP-2� (macrophage inflammatory protein-2�),
was largely increased (Fig. 1A), clearly indicating the inductionof microglial activation by LPS. Interestingly, the activatedmicroglia strongly expressed SOD2 mRNA, compared with theunstimulated cells, whereas the expression of the other antiox-idant enzymes, SOD1, catalase (Cat), glutathione reductase(GR), and thioredoxin reductase (TR), remained unchanged inthe presence of LPS (Fig. 1B). The expression of glutathioneperoxidase 1 (GPx1) slightly decreased by LPS (Fig. 1B). Thetime course of the changes in the SOD2 mRNA expression wasalmost the same as that for the proinflammatory cytokines,TNF� and IL-1�; namely, the SOD2 mRNA levels started toincrease 1 h after LPS treatment, reached a peak at 6 h, and thenslightly decreased (Fig. 1C). The protein levels of SOD2 alsoincreased 1 h after LPS treatment, and a prolonged incrementwas observed during 24 h of incubation of the microglia withLPS (Fig. 1D).
To date, more than 10 functional TLRs have been identifiedin humans and rodents (35) and are expressed in a variety ofcells, including microglia. We stimulated rat primary microgliawith major TLR ligands other than LPS, including poly(I:C) as aligand for TLR3, PGN as a ligand for TLR6, and synthetic CpGDNA as a ligand for TLR9. Poly(I:C), PGN, and CpG DNAincreased the mRNA expression of TNF� and IL-1� in the pri-mary microglia (Fig. 2A), indicating that the microglia were alsoactivated by these TLR ligands. The effect of CpG DNA onmicroglial activation was less pronounced than that of the otherTLR ligands. Remarkably, poly(I:C), PGN, and CpG DNA elic-ited an increased expression of SOD2 mRNA as well as SOD2proteins (Fig. 2B). A TLR4 antagonist, TAK-242, clearly sup-pressed the mRNA expression of TNF�, IL-1�, and SOD2induced by LPS (Fig. 2C), indicating that the increased expres-sion of TNF�, IL-1�, and SOD2 was elicited downstream ofTLR4. The transcriptional activation of SOD2 has beenreported in response to several proinflammatory cytokines (36,37). However, the TNF receptor antagonist WP9QY and IL-1receptor antagonist IL-1RA did not have an effect on the SOD2expression induced by LPS (Fig. 2D). These data indicate thatthe SOD2 expression is induced downstream of TLRs, which isindependent of TNF� and IL-1� signaling.
We examined whether SOD2 may be induced in other cells inthe CNS, such as neurons and astrocytes. In primary neurons,the expression of TNF�, IL-1�, and SOD2 was not affected byLPS treatment for 24 h (Fig. 3B). Additionally, the primaryastrocytes showed an increased expression of TNF� and IL-1�mRNA at early time points; however, no changes were noted inthe mRNA levels of SOD2 following treatment with LPS duringthe experiments (Fig. 3C). Therefore, SOD2 induction down-stream of TLRs can be considered specific to microglia in theCNS.
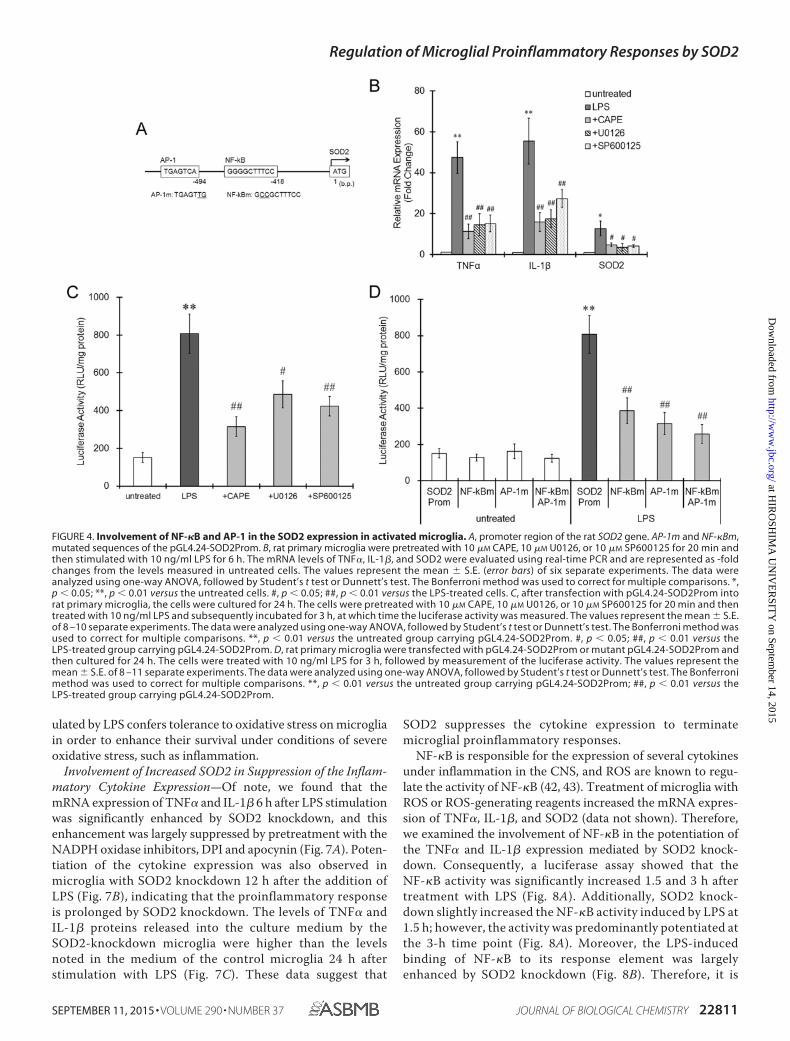
Transcription Factors Responsible for the Inducible Expres-sion of SOD2 in Microglia—A promoter analysis revealed thatthe promoter region of rat SOD2 has NF-�B and AP-1 bindingsequences (Fig. 4A). Furthermore, because AP-1 and NF-�Bhave been reported to drive the SOD2 expression (38 – 41), wenext examined the involvement of NF-�B and AP-1 in theSOD2 expression induced by LPS in the rat primary microglia.Pretreatment with an NF-�B inhibitor, CAPE, significantlysuppressed not only the mRNA levels of TNF� and IL-1� but
TABLE 2List of mouse primers for real-time PCR used in this study
Forward (5�–3�) Reverse (5�–3�)
TNF� ATGGCCTCCCTCTCATCAGT CTTGGTGGTTTGCTACGACGIL-1� AGCTTCCTTGTGCAAGTGTCT GCAGCCCTTCATCTTTTGGGSOD2 GTGTCTGTGGGAGTCCAAGG AGCGGAATAAGGCCTGTTGT�-Actin CTAGGCACCAGGGTGTGATG GGGGTACTTCAGGGTCAGGA
Regulation of Microglial Proinflammatory Responses by SOD2
22808 JOURNAL OF BIOLOGICAL CHEMISTRY VOLUME 290 • NUMBER 37 • SEPTEMBER 11, 2015
at HIR
OSH
IMA
UN
IVE
RSIT
Y on Septem
ber 14, 2015http://w
ww
.jbc.org/D
ownloaded from
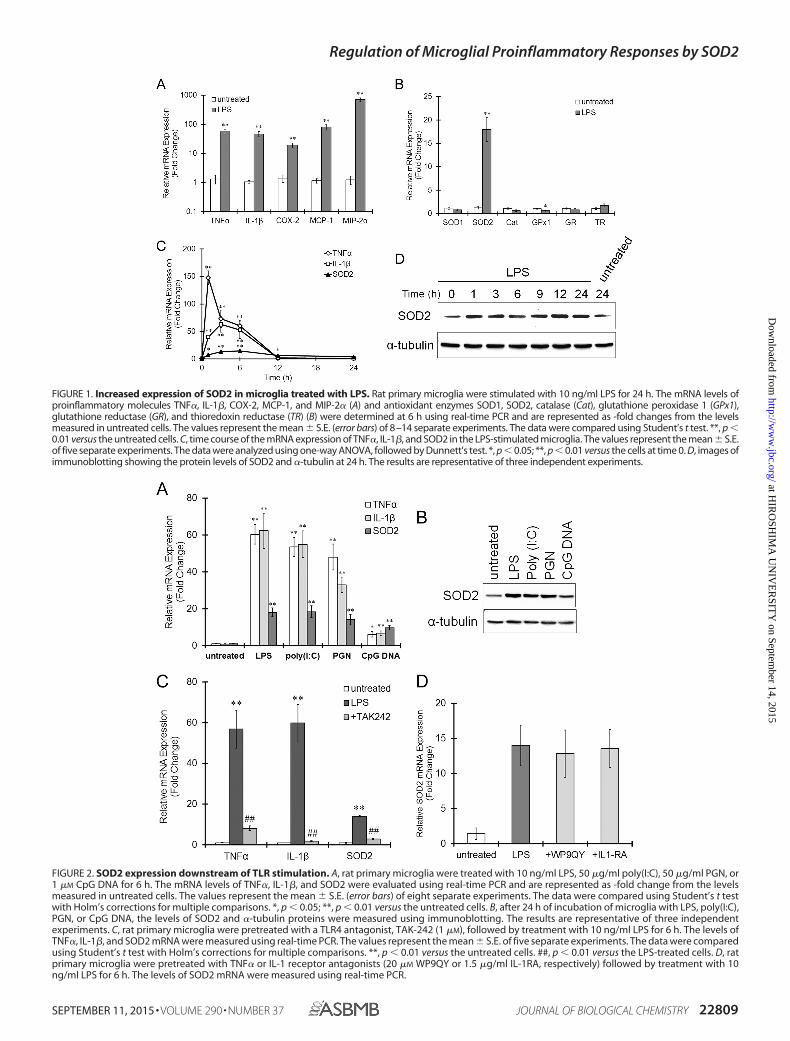
FIGURE 1. Increased expression of SOD2 in microglia treated with LPS. Rat primary microglia were stimulated with 10 ng/ml LPS for 24 h. The mRNA levels ofproinflammatory molecules TNF�, IL-1�, COX-2, MCP-1, and MIP-2� (A) and antioxidant enzymes SOD1, SOD2, catalase (Cat), glutathione peroxidase 1 (GPx1),glutathione reductase (GR), and thioredoxin reductase (TR) (B) were determined at 6 h using real-time PCR and are represented as -fold changes from the levelsmeasured in untreated cells. The values represent the mean � S.E. (error bars) of 8–14 separate experiments. The data were compared using Student’s t test. **, p �0.01 versus the untreated cells. C, time course of the mRNA expression of TNF�, IL-1�, and SOD2 in the LPS-stimulated microglia. The values represent the mean � S.E.of five separate experiments. The data were analyzed using one-way ANOVA, followed by Dunnett’s test. *, p � 0.05; **, p � 0.01 versus the cells at time 0. D, images ofimmunoblotting showing the protein levels of SOD2 and �-tubulin at 24 h. The results are representative of three independent experiments.
FIGURE 2. SOD2 expression downstream of TLR stimulation. A, rat primary microglia were treated with 10 ng/ml LPS, 50 �g/ml poly(I:C), 50 �g/ml PGN, or1 �M CpG DNA for 6 h. The mRNA levels of TNF�, IL-1�, and SOD2 were evaluated using real-time PCR and are represented as -fold change from the levelsmeasured in untreated cells. The values represent the mean � S.E. (error bars) of eight separate experiments. The data were compared using Student’s t testwith Holm’s corrections for multiple comparisons. *, p � 0.05; **, p � 0.01 versus the untreated cells. B, after 24 h of incubation of microglia with LPS, poly(I:C),PGN, or CpG DNA, the levels of SOD2 and �-tubulin proteins were measured using immunoblotting. The results are representative of three independentexperiments. C, rat primary microglia were pretreated with a TLR4 antagonist, TAK-242 (1 �M), followed by treatment with 10 ng/ml LPS for 6 h. The levels ofTNF�, IL-1�, and SOD2 mRNA were measured using real-time PCR. The values represent the mean � S.E. of five separate experiments. The data were comparedusing Student’s t test with Holm’s corrections for multiple comparisons. **, p � 0.01 versus the untreated cells. ##, p � 0.01 versus the LPS-treated cells. D, ratprimary microglia were pretreated with TNF� or IL-1 receptor antagonists (20 �M WP9QY or 1.5 �g/ml IL-1RA, respectively) followed by treatment with 10ng/ml LPS for 6 h. The levels of SOD2 mRNA were measured using real-time PCR.
Regulation of Microglial Proinflammatory Responses by SOD2
SEPTEMBER 11, 2015 • VOLUME 290 • NUMBER 37 JOURNAL OF BIOLOGICAL CHEMISTRY 22809
at HIR
OSH
IMA
UN
IVE
RSIT
Y on Septem
ber 14, 2015http://w
ww
.jbc.org/D
ownloaded from
also the amount of SOD2 mRNA induced by LPS (Fig. 4B).Challenges with the MEK1 inhibitor, U0126, and JNK inhibitor,SP600125, also reduced the mRNA expression of TNF�, IL-1�,and SOD2 elicited by LPS (Fig. 4B). A luciferase assay using thecloned rat SOD2 promoter region demonstrated that treatmentof microglia with LPS transcriptionally activated the luciferaseexpression, whereas pretreatment with CAPE, U0126, orSP600125 attenuated the luciferase activity induced by LPS(Fig. 4C). In addition, mutations targeting the NF-�B and AP-1binding sequences in the SOD2 promoter significantly sup-pressed luciferase transactivation (Fig. 4D). These results sug-gest that SOD2 is transcriptionally activated via NF-�B- andAP-1-related pathways downstream of TLRs.
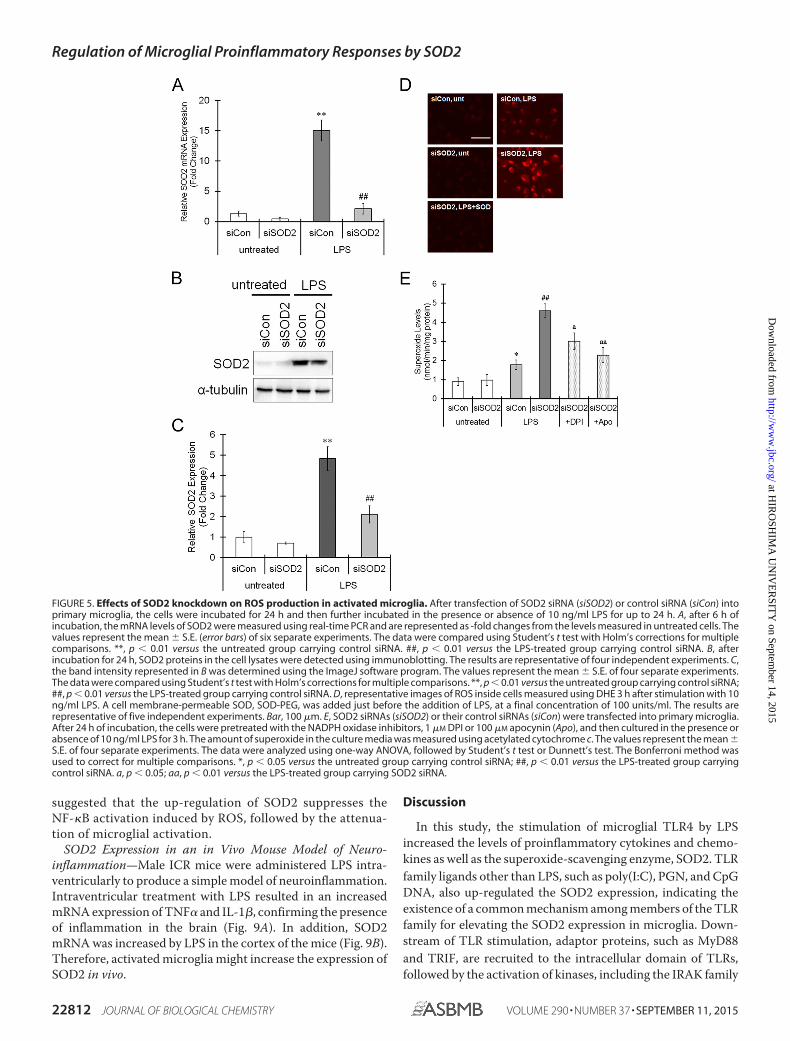
Involvement of Up-regulated SOD2 in the AntioxidantDefenses of Microglia—Because SOD2 is a well known enzymethat scavenges superoxide anions, the most obvious role for theSOD2 induced by LPS is to eliminate the superoxide producedby microglia and attenuate oxidative stress. Therefore, the rela-tionship between an increased expression of SOD2 and oxida-tive injury in microglia was investigated using the RNAimethod. Transfection of SOD2 siRNA clearly suppressed theSOD2 mRNA and protein expression elicited by LPS (Fig. 5,A–C). The intracellular ROS levels in the microglia wereincreased by treatment with LPS (Fig. 5D). In SOD2-knock-down microglia, ROS production was clearly potentiated in thepresence of LPS (Fig. 5D). However, ROS production did not
increase in the LPS-treated microglia with SOD2 knockdown towhich membrane-permeable SOD (SOD-PEG) was added (Fig.5D), indicating that the SOD2 elicited by treatment with LPScontributes to the elimination of the ROS produced by LPSstimulation. In addition, the extracellular ROS levels were alsoincreased by treatment with LPS, and ROS production wasenhanced by the knockdown of SOD2 (Fig. 5E). The NADPHoxidase inhibitors, DPI and apocynin, partially but significantlysuppressed the potentiated ROS generation noted in SOD2-knockdown cells (Fig. 5E), suggesting that the SOD2 up-regu-lated in response to LPS eliminates the superoxide derived fromNADPH oxidase.
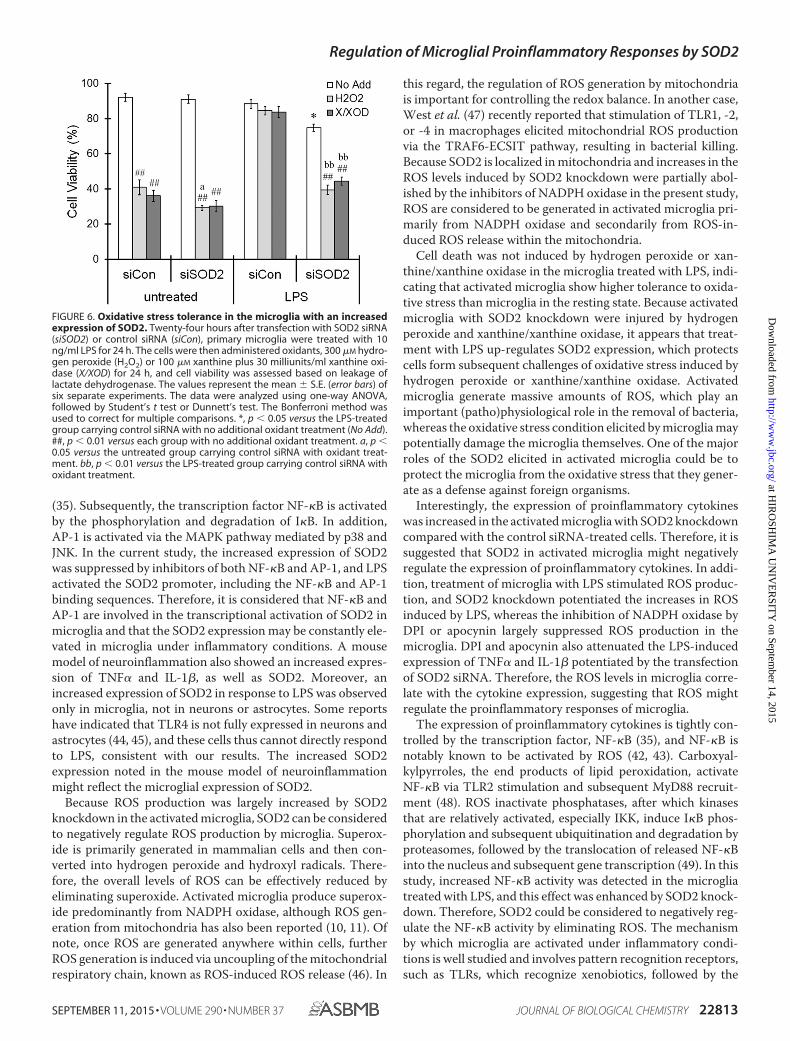
Treatment with LPS did not injure microglia carrying controlsiRNA, whereas the microglia treated with SOD2 knockdownwere significantly damaged by LPS, suggesting that SOD2 playsa role in the self-protection of microglia under inflammatoryconditions (Fig. 6). When unstimulated microglia were treatedwith the oxidants, 300 �M hydrogen peroxide or 100 �M xan-thine plus 30 milliunits/ml xanthine oxidase for 24 h, cell via-bility decreased to 41.0 and 36.1%, respectively (Fig. 6). Inter-estingly, treatment with hydrogen peroxide and xanthine/xanthine oxidase did not induce any reductions in cell viabilityin the LPS-treated microglia (Fig. 6), demonstrating higher tol-erance of the activated microglia to oxidative stress. In contrast,SOD2 knockdown clearly abolished the tolerance of the micro-glia stimulated with LPS (Fig. 6). Therefore, the SOD2 up-reg-
FIGURE 3. Effects of LPS on the SOD2 expression in primary neurons and astrocytes. A, immunocytochemical staining of rat primary neurons treated withthe MAP2 antibody (left) and rat primary astrocytes treated with glial fibrillary acidic protein (GFAP) (right). B and C, rat primary neurons (B) or astrocytes (C) weretreated with 10 ng/ml LPS for 24 h, and the time course of the mRNA expression of TNF�, IL-1�, and SOD2 was evaluated using real-time PCR. The valuesrepresent the mean � S.E. of 3–5 separate experiments. The data were analyzed using one-way ANOVA, followed by Dunnett’s test. *, p � 0.05; **, p � 0.01versus the cells at time 0.
Regulation of Microglial Proinflammatory Responses by SOD2
22810 JOURNAL OF BIOLOGICAL CHEMISTRY VOLUME 290 • NUMBER 37 • SEPTEMBER 11, 2015
at HIR
OSH
IMA
UN
IVE
RSIT
Y on Septem
ber 14, 2015http://w
ww
.jbc.org/D
ownloaded from
ulated by LPS confers tolerance to oxidative stress on microgliain order to enhance their survival under conditions of severeoxidative stress, such as inflammation.
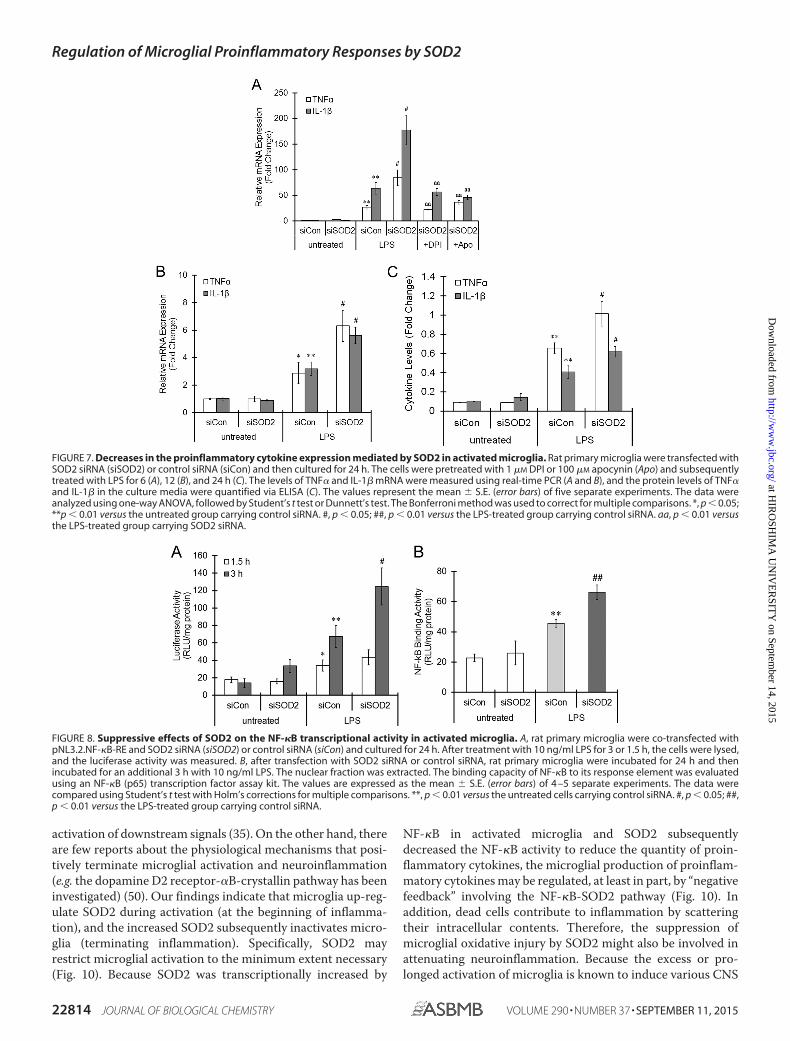
Involvement of Increased SOD2 in Suppression of the Inflam-matory Cytokine Expression—Of note, we found that themRNA expression of TNF� and IL-1� 6 h after LPS stimulationwas significantly enhanced by SOD2 knockdown, and thisenhancement was largely suppressed by pretreatment with theNADPH oxidase inhibitors, DPI and apocynin (Fig. 7A). Poten-tiation of the cytokine expression was also observed inmicroglia with SOD2 knockdown 12 h after the addition ofLPS (Fig. 7B), indicating that the proinflammatory responseis prolonged by SOD2 knockdown. The levels of TNF� andIL-1� proteins released into the culture medium by theSOD2-knockdown microglia were higher than the levelsnoted in the medium of the control microglia 24 h afterstimulation with LPS (Fig. 7C). These data suggest that
SOD2 suppresses the cytokine expression to terminatemicroglial proinflammatory responses.
NF-�B is responsible for the expression of several cytokinesunder inflammation in the CNS, and ROS are known to regu-late the activity of NF-�B (42, 43). Treatment of microglia withROS or ROS-generating reagents increased the mRNA expres-sion of TNF�, IL-1�, and SOD2 (data not shown). Therefore,we examined the involvement of NF-�B in the potentiation ofthe TNF� and IL-1� expression mediated by SOD2 knock-down. Consequently, a luciferase assay showed that theNF-�B activity was significantly increased 1.5 and 3 h aftertreatment with LPS (Fig. 8A). Additionally, SOD2 knock-down slightly increased the NF-�B activity induced by LPS at1.5 h; however, the activity was predominantly potentiated atthe 3-h time point (Fig. 8A). Moreover, the LPS-inducedbinding of NF-�B to its response element was largelyenhanced by SOD2 knockdown (Fig. 8B). Therefore, it is
FIGURE 4. Involvement of NF-�B and AP-1 in the SOD2 expression in activated microglia. A, promoter region of the rat SOD2 gene. AP-1m and NF-�Bm,mutated sequences of the pGL4.24-SOD2Prom. B, rat primary microglia were pretreated with 10 �M CAPE, 10 �M U0126, or 10 �M SP600125 for 20 min andthen stimulated with 10 ng/ml LPS for 6 h. The mRNA levels of TNF�, IL-1�, and SOD2 were evaluated using real-time PCR and are represented as -foldchanges from the levels measured in untreated cells. The values represent the mean � S.E. (error bars) of six separate experiments. The data wereanalyzed using one-way ANOVA, followed by Student’s t test or Dunnett’s test. The Bonferroni method was used to correct for multiple comparisons. *,p � 0.05; **, p � 0.01 versus the untreated cells. #, p � 0.05; ##, p � 0.01 versus the LPS-treated cells. C, after transfection with pGL4.24-SOD2Prom intorat primary microglia, the cells were cultured for 24 h. The cells were pretreated with 10 �M CAPE, 10 �M U0126, or 10 �M SP600125 for 20 min and thentreated with 10 ng/ml LPS and subsequently incubated for 3 h, at which time the luciferase activity was measured. The values represent the mean � S.E.of 8 –10 separate experiments. The data were analyzed using one-way ANOVA, followed by Student’s t test or Dunnett’s test. The Bonferroni method wasused to correct for multiple comparisons. **, p � 0.01 versus the untreated group carrying pGL4.24-SOD2Prom. #, p � 0.05; ##, p � 0.01 versus theLPS-treated group carrying pGL4.24-SOD2Prom. D, rat primary microglia were transfected with pGL4.24-SOD2Prom or mutant pGL4.24-SOD2Prom andthen cultured for 24 h. The cells were treated with 10 ng/ml LPS for 3 h, followed by measurement of the luciferase activity. The values represent themean � S.E. of 8 –11 separate experiments. The data were analyzed using one-way ANOVA, followed by Student’s t test or Dunnett’s test. The Bonferronimethod was used to correct for multiple comparisons. **, p � 0.01 versus the untreated group carrying pGL4.24-SOD2Prom; ##, p � 0.01 versus theLPS-treated group carrying pGL4.24-SOD2Prom.
Regulation of Microglial Proinflammatory Responses by SOD2
SEPTEMBER 11, 2015 • VOLUME 290 • NUMBER 37 JOURNAL OF BIOLOGICAL CHEMISTRY 22811
at HIR
OSH
IMA
UN
IVE
RSIT
Y on Septem
ber 14, 2015http://w
ww
.jbc.org/D
ownloaded from
suggested that the up-regulation of SOD2 suppresses theNF-�B activation induced by ROS, followed by the attenua-tion of microglial activation.
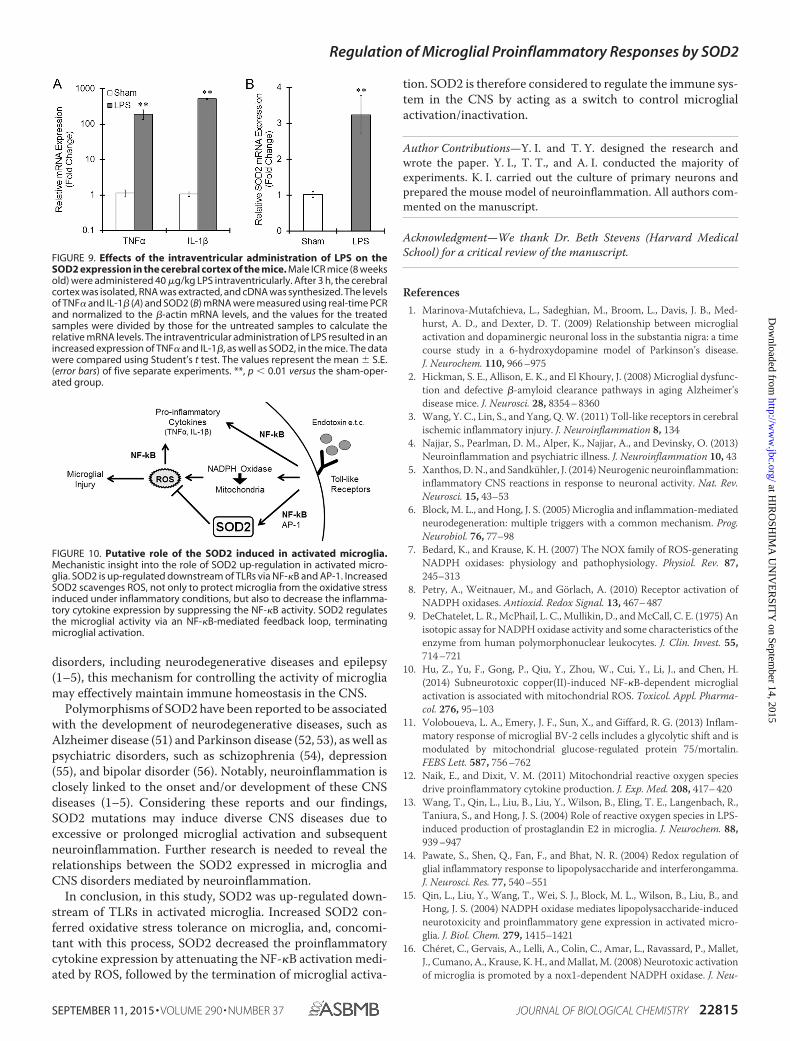
SOD2 Expression in an in Vivo Mouse Model of Neuro-inflammation—Male ICR mice were administered LPS intra-ventricularly to produce a simple model of neuroinflammation.Intraventricular treatment with LPS resulted in an increasedmRNA expression of TNF� and IL-1�, confirming the presenceof inflammation in the brain (Fig. 9A). In addition, SOD2mRNA was increased by LPS in the cortex of the mice (Fig. 9B).Therefore, activated microglia might increase the expression ofSOD2 in vivo.
Discussion
In this study, the stimulation of microglial TLR4 by LPSincreased the levels of proinflammatory cytokines and chemo-kines as well as the superoxide-scavenging enzyme, SOD2. TLRfamily ligands other than LPS, such as poly(I:C), PGN, and CpGDNA, also up-regulated the SOD2 expression, indicating theexistence of a common mechanism among members of the TLRfamily for elevating the SOD2 expression in microglia. Down-stream of TLR stimulation, adaptor proteins, such as MyD88and TRIF, are recruited to the intracellular domain of TLRs,followed by the activation of kinases, including the IRAK family
FIGURE 5. Effects of SOD2 knockdown on ROS production in activated microglia. After transfection of SOD2 siRNA (siSOD2) or control siRNA (siCon) intoprimary microglia, the cells were incubated for 24 h and then further incubated in the presence or absence of 10 ng/ml LPS for up to 24 h. A, after 6 h ofincubation, the mRNA levels of SOD2 were measured using real-time PCR and are represented as -fold changes from the levels measured in untreated cells. Thevalues represent the mean � S.E. (error bars) of six separate experiments. The data were compared using Student’s t test with Holm’s corrections for multiplecomparisons. **, p � 0.01 versus the untreated group carrying control siRNA. ##, p � 0.01 versus the LPS-treated group carrying control siRNA. B, afterincubation for 24 h, SOD2 proteins in the cell lysates were detected using immunoblotting. The results are representative of four independent experiments. C,the band intensity represented in B was determined using the ImageJ software program. The values represent the mean � S.E. of four separate experiments.The data were compared using Student’s t test with Holm’s corrections for multiple comparisons. **, p � 0.01 versus the untreated group carrying control siRNA;##, p � 0.01 versus the LPS-treated group carrying control siRNA. D, representative images of ROS inside cells measured using DHE 3 h after stimulation with 10ng/ml LPS. A cell membrane-permeable SOD, SOD-PEG, was added just before the addition of LPS, at a final concentration of 100 units/ml. The results arerepresentative of five independent experiments. Bar, 100 �m. E, SOD2 siRNAs (siSOD2) or their control siRNAs (siCon) were transfected into primary microglia.After 24 h of incubation, the cells were pretreated with the NADPH oxidase inhibitors, 1 �M DPI or 100 �M apocynin (Apo), and then cultured in the presence orabsence of 10 ng/ml LPS for 3 h. The amount of superoxide in the culture media was measured using acetylated cytochrome c. The values represent the mean �S.E. of four separate experiments. The data were analyzed using one-way ANOVA, followed by Student’s t test or Dunnett’s test. The Bonferroni method wasused to correct for multiple comparisons. *, p � 0.05 versus the untreated group carrying control siRNA; ##, p � 0.01 versus the LPS-treated group carryingcontrol siRNA. a, p � 0.05; aa, p � 0.01 versus the LPS-treated group carrying SOD2 siRNA.
Regulation of Microglial Proinflammatory Responses by SOD2
22812 JOURNAL OF BIOLOGICAL CHEMISTRY VOLUME 290 • NUMBER 37 • SEPTEMBER 11, 2015
at HIR
OSH
IMA
UN
IVE
RSIT
Y on Septem
ber 14, 2015http://w
ww
.jbc.org/D
ownloaded from
(35). Subsequently, the transcription factor NF-�B is activatedby the phosphorylation and degradation of I�B. In addition,AP-1 is activated via the MAPK pathway mediated by p38 andJNK. In the current study, the increased expression of SOD2was suppressed by inhibitors of both NF-�B and AP-1, and LPSactivated the SOD2 promoter, including the NF-�B and AP-1binding sequences. Therefore, it is considered that NF-�B andAP-1 are involved in the transcriptional activation of SOD2 inmicroglia and that the SOD2 expression may be constantly ele-vated in microglia under inflammatory conditions. A mousemodel of neuroinflammation also showed an increased expres-sion of TNF� and IL-1�, as well as SOD2. Moreover, anincreased expression of SOD2 in response to LPS was observedonly in microglia, not in neurons or astrocytes. Some reportshave indicated that TLR4 is not fully expressed in neurons andastrocytes (44, 45), and these cells thus cannot directly respondto LPS, consistent with our results. The increased SOD2expression noted in the mouse model of neuroinflammationmight reflect the microglial expression of SOD2.
Because ROS production was largely increased by SOD2knockdown in the activated microglia, SOD2 can be consideredto negatively regulate ROS production by microglia. Superox-ide is primarily generated in mammalian cells and then con-verted into hydrogen peroxide and hydroxyl radicals. There-fore, the overall levels of ROS can be effectively reduced byeliminating superoxide. Activated microglia produce superox-ide predominantly from NADPH oxidase, although ROS gen-eration from mitochondria has also been reported (10, 11). Ofnote, once ROS are generated anywhere within cells, furtherROS generation is induced via uncoupling of the mitochondrialrespiratory chain, known as ROS-induced ROS release (46). In
this regard, the regulation of ROS generation by mitochondriais important for controlling the redox balance. In another case,West et al. (47) recently reported that stimulation of TLR1, -2,or -4 in macrophages elicited mitochondrial ROS productionvia the TRAF6-ECSIT pathway, resulting in bacterial killing.Because SOD2 is localized in mitochondria and increases in theROS levels induced by SOD2 knockdown were partially abol-ished by the inhibitors of NADPH oxidase in the present study,ROS are considered to be generated in activated microglia pri-marily from NADPH oxidase and secondarily from ROS-in-duced ROS release within the mitochondria.
Cell death was not induced by hydrogen peroxide or xan-thine/xanthine oxidase in the microglia treated with LPS, indi-cating that activated microglia show higher tolerance to oxida-tive stress than microglia in the resting state. Because activatedmicroglia with SOD2 knockdown were injured by hydrogenperoxide and xanthine/xanthine oxidase, it appears that treat-ment with LPS up-regulates SOD2 expression, which protectscells form subsequent challenges of oxidative stress induced byhydrogen peroxide or xanthine/xanthine oxidase. Activatedmicroglia generate massive amounts of ROS, which play animportant (patho)physiological role in the removal of bacteria,whereas the oxidative stress condition elicited by microglia maypotentially damage the microglia themselves. One of the majorroles of the SOD2 elicited in activated microglia could be toprotect the microglia from the oxidative stress that they gener-ate as a defense against foreign organisms.
Interestingly, the expression of proinflammatory cytokineswas increased in the activated microglia with SOD2 knockdowncompared with the control siRNA-treated cells. Therefore, it issuggested that SOD2 in activated microglia might negativelyregulate the expression of proinflammatory cytokines. In addi-tion, treatment of microglia with LPS stimulated ROS produc-tion, and SOD2 knockdown potentiated the increases in ROSinduced by LPS, whereas the inhibition of NADPH oxidase byDPI or apocynin largely suppressed ROS production in themicroglia. DPI and apocynin also attenuated the LPS-inducedexpression of TNF� and IL-1� potentiated by the transfectionof SOD2 siRNA. Therefore, the ROS levels in microglia corre-late with the cytokine expression, suggesting that ROS mightregulate the proinflammatory responses of microglia.
The expression of proinflammatory cytokines is tightly con-trolled by the transcription factor, NF-�B (35), and NF-�B isnotably known to be activated by ROS (42, 43). Carboxyal-kylpyrroles, the end products of lipid peroxidation, activateNF-�B via TLR2 stimulation and subsequent MyD88 recruit-ment (48). ROS inactivate phosphatases, after which kinasesthat are relatively activated, especially IKK, induce I�B phos-phorylation and subsequent ubiquitination and degradation byproteasomes, followed by the translocation of released NF-�Binto the nucleus and subsequent gene transcription (49). In thisstudy, increased NF-�B activity was detected in the microgliatreated with LPS, and this effect was enhanced by SOD2 knock-down. Therefore, SOD2 could be considered to negatively reg-ulate the NF-�B activity by eliminating ROS. The mechanismby which microglia are activated under inflammatory condi-tions is well studied and involves pattern recognition receptors,such as TLRs, which recognize xenobiotics, followed by the
FIGURE 6. Oxidative stress tolerance in the microglia with an increasedexpression of SOD2. Twenty-four hours after transfection with SOD2 siRNA(siSOD2) or control siRNA (siCon), primary microglia were treated with 10ng/ml LPS for 24 h. The cells were then administered oxidants, 300 �M hydro-gen peroxide (H2O2) or 100 �M xanthine plus 30 milliunits/ml xanthine oxi-dase (X/XOD) for 24 h, and cell viability was assessed based on leakage oflactate dehydrogenase. The values represent the mean � S.E. (error bars) ofsix separate experiments. The data were analyzed using one-way ANOVA,followed by Student’s t test or Dunnett’s test. The Bonferroni method wasused to correct for multiple comparisons. *, p � 0.05 versus the LPS-treatedgroup carrying control siRNA with no additional oxidant treatment (No Add).##, p � 0.01 versus each group with no additional oxidant treatment. a, p �0.05 versus the untreated group carrying control siRNA with oxidant treat-ment. bb, p � 0.01 versus the LPS-treated group carrying control siRNA withoxidant treatment.
Regulation of Microglial Proinflammatory Responses by SOD2
SEPTEMBER 11, 2015 • VOLUME 290 • NUMBER 37 JOURNAL OF BIOLOGICAL CHEMISTRY 22813
at HIR
OSH
IMA
UN
IVE
RSIT
Y on Septem
ber 14, 2015http://w
ww
.jbc.org/D
ownloaded from
activation of downstream signals (35). On the other hand, thereare few reports about the physiological mechanisms that posi-tively terminate microglial activation and neuroinflammation(e.g. the dopamine D2 receptor-�B-crystallin pathway has beeninvestigated) (50). Our findings indicate that microglia up-reg-ulate SOD2 during activation (at the beginning of inflamma-tion), and the increased SOD2 subsequently inactivates micro-glia (terminating inflammation). Specifically, SOD2 mayrestrict microglial activation to the minimum extent necessary(Fig. 10). Because SOD2 was transcriptionally increased by
NF-�B in activated microglia and SOD2 subsequentlydecreased the NF-�B activity to reduce the quantity of proin-flammatory cytokines, the microglial production of proinflam-matory cytokines may be regulated, at least in part, by “negativefeedback” involving the NF-�B-SOD2 pathway (Fig. 10). Inaddition, dead cells contribute to inflammation by scatteringtheir intracellular contents. Therefore, the suppression ofmicroglial oxidative injury by SOD2 might also be involved inattenuating neuroinflammation. Because the excess or pro-longed activation of microglia is known to induce various CNS
FIGURE 7. Decreases in the proinflammatory cytokine expression mediated by SOD2 in activated microglia. Rat primary microglia were transfected withSOD2 siRNA (siSOD2) or control siRNA (siCon) and then cultured for 24 h. The cells were pretreated with 1 �M DPI or 100 �M apocynin (Apo) and subsequentlytreated with LPS for 6 (A), 12 (B), and 24 h (C). The levels of TNF� and IL-1� mRNA were measured using real-time PCR (A and B), and the protein levels of TNF�and IL-1� in the culture media were quantified via ELISA (C). The values represent the mean � S.E. (error bars) of five separate experiments. The data wereanalyzed using one-way ANOVA, followed by Student’s t test or Dunnett’s test. The Bonferroni method was used to correct for multiple comparisons. *, p � 0.05;**p � 0.01 versus the untreated group carrying control siRNA. #, p � 0.05; ##, p � 0.01 versus the LPS-treated group carrying control siRNA. aa, p � 0.01 versusthe LPS-treated group carrying SOD2 siRNA.
FIGURE 8. Suppressive effects of SOD2 on the NF-�B transcriptional activity in activated microglia. A, rat primary microglia were co-transfected withpNL3.2.NF-�B-RE and SOD2 siRNA (siSOD2) or control siRNA (siCon) and cultured for 24 h. After treatment with 10 ng/ml LPS for 3 or 1.5 h, the cells were lysed,and the luciferase activity was measured. B, after transfection with SOD2 siRNA or control siRNA, rat primary microglia were incubated for 24 h and thenincubated for an additional 3 h with 10 ng/ml LPS. The nuclear fraction was extracted. The binding capacity of NF-�B to its response element was evaluatedusing an NF-�B (p65) transcription factor assay kit. The values are expressed as the mean � S.E. (error bars) of 4 –5 separate experiments. The data werecompared using Student’s t test with Holm’s corrections for multiple comparisons. **, p � 0.01 versus the untreated cells carrying control siRNA. #, p � 0.05; ##,p � 0.01 versus the LPS-treated group carrying control siRNA.
Regulation of Microglial Proinflammatory Responses by SOD2
22814 JOURNAL OF BIOLOGICAL CHEMISTRY VOLUME 290 • NUMBER 37 • SEPTEMBER 11, 2015
at HIR
OSH
IMA
UN
IVE
RSIT
Y on Septem
ber 14, 2015http://w
ww
.jbc.org/D
ownloaded from
disorders, including neurodegenerative diseases and epilepsy(1–5), this mechanism for controlling the activity of microgliamay effectively maintain immune homeostasis in the CNS.
Polymorphisms of SOD2 have been reported to be associatedwith the development of neurodegenerative diseases, such asAlzheimer disease (51) and Parkinson disease (52, 53), as well aspsychiatric disorders, such as schizophrenia (54), depression(55), and bipolar disorder (56). Notably, neuroinflammation isclosely linked to the onset and/or development of these CNSdiseases (1–5). Considering these reports and our findings,SOD2 mutations may induce diverse CNS diseases due toexcessive or prolonged microglial activation and subsequentneuroinflammation. Further research is needed to reveal therelationships between the SOD2 expressed in microglia andCNS disorders mediated by neuroinflammation.
In conclusion, in this study, SOD2 was up-regulated down-stream of TLRs in activated microglia. Increased SOD2 con-ferred oxidative stress tolerance on microglia, and, concomi-tant with this process, SOD2 decreased the proinflammatorycytokine expression by attenuating the NF-�B activation medi-ated by ROS, followed by the termination of microglial activa-
tion. SOD2 is therefore considered to regulate the immune sys-tem in the CNS by acting as a switch to control microglialactivation/inactivation.
Author Contributions—Y. I. and T. Y. designed the research andwrote the paper. Y. I., T. T., and A. I. conducted the majority ofexperiments. K. I. carried out the culture of primary neurons andprepared the mouse model of neuroinflammation. All authors com-mented on the manuscript.
Acknowledgment—We thank Dr. Beth Stevens (Harvard MedicalSchool) for a critical review of the manuscript.
References1. Marinova-Mutafchieva, L., Sadeghian, M., Broom, L., Davis, J. B., Med-
hurst, A. D., and Dexter, D. T. (2009) Relationship between microglialactivation and dopaminergic neuronal loss in the substantia nigra: a timecourse study in a 6-hydroxydopamine model of Parkinson’s disease.J. Neurochem. 110, 966 –975
2. Hickman, S. E., Allison, E. K., and El Khoury, J. (2008) Microglial dysfunc-tion and defective �-amyloid clearance pathways in aging Alzheimer’sdisease mice. J. Neurosci. 28, 8354 – 8360
3. Wang, Y. C., Lin, S., and Yang, Q. W. (2011) Toll-like receptors in cerebralischemic inflammatory injury. J. Neuroinflammation 8, 134
4. Najjar, S., Pearlman, D. M., Alper, K., Najjar, A., and Devinsky, O. (2013)Neuroinflammation and psychiatric illness. J. Neuroinflammation 10, 43
5. Xanthos, D. N., and Sandkuhler, J. (2014) Neurogenic neuroinflammation:inflammatory CNS reactions in response to neuronal activity. Nat. Rev.Neurosci. 15, 43–53
6. Block, M. L., and Hong, J. S. (2005) Microglia and inflammation-mediatedneurodegeneration: multiple triggers with a common mechanism. Prog.Neurobiol. 76, 77–98
7. Bedard, K., and Krause, K. H. (2007) The NOX family of ROS-generatingNADPH oxidases: physiology and pathophysiology. Physiol. Rev. 87,245–313
8. Petry, A., Weitnauer, M., and Gorlach, A. (2010) Receptor activation ofNADPH oxidases. Antioxid. Redox Signal. 13, 467– 487
9. DeChatelet, L. R., McPhail, L. C., Mullikin, D., and McCall, C. E. (1975) Anisotopic assay for NADPH oxidase activity and some characteristics of theenzyme from human polymorphonuclear leukocytes. J. Clin. Invest. 55,714 –721
10. Hu, Z., Yu, F., Gong, P., Qiu, Y., Zhou, W., Cui, Y., Li, J., and Chen, H.(2014) Subneurotoxic copper(II)-induced NF-�B-dependent microglialactivation is associated with mitochondrial ROS. Toxicol. Appl. Pharma-col. 276, 95–103
11. Voloboueva, L. A., Emery, J. F., Sun, X., and Giffard, R. G. (2013) Inflam-matory response of microglial BV-2 cells includes a glycolytic shift and ismodulated by mitochondrial glucose-regulated protein 75/mortalin.FEBS Lett. 587, 756 –762
12. Naik, E., and Dixit, V. M. (2011) Mitochondrial reactive oxygen speciesdrive proinflammatory cytokine production. J. Exp. Med. 208, 417– 420
13. Wang, T., Qin, L., Liu, B., Liu, Y., Wilson, B., Eling, T. E., Langenbach, R.,Taniura, S., and Hong, J. S. (2004) Role of reactive oxygen species in LPS-induced production of prostaglandin E2 in microglia. J. Neurochem. 88,939 –947
14. Pawate, S., Shen, Q., Fan, F., and Bhat, N. R. (2004) Redox regulation ofglial inflammatory response to lipopolysaccharide and interferongamma.J. Neurosci. Res. 77, 540 –551
15. Qin, L., Liu, Y., Wang, T., Wei, S. J., Block, M. L., Wilson, B., Liu, B., andHong, J. S. (2004) NADPH oxidase mediates lipopolysaccharide-inducedneurotoxicity and proinflammatory gene expression in activated micro-glia. J. Biol. Chem. 279, 1415–1421
16. Cheret, C., Gervais, A., Lelli, A., Colin, C., Amar, L., Ravassard, P., Mallet,J., Cumano, A., Krause, K. H., and Mallat, M. (2008) Neurotoxic activationof microglia is promoted by a nox1-dependent NADPH oxidase. J. Neu-
FIGURE 9. Effects of the intraventricular administration of LPS on theSOD2 expression in the cerebral cortex of the mice. Male ICR mice (8 weeksold) were administered 40 �g/kg LPS intraventricularly. After 3 h, the cerebralcortex was isolated, RNA was extracted, and cDNA was synthesized. The levelsof TNF� and IL-1� (A) and SOD2 (B) mRNA were measured using real-time PCRand normalized to the �-actin mRNA levels, and the values for the treatedsamples were divided by those for the untreated samples to calculate therelative mRNA levels. The intraventricular administration of LPS resulted in anincreased expression of TNF� and IL-1�, as well as SOD2, in the mice. The datawere compared using Student’s t test. The values represent the mean � S.E.(error bars) of five separate experiments. **, p � 0.01 versus the sham-oper-ated group.
FIGURE 10. Putative role of the SOD2 induced in activated microglia.Mechanistic insight into the role of SOD2 up-regulation in activated micro-glia. SOD2 is up-regulated downstream of TLRs via NF-�B and AP-1. IncreasedSOD2 scavenges ROS, not only to protect microglia from the oxidative stressinduced under inflammatory conditions, but also to decrease the inflamma-tory cytokine expression by suppressing the NF-�B activity. SOD2 regulatesthe microglial activity via an NF-�B-mediated feedback loop, terminatingmicroglial activation.
Regulation of Microglial Proinflammatory Responses by SOD2
SEPTEMBER 11, 2015 • VOLUME 290 • NUMBER 37 JOURNAL OF BIOLOGICAL CHEMISTRY 22815
at HIR
OSH
IMA
UN
IVE
RSIT
Y on Septem
ber 14, 2015http://w
ww
.jbc.org/D
ownloaded from
rosci. 28, 12039 –1205117. Park, H. S., Jung, H. Y., Park, E. Y., Kim, J., Lee, W. J., and Bae, Y. S. (2004)
Cutting edge: direct interaction of TLR4 with NAD(P)H oxidase 4isozyme is essential for lipopolysaccharide-induced production of reactiveoxygen species and activation of NF-�B. J. Immunol. 173, 3589 –3593
18. Qin, L., Liu, Y., Hong, J. S., and Crews, F. T. (2013) NADPH oxidase andaging drive microglial activation, oxidative stress, and dopaminergic neu-rodegeneration following systemic LPS administration. Glia 61, 855– 868
19. Egger, T., Schuligoi, R., Wintersperger, A., Amann, R., Malle, E., and Sat-tler, W. (2003) Vitamin E (�-tocopherol) attenuates cyclo-oxygenase 2transcription and synthesis in immortalized murine BV-2 microglia.Biochem. J. 370, 459 – 467
20. Heppner, F. L., Roth, K., Nitsch, R., and Hailer, N. P. (1998) Vitamin Einduces ramification and downregulation of adhesion molecules in cul-tured microglial cells. Glia 22, 180 –188
21. Godbout, J. P., Berg, B. M., Kelley, K. W., and Johnson, R. W. (2004)�-Tocopherol reduces lipopolysaccharide-induced peroxide radical for-mation and interleukin-6 secretion in primary murine microglia and inbrain. J. Neuroimmunol. 149, 101–109
22. Li, Y., Liu, L., Barger, S. W., Mrak, R. E., and Griffin, W. S. (2001) VitaminE suppression of microglial activation is neuroprotective. J. Neurosci. Res.66, 163–170
23. Sugaya, K., Chou, S., Xu, S. J., and McKinney, M. (1998) Indicators of glialactivation and brain oxidative stress after intraventricular infusion of en-dotoxin. Brain Res. Mol. Brain Res. 58, 1–9
24. Kramer, B. C., Yabut, J. A., Cheong, J., JnoBaptiste, R., Robakis, T., Olanow,C. W., and Mytilineou, C. (2002) Lipopolysaccharide prevents cell deathcaused by glutathione depletion: possible mechanisms of protection. Neu-roscience 114, 361–372
25. Kaneko, Y. S., Ota, A., Nakashima, A., Mori, K., Nagatsu, I., and Nagatsu,T. (2012) Regulation of oxidative stress in long-lived lipopolysaccharide-activated microglia. Clin. Exp. Pharmacol. Physiol. 39, 599 – 607
26. Sugaya, K., Chouinard, M. L., and McKinney, M. (1997) Induction of man-ganese superoxide dismutase in BV-2 microglial cells. Neuroreport 8,3547–3551
27. Chen, X., Choi, I. Y., Chang, T. S., Noh, Y. H., Shin, C. Y., Wu, C. F., Ko,K. H., and Kim, W. K. (2009) Pretreatment with interferon-� protectsmicroglia from oxidative stress via up-regulation of Mn-SOD. Free Radic.Biol. Med. 46, 1204 –1210
28. Ishihara, Y., Itoh, K., Ishida, A., and Yamazaki, T. (2015) Selective estro-gen-receptor modulators suppress microglial activation and neuronal celldeath via an estrogen receptor-dependent pathway. J. Steroid Biochem.Mol. Biol. 145, 85–93
29. Ishihara, Y., Kawami, T., Ishida, A., and Yamazaki, T. (2012) Tributyltininduces oxidative stress and neuronal injury by inhibiting glutathione S-transferase in rat organotypic hippocampal slice cultures. Neurochem. Int.60, 782–790
30. Itoh, K., Kawamura, H., and Asou, H. (1992) A novel monoclonal antibodyagainst carbohydrates of L1 cell adhesion molecule causes an influx ofcalcium in cultured cortical neurons. Brain Res. 580, 233–240
31. Takemoto, T., Ishihara, Y., Ishida, A., and Yamazaki, T. (2015) Neuropro-tection elicited by nerve growth factor and brain-derived neurotrophicfactor released from astrocytes in response to methylmercury. Environ.Toxicol. Pharmacol. 40, 199 –205
32. Ishihara, Y., Fujitani, N., Kawami, T., Adachi, C., Ishida, A., and Yamazaki,T. (2014) Suppressive effects of 17�-estradiol on tributyltin-induced neu-ronal injury via Akt activation and subsequent attenuation of oxidativestress. Life Sci. 99, 24 –30
33. Ishihara, Y., Shiba, D., and Shimamoto, N. (2006) Enhancement ofDMNQ-induced hepatocyte toxicity by cytochrome P450 inhibition.Toxicol. Appl. Pharmacol. 214, 109 –117
34. Ishihara, Y., Ito, F., and Shimamoto, N. (2011) Increased expression ofc-Fos by extracellular signal-regulated kinase activation under sustainedoxidative stress elicits BimEL upregulation and hepatocyte apoptosis.FEBS J. 278, 1873–1881
35. Kawai, T., and Akira, S. (2010) The role of pattern-recognition receptorsin innate immunity: update on Toll-like receptors. Nat. Immunol. 11,373–384
36. Kiningham, K. K., Xu, Y., Daosukho, C., Popova, B., and St Clair, D. K.(2001) Nuclear factor �B-dependent mechanisms coordinate the syner-gistic effect of PMA and cytokines on the induction of superoxide dismu-tase 2. Biochem. J. 353, 147–156
37. Xu, Y., Kiningham, K. K., Devalaraja, M. N., Yeh, C. C., Majima, H., Kasar-skis, E. J., and St Clair, D. K. (1999) An intronic NF-�B element is essentialfor induction of the human manganese superoxide dismutase gene bytumor necrosis factor-� and interleukin-1�. DNA Cell Biol. 18, 709 –722
38. Kairisalo, M., Korhonen, L., Blomgren, K., and Lindholm, D. (2007)X-linked inhibitor of apoptosis protein increases mitochondrial anti-oxidants through NF-�B activation. Biochem. Biophys. Res. Commun.364, 138 –144
39. Kiningham, K. K., Cardozo, Z. A., Cook, C., Cole, M. P., Stewart, J. C.,Tassone, M., Coleman, M. C., and Spitz, D. R. (2008) All-trans-retinoicacid induces manganese superoxide dismutase in human neuroblastomathrough NF-�B. Free Radic. Biol. Med. 44, 1610 –1616
40. Borrello, S., and Demple, B. (1997) NF kappa B-independent transcrip-tional induction of the human manganous superoxide dismutase gene.Arch. Biochem. Biophys. 348, 289 –294
41. Kaneko, M., Takahashi, T., Niinuma, Y., and Nomura, Y. (2004) Manga-nese superoxide dismutase is induced by endoplasmic reticulum stressthrough IRE1-mediated nuclear factor (NF)-�B and AP-1 activation. Biol.Pharm. Bull. 27, 1202–1206
42. Warner, B. B., Stuart, L., Gebb, S., and Wispe, J. R. (1996) Redox regulationof manganese superoxide dismutase. Am. J. Physiol. 271, L150 –L158
43. Das, K. C., Lewis-Molock, Y., and White, C. W. (1995) Activation ofNF-�B and elevation of MnSOD gene expression by thiol reducing agentsin lung adenocarcinoma (A549) cells. Am. J. Physiol. 269, L588 –L602
44. Chakravarty, S., and Herkenham, M. (2005) Toll-like receptor 4 on non-hematopoieticcells sustainsCNSinflammationduringendotoxemia, inde-pendent of systemic cytokines. J. Neurosci. 25, 1788 –1796
45. Lehnardt, S., Massillon, L., Follett, P., Jensen, F. E., Ratan, R., Rosenberg,P. A., Volpe, J. J., and Vartanian, T. (2003) Activation of innate immunityin the CNS triggers neurodegeneration through a Toll-like receptor 4-de-pendent pathway. Proc. Natl. Acad. Sci. U.S.A. 100, 8514 – 8519
46. Zorov, D. B., Juhaszova, M., and Sollott, S. J. (2014) Mitochondrial reactiveoxygen species (ROS) and ROS-induced ROS release. Physiol. Rev. 94,909 –950
47. West, A. P., Brodsky, I. E., Rahner, C., Woo, D. K., Erdjument-Bromage,H., Tempst, P., Walsh, M. C., Choi, Y., Shadel, G. S., and Ghosh, S. (2011)TLR signalling augments macrophage bactericidal activity through mito-chondrial ROS. Nature 472, 476 – 480
48. West, X. Z., Malinin, N. L., Merkulova, A. A., Tischenko, M., Kerr, B. A.,Borden, E. C., Podrez, E. A., Salomon, R. G., and Byzova, T. V. (2010)Oxidative stress induces angiogenesis by activating TLR2 with novel en-dogenous ligands. Nature 467, 972–976
49. Jin Jung, K., Hyun Kim, D., Kyeong Lee, E., Woo Song, C., Pal Yu, B., andYoung Chung, H. (2013) Oxidative stress induces inactivation of proteinphosphatase 2A, promoting proinflammatory NF-�B in aged rat kidney.Free Radic. Biol. Med. 61, 206 –217
50. Shao, W., Zhang, S. Z., Tang, M., Zhang, X. H., Zhou, Z., Yin, Y. Q., Zhou,Q. B., Huang, Y. Y., Liu, Y. J., Wawrousek, E., Chen, T., Li, S. B., Xu, M.,Zhou, J. N., Hu, G., and Zhou, J. W. (2013) Suppression of neuroinflam-mation by astrocytic dopamine D2 receptors via �B-crystallin. Nature494, 90 –94
51. Wiener, H. W., Perry, R. T., Chen, Z., Harrell, L. E., and Go, R. C. (2007) Apolymorphism in SOD2 is associated with development of Alzheimer’sdisease. Genes Brain Behav. 6, 770 –775
52. Wang, V., Chen, S. Y., Chuang, T. C., Shan, D. E., Soong, B. W., and Kao,M. C. (2010) Val-9Ala and Ile58Thr polymorphism of MnSOD in Par-kinson’s disease. Clin. Biochem. 43, 979 –982
53. Shimoda-Matsubayashi, S., Matsumine, H., Kobayashi, T., Nakagawa-Hattori, Y., Shimizu, Y., and Mizuno, Y. (1996) Structural dimorphismin the mitochondrial targeting sequence in the human manganese su-peroxide dismutase gene: a predictive evidence for conformationalchange to influence mitochondrial transport and a study of allelic as-sociation in Parkinson’s disease. Biochem. Biophys. Res. Commun. 226,561–565
Regulation of Microglial Proinflammatory Responses by SOD2
22816 JOURNAL OF BIOLOGICAL CHEMISTRY VOLUME 290 • NUMBER 37 • SEPTEMBER 11, 2015
at HIR
OSH
IMA
UN
IVE
RSIT
Y on Septem
ber 14, 2015http://w
ww
.jbc.org/D
ownloaded from
54. Akyol, O., Yanik, M., Elyas, H., Namli, M., Canatan, H., Akin, H., Yuce, H.,Yilmaz, H. R., Tutkun, H., Sogut, S., Herken, H., Ozyurt, H., Savas, H. A.,and Zoroglu, S. S. (2005) Association between Ala-9Val polymorphism ofMn-SOD gene and schizophrenia. Prog. Neuropsychopharmacol. Biol.Psychiatry 29, 123–131
55. Gałecki, P., Smigielski, J., Florkowski, A., Bobinska, K., Pietras, T., and
Szemraj, J. (2010) Analysis of two polymorphisms of the manganese su-peroxide dismutase gene (Ile-58Thr and Ala-9Val) in patients with recur-rent depressive disorder. Psychiatry Res. 179, 43– 46
56. Fullerton, J. M., Tiwari, Y., Agahi, G., Heath, A., Berk, M., Mitchell, P. B.,and Schofield, P. R. (2010) Assessing oxidative pathway genes as risk fac-tors for bipolar disorder. Bipolar Disord. 12, 550 –556
Regulation of Microglial Proinflammatory Responses by SOD2
SEPTEMBER 11, 2015 • VOLUME 290 • NUMBER 37 JOURNAL OF BIOLOGICAL CHEMISTRY 22817
at HIR
OSH
IMA
UN
IVE
RSIT
Y on Septem
ber 14, 2015http://w
ww
.jbc.org/D
ownloaded from
Itoh, Atsuhiko Ishida and Takeshi YamazakiYasuhiro Ishihara, Takuya Takemoto, Kouichi INFLAMMATORY RESPONSESAND CONVERGENCE OF OXIDATIVE STRESS TOLERANCEInduced in Activated Microglia: Dual Role of Superoxide Dismutase 2Neurobiology:
doi: 10.1074/jbc.M115.659151 originally published online July 31, 20152015, 290:22805-22817.J. Biol. Chem.
10.1074/jbc.M115.659151Access the most updated version of this article at doi:
.JBC Affinity SitesFind articles, minireviews, Reflections and Classics on similar topics on the
Alerts:
When a correction for this article is posted•
When this article is cited•
to choose from all of JBC's e-mail alertsClick here
http://www.jbc.org/content/290/37/22805.full.html#ref-list-1
This article cites 56 references, 11 of which can be accessed free at
at HIR
OSH
IMA
UN
IVE
RSIT
Y on Septem
ber 14, 2015http://w
ww
.jbc.org/D
ownloaded from