Embed Size (px)
Citation preview

修士学位論文
題目
SoL Mantra: Visualizing Library Update Complexity
Through Orbital Layout and Coexistence Coefficient
指導教員
井上 克郎 教授
報告者
Boris TODOROV
平成 30年 2月 7日
大阪大学 大学院情報科学研究科
コンピュータサイエンス専攻 ソフトウェア工学講座

平成 29年度 修士学位論文
Sol Mantra: Visualizing Library Update Complexity Through Orbital Layout and
Coexistence Coefficient
Boris TODOROV
内容梗概
In software development, software reuse has become a pivotal factor in creating and
providing high-quality software at a reduced cost. The reuse of a code creates dependen-
cies, which as they increase over time they become difficult to manage and could lead to
compatibility issues or bugs if not kept up to date. With newer version releases, come
various quality improvements, new features and issue fixes, but deciding whether or not
to adopt those is a difficult task for new developers and for large software with a lot of
dependencies.
To address these difficulties, we propose the SoL Mantra tool that visualizes update
opportunities by applying coexistence coefficient between libraries in a software ecosystem
based on which we display the information about the complexity of each update opportu-
nity.
The orbital layout provides the means to visualize the update opportunities and demon-
strate its merits by showcasing examples from the JavaScript ecosystem. Through these
examples, we further elaborate how maintainers can benefit from SoL Mantra’s visual
cues.
主な用語
Visualization
Library
Update
1
目 次
1 Introduction 4
2 Research Background 6
2.1 Research Body . . . . . . . . . . . . . . . . . . . . . . . . . . . . . . . . . . 6
2.2 Definitions . . . . . . . . . . . . . . . . . . . . . . . . . . . . . . . . . . . . . 7
2.3 Research Goals . . . . . . . . . . . . . . . . . . . . . . . . . . . . . . . . . . 7
3 Orbital Layout 8
3.1 Reasoning . . . . . . . . . . . . . . . . . . . . . . . . . . . . . . . . . . . . . 8
3.2 Benefits and Drawbacks . . . . . . . . . . . . . . . . . . . . . . . . . . . . . 9
3.2.1 Benefits . . . . . . . . . . . . . . . . . . . . . . . . . . . . . . . . . . 9
3.2.2 Drawbacks . . . . . . . . . . . . . . . . . . . . . . . . . . . . . . . . 9
4 Coexistence Coefficient 10
4.1 Definition . . . . . . . . . . . . . . . . . . . . . . . . . . . . . . . . . . . . . 10
4.2 The Co-usage Between Libraries . . . . . . . . . . . . . . . . . . . . . . . . 10
4.2.1 Coexistence Logic . . . . . . . . . . . . . . . . . . . . . . . . . . . . 10
4.2.2 Library Coexistence Mapping . . . . . . . . . . . . . . . . . . . . . . 11
5 Tool Concepts 13
5.1 Solar System Metaphor . . . . . . . . . . . . . . . . . . . . . . . . . . . . . 13
5.2 Visualization Design and Representation . . . . . . . . . . . . . . . . . . . . 13
5.3 Illustrative Example . . . . . . . . . . . . . . . . . . . . . . . . . . . . . . . 15
6 Evaluation 16
6.1 Experiments . . . . . . . . . . . . . . . . . . . . . . . . . . . . . . . . . . . . 17
6.1.1 Dataset . . . . . . . . . . . . . . . . . . . . . . . . . . . . . . . . . . 17
6.1.2 Empirical Study on Real World Projects . . . . . . . . . . . . . . . . 18
6.2 Survey Evaluation . . . . . . . . . . . . . . . . . . . . . . . . . . . . . . . . 22
6.3 Threats to Validity and Limitations . . . . . . . . . . . . . . . . . . . . . . 27
7 Conclusion 28
謝辞 29
2
付録 30
参考文献 31
3

1 Introduction
For the past decade, the predominant practice within software engineering has been
the usage of third-party software, also known as software libraries[6]. The core lies in
the concept of software reuse, which reduces the man-hours cost when developing new
software, inherited safety and stability from a code that is used by a vast majority of
developers. But as most good things it has its drawbacks, as time passes, the libraries
grow older and new versions are released, providing various benefits which include but are
not limited to, new features, bug fixes, optimization.
The new versions also carry their own risks for the software developers that use them
in their projects. Updating to a newer version could bring the before mentioned benefits,
but can also cause devastating problems to the software[5],[21]. These include but are
not limited to, potential compatibility issues with other libraries adopted by the software,
requirements to restructure different sections of the code, due to method name alterations.
To use these libraries, the developers must add references within their code to the library
itself, which creates a dependency to the said library[8]. Researchers have observed and
document empirically how software developers interact and deal with library updating.
Some even conclude based on a large sample of Java clients that use Maven libraries, that
high number of systems keep their dependencies outdated [11]. Others provide in-depth
analysis on the impact of newer version releases and what changes within them drive
developers to adopt newer versions [2], [3].
Software developers, have to carefully evaluate the potential risks while making decisions
”if” and ”when” to update their software’s library dependencies. There exist studies that
have been conducted to express the concerns regarding incompatibility when updating [16],
[10]. On the other hand, not updating a library could also lead to problems, such as the
heartbleed bug1. To keep those bugs from occurring the libraries must evolve over time,
making additions to their functionalities and addressing various issues that the previous
version might have. This evolution is represented by the releases and their corresponding
versions supported by documentation.
This paper’s goal is to create a tool that assists the software developers in recognizing
potential risks[14],[7] while considering a library in their software for an update. To
this end we adopted a relatively new binary concept called coexistence coefficient[13]
and integrated together with the intricate orbital layout to create a interactive visual
1http://heartbleed.com/
4

aid - the Software Library Mantra tool (SoL Mantra). The tool provides information
whether or not a system dependency is outdated, by using simple and intuitive visual
elements. Furthermore, to illustrate the potential risk from updating a library, we evaluate
the popular library usage in the ecosystem and offer suggestions, which libraries should
be updated together if either of them is considered for updating. The main technical
challenges in achieving results lie in finding a balance between visualization technique and
providing enough information without it being unreadable.
To evaluate the tools effectiveness we conducted an experiment consisting of 23 JavaScript
based software systems acquired from its respective software ecosystem - Node Package
Manager (npm)2. We will be presenting two of these projects to showcase our results3.
Finally we evaluate the tools general comprehension and understanding through an on-line
survey.
The contributions of this paper are:
1. We successfully adopted a new methodology that observes library relations based on
popular usage within the language ecosystem.
2. We incorporated the relevant date onto a interactive visual plane, with easy to read
visual cues for each relevant information.
3. We conducted experiments using real world systems. Based on those results we
evaluated the tool and its readability and understanding capability through a survey.
The remainder of the paper is organized as follows. Section 2 describes briefly the
background and basis of the research. Section 3 and 4 focus on defining and explaining
the reasoning behind the core concepts of the paper - Orbital Layout and Coexistence
Coefficient. Following that, Section 5 aims to explain how each element finds its place onto
the visualization tool with examples, followed by explanation. In section 6 we demonstrate
the evaluation of the tool, followed by related work and finally concluding the paper in
section 8.
2https://www.npmjs.com/3full result page at: https://goo.gl/AxkUsR
5
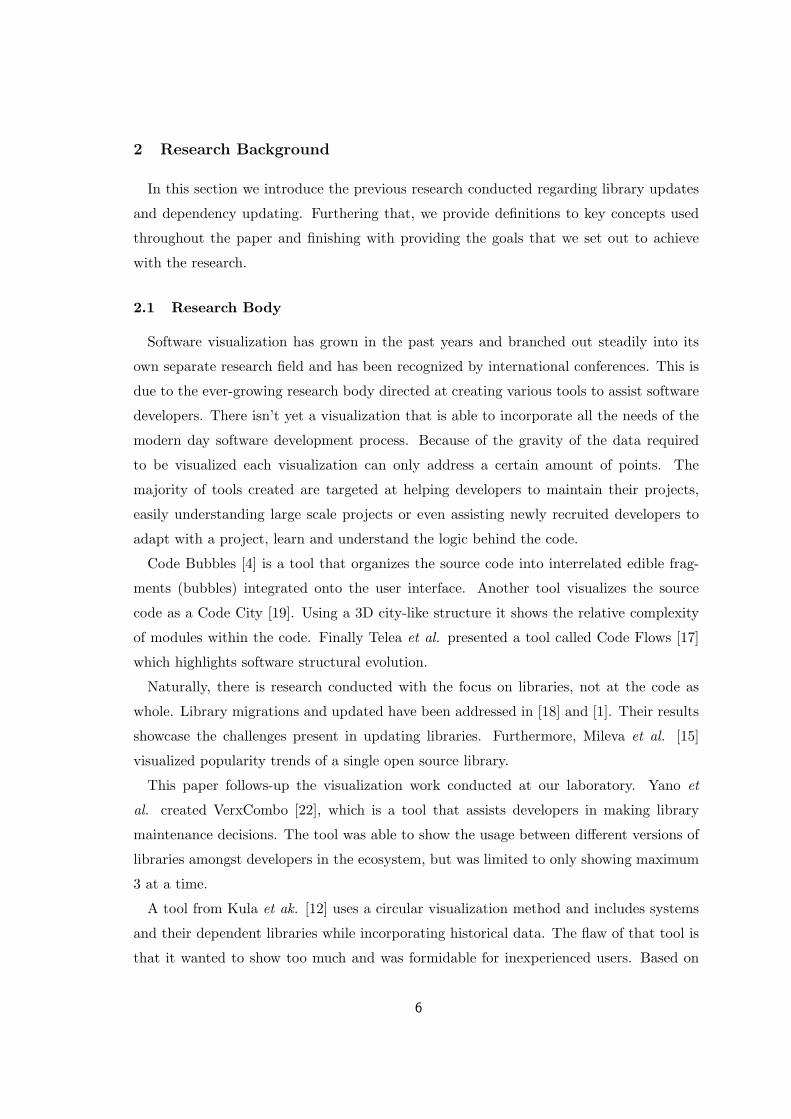
2 Research Background
In this section we introduce the previous research conducted regarding library updates
and dependency updating. Furthering that, we provide definitions to key concepts used
throughout the paper and finishing with providing the goals that we set out to achieve
with the research.
2.1 Research Body
Software visualization has grown in the past years and branched out steadily into its
own separate research field and has been recognized by international conferences. This is
due to the ever-growing research body directed at creating various tools to assist software
developers. There isn’t yet a visualization that is able to incorporate all the needs of the
modern day software development process. Because of the gravity of the data required
to be visualized each visualization can only address a certain amount of points. The
majority of tools created are targeted at helping developers to maintain their projects,
easily understanding large scale projects or even assisting newly recruited developers to
adapt with a project, learn and understand the logic behind the code.
Code Bubbles [4] is a tool that organizes the source code into interrelated edible frag-
ments (bubbles) integrated onto the user interface. Another tool visualizes the source
code as a Code City [19]. Using a 3D city-like structure it shows the relative complexity
of modules within the code. Finally Telea et al. presented a tool called Code Flows [17]
which highlights software structural evolution.
Naturally, there is research conducted with the focus on libraries, not at the code as
whole. Library migrations and updated have been addressed in [18] and [1]. Their results
showcase the challenges present in updating libraries. Furthermore, Mileva et al. [15]
visualized popularity trends of a single open source library.
This paper follows-up the visualization work conducted at our laboratory. Yano et
al. created VerxCombo [22], which is a tool that assists developers in making library
maintenance decisions. The tool was able to show the usage between different versions of
libraries amongst developers in the ecosystem, but was limited to only showing maximum
3 at a time.
A tool from Kula et ak. [12] uses a circular visualization method and includes systems
and their dependent libraries while incorporating historical data. The flaw of that tool is
that it wanted to show too much and was formidable for inexperienced users. Based on
6
these previous works we created our visualization tool, which uses an intuitive visualization
and strives for balanced between relevant information and visibility, while adopting a new
popularity measurement unit.
2.2 Definitions
For the purpose of this paper we define the following terminologies as follows:
1. Software - program, whose dependencies to other libraries are our concern for
visualization.
2. Software Library - the programs used by the software or other libraries, forming
library dependency directed graph.
3. Visualization - the representation of an object and set of information on a chart,
plot or other image
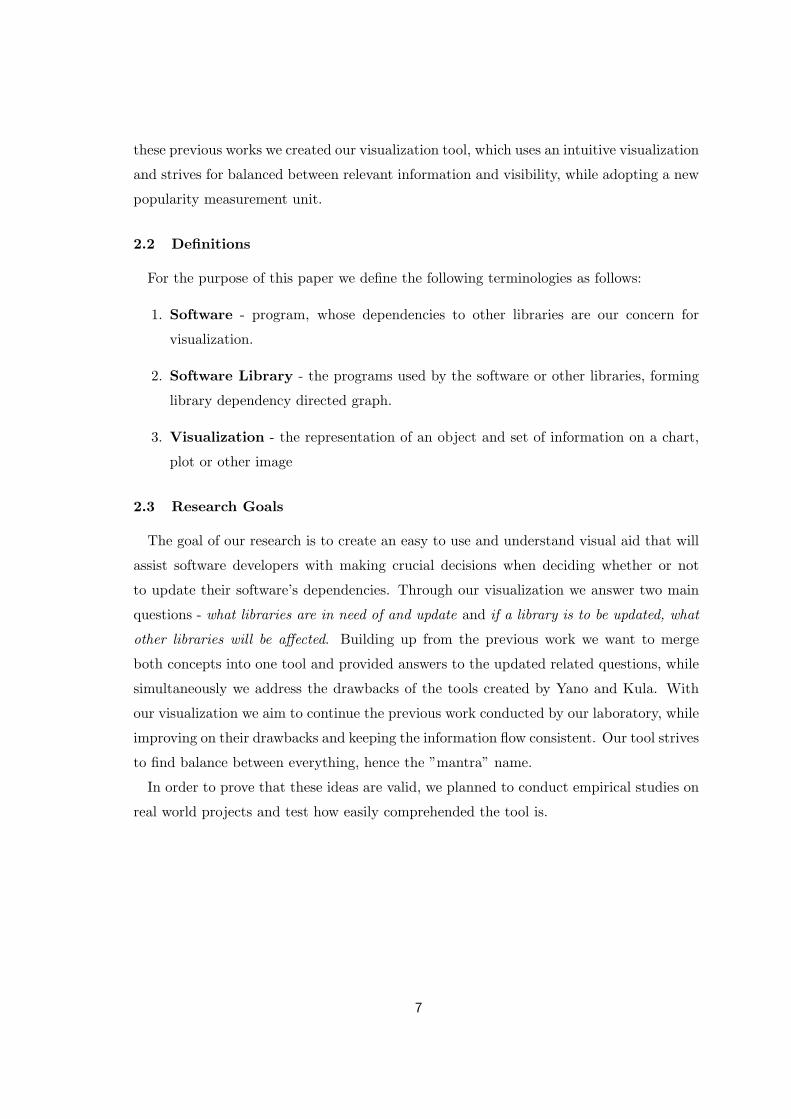
2.3 Research Goals
The goal of our research is to create an easy to use and understand visual aid that will
assist software developers with making crucial decisions when deciding whether or not
to update their software’s dependencies. Through our visualization we answer two main
questions - what libraries are in need of and update and if a library is to be updated, what
other libraries will be affected. Building up from the previous work we want to merge
both concepts into one tool and provided answers to the updated related questions, while
simultaneously we address the drawbacks of the tools created by Yano and Kula. With
our visualization we aim to continue the previous work conducted by our laboratory, while
improving on their drawbacks and keeping the information flow consistent. Our tool strives
to find balance between everything, hence the ”mantra” name.
In order to prove that these ideas are valid, we planned to conduct empirical studies on
real world projects and test how easily comprehended the tool is.
7
3 Orbital Layout
Here we provide the reasoning behind selecting our visual concept and provide the added
benefits and drawbacks for using it.
3.1 Reasoning
In order to create a visualization tool, firstly we need to find the correct visual concept.
Kula’s work had a solid design but was struggling with the amount of information showed,
while Yano’s VerxCombo had the limitation of showing only 3 libraries at a time. Contin-
uing, we needed to find a middle ground solution between both, which could also handle
their drawbacks. This resulted in the selection of the orbital layout concept.
The visualization of a software as a solar system was originally adopted in 2004 by
Graham et al.[9] in which each planet appears as a Java class and its direct orbits show in-
heritance levels, deriving from the Linux kernel 3D evolutionary animation. The metaphor
is effective at representing size and correlations - planets and orbits. To the best of our
knowledge there aren’t any other works that have adopted this concept.
With the appearance of the powerful d3.js library 4 a lot of different visualizations
become available for general use with the added benefit of being web based, which meant
easy access and less demanding on the personal computers of developers. With an extensive
community creating a vast number of models using the library, we made the decision to
make use of it in our research. We initially tried using some traditional dependency
visualization techniques, such as, hexagonal binning 5 and the dependency wheel 6. After
extensive testing, the results weren’t satisfactory and we struggled how to properly portray
a binary dependency between libraries. This lead us finally to the orbital layout 7.
Similarly, we also made the same conclusions as [9], and decided to use to represent a
software system in a similar fashion, while focusing primarily on the libraries the software
uses and tackling the update problem. Finally, this methodology provided us with the
right way to visualize a binary relationship, whilst showing the entirety of the software
system, without jeopardizing visibility too much.
4https://d3js.org/5https://github.com/d3/d3-hexbin6http://www.redotheweb.com/DependencyWheel/7https://github.com/emeeks/d3.layout.orbit
8

3.2 Benefits and Drawbacks
As every visual concept, the orbital layout has its set of benefits and drawbacks.
3.2.1 Benefits
The main benefit that the Orbital Layout provides us is the ability to visualize elements
that are related in more than one level, while keeping things in a clear manner. The
metaphor serves as a natural way to represent a software as a system, therefore should
be easy for new developers or inexperienced developers to quickly grasp the scope of the
system with a quick glance. Another added perk is the ability to bind various data to
different elements such as: rotation, rotation speed, rotation direction, color, element size.
3.2.2 Drawbacks
The drawbacks of this concepts only begin to appear once a huge system with a lot of
dependencies emerges. With a lot of elements plotted onto the visualization it will either
expand too much to be viewable on a single monitor. The reverse option is also possible,
where the elements get too clustered and become difficult to read. This concept is mostly
effective until mid-sized softwares, while struggling to find the balance when applied to
bigger ones.
9

4 Coexistence Coefficient
Here we dive into a deeper and detailed explanation regarding the coexistence coefficient
metric and how we apply it to our research.
4.1 Definition
Coexistence coefficient is defined by Kula et al. [13] as - ”Coexistence pairing examine
and explores occurrences of specific combinations between software components”. In this
paper it is depicted as a binary relation between a pair of libraries (2) within a specific
software and its ecosystem, where those two libraries are used by at least one common
library or common software.
4.2 The Co-usage Between Libraries
(a) Coexistence Logic (b) Mapping the Coexistence
図 1: Library Coexistence Mapping
4.2.1 Coexistence Logic
To further elaborate the logic behind the coexistence coefficient we present an example
of coexistence between libraries. Based on the previous sections definition we know that
coexistence is between a pair of libraries, therefore, we direct the attention to Fig. 1a where
the pair is represented by Library A and Library B. Similarly, Q, D, J, F, E, Z are also
libraries within the same language ecosystem. These five libraries collectively use the pair
in focus, depicted by the directed edges. In this example, Library A is used by Q, D, J, F,
10

E and Library B is used by J, F, E, Z. We denote this usage as: UsersA = {Q,D, J, F,E}and UsersB = {J, F,E, Z}.Fig. 1a depicts the second part of the coexistence coefficient definition, which is the
common combination occurrences. In detail, both Library A and Library B have com-
mon users - Library J, F and E. These three users reference the library pair in their
software code. We denote these common users with the following notation: UsersA ∩UsersB = {J, F,E}. We also define coexistence coefficient (cc) of A for B as follows:
CCA(B) =|UsersA ∩ UsersB|
|UsersA|(1)
meaning, Library A’s cc for Library B’s is the ratio of A’s users which are simultane-
ously B’s users.
Next, we demonstrate the equation with a sample data set. We select two libraries from
the npm ecosystem - babel-core and mocha. The respective total users are - babel-core -
6,884 and mocha - 3,1658. The two libraries share a coexistence relation, because they
share 3,158 common users. Applying these sample numbers to equation 1 we have the
following model:
CCbabel-core(mocha) =6884 ∩ 3165
6884=
3158
6884= 0.4587 (2)
The result from equation 2 shows that the cc between babel-core and mocha is 0.4587
(45.87%), meaning that almost half of babel-core’s users are also mocha’s users. On the
other hand, mocha’s cc for babel-core is 0.9978 (99.78%), concluding almost all of mocha’s
users are also babel-core’s users.
4.2.2 Library Coexistence Mapping
In order to keep things consistent and to avoid redundancy, we will explain briefly how
the coexistence is represented onto an orbital setup. The detailed explanation and logic
will be explained thoroughly in the following section.
Fig. 1b depicts a small example of an orbital layout, including a core element (software),
planet element (library) and a moon (coexisting library). In this example the software8as of July 2017, dataset collection period
11

name is not of relevance, but it is a software that uses two libraries. We take the two
libraries from the coexistence logic section explanation. In this case, Library A becomes
babel-core and Library B - mocha. Both are used by the software and are plotted as
a planet element, directly connected to their parent - the Core (Software). In order to
illustrate the binary relation between both of them we make use of the moon element.
The moon is a direct representation of the result from equation 2. The moon and planet
hold essentially the same name - mocha but fundamentally hold a different meaning. As
a planet, mocha (B) is a library used by the software, while as a moon of babel-core (A),
it is depicted as a coexisting library with its parent planet.
12

5 Tool Concepts
In this section we show and explain how both the orbital layout and the coexistence
coefficient fit together. First we present the solar metaphor and the thoughts behind the
selection. Furthering, we individually note each element of the tool and what it represents,
as well as, what information it provides. Finally we demonstrate how all elements fit
together with an illustrative example.
5.1 Solar System Metaphor
To achieve our goals for the tool, we had to select the correct visualization. The solar
system visualization metaphor, served as the correctly corresponding analogy, due to it
being similar to a software system. A software system, contains a core that binds all the
elements together, i.e. the software itself. The elements it uses in terms of foreign objects
(libraries) are ”attracted” by it and are in its orbits. Accordingly, the similar analogy
applies for the coexistence between the libraries within the software, but their duality
severs to represent different information.
5.2 Visualization Design and Representation
In order to read, comprehend and evaluate the results of our visualization, we firstly
defined the data element in previous sections. Here we define individually the visual
elements followed by an example.
• Core (Sun) - being a center of a solar system, holds similar meaning within our
visualization. It denotes the software, which uses libraries within its structure. The
color of the sun element is orange and is unique within the visualization. For each
separate software, which has a SoL Mantra created for it, the name of the software
will be written in the center and denoted by a sun element.
• Planets - are the direct representation of the libraries used by the software. Each
planed that orbits the sun, denotes a distinct object and are not repeated as such.
In detail, if a library uses 6 libraries, there will be a total of 6 planet visualization
objects plotted in orbits around the sun.
• Color - serves to denote if a library used by the software is up-to-date or outdated.
Each planet element will be highlighted with either a red color, i.e. the library is
13

outdated, or a green color - up-to-date. Planets can not be both or have other colors
filling their element.
• Rotation - assists the color element. There are two states: rotating and static.The
static planets, also highlighted in green color, are libraries that are up-to-date, while
the rotating, filled with red, planets are outdated. The goal is to make the outdated
count of libraries easily visible, while making the up-to-date libraries more passive
and ”safe”.
• Moons - represent the coexisting libraries. Moons are created after the coexistence
coefficient is calculated for the library pairs in the software. Only planets are able to
have moons. If a planet has no moons (0) it means it has no coexisting library with
it within the software, although it can be a moon of another library (planet). Moons
are duplicates to the libraries that the software uses with the purpose of showing
which libraries should be considered to be updated together. In detail, if a planet
that has a moon or moons is denoted with a red color, requires examination of its
coexisting elements to evaluate the update complexity and potential candidates to
be updated together.
• Unused Visual Elements - are parts of the visualization that re currently not
holding any specific data meaning, but are possible for future work additions or
serve to provide better visual aesthetics. Such elements are: the size of the planets,
planet distance from the sun, rotation speed and direction.
表 1: Ranza Dependencies
Library Coexistent Library (cc)
mocha None
supports-color mocha(99.09%)
glob mocha(23.05%), supports-color(1.59%)
char-spinner glob(100%), mocha(100%), supports-color(100%)
bluebirdchar-spinner(0.2%), glob(49.49%),
mocha(12.32%), supports-color(0.85%)
babel-corebluebird(95.45%), char-spinner(0.76%), glob(95.45%),
mocha(45.87%), supports-color(3.17%),
14
5.3 Illustrative Example
Through an example visualization, we will demonstrate each representation. To this end,
we will use a sample package from the npm repository - ranza9, a dependency checker
which depends on 6 libraries as shown in Table 1 - mocha, supports-color, glob, char-
spinner, bluebird, babel-core. The table also shows each libraries coexisting library within
the software and the corresponding calculated cc percentage.
Fig. 2a illustrates the SoL Mantra of the ranza10 package with all the before mentioned
visual representations present. In the center stands the software as the sun element.
All 6 library dependencies are plotted as individual planets orbiting the core with their
respective binary coloring schema. Only one library is in green, which means that only
char-spinner is the latest version available. Accordingly, the remaining ones are outdated,
and the planet elements are rotating around their orbits11.
Next up, we navigate with the cursor to observe the coexistence between the libraries.
Fig. 2b depicts a highlighting event when the mouse cursor is over a specific planet. In the
example shown, the library in question is babel-core and it coexists with all the remaining
libraries in the ranza package. Individual coexistence coefficients are located besides the
coexisting library and rounded up to two decimals.
The coexistence coefficient percentage, holds two meanings. Firstly, it denotes that
there is a binary relationship between the given pair as explained. Secondly, it shows
the magnitude of the coexistence, meaning that how often the pair are used together.
This provided information serves to evaluate the potential risks that are present while
considering babel-core for an update within the ranza software. For example, babel-core
and bluebird have a cc of 95.45%, meaning that almost all of babel-core’s users are also
bluebird’s users. This usage suggest that these libraries work well together and should be
considered for a simultaneous update. Similarly, mocha has a cc of 45.87%, therefor the
majority of users, have the library pair in their source code. Although not as strong cc as
the previous example, it still should influence a careful consideration while updating.
9https://github.com/raphamorim/ranza10data from July 201711not visible on a static image
15

(a) Ranza
(b) babel-core
図 2: Ranza SoL Mantra
表 2: Collected Data Summary
Data Stars Pull Requests Issues Commits Contributors Releases Branches Dependencies Dependents
Minimum 917 0 0 186 15 11 1 0 330
Maximum 67,706 180 690 8640 1595 396 103 47 24,432
Mean 9914 30 149 1492 158 77 17 9 4272
Median 11,863 21 168 2162 177 89 14 7 2279
Tested Packages: express, request, browserify, grunt, pm2, socket.io, mocha, gulp-uglify, cheerio, passport, hapi, react, karma,
pug, mysql, less, mongodb node.js driver, jshint, morgan, webpack, restify, magick, jsdom
6 Evaluation
In order to evaluate the tool, firstly we gathered a sample data set and created a total
of 23 distinct visualizations of the corresponding software packages. Here we also show
how our tool works on real world projects. Based on the collected data we perform an
empirical study of the 23 packages and show case 2 of them as an example and proof of
concept. Continuing, after successfully conducting the real world project experiments, we
generated an on-line survey with the goal of evaluating our tools comprehension. The
participants in it were not given any prior knowledge to the tool and produced interesting
results.
16
6.1 Experiments
First part of our tool evaluation consists of a creating visualizations and analyzing the
collected software packages from the npm repository.
6.1.1 Dataset
Since the tool mostly consists of JavaScript, we decided to apply it to other projects
within the ecosystem. The JavaScript repository hosts over 230,000 packages with new
ones being constantly added[20]. To this end we selected one of the most popular projects
for 2016 amongst developers12. Initially there were 30 projects but because some of them
had no library dependencies or less than 2, we had to discard them. This resulted in
having a dataset of 23 packages from the npm ecosystem. Fig. 2 shows the general data
and the names of the projects tested. We show that through the mean and median of
the stars13 that the projects are indeed popular. Furthermore, with the average commits,
issues, contributors and releases we can say with certainty that the projects are still active
and being worked on. Finally, we can see that most of them have a relatively high number
of other depending packages, with the exception of pm2 which has only 330.
We implemented a script based tool to gather and collect the data needed for the
visualization. In order to generate our data and calculate cc, we used packages from the
npm repository. We relied upon packages such as: is-outdated package14 to detect if the
libraries are outdated or not. We used the output of it to compare with the package.json
file available in the local folder. If the version matched, we considered them up-to-date and
alternatively, if they do not, we apply the outdated tag. For the coexistence coefficient,
we used several packages in unison. We began with generating the users for every package
using get-dependencies package15. After that we created the pairing sets of libraries using
js-combinatorics package16. Lastly, we extracted the common users between each set using
comparray package17 and calculated the final cc score.
In this paper we will demonstrate two distinct examples from our dataset in order to
illustrate the use of our visualization and how a developer would use our tool and the
12experiments conducted July 201713github ranking metric14https://github.com/rogeriopvl/is-outdated15https://github.com/SharonGrossman/get-dependencies16https://github.com/dankogai/js-combinatorics17https://github.com/JonathanPrince/comparray
17
information provided. The first example is react18, which is the highest starrted package
amongst the 23 packages in the dataset. For the second example, we will use cheerio19 to
showcase how our tool performs on larger systems.
6.1.2 Empirical Study on Real World Projects
1. Example - react
React is a popular library used for interface creation developed and maintained by
Facebook.
From Fig. 3a we can see the generated SoL Mantra overview for the react package. As
explained in Section 5 the software is represented by the core element in orange. The 5
dependencies the software uses are represented through the 5 planets orbiting the core -
fbjs, object-asign, create-react-class, prop-types, loose-envify. Continuing, 2 of those are
colored green, indicating that they are up to date20 with the latest version available on the
npm repository21. Alternately, the remaining three, colored in red, libraries are outdated
and should be considered for an update.
We focus our attention towards the outdated libraries - fbjs, object-assign, loose-envify
which present an update opportunity and proceed to evaluate the related update complex-
ity through the visualization elements. Using the cursor we are able to navigate through
the tool and focus each planet element individually. Hovering over it, highlights its moons
and shows the coexistence coefficient that they have with their parent.
Firstly we check loose-envify. The library has 2 coexisting libraries within the react
package (Fig. 3b) and both have 100% cc score. This shows us that these libraries
are used all of the time together within the npm ecosystem and therefor have strong
coexistence. With such high cc score we can safely say that when deciding whether or not
to update loose-envify, we must consider its coexisting libraries for an update, otherwise
risking potential failures, incompatibilities. This case presents a simple decision because
of the high score present, although our visualization doesn’t tell the developers that they
have to update. The decision ultimately depends on the developer and other factors.
Next we have fbjs (Fig. 3c which has 3 coexisting libraries - loose-envify, object-assign,
prop-types. We see that fbjs has high cc score with two of them - 95.7%. Although
not 100% like the previous case, the score remains on the high end. Based on that we
18https://github.com/facebook/react19https://github.com/cheeriojs/cheerio20as of July 201721latest main version, not including beta versions
18

(a) React, SoL Mantra overview with its 5 dependencies: 2 up-to-date and 3 update
opportunities
(b) loose-envify update complexity
(c) fbjs update complexity
図 3: React SoL Mantra with 3 complex update opportunities
apply the same reasoning as loose-envify and conclude that if an fbjs update is considered,
so must be object-assign, prop-types. In this example prop-types is already up-to-date
19

and could be ignored while evaluating the complexity. Lastly, we have a 23.16% cc with
loose-envify. This cc score is particularly low but still means that 1 in 5 fbjs users use
both libraries together. Additionally, with loose-envify being an update candidate, and
considering that fbjs coexists with it, shows the entangled complexity that exists between
libraries. Following that, we should re-evaluate the update complexity of loose-envify.
The last outdated library is object-assign22. It has only one coexisting library - prop-
types with 40.11% cc. Because prop-types status we can safely update this package’s
version, as long as, it is the only one considered for an update. Arguably, if we have to
consider the entire system for an update, through the cc scores we can concretely deduce
that all of the outdated libraries should be updated together.
図 4: Cheerio SoL Mantra - 11 outdated and 4 up-to-date libraries.
22not shown with a figure
20

2. Example - cheerio
For the second example we will demonstrate how a software with a lot of libraries is
represented. To this end we selected the cheerio package which provides implementation
of core jQuery23 for servers.
Cheerio compared to the previous example, references more library packages in its code.
Fig. 4 shows the generated SoL Mantra overview of the package. Cheerio uses 15 libraries
in total, 11 outdated and only 4 up-to-date24. The up-to-date libraries in the package are
expect.js, entities, dom-serializer and css-select. All of them have high moon count, but
because the package is already using the latest version of them, we can safely continue to
evaluate the complexities of the remaining 11. In cases like cheerio, where the number of
used packages and cc between them is abundant, even the up-to-date libraries and their
cc’s could be evaluated while making update decisions.
Continuing with the outdated ones, we are unable to show each and everyones cc and
their scores but we will summarize our findings. The full example could be seen on the
tool’s page. Out of the 11 there are 6 libraries with comparatively high coexistence count
than the others - istanbul, coveralls, parse5, htmlparser2, benchmark and loadash. In detail
istanbul has 5 libraries with 3 of them having a cc score of 92.87%, one with 69.53% and
the least having 1.16%. Coveralls with 7 coexisting libraries is a similar case as istanbul.
Out of the 7, there are 5 that have a cc score of 96.18% and similarly 69.92% followed by
3.66%. The remaining ones also follow the same pattern, therefore we will not be listing
them as detailed.
The conclusion from just those 5 libraries is that within the cheerio package, there
is a high amount of co-used libraries and is an extreme case when considering update
complexity. Our tool manages to capture and visualize all this data, although the gravity
of it begins to limit the visual area but still remains readable
Lastly in this example, we are able to observe an interesting case, where xyz package does
not have any coexistence on its own, but coexists with all the remaining libraries. The cc
scores it has with others vary between 0.05% with lodash, up to 48% with dom-serializer.
Real World Evaluation Discussion
In conclusion, in both examples, our tool flagged the outdated libraries effectively. Even
in a bigger system like cheerio all 11 outdated flags were clearly detectable. Through cc23https://jquery.com24as of July 2017
21

we evaluate the complexity of each update opportunity. In smaller systems like react the
cc count wont be high but the score can vary the same way it does with bigger systems.
In the bigger systems the cc count is usually high and therefore the update complexity is
more intricate and must be carefully evaluated.
6.2 Survey Evaluation
With the examples we successfully demonstrated how through cc we were able to show
how each libraries are used together. To further our evaluation, we tested through an
on-line survey the usage comprehension and readability of our tool, while in the hands
of people that have never used it before. The survey was divided in 4 sections - pre-
task questions, general comprehension, coexistence coefficient comprehension, post task
questions.
1. Pre-task questions
Here we requested general information of the survey users, such as age, affiliation and
prefer or used language in their environment. More than half of the users are aged 25-30
and around 30% are 18-24 years old. Most of them are still in the university, although we
managed to receive one sibmission from a professional working in the field of computer
science. Lastly the most used coding language amongst the participants is split between
Java and Python followed by C and C++.
2. General Comprehension
In this part of our survey we wanted to evaluate how easy it is for a new users to handle
our tool while providing them with only limited information and general legend on how
to read the tool. Firstly they had to answer which is the software represented, to which
all of them answerd with 100% accuracy. The last two questions were focused on library
usage information. Almost all gave correct answers regarding number of used libraries and
outdated ones.
Based on the results from this section we conclude that the basics visualization concepts
of our tool are easy to understand for people without much software development experi-
ence, hence it should be also easy for experienced developers. In detail, the high answer
accuracy suggests that the general information is easy to understand and see.
22

3. Coexistence Coefficient Comprehension
This section is divided into two parts with the first part aiming to see if people under-
stood the coexistence coefficient and how to generally read it. The second part’s goal is
to assess the update complexity comprehension with our visualization. We gave our defi-
nition for coexistence and asked the participants if they understood it and most asnwered
yes. Following that, we asked them with multiple choices, which libraires didnt have any
coexisting ones within the system. The majority (63.2%) answered this question correctly,
with 21.1% giving a partially correct answer. Lastly, we asked them to tell us what is
the highest cc count in this software. Overwheming part of the participants also gave a
correct answer to this question - 78.9%. Here we can conclude that the general idea for
coexistence is easy to understand in a short time, while exploring the tool, provided the
definition is present.
To understand if the update complexity is easily comprehendable we presented the users
with 4 cases and asked them on a scale from Further investigate (1) to Safe to update(5)
seperately.
表 3: Update Complexity Comprehension Cases Information
Case Library Coexisting Libraries
1 mocha None
2 eslint-plugin-chai-friendly None
3 bluebird
eslint-plugin-chai-friendly(0.08%), safe-buffer(1.56%),
chai-as-promised(4.37%), lodash.isplainobject(5.75%),
qs(13.63%), chai(30.28%), eslint(41.33%), mocha(48.9%)
4 eslint eslint-plugin-chai-friendly(0.24%)
Table 3 shows the distinct cases with the list of coexisting libraries. Case 1 and 2 as
shown have no coexisting libraries. We asked the users to asses the update complexity of
mocha and eslint-plugin-chai-friendly to observe how the participants would evaluate the
risk based on the coexistence coefficient definition provided.
Mocha has no coexisting library, therefore on the mentioned scale the absolute correct
answer is ”Safe to update(5)”. As seen on Fig. 5, 10 of our participants answered correctly,
followed by 5 giving a slightly lower answer on the scale, which is still considered accurate.
The remaining 4 answers are considered wrong in this case.
23

図 5: Case 1 result summary
図 6: Case 2 result summary
Similarly, the second case also included a library with zero dependencies. We can see
from Fig. 6 that the answers are similar with the first case. Based on the results we can
conclude that when there are no coexisting libraries it is easy for new users to assess the
risks when using the SoL Mantra tool.
For the third case we presented them with the library with the highest cc count in the
example visualization - bluebird. The coexisting libraries and their respective cc score can
be seen in Table. 3. For this case, the expected answer is ”Further investigate” in terms of
making an update decision. The participants properly understood the update complexity
and 15 of them gave the correct answer, as seen on Fig. 7. The result could be interpreted
in two ways: either the participants really understood the complexity or because it had a
lot of moons they decided it must be the correct answer. Both assessments are generally
correct, but the important thing is that our users aren’t specialists.
24

図 7: Case 3 result summary
図 8: Case 4 result summary
For the last case, we provided a library with only 1 dependency. We wanted to see how
will the participants evaluate such a case. Fig. 8 highlights the results from the survey.
The eslint has a cc score of 0.24% with its coexisting library. Because of that it isn’t
considered a high complexity update opportunity, if evaluated on its own. Due to the
nature of this case, the expected answer is not a strong 1 or 5 from our scale. Accordingly,
the majority of the participants also evaluated the case the same way as us. Although the
absolute accurate answer is a 3, the adjacent ones are also acceptable.
To conclude, amongst our survey users, the majority managed to accurately grasp the
concept of coexistence coefficient applied to our visualization and made accurate update
complexity conclusions.
25
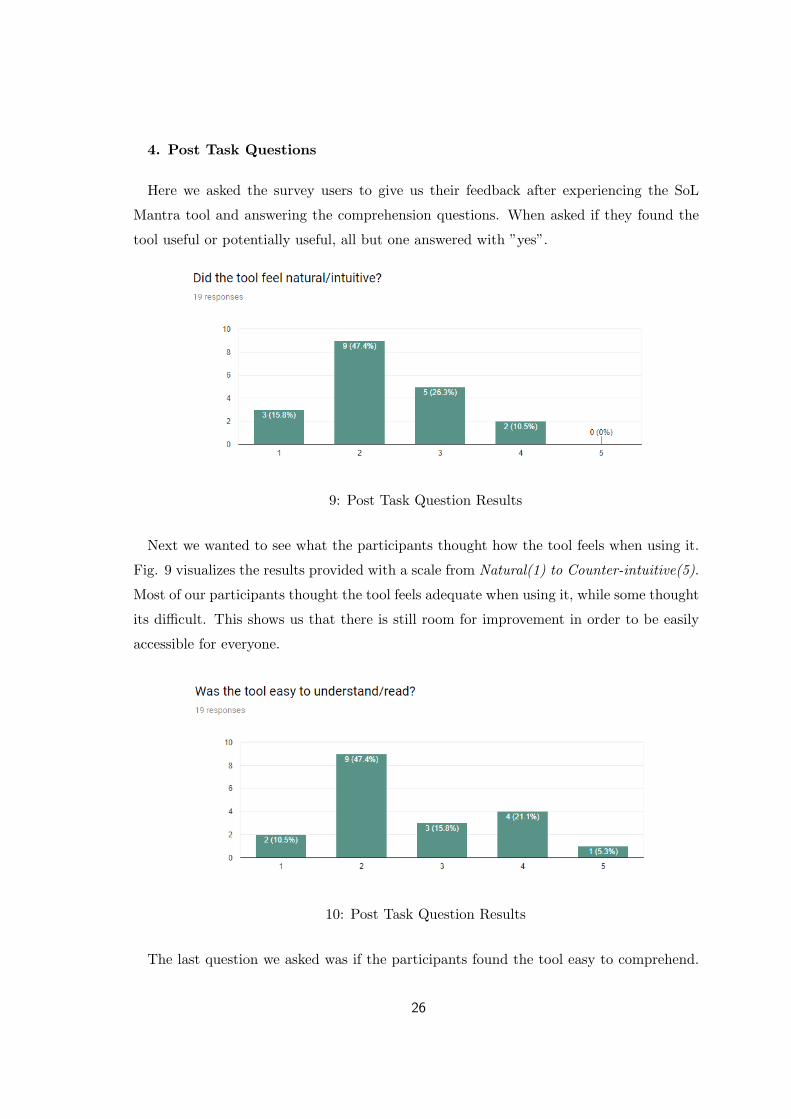
4. Post Task Questions
Here we asked the survey users to give us their feedback after experiencing the SoL
Mantra tool and answering the comprehension questions. When asked if they found the
tool useful or potentially useful, all but one answered with ”yes”.
図 9: Post Task Question Results
Next we wanted to see what the participants thought how the tool feels when using it.
Fig. 9 visualizes the results provided with a scale from Natural(1) to Counter-intuitive(5).
Most of our participants thought the tool feels adequate when using it, while some thought
its difficult. This shows us that there is still room for improvement in order to be easily
accessible for everyone.
図 10: Post Task Question Results
The last question we asked was if the participants found the tool easy to comprehend.
26
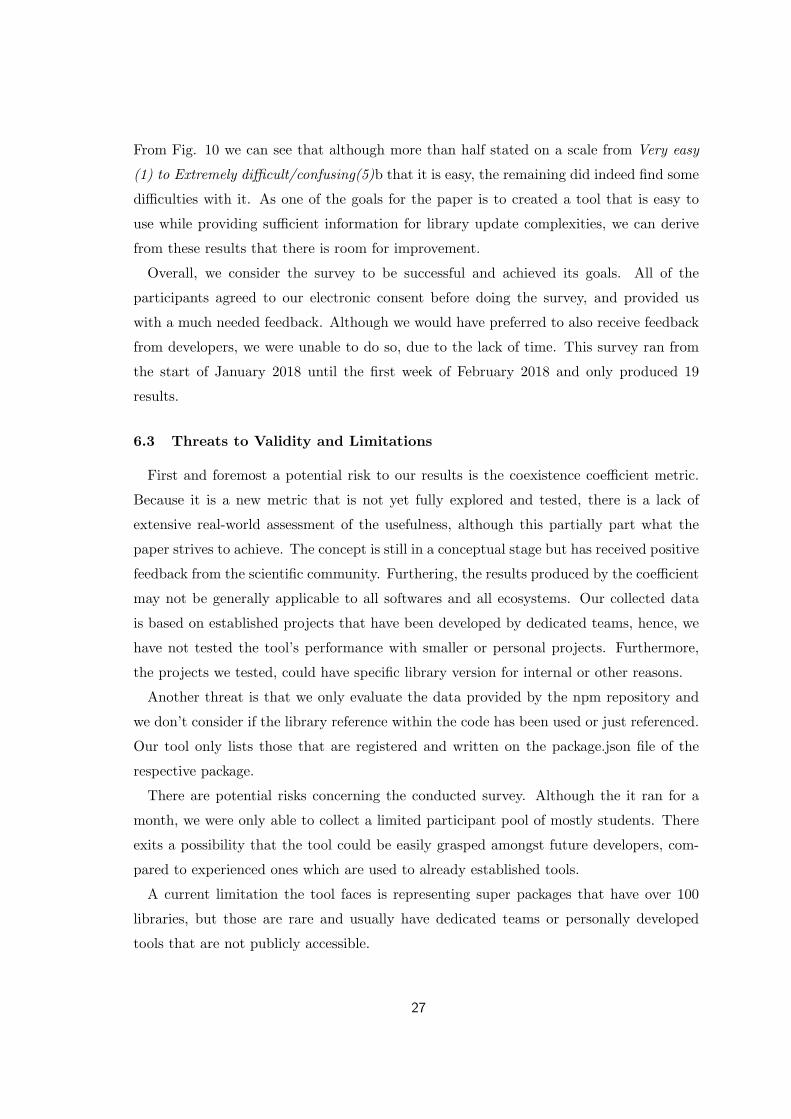
From Fig. 10 we can see that although more than half stated on a scale from Very easy
(1) to Extremely difficult/confusing(5)b that it is easy, the remaining did indeed find some
difficulties with it. As one of the goals for the paper is to created a tool that is easy to
use while providing sufficient information for library update complexities, we can derive
from these results that there is room for improvement.
Overall, we consider the survey to be successful and achieved its goals. All of the
participants agreed to our electronic consent before doing the survey, and provided us
with a much needed feedback. Although we would have preferred to also receive feedback
from developers, we were unable to do so, due to the lack of time. This survey ran from
the start of January 2018 until the first week of February 2018 and only produced 19
results.
6.3 Threats to Validity and Limitations
First and foremost a potential risk to our results is the coexistence coefficient metric.
Because it is a new metric that is not yet fully explored and tested, there is a lack of
extensive real-world assessment of the usefulness, although this partially part what the
paper strives to achieve. The concept is still in a conceptual stage but has received positive
feedback from the scientific community. Furthering, the results produced by the coefficient
may not be generally applicable to all softwares and all ecosystems. Our collected data
is based on established projects that have been developed by dedicated teams, hence, we
have not tested the tool’s performance with smaller or personal projects. Furthermore,
the projects we tested, could have specific library version for internal or other reasons.
Another threat is that we only evaluate the data provided by the npm repository and
we don’t consider if the library reference within the code has been used or just referenced.
Our tool only lists those that are registered and written on the package.json file of the
respective package.
There are potential risks concerning the conducted survey. Although the it ran for a
month, we were only able to collect a limited participant pool of mostly students. There
exits a possibility that the tool could be easily grasped amongst future developers, com-
pared to experienced ones which are used to already established tools.
A current limitation the tool faces is representing super packages that have over 100
libraries, but those are rare and usually have dedicated teams or personally developed
tools that are not publicly accessible.
27

7 Conclusion
In this paper we present the SoL Mantra tool that we developed using the orbital
layout visualization concept together with the coexistence coefficient metric. We stated
our decision process while selecting the visualization concept and added the benefits it
provides, while also weighting in the drawbacks. Although a new metric, the coexistence
coefficient provided a great solution to address a greater scope of library interdependency.
Combining both together felt natural and we manage to provide relevant information for
library update opportunities and their respective complexities to software developers.
With a simple example we demonstrated the different elements of our visualization and
the information they hold. We furthered the coexistence logic and its explanation, during
the example.l
Finally, we demonstrated how our visual cues display all the relevant information and
the way it should be grasped. Through the two examples we showcase how our tool is to be
read and evaluated, when considering the libraries within a software for an update. Firstly,
we showcased a smaller software package with only a handful of library dependencies.
Secondly, we demonstrated the tool’s ability to handle bigger systems with more complex
library dependencies. Furthering that, through the on-line survey conducted, we observed
that most of the participants reached the same conclusions as we did and therefore we
can concretely conclude that our tool feels natural among younger and inexperienced
developers. Regrettably, we were unable to produce a larger survey sample, but with the
limited time and resources available, we are content with the outcome.
While creating and studying the sample data, we noticed few threats to the validity of
our research and certain limitation. Although our tool is able to achieve the goals set,
further improvements and testing might be required to address them in future works.
28

謝辞
First and foremost, I would like to express my gratitude to Prof. Katsuro Inoue and
the Japanese Ministry of Education, Culture, Sports, Science and Technology, which gave
me the chance to study in Japan and explore my ideas through the research. Prof. Inoue
guided and assisted me through the entire process and with his help I was able to finish
the work.
Next, I would like to extend my thanks to all the members of Inoue Laboratory for their
moral and professional support. I would also like to extend a special note of appreciation
towards Kaoru Ito, who gave the tool its name.
29

付録
30

参考文献
[1] V. Bauer, L. Heinemann, and F. Deissenboeck. A structured approach to assess
third-party library usage. 28th IEEE ICSM, pages 483–492, September 2012.
[2] G. Bavota, G. Canfora, M. Di Penta, R. Oliveto, and S. Panichella. How the apache
community upgrades dependencies: an evolutionary study. Empirical Software Engi-
neering, 20(5):1274–1317, 2015.
[3] C. Bogart, C. Kastner, and J. Herbsleb. When it breaks, it breaks: How ecosystem
developers reason about the stability of dependencies. ASE (Workshop SCGSE),
pages 86–89, Lincoln, NE, 2015.
[4] A. Bragdon, S. P. Reis, R. Zelezni, S. Karumuri, W. Cheung, J. Kaplan, C. Coleman,
F. Adeputra, and J. J. LaViola Jr. Code bubbles: Rethinking the user interface
paradigm of integrated development environments. 32nd ACM/IEEE ICSE, 1:455–
464, New York, NY, USA, 2010.
[5] M. Cadariu, E. Bouwers, J. Visser, and A. van Deursen. Tracking known security
vulnerabilities in proprietary software systems. 22nd IEEE SANER, pages 516–519,
March 2015.
[6] C. Ebert. Open source software in industry. in IEEE Software, 25(3):52–53, 2008.
[7] O. Foundation. Top 10-2017 security risks. OWASP, available: https://goo.gl/fCs5ob,
2017.
[8] D. M. German, J. M. Gonzalez-Barahona, and G. Robles. A model to understand
the building and running inter-dependencies of software. 14th WCRE, pages 140–149,
Oct. 2007.
[9] H. Graham, H. Y. Yang, and R. Berrigan. A solar system metaphor for 3d visual-
ization of object oriented software. in Proceedings of the Australian Symposium on
Information Visualization, 35:53–59, Darlinghurst, Australia, 2004.
[10] R. G. Kula, D. M. German, T. Ishio, and K. Inoue. Trusting a library: A study
of the latency to adopt the latest maven release. 22nd IEEE SANER, 22:520–524,
Montreal, Canada, 2015.
31

[11] R. G. Kula, D. M. German, A Ouni, T. Ishio, and K. Inoue. Do developers update
their library dependencies? Empirical Software Engineering, 2017.
[12] R. G. Kula, C. De Roover, D. M. German, T. Ishio, and K. Inoue. Visualizing the
evolution of systems and their library dependencies. in 2nd IEE VISSOFT, pages
127–136, Victoria, BC, Canada, 2014.
[13] R. G. Kula, C. De Roover, D. M. German, T. Ishio, and K. Inoue. A generalized
model for visualizing library popularity, adoption and diffusion within a software
ecosystem. 25th IEEE SANER, Campobasso, Italy, March 2018, (to Appear).
[14] S. McIntosh, B. Adams, T. H. Nguyen, Y. Kamei, and A. E. hassan. An empir-
ical study of build maintenance effort. 33rd ICSE, pages 141–150 [Online], avail-
able:http://doi.acm.org/10.1145/1985793.1985813 , New York, NY, USA, 2011.
[15] Y. M. Mileva, V. Dallmeier, and A. Zeller. Mining api popularity. TAIC PART,
pages 173–180, 2010.
[16] S. Raemaekers, A. van Deursen, and J. Visser. Semantic versioning versus breaking
changes: A study of the maven repository. 14th IEEE SCAM, pages 215–224, 2014.
[17] A. Telea and D. Auber. Code flows: Visualizing structural evolution of source code.
Computer Graphics Forum, 27(3):831–838, 2008.
[18] C. Teyton, J. R. Falleri, M. Palyart, and X. Blanc. A study of library migrations in
java. Journal of Software: evolution and Process, 26(11), 2014.
[19] R. Wettel and M. Lanza. Visually localizing design problems with disharmony maps.
in Proceedings of the 4th ACM Symposium on Software Visualization, pages 155–164,
New York, NY, USA, 2008.
[20] E. Wittern, P. Suter, and S. Rajagopalan. A look at the dynamics of the javascript
package ecosystem. 13th MSR, pages 351–361, Austin, TX, USA, 2016.
[21] P. Xia, M. Matsushita, N. Yoshida, and K. Inoue. Studying reuse of out-dated third-
party code in open source projects. Information and Media Technologies, 9(2):155–
161, 2014.
[22] Y. Yano, R. G. Kula, T. Ishio, and K. Inoue. Verxcombo: An interactive data
visualization of popular library version combinations. in 23rd IEEE ICPC, pages
291–294, Florence, Italy, 2015.
32