Embed Size (px)
Citation preview
20 www.labmedonline.org eISSN 2093-6338
dioxide pressure (pCO2), and partial oxygen pressure (pO2). More-
over, the simultaneous measurement of electrolytes such as so-
dium (Na+), potassium (K+), chloride (Cl-), and ionized calcium
(Ca2+) is available with hematocrit (Hct). Integration and immedi-
ate therapeutic response using these results allows for prompt
treatment and improvement of prognosis. Therefore, blood gas
analyzers are being demanded for both their rapid turn-around of
test results and sophisticated result accuracy. While most of the
blood gas analyzers are used on-site, such as in emergency de-
partments and ICUs for point of care (POC) testing, even bench-
top models are currently in use at most clinical laboratories.
In the use of POC analyzers, quality control is a big issue. The
users of POC analyzers are often unfamiliar with laboratory in-
struments and unacquainted with the maintenance and quality
control of the instrument. Therefore, cartridge-type instruments
are welcomed for most POC instruments, not only blood gas ana-
lyzers, but also molecular diagnostic analyzers [3]. If, however,
INTRODUCTION
Blood gas analysis is a critical tool in assessing a clinical diag-
nosis and in therapeutic monitoring of severely ill patients in the
emergency department and intensive care unit (ICU) [1, 2]. Most
blood gas analyzers measure the whole blood pH, partial carbon
카트리지 형태의 현장 검사 혈액 가스 장비 i-Smart 300의 성능 평가Performance Evaluation of Cartridge-Type Blood Gas Analyzer: i-Smart 300
이아람·김한아·문희원·허미나·윤여민Ahram Yi, M.D., Hanah Kim, M.D., Hee-Won Moon, M.D., Mina Hur, M.D., Yeo-Min Yun, M.D.
건국대학교 의학전문대학원 진단검사의학교실
Department of Laboratory Medicine, Konkuk University School of Medicine, Seoul, Korea
원저Lab Med OnlineVol. 7, No. 1: 20-27, January 2017https://doi.org/10.3343/lmo.2017.7.1.20
임상화학
Corresponding author: Yeo-Min YunDepartment of Laboratory Medicine, Konkuk University School of MedicineKonkuk University Hospital, 120-1 Neungdong-ro, Gwangjin-gu, Seoul 05030, KoreaTel: +82-2-2030-5582, Fax: +82-2-2030-5587, E-mail: [email protected]
Received: December 23, 2015Revision received: April 26, 2016Accepted: May 3, 2016
This article is available from http://www.labmedonline.org 2017, Laboratory Medicine Online This is an Open Access article distributed under the terms of the Creative Commons
Attribution Non-Commercial License (http://creativecommons.org/licenses/by-nc/4.0/) which permits unrestricted non-commercial use, distribution, and reproduction in any medium, provided the original work is properly cited.
Background: Blood gas analysis plays a crucial role in critical care settings, and immediate and precise analysis improves clinical outcomes through prompt treatment. We evaluated the performance of a cartridge-type blood gas analyzer, i-Smart 300 (i-SENS, Korea), according to the Clinical and Laboratory Standard Institute (CLSI) guidelines and compared it to a conventional blood gas analyzer.Methods: The precision was evaluated according to CLSI EP5-A3. The i-Smart 300 was compared to the Stat Profile Critical Care Xpress (STP CCX) (Nova CCX; Nova Biomedical, USA) according to CLSI EP9-A3 using the following eight parameters: pH, partial carbon dioxide pressure, partial oxygen pressure, sodium, potassium, chloride, ionized calcium, and hematocrit. Linearity was determined using five levels of control materials ac-cording to CLSI EP6-A.Results: Within-run precision and total precision, demonstrated as coefficients of variation, ranged from 0.02 to 2.50% and from 0.05 to 3.46%, respectively. Correlation analysis yielded a correlation coefficient from 0.966 to 0.996 between the i-Smart 300 and the conventional analyzer (Nova CCX). The i-Smart 300 showed excellent linearity at eight parameters with acceptable percent recovery.Conclusions: The i-Smart 300, a portable cartridge-type blood gas analyzer, showed high precision and good correlation with a traditional bench-top blood gas analyzer. It could be useful in critical care settings.
Key Words: i-Smart, Blood gas analyzer, Point-of-care systems, Performance
이아람 외: Cartridge-Type Blood Gas Analyzer
https://doi.org/10.3343/lmo.2017.7.1.20 www.labmedonline.org 21
there are discrepant results between a POC analyzer and central
bench-top analyzer, this can confuse physicians and makes it more
dif�cult to treat patients properly. Therefore, the performance eval-
uation of blood gas analyzers and determination of analyzer-spe-
ci�c differences in bias and precision are important to reduce the
con�icting results between different instruments [4].
Recently, a brand new blood gas analyzer, i-Smart 300 (i-SENS,
Seoul, Korea) was launched and is a cartridge-type blood gas an-
alyzer, which is preferred in the clinical �eld. This study aims to
evaluate the analytical performance of this new cartridge-type
blood gas analyzer in comparison with the Stat Pro�le Critical Care
Xpress (Nova CCX; Nova Biomedical, Waltham, MA, USA) as a
reference method according to the Clinical and Laboratory Stan-
dard Institute (CLSI) guidelines.
MATERIALS AND METHODS
1. Analyzer
The i-Smart 300 blood gas analyzer consists of an operating in-
strument and a disposable cartridge containing all sensors, a re-
agents waste bag, tubing, and sample probe for analysis. The stand-
alone disposable cartridge is a self-contained miniature analyzer,
a functioning analyzing unit that contains all necessary parts: re-
agents, calibrators, reference solution, sample probe, valves, tubing,
and sensors. Therefore, equipment maintenance is very conve-
nient involving only replacing a cartridge. The i-Smart uses three
levels of aqueous quality control (QC) material, RNA QC 623 Blood
Gas-Electrolyte Control (RNA Medical, Devens, MA, USA), and
two levels of RNA QC 900 Hematocrit Control (RNA Medical, De-
vens, MA, USA). This analyzer measures the whole blood pH,
pCO2, pO2, Na+, K+, Cl-, Ca2+, and Hct using 80 μL heparinized
whole blood.
2. Specimens
In March 2015, a total of 40 heparinized whole blood specimens
were prospectively and consecutively collected. The specimens
were anaerobically drawn from arterial vessels using heparinized
blood sample kits, Becton Dickinson’s Preset (BD Becton Dickin-
son Co., Plymouth, UK), according to the CLSI guideline [5]. The
remaining specimens were used in anonymous way, and this study
was approved by the Institutional Review Board of the Konkuk
University Medical Center (KUH1200047).
To determine the imprecision of i-Smart for eight analytes, aque-
ous QC materials were used. For seven analytes, except Hct, three
levels of aqueous QC material, RNA QC 623 Blood Gas-Electrolyte
Control (RNA Medical, Devens, MA, USA) were used, and two
levels of RNA QC 900 Hematocrit Control (RNA Medical, Devens,
MA, USA) were used for Hct. For carry-over analysis, two levels of
QC materials were tested. Five calibration veri�cation materials
[RNA CVC 123 Calibration Veri�cation Controls and RNA CVC 9005
Hematocrit Calibration Veri�cation Controls (RNA Medical, De-
vens, MA, USA)] were used for linearity assessment.
3. Study Design
The total run imprecision was determined using within-labora-
tory precision with the CLSI EP5-A3. It uses a design with 20 test-
ing days, two runs per testing day, and two replicate measurements
per run (20×2×2) for each samples using a single reagent and
single calibrator lot. Carry-over was estimated with replicate mea-
surements of the high-low sequences and was calculated by the
equation: % carry-over= {L1-(L3+L4)/2}×100/{(H2+H3)/2-(L3+L4)/2}.
An acceptability criterion was % carry-over of less than 1% [6, 7].
Linearity analysis was performed with �ve levels of commercially
available linearity material with two repetitions of each level ac-
cording to the CLSI EP6-A. Acceptability criteria were a slope be-
tween 0.9 and 1.1 and a recovery of between 90% and 110% [8].
Method comparison and difference estimation were assessed
using a Nova CCX in the core laboratory. Forty heparinized whole
blood specimens were analyzed on the i-Smart and the Nova CCX
according to the CLSI EP9-A3 [9].
4. Statistical Analysis
Before statistical analysis, all data were processed to detect and
reject outliers according to the CLSI EP9-A3 [9]. To compare the
results of the i-Smart and Nova CCX, Pearson correlation coef�-
cient and Passing-Bablok regression analysis were used. Each es-
timated slope and intercept, as well as 95% con�dence intervals
(CI), was calculated. The Nova CCX is the laboratory’s current
method and not a recognized reference method, so the trueness
of the test methods could not be determined. The differences (ab-
solute and relative) by the Bland-Altman difference plot were cal-
culated. We used percent difference between the two methods,
so bias from difference of scale or units could be excluded.
Statistical analysis was performed using Analyse-it Software
이아람 외: Cartridge-Type Blood Gas Analyzer
https://doi.org/10.3343/lmo.2017.7.1.2022 www.labmedonline.org
(version 3.90.5; Analyse-it Software, Ltd., Leeds, UK) and MedCalc
Software (version 14.12.0; MedCalc Software, Mariakerke, Belgium).
P values of less than 0.05 were considered statistically signi�cant.
RESULTS
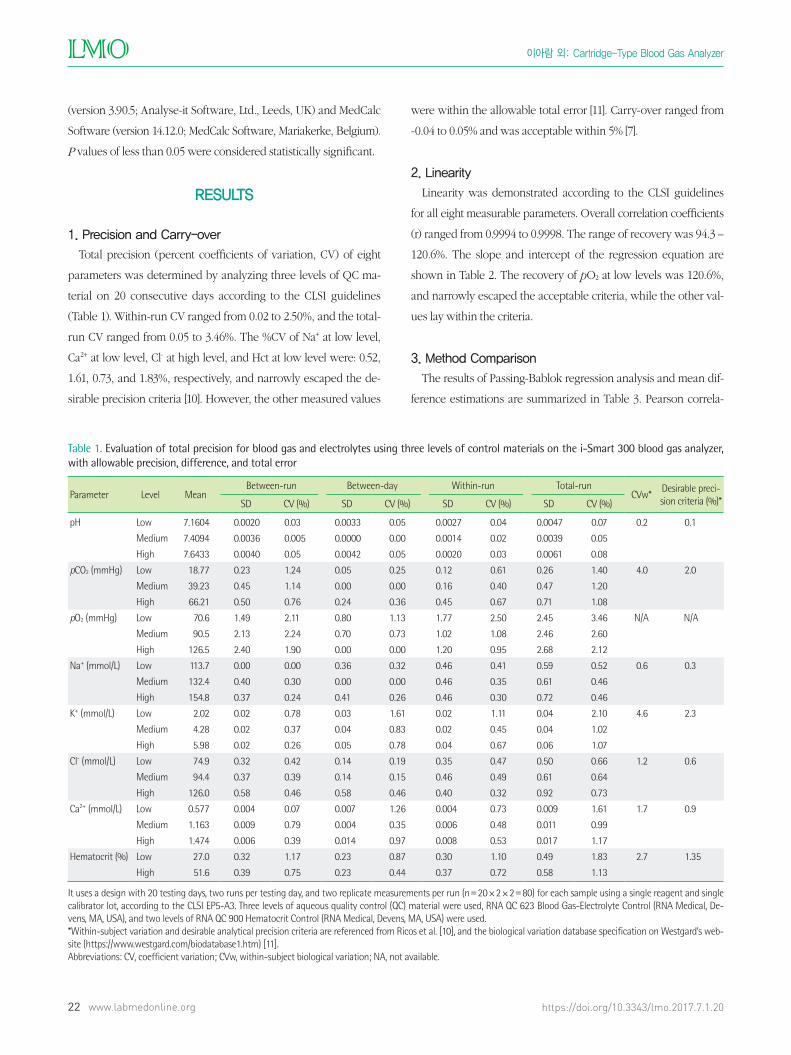
1. Precision and Carry-over
Total precision (percent coef�cients of variation, CV) of eight
parameters was determined by analyzing three levels of QC ma-
terial on 20 consecutive days according to the CLSI guidelines
(Table 1). Within-run CV ranged from 0.02 to 2.50%, and the total-
run CV ranged from 0.05 to 3.46%. The %CV of Na+ at low level,
Ca2+ at low level, Cl- at high level, and Hct at low level were: 0.52,
1.61, 0.73, and 1.83%, respectively, and narrowly escaped the de-
sirable precision criteria [10]. However, the other measured values
were within the allowable total error [11]. Carry-over ranged from
-0.04 to 0.05% and was acceptable within 5% [7].
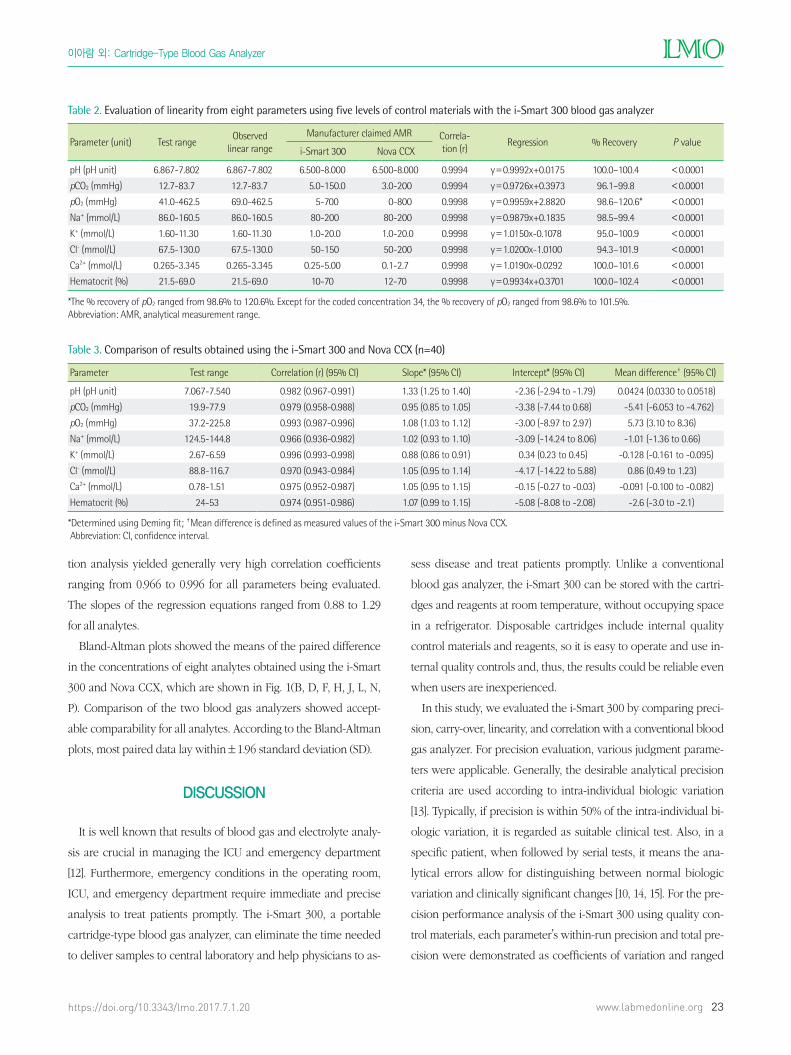
2. Linearity
Linearity was demonstrated according to the CLSI guidelines
for all eight measurable parameters. Overall correlation coef�cients
(r) ranged from 0.9994 to 0.9998. The range of recovery was 94.3 –
120.6%. The slope and intercept of the regression equation are
shown in Table 2. The recovery of pO2 at low levels was 120.6%,
and narrowly escaped the acceptable criteria, while the other val-
ues lay within the criteria.
3. Method Comparison
The results of Passing-Bablok regression analysis and mean dif-
ference estimations are summarized in Table 3. Pearson correla-
Table 1. Evaluation of total precision for blood gas and electrolytes using three levels of control materials on the i-Smart 300 blood gas analyzer, with allowable precision, difference, and total error
Parameter Level MeanBetween-run Between-day Within-run Total-run
CVw*Desirable preci-sion criteria (%)*SD CV (%) SD CV (%) SD CV (%) SD CV (%)
pH Low 7.1604 0.0020 0.03 0.0033 0.05 0.0027 0.04 0.0047 0.07 0.2 0.1
Medium 7.4094 0.0036 0.005 0.0000 0.00 0.0014 0.02 0.0039 0.05
High 7.6433 0.0040 0.05 0.0042 0.05 0.0020 0.03 0.0061 0.08
pCO2 (mmHg) Low 18.77 0.23 1.24 0.05 0.25 0.12 0.61 0.26 1.40 4.0 2.0
Medium 39.23 0.45 1.14 0.00 0.00 0.16 0.40 0.47 1.20
High 66.21 0.50 0.76 0.24 0.36 0.45 0.67 0.71 1.08
pO2 (mmHg) Low 70.6 1.49 2.11 0.80 1.13 1.77 2.50 2.45 3.46 N/A N/A
Medium 90.5 2.13 2.24 0.70 0.73 1.02 1.08 2.46 2.60
High 126.5 2.40 1.90 0.00 0.00 1.20 0.95 2.68 2.12
Na+ (mmol/L) Low 113.7 0.00 0.00 0.36 0.32 0.46 0.41 0.59 0.52 0.6 0.3
Medium 132.4 0.40 0.30 0.00 0.00 0.46 0.35 0.61 0.46
High 154.8 0.37 0.24 0.41 0.26 0.46 0.30 0.72 0.46
K+ (mmol/L) Low 2.02 0.02 0.78 0.03 1.61 0.02 1.11 0.04 2.10 4.6 2.3
Medium 4.28 0.02 0.37 0.04 0.83 0.02 0.45 0.04 1.02
High 5.98 0.02 0.26 0.05 0.78 0.04 0.67 0.06 1.07
Cl- (mmol/L) Low 74.9 0.32 0.42 0.14 0.19 0.35 0.47 0.50 0.66 1.2 0.6
Medium 94.4 0.37 0.39 0.14 0.15 0.46 0.49 0.61 0.64
High 126.0 0.58 0.46 0.58 0.46 0.40 0.32 0.92 0.73
Ca2+ (mmol/L) Low 0.577 0.004 0.07 0.007 1.26 0.004 0.73 0.009 1.61 1.7 0.9
Medium 1.163 0.009 0.79 0.004 0.35 0.006 0.48 0.011 0.99
High 1.474 0.006 0.39 0.014 0.97 0.008 0.53 0.017 1.17
Hematocrit (%) Low 27.0 0.32 1.17 0.23 0.87 0.30 1.10 0.49 1.83 2.7 1.35
High 51.6 0.39 0.75 0.23 0.44 0.37 0.72 0.58 1.13
It uses a design with 20 testing days, two runs per testing day, and two replicate measurements per run (n=20×2×2=80) for each sample using a single reagent and single calibrator lot, according to the CLSI EP5-A3. Three levels of aqueous quality control (QC) material were used, RNA QC 623 Blood Gas-Electrolyte Control (RNA Medical, De-vens, MA, USA), and two levels of RNA QC 900 Hematocrit Control (RNA Medical, Devens, MA, USA) were used.*Within-subject variation and desirable analytical precision criteria are referenced from Ricos et al. [10], and the biological variation database specification on Westgard’s web-site (https://www.westgard.com/biodatabase1.htm) [11].Abbreviations: CV, coefficient variation; CVw, within-subject biological variation; NA, not available.
이아람 외: Cartridge-Type Blood Gas Analyzer
https://doi.org/10.3343/lmo.2017.7.1.20 www.labmedonline.org 23
tion analysis yielded generally very high correlation coef�cients
ranging from 0.966 to 0.996 for all parameters being evaluated.
The slopes of the regression equations ranged from 0.88 to 1.29
for all analytes.
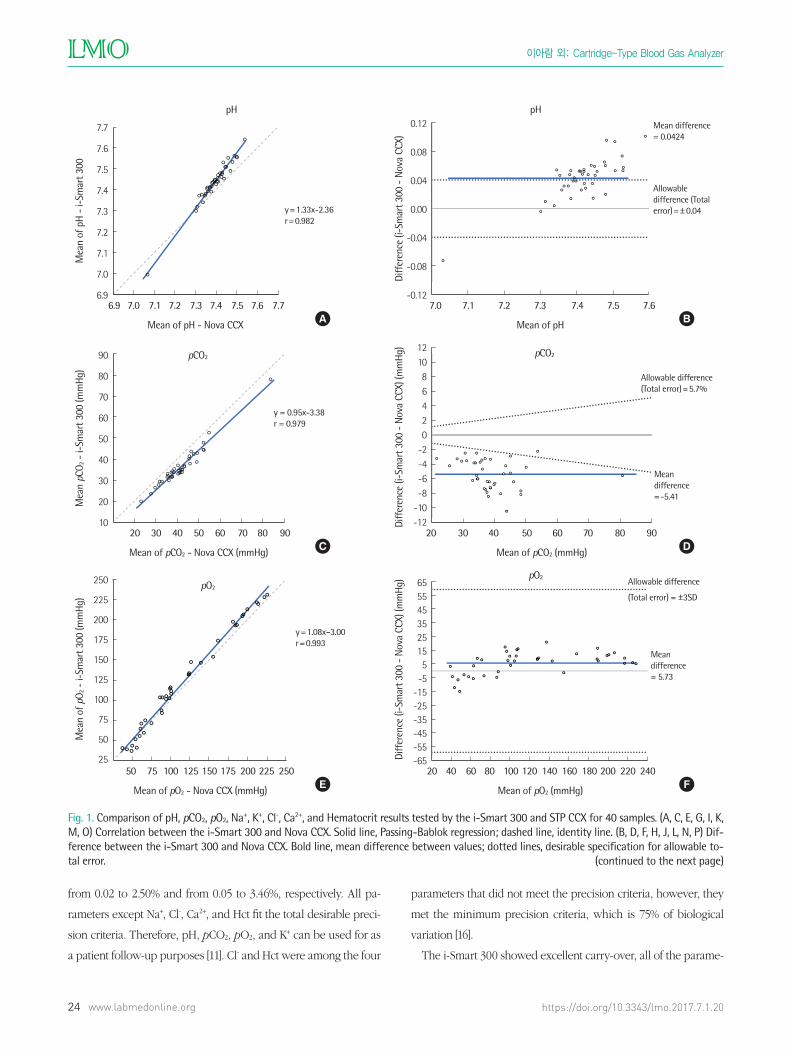
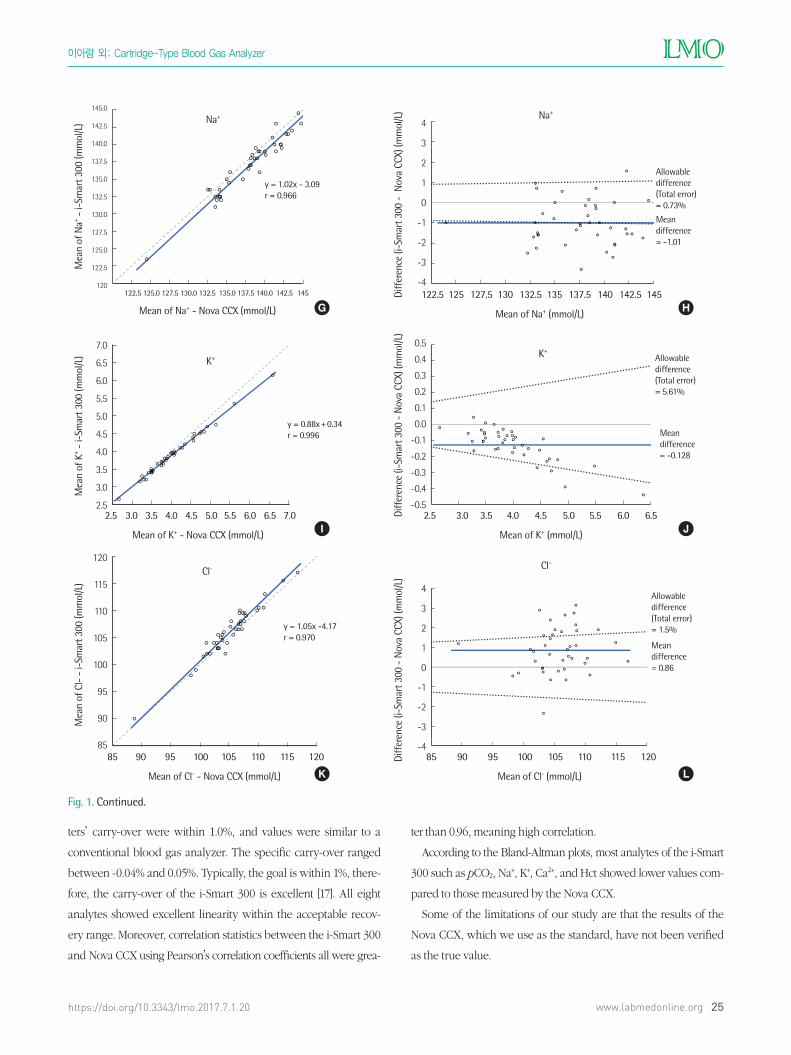
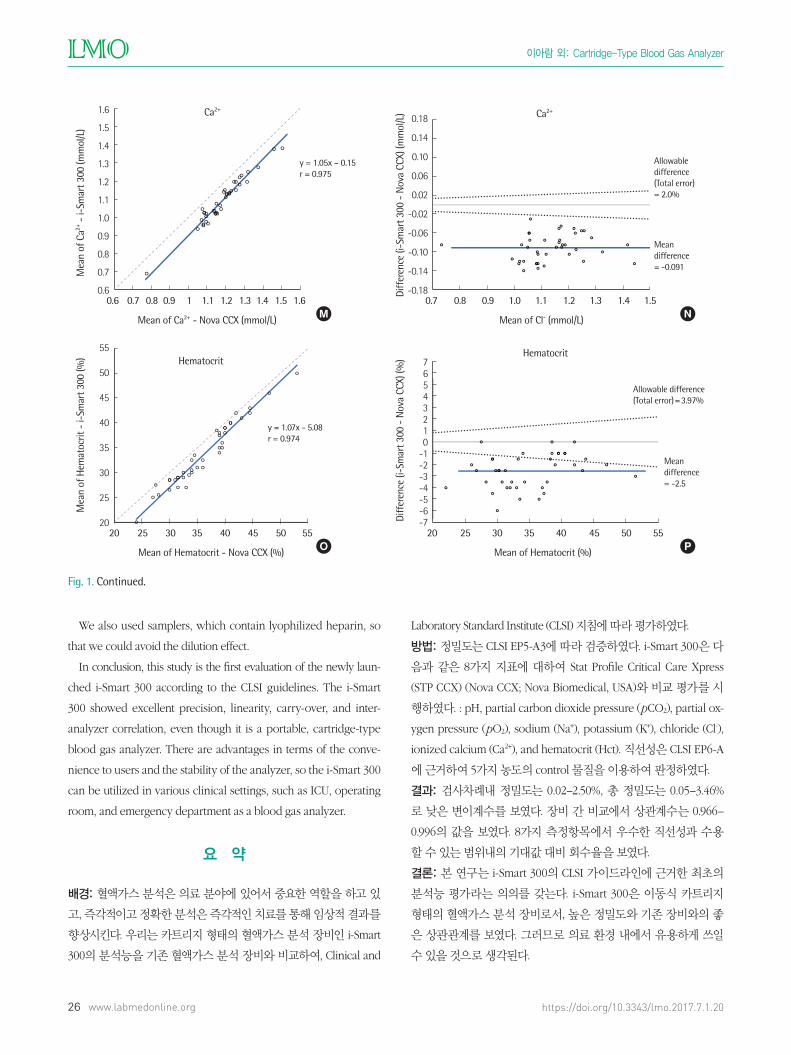
Bland-Altman plots showed the means of the paired difference
in the concentrations of eight analytes obtained using the i-Smart
300 and Nova CCX, which are shown in Fig. 1(B, D, F, H, J, L, N,
P). Comparison of the two blood gas analyzers showed accept-
able comparability for all analytes. According to the Bland-Altman
plots, most paired data lay within±1.96 standard deviation (SD).
DISCUSSION
It is well known that results of blood gas and electrolyte analy-
sis are crucial in managing the ICU and emergency department
[12]. Furthermore, emergency conditions in the operating room,
ICU, and emergency department require immediate and precise
analysis to treat patients promptly. The i-Smart 300, a portable
cartridge-type blood gas analyzer, can eliminate the time needed
to deliver samples to central laboratory and help physicians to as-
sess disease and treat patients promptly. Unlike a conventional
blood gas analyzer, the i-Smart 300 can be stored with the cartri-
dges and reagents at room temperature, without occupying space
in a refrigerator. Disposable cartridges include internal quality
control materials and reagents, so it is easy to operate and use in-
ternal quality controls and, thus, the results could be reliable even
when users are inexperienced.
In this study, we evaluated the i-Smart 300 by comparing preci-
sion, carry-over, linearity, and correlation with a conventional blood
gas analyzer. For precision evaluation, various judgment parame-
ters were applicable. Generally, the desirable analytical precision
criteria are used according to intra-individual biologic variation
[13]. Typically, if precision is within 50% of the intra-individual bi-
ologic variation, it is regarded as suitable clinical test. Also, in a
speci�c patient, when followed by serial tests, it means the ana-
lytical errors allow for distinguishing between normal biologic
variation and clinically signi�cant changes [10, 14, 15]. For the pre-
cision performance analysis of the i-Smart 300 using quality con-
trol materials, each parameter’s within-run precision and total pre-
cision were demonstrated as coef�cients of variation and ranged
Table 2. Evaluation of linearity from eight parameters using five levels of control materials with the i-Smart 300 blood gas analyzer
Parameter (unit) Test rangeObserved
linear range
Manufacturer claimed AMR Correla-tion (r)
Regression % Recovery P valuei-Smart 300 Nova CCX
pH (pH unit) 6.867-7.802 6.867-7.802 6.500-8.000 6.500-8.000 0.9994 y=0.9992x+0.0175 100.0–100.4 <0.0001
pCO2 (mmHg) 12.7-83.7 12.7-83.7 5.0-150.0 3.0-200 0.9994 y=0.9726x+0.3973 96.1–99.8 <0.0001
pO2 (mmHg) 41.0-462.5 69.0-462.5 5-700 0-800 0.9998 y=0.9959x+2.8820 98.6–120.6* <0.0001
Na+ (mmol/L) 86.0-160.5 86.0-160.5 80-200 80-200 0.9998 y=0.9879x+0.1835 98.5–99.4 <0.0001
K+ (mmol/L) 1.60-11.30 1.60-11.30 1.0-20.0 1.0-20.0 0.9998 y=1.0150x-0.1078 95.0–100.9 <0.0001
Cl- (mmol/L) 67.5-130.0 67.5-130.0 50-150 50-200 0.9998 y=1.0200x-1.0100 94.3–101.9 <0.0001
Ca2+ (mmol/L) 0.265-3.345 0.265-3.345 0.25-5.00 0.1-2.7 0.9998 y=1.0190x-0.0292 100.0–101.6 <0.0001
Hematocrit (%) 21.5-69.0 21.5-69.0 10-70 12-70 0.9998 y=0.9934x+0.3701 100.0–102.4 <0.0001
*The % recovery of pO2 ranged from 98.6% to 120.6%. Except for the coded concentration 34, the % recovery of pO2 ranged from 98.6% to 101.5%.Abbreviation: AMR, analytical measurement range.
Table 3. Comparison of results obtained using the i-Smart 300 and Nova CCX (n=40)
Parameter Test range Correlation (r) (95% CI) Slope* (95% CI) Intercept* (95% CI) Mean difference† (95% CI)
pH (pH unit) 7.067-7.540 0.982 (0.967-0.991) 1.33 (1.25 to 1.40) -2.36 (-2.94 to -1.79) 0.0424 (0.0330 to 0.0518)
pCO2 (mmHg) 19.9-77.9 0.979 (0.958-0.988) 0.95 (0.85 to 1.05) -3.38 (-7.44 to 0.68) -5.41 (-6.053 to -4.762)
pO2 (mmHg) 37.2-225.8 0.993 (0.987-0.996) 1.08 (1.03 to 1.12) -3.00 (-8.97 to 2.97) 5.73 (3.10 to 8.36)
Na+ (mmol/L) 124.5-144.8 0.966 (0.936-0.982) 1.02 (0.93 to 1.10) -3.09 (-14.24 to 8.06) -1.01 (-1.36 to 0.66)
K+ (mmol/L) 2.67-6.59 0.996 (0.993-0.998) 0.88 (0.86 to 0.91) 0.34 (0.23 to 0.45) -0.128 (-0.161 to -0.095)
Cl- (mmol/L) 88.8-116.7 0.970 (0.943-0.984) 1.05 (0.95 to 1.14) -4.17 (-14.22 to 5.88) 0.86 (0.49 to 1.23)
Ca2+ (mmol/L) 0.78-1.51 0.975 (0.952-0.987) 1.05 (0.95 to 1.15) -0.15 (-0.27 to -0.03) -0.091 (-0.100 to -0.082)
Hematocrit (%) 24-53 0.974 (0.951-0.986) 1.07 (0.99 to 1.15) -5.08 (-8.08 to -2.08) -2.6 (-3.0 to -2.1)
*Determined using Deming fit; †Mean difference is defined as measured values of the i-Smart 300 minus Nova CCX. Abbreviation: CI, confidence interval.
이아람 외: Cartridge-Type Blood Gas Analyzer
https://doi.org/10.3343/lmo.2017.7.1.2024 www.labmedonline.org
A
22
6.9
7
7.1
7.2
7.3
7.4
7.5
7.6
7.7
6.9 7 7.1 7.2 7.3 7.4 7.5 7.6 7.7
Mea
n of
pH
-i-S
mar
t 300
Mean of pH - STP CCX
pH
pH
17
18
19
20
21
22
23
24
25
26
27
28
‐0.120
‐0.080
‐0.040
0.000
0.040
0.080
0.120
7 7.1 7.2 7.3 7.4 7.5 7.6
Diff
eren
ce (i
-Sm
art 3
00 -
STP
CC
X)
Mean of pH
Allowable
difference (Total
error) = ± 0.04
(A)
(B)
y = 1.33x - 2.36
r = 0.982
Mean
difference
= 0.0424
7.7
7.6
7.5
7.4
7.3
7.2
7.1
7.0
6.9
Mea
n of
pH
- i-
Smar
t 300
Mean of pH - Nova CCX
6.9 7.0 7.1 7.2 7.3 7.4 7.5 7.6 7.7
y=1.33x-2.36r=0.982
Diff
eren
ce (i
-Sm
art 3
00 -
Nov
a CC
X)
B
22
6.9
7
7.1
7.2
7.3
7.4
7.5
7.6
7.7
6.9 7 7.1 7.2 7.3 7.4 7.5 7.6 7.7
Mea
n of
pH
-i-S
mar
t 300
Mean of pH - STP CCX
pH
pH
17
18
19
20
21
22
23
24
25
26
27
28
‐0.120
‐0.080
‐0.040
0.000
0.040
0.080
0.120
7 7.1 7.2 7.3 7.4 7.5 7.6
Diff
eren
ce (i
-Sm
art 3
00 -
STP
CC
X)
Mean of pH
Allowable
difference (Total
error) = ± 0.04
(A)
(B)
y = 1.33x - 2.36
r = 0.982
Mean
difference
= 0.0424
0.12
0.08
0.04
0.00
-0.04
-0.08
-0.12
Mean of pH
7.0 7.1 7.2 7.3 7.4 7.5 7.6
Mean difference= 0.0424
Allowable difference (Total error)=±0.04
pH
C
24
10
20
30
40
50
60
70
80
90
10 20 30 40 50 60 70 80 90
Mea
n pC
O2
-i-S
mar
t 300
(mm
Hg)
Mean of pCO2 - STP CCX (mmHg)
pCO2
35
36
37
38
39
40
41
42
43
44
45
46
47
Fig. 1. (continued)48
‐12.0
‐10.0
‐8.0
‐6.0
‐4.0
‐2.0
0.0
2.0
4.0
6.0
8.0
10.0
12.0
20 30 40 50 60 70 80 90
Diff
eren
ce (i
-Sm
art 3
00 -
STP
CC
X)(m
mH
g)
Mean of pCO2(mmHg)
Allowable difference
(Total error) = 5.7%
(A)
y = 0.95x -3.38
r = 0.979
Mean
difference
= - 5.41
(B)
pCO2
90
80
70
60
50
40
30
20
10
Mea
n pC
O2 -
i-Sm
art 3
00 (m
mH
g)
Mean of pCO2 - Nova CCX (mmHg)
20 30 40 50 60 70 80 90
y = 0.95x-3.38 r = 0.979
pCO2
D
24
10
20
30
40
50
60
70
80
90
10 20 30 40 50 60 70 80 90
Mea
n pC
O2
-i-S
mar
t 300
(mm
Hg)
Mean of pCO2 - STP CCX (mmHg)
pCO2
35
36
37
38
39
40
41
42
43
44
45
46
47
Fig. 1. (continued)48
‐12.0
‐10.0
‐8.0
‐6.0
‐4.0
‐2.0
0.0
2.0
4.0
6.0
8.0
10.0
12.0
20 30 40 50 60 70 80 90
Diff
eren
ce (i
-Sm
art 3
00 -
STP
CC
X)(m
mH
g)
Mean of pCO2(mmHg)
Allowable difference
(Total error) = 5.7%
(A)
y = 0.95x -3.38
r = 0.979
Mean
difference
= - 5.41
(B)
pCO2 121086420
-2-4-6-8
-10-12Di
ffer
ence
(i-S
mar
t 300
- N
ova
CCX)
(mm
Hg)
Mean of pCO2 (mmHg)
20 30 40 50 60 70 80 90
Allowable difference (Total error)=5.7%
Mean difference=-5.41
pCO2
25
25
50
75
100
125
150
175
200
225
250
25 50 75 100 125 150 175 200 225 250
Mea
n of
pO
2-i
-Sm
art 3
00 (m
mH
g)
Mean of pO2 - STP CCX (mmHg)
pO2
49
50
51
52
53
54
55
56
57
58
59
Fig. 1. (continued)60
‐65.0
‐55.0
‐45.0
‐35.0
‐25.0
‐15.0
‐5.0
5.0
15.0
25.0
35.0
45.0
55.0
65.0
20 40 60 80 100 120 140 160 180 200 220 240
Diff
eren
ce (i
-Sm
art 3
00 -
STP
CC
X) (m
mH
g)
Mean of pO 2 (mmHg)
y = 1.08x – 3.00
r = 0.993
Mean
difference
= 5.73
(A)
(B) pO2 Allowable difference
(Total error) = ±3SD
E
250
225
200
175
150
125
100
75
50
25
Mea
n of
pO
2 - i-
Smar
t 300
(mm
Hg)
Mean of pO2 - Nova CCX (mmHg)
50 75 100 125 150 175 200 225 250
y=1.08x–3.00 r=0.993
pO2
F
Diff
eren
ce (i
-Sm
art 3
00 -
Nov
a CC
X) (m
mH
g)
25
25
50
75
100
125
150
175
200
225
250
25 50 75 100 125 150 175 200 225 250
Mea
n of
pO
2-i
-Sm
art 3
00 (m
mH
g)
Mean of pO2 - STP CCX (mmHg)
pO2
49
50
51
52
53
54
55
56
57
58
59
Fig. 1. (continued)60
‐65.0
‐55.0
‐45.0
‐35.0
‐25.0
‐15.0
‐5.0
5.0
15.0
25.0
35.0
45.0
55.0
65.0
20 40 60 80 100 120 140 160 180 200 220 240
Diff
eren
ce (i
-Sm
art 3
00 -
STP
CC
X) (m
mH
g)
Mean of pO 2 (mmHg)
y = 1.08x – 3.00
r = 0.993
Mean
difference
= 5.73
(A)
(B) pO2 Allowable difference
(Total error) = ±3SD
6555453525155
-5-15-25-35-45-55-65
Mean of pO2 (mmHg)
20 40 60 80 100 120 140 160 180 200 220 240
Allowable difference
(Total error) = ±3SD
Mean difference= 5.73
pO2
Fig. 1. Comparison of pH, pCO2, pO2, Na+, K+, Cl-, Ca2+, and Hematocrit results tested by the i-Smart 300 and STP CCX for 40 samples. (A, C, E, G, I, K, M, O) Correlation between the i-Smart 300 and Nova CCX. Solid line, Passing-Bablok regression; dashed line, identity line. (B, D, F, H, J, L, N, P) Dif-ference between the i-Smart 300 and Nova CCX. Bold line, mean difference between values; dotted lines, desirable specification for allowable to-tal error. (continued to the next page)
from 0.02 to 2.50% and from 0.05 to 3.46%, respectively. All pa-
rameters except Na+, Cl-, Ca2+, and Hct �t the total desirable preci-
sion criteria. Therefore, pH, pCO2, pO2, and K+ can be used for as
a patient follow-up purposes [11]. Cl- and Hct were among the four
parameters that did not meet the precision criteria, however, they
met the minimum precision criteria, which is 75% of biological
variation [16].
The i-Smart 300 showed excellent carry-over, all of the parame-
pH
이아람 외: Cartridge-Type Blood Gas Analyzer
https://doi.org/10.3343/lmo.2017.7.1.20 www.labmedonline.org 25
ters’ carry-over were within 1.0%, and values were similar to a
conventional blood gas analyzer. The speci�c carry-over ranged
between -0.04% and 0.05%. Typically, the goal is within 1%, there-
fore, the carry-over of the i-Smart 300 is excellent [17]. All eight
analytes showed excellent linearity within the acceptable recov-
ery range. Moreover, correlation statistics between the i-Smart 300
and Nova CCX using Pearson’s correlation coef�cients all were grea-
ter than 0.96, meaning high correlation.
According to the Bland-Altman plots, most analytes of the i-Smart
300 such as pCO2, Na+, K+, Ca2+, and Hct showed lower values com-
pared to those measured by the Nova CCX.
Some of the limitations of our study are that the results of the
Nova CCX, which we use as the standard, have not been veri�ed
as the true value.
I
27
‐0.50
‐0.40
‐0.30
‐0.20
‐0.10
0.00
0.10
0.20
0.30
0.40
0.50
2.5 3 3.5 4 4.5 5 5.5 6 6.5
Diff
eren
ce (i
-Sm
art 3
00 -
STP
CC
X)(m
mol
/L)
Mean of K +(mmol/L)
K+ Allowable
difference (Total
error) = 5.61%
2.5
3
3.5
4
4.5
5
5.5
6
6.5
7
2.5 3 3.5 4 4.5 5 5.5 6 6.5 7
Mea
n of
K+
-i-S
mar
t 300
(mm
ol/L
)
Mean of K+ - STP CCX (mmol/L)
K+
76
77
78
79
80
81
82
83
84
85
86
87
88
89
90
91
92
93
94
95
96
97
98
99
Fig. 1. (continued)100
y = 0.88x +0.34
r = 0.996
Mean
difference
= -0.128
(A)
(B)
7.0
6.5
6.0
5.5
5.0
4.5
4.0
3.5
3.0
2.5
Mea
n of
K+ -
i-Sm
art 3
00 (m
mol
/L)
Mean of K+ - Nova CCX (mmol/L)
2.5 3.0 3.5 4.0 4.5 5.0 5.5 6.0 6.5 7.0
y = 0.88x+0.34 r = 0.996
K+
J
27
‐0.50
‐0.40
‐0.30
‐0.20
‐0.10
0.00
0.10
0.20
0.30
0.40
0.50
2.5 3 3.5 4 4.5 5 5.5 6 6.5
Diff
eren
ce (i
-Sm
art 3
00 -
STP
CC
X)(m
mol
/L)
Mean of K +(mmol/L)
K+ Allowable
difference (Total
error) = 5.61%
2.5
3
3.5
4
4.5
5
5.5
6
6.5
7
2.5 3 3.5 4 4.5 5 5.5 6 6.5 7
Mea
n of
K+
-i-S
mar
t 300
(mm
ol/L
)
Mean of K+ - STP CCX (mmol/L)
K+
76
77
78
79
80
81
82
83
84
85
86
87
88
89
90
91
92
93
94
95
96
97
98
99
Fig. 1. (continued)100
y = 0.88x +0.34
r = 0.996
Mean
difference
= -0.128
(A)
(B)
0.5
0.4
0.3
0.2
0.1
0.0
-0.1
-0.2
-0.3
-0.4
-0.5
Diff
eren
ce (i
-Sm
art 3
00 -
Nov
a CC
X) (m
mol
/L)
Mean of K+ (mmol/L)
2.5 3.0 3.5 4.0 4.5 5.0 5.5 6.0 6.5
Allowable difference (Total error) = 5.61%
Mean difference= -0.128
K+
Fig. 1. Continued. 28
85
90
95
100
105
110
115
120
85 90 95 100 105 110 115 120
Mea
n of
Cl-
-i-S
mar
t 300
(mm
ol/L
)
Mean of Cl- - STP CCX (mmol/L)
Cl-
101
102
103
104
105
106
107
108
109
110
111
112
113
114
115
Fig. 1. (continued)116
‐4.0
‐3.0
‐2.0
‐1.0
0.0
1.0
2.0
3.0
4.0
85 90 95 100 105 110 115 120
Diff
eren
ce (i
-Sm
art 3
00 -
STP
CC
X)(m
mol
/L)
Mean of Cl - (mmol/L)
Allowable
difference (Total
error)= 1.5%
y = 1.05x -4.17
r = 0.970
Mean
difference
= 0.86
(A)
(B)
Cl-
28
85
90
95
100
105
110
115
120
85 90 95 100 105 110 115 120
Mea
n of
Cl-
-i-S
mar
t 300
(mm
ol/L
)
Mean of Cl- - STP CCX (mmol/L)
Cl-
101
102
103
104
105
106
107
108
109
110
111
112
113
114
115
Fig. 1. (continued)116
‐4.0
‐3.0
‐2.0
‐1.0
0.0
1.0
2.0
3.0
4.0
85 90 95 100 105 110 115 120
Diff
eren
ce (i
-Sm
art 3
00 -
STP
CC
X)(m
mol
/L)
Mean of Cl - (mmol/L)
Allowable
difference (Total
error)= 1.5%
y = 1.05x -4.17
r = 0.970
Mean
difference
= 0.86
(A)
(B)
Cl-
K
120
115
110
105
100
95
90
85
Mea
n of
Cl-
- i-
Smar
t 300
(mm
ol/L
)
Mean of Cl- - Nova CCX (mmol/L)
85 90 95 100 105 110 115 120
y = 1.05x -4.17 r = 0.970
Cl-
L
Diff
eren
ce (i
-Sm
art 3
00 -
Nov
a CC
X) (m
mol
/L)
4
3
2
1
0
-1
-2
-3
-4
Mean of Cl- (mmol/L)
85 90 95 100 105 110 115 120
Allowable difference (Total error)= 1.5%
Mean difference= 0.86
Cl-
26
120
122.5
125
127.5
130
132.5
135
137.5
140
142.5
145
120 122.5 125 127.5 130 132.5 135 137.5 140 142.5 145
Mea
n of
Na+
-i-S
mar
t 300
(mm
ol/L
)
Mean of Na+ - STP CCX (mmol/L)
Na+
61
62
63
64
65
66
67
68
69
70
71
72
73
74
Fig. 1. (continued)75
‐4.0
‐3.0
‐2.0
‐1.0
0.0
1.0
2.0
3.0
4.0
122.5 125 127.5 130 132.5 135 137.5 140 142.5 145
Diff
eren
ce (
i-Sm
art 3
00 -
STP
CC
X)(m
mol
/L)
Mean of Na + (mmol/L)
Na+
Allowable
difference (Total
error)= 0.73%
y = 1.02x - 3.09
r = 0.966
Mean
difference
= -1.01
(A)
(B)
G
26
120
122.5
125
127.5
130
132.5
135
137.5
140
142.5
145
120 122.5 125 127.5 130 132.5 135 137.5 140 142.5 145
Mea
n of
Na+
-i-S
mar
t 300
(mm
ol/L
)
Mean of Na+ - STP CCX (mmol/L)
Na+
61
62
63
64
65
66
67
68
69
70
71
72
73
74
Fig. 1. (continued)75
‐4.0
‐3.0
‐2.0
‐1.0
0.0
1.0
2.0
3.0
4.0
122.5 125 127.5 130 132.5 135 137.5 140 142.5 145
Diff
eren
ce (
i-Sm
art 3
00 -
STP
CC
X)(m
mol
/L)
Mean of Na + (mmol/L)
Na+
Allowable
difference (Total
error)= 0.73%
y = 1.02x - 3.09
r = 0.966
Mean
difference
= -1.01
(A)
(B)
145.0
142.5
140.0
137.5
135.0
132.5
130.0
127.5
125.0
122.5
120
Mea
n of
Na+ -
i-Sm
art 3
00 (m
mol
/L)
Mean of Na+ - Nova CCX (mmol/L)
122.5 125.0 127.5 130.0 132.5 135.0 137.5 140.0 142.5 145
y = 1.02x - 3.09 r = 0.966
Na+
Diff
eren
ce (i
-Sm
art 3
00 -
Nov
a CC
X) (m
mol
/L)
H
4
3
2
1
0
-1
-2
-3
-4
Mean of Na+ (mmol/L)
122.5 125 127.5 130 132.5 135 137.5 140 142.5 145
Mean difference= -1.01
Allowable difference (Total error)= 0.73%
Na+
이아람 외: Cartridge-Type Blood Gas Analyzer
https://doi.org/10.3343/lmo.2017.7.1.2026 www.labmedonline.org
29
0.6
0.7
0.8
0.9
1
1.1
1.2
1.3
1.4
1.5
1.6
0.6 0.7 0.8 0.9 1 1.1 1.2 1.3 1.4 1.5 1.6
Mea
n of
Ca2
+-i
-Sm
art 3
00 (m
mol
/L)
Mean of Ca2+ - STP CCX (mmol/L)
Ca2+
117
118
119
120
121
122
123
124
125
126
127
128
129
Fig. 1. (continued)130
131
‐0.18
‐0.14
‐0.10
‐0.06
‐0.02
0.02
0.06
0.10
0.14
0.18
0.7 0.8 0.9 1 1.1 1.2 1.3 1.4 1.5Mean of Cl - (mmol/L)
Allowable
difference (Total
error) = 2.0%
Ca2+
Diff
eren
ce (i
-Sm
art 3
00 -
STP
CC
X)(m
mol
/L)
y = 1.05x – 0.15
r = 0.975
Mean
difference
= -0.091
(A)
(B)
M
29
0.6
0.7
0.8
0.9
1
1.1
1.2
1.3
1.4
1.5
1.6
0.6 0.7 0.8 0.9 1 1.1 1.2 1.3 1.4 1.5 1.6
Mea
n of
Ca2
+-i
-Sm
art 3
00 (m
mol
/L)
Mean of Ca2+ - STP CCX (mmol/L)
Ca2+
117
118
119
120
121
122
123
124
125
126
127
128
129
Fig. 1. (continued)130
131
‐0.18
‐0.14
‐0.10
‐0.06
‐0.02
0.02
0.06
0.10
0.14
0.18
0.7 0.8 0.9 1 1.1 1.2 1.3 1.4 1.5Mean of Cl - (mmol/L)
Allowable
difference (Total
error) = 2.0%
Ca2+
Diff
eren
ce (i
-Sm
art 3
00 -
STP
CC
X)(m
mol
/L)
y = 1.05x – 0.15
r = 0.975
Mean
difference
= -0.091
(A)
(B)
1.6
1.5
1.4
1.3
1.2
1.1
1.0
0.9
0.8
0.7
0.6
Mea
n of
Ca2+
- i-
Smar
t 300
(mm
ol/L
)
Mean of Ca2+ - Nova CCX (mmol/L)
0.6 0.7 0.8 0.9 1 1.1 1.2 1.3 1.4 1.5 1.6
y = 1.05x – 0.15 r = 0.975
Ca2+
Diff
eren
ce (i
-Sm
art 3
00 -
Nov
a CC
X) (m
mol
/L)
N
0.18
0.14
0.10
0.06
0.02
-0.02
-0.06
-0.10
-0.14
-0.18
Mean of Cl- (mmol/L)
0.7 0.8 0.9 1.0 1.1 1.2 1.3 1.4 1.5
Allowable difference (Total error) = 2.0%
Mean difference= -0.091
O
30
‐7
‐6
‐5
‐4
‐3
‐2
‐1
0
1
2
3
4
5
6
7
20 25 30 35 40 45 50 55
Diff
eren
ce (i
-Sm
art 3
00 -
STP
CC
X) (%
)
Mean of Hematocrit (%)
Allowable difference
(Total error)=3.97%
20
25
30
35
40
45
50
55
20 25 30 35 40 45 50 55
Mea
n of
Hem
atoc
rit -
i-Sm
art 3
00 (%
)
Mean of Hematocrit - STP CCX (%)
Hematocrit
132
133
134
135
136
137
138
139
140
141
142
143
144
145
146
147
148
149
150
151
152
153
154
Fig. 1. (continued)155
y = 1.07x - 5.08
r = 0.974
Mean
difference
= -2.5
(B)
(A)
Hematocrit
55
50
45
40
35
30
25
20
Mea
n of
Hem
atoc
rit -
i-Sm
art 3
00 (%
)
Mean of Hematocrit - Nova CCX (%)
20 25 30 35 40 45 50 55
y = 1.07x - 5.08 r = 0.974
Hematocrit
P
30
‐7
‐6
‐5
‐4
‐3
‐2
‐1
0
1
2
3
4
5
6
7
20 25 30 35 40 45 50 55
Diff
eren
ce (i
-Sm
art 3
00 -
STP
CC
X) (%
)
Mean of Hematocrit (%)
Allowable difference
(Total error)=3.97%
20
25
30
35
40
45
50
55
20 25 30 35 40 45 50 55
Mea
n of
Hem
atoc
rit -
i-Sm
art 3
00 (%
)
Mean of Hematocrit - STP CCX (%)
Hematocrit
132
133
134
135
136
137
138
139
140
141
142
143
144
145
146
147
148
149
150
151
152
153
154
Fig. 1. (continued)155
y = 1.07x - 5.08
r = 0.974
Mean
difference
= -2.5
(B)
(A)
Hematocrit 76543210
-1-2-3-4-5-6-7Di
ffer
ence
(i-S
mar
t 300
- N
ova
CCX)
(%)
Mean of Hematocrit (%)
20 25 30 35 40 45 50 55
Allowable difference(Total error)=3.97%
Mean difference= -2.5
Hematocrit
Fig. 1. Continued.
We also used samplers, which contain lyophilized heparin, so
that we could avoid the dilution effect.
In conclusion, this study is the �rst evaluation of the newly laun-
ched i-Smart 300 according to the CLSI guidelines. The i-Smart
300 showed excellent precision, linearity, carry-over, and inter-
analyzer correlation, even though it is a portable, cartridge-type
blood gas analyzer. There are advantages in terms of the conve-
nience to users and the stability of the analyzer, so the i-Smart 300
can be utilized in various clinical settings, such as ICU, operating
room, and emergency department as a blood gas analyzer.
요 약
배경: 혈액가스 분석은 의료 분야에 있어서 중요한 역할을 하고 있
고, 즉각적이고 정확한 분석은 즉각적인 치료를 통해 임상적 결과를
향상시킨다. 우리는 카트리지 형태의 혈액가스 분석 장비인 i-Smart
300의 분석능을 기존 혈액가스 분석 장비와 비교하여, Clinical and
Laboratory Standard Institute (CLSI) 지침에 따라 평가하였다.
방법: 정밀도는 CLSI EP5-A3에 따라 검증하였다. i-Smart 300은 다
음과 같은 8가지 지표에 대하여 Stat Pro�le Critical Care Xpress
(STP CCX) (Nova CCX; Nova Biomedical, USA)와 비교 평가를 시
행하였다. : pH, partial carbon dioxide pressure (pCO2), partial ox-
ygen pressure (pO2), sodium (Na+), potassium (K+), chloride (Cl-),
ionized calcium (Ca2+), and hematocrit (Hct). 직선성은 CLSI EP6-A
에 근거하여 5가지 농도의 control 물질을 이용하여 판정하였다.
결과: 검사차례내 정밀도는 0.02–2.50%, 총 정밀도는 0.05–3.46%
로 낮은 변이계수를 보였다. 장비 간 비교에서 상관계수는 0.966–
0.996의 값을 보였다. 8가지 측정항목에서 우수한 직선성과 수용
할 수 있는 범위내의 기대값 대비 회수율을 보였다.
결론: 본 연구는 i-Smart 300의 CLSI 가이드라인에 근거한 최초의
분석능 평가라는 의의를 갖는다. i-Smart 300은 이동식 카트리지
형태의 혈액가스 분석 장비로서, 높은 정밀도와 기존 장비와의 좋
은 상관관계를 보였다. 그러므로 의료 환경 내에서 유용하게 쓰일
수 있을 것으로 생각된다.
Ca2+
이아람 외: Cartridge-Type Blood Gas Analyzer
https://doi.org/10.3343/lmo.2017.7.1.20 www.labmedonline.org 27
AUTHORS’ DISCLOSURES OF POTENTIAL
CONFLICTS OF INTERESTS
No potential con�icts of interest relevant to this article were re-
ported.
ACKNOWLEDGEMENTS
This study was supported by i-SENS.
REFERENCES
1. Uyanik M, Sertoglu E, Kayadibi H, Tapan S, Serdar MA, Bilgi C, et al.
Comparison of blood gas, electrolyte and metabolite results measured
with two different blood gas analyzers and a core laboratory analyzer.
Scand J Clin Lab Invest 2015;75:97-105.
2. De Koninck AS, De Decker K, Van Bocxlaer J, Meeus P, Van Hoovels
L. Analytical performance evaluation of four cartridge-type blood gas
analyzers. Clin Chem Lab Med 2012;50:1083-91.
3. Einstein MH, Smith KM, Davis TE, Schmeler KM, Ferris DG, Savage
AH, et al. Clinical evaluation of the cartridge-based GeneXpert human
papillomavirus assay in women referred for colposcopy. J Clin Micro-
biol 2014;52:2089-95.
4. Leino A and Kurvinen K. Interchangeability of blood gas, electrolyte
and metabolite results measured with point-of-care, blood gas and core
laboratory analyzers. Clin Chem Lab Med 2011;49:1187-91.
5. CLSI. Blood Gas and pH Analysis and Related Measurements; Approved
Guideline—Second Edition. CLSI document C46-A2. Wayne, PA: Clin-
ical and Laboratory Standards Institute, 2009.
6. CLSI. Evaluation of Precision of Quantitative Measurement Procedures;
Approved Guideline—Third Edition. CLSI document EP05-A3. Wayne,
PA: Clinical and Laboratory Standards Institute, 2014.
7. CLSI. Preliminary evaluation of quantitative clinical laboratory mea-
surement procedures; Approved Guideline—Third Edition. CLSI doc-
ument EP10-A3. Wayne, PA: Clinical and Laboratory Standards Insti-
tute, 2006.
8. CLSI. Evaluation of the Linearity of Quantitative Measurement Proce-
dures: A Statistical Approach; Approved Guideline. CLSI document
EP06-A. Wayne, PA: Clinical and Laboratory Standards Institute, 2003.
9. CLSI. Measurement Procedure Comparison and Bias Estimation Using
Patient Samples; Approved Guideline—Third Edition. CLSI document
EP09-A3. Wayne, PA: Clinical and Laboratory Standards Institute, 2013.
10. Ricós C, Alvarez V, Cava F, García-Lario JV, Hernández A, Jiménez CV,
et al. Current databases on biological variation: pros, cons and prog-
ress. Scand J Clin Lab Invest 1999;59:491-500.
11. Ricós C, Alvarez V, Cava F, García-Lario JV, Hernández A, Jiménez CV,
et al. Desirable speci�cation for total error, imprecision, and bias, de-
rived from intra-and inter-individual biologic variation. http://www.
westgard.com/biodatabase1.htm (updated for 2014).
12. Nichols JH, Christenson RH, Clarke W, Gronowski A, Hammett-Stabler
CA, Jacobs E, et al. Executive summary. The National Academy of Clin-
ical Biochemistry Laboratory Medicine Practice Guideline: evidence-
based practice for point-of-care testing. Clin Chim Acta 2007;379:14-
28.
13. Fraser CG and Harris EK. Generation and application of data on bio-
logical variation in clinical chemistry. Crit Rev Clin Lab Sci 1989;27:409-
37.
14. Cotlove E, Harris EK, Williams GZ. Biological and analytic components
of variation in long-term studies of serum constituents in normal sub-
jects. 3. Physiological and medical implications. Clin Chem 1970;16:
1028-32.
15. Harris EK. Statistical principles underlying analytic goal-setting in clin-
ical chemistry. Am J Clin Pathol 1979;72(2 Suppl):374-82.
16. Fraser CG. General strategies to set quality speci�cations for reliabil-
ity performance characteristics. Scand J Clin Lab Invest 1999;59:487-
90.
17. Seok YM, Lee WH, Yoon SY, Won YC, Kwon OH. Evaluation of the i-
Smart 30 Point-of-care analyzer for use in clinical laboratory settings. J
Lab Med Qual Assur 2011:33;25-30.