Embed Size (px)
Citation preview

November 12, 2012
eAccess Ltd. (9427)
FY3/2013 First Half Results
(4/2012 ~ 9/2012)
2
1st Half FY3/2013 Results
EMOBILE LTE
Business Combination with SoftBank
3
Business Combination with SoftBank
4
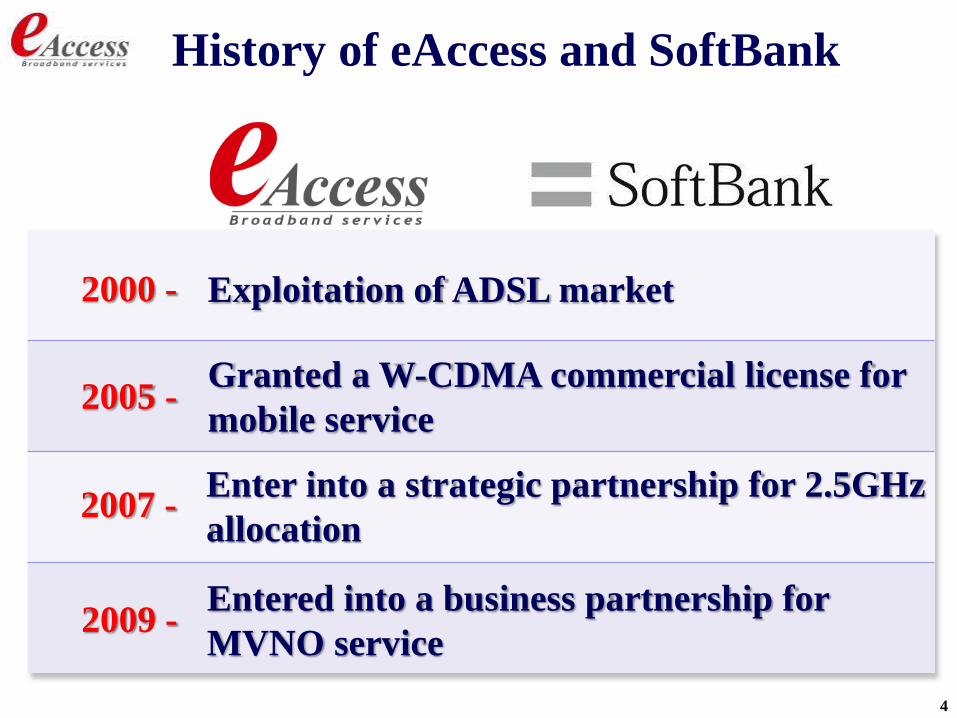
History of eAccess and SoftBank
2000 - Exploitation of ADSL market
2005 - Granted a W-CDMA commercial license for
mobile service
2007 - Enter into a strategic partnership for 2.5GHz
allocation
2009 - Entered into a business partnership for
MVNO service
5
October 1, 2012
Agreed on business combination
via share exchange
6
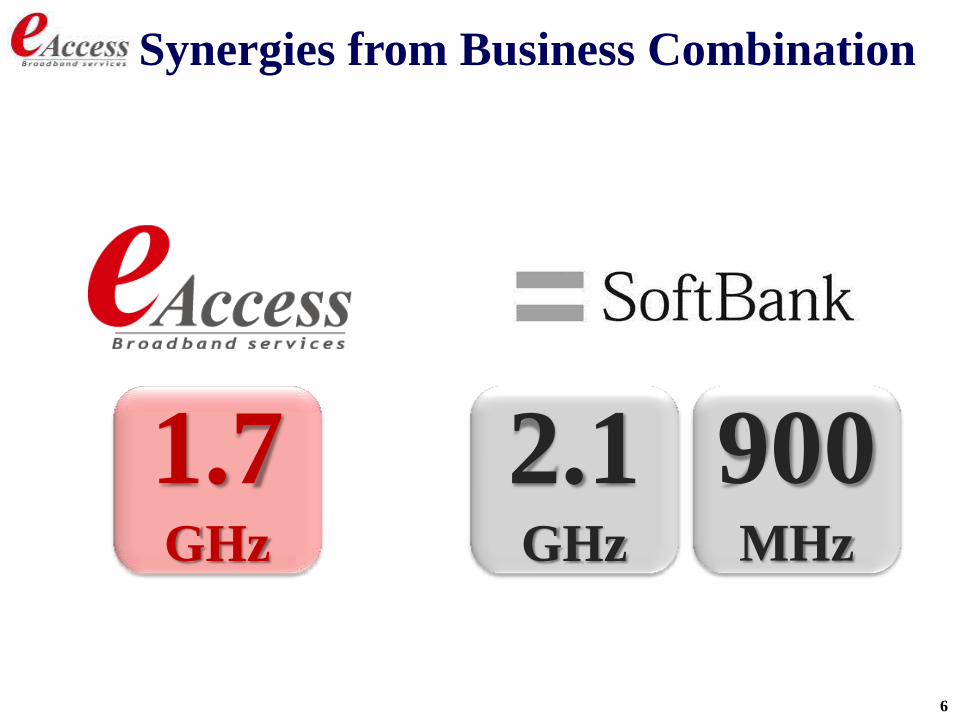
Synergies from Business Combination
1.7 GHz
2.1 GHz
900 MHz
7
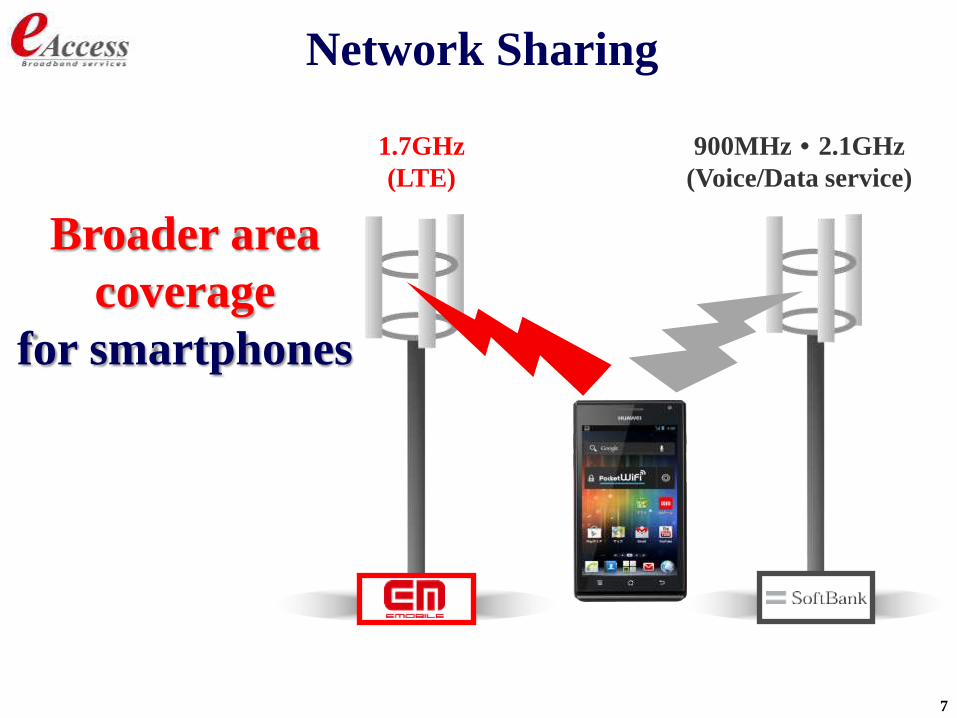
Network Sharing
900MHz・2.1GHz
(Voice/Data service)
1.7GHz
(LTE)
Broader area
coverage
for smartphones
8
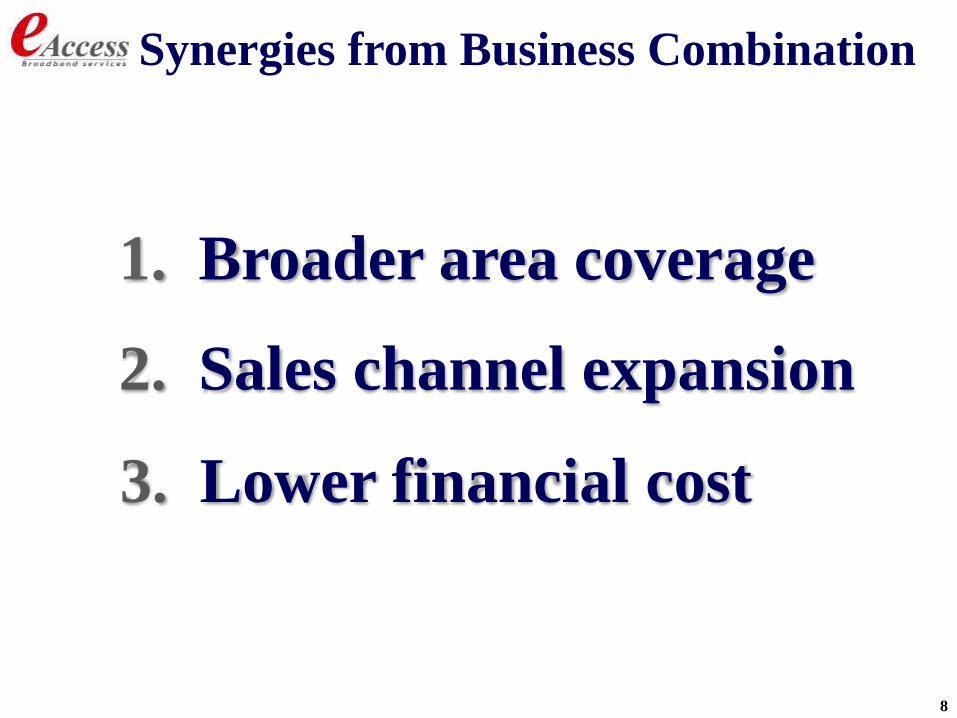
1. Broader area coverage
2. Sales channel expansion
3. Lower financial cost
Synergies from Business Combination
9
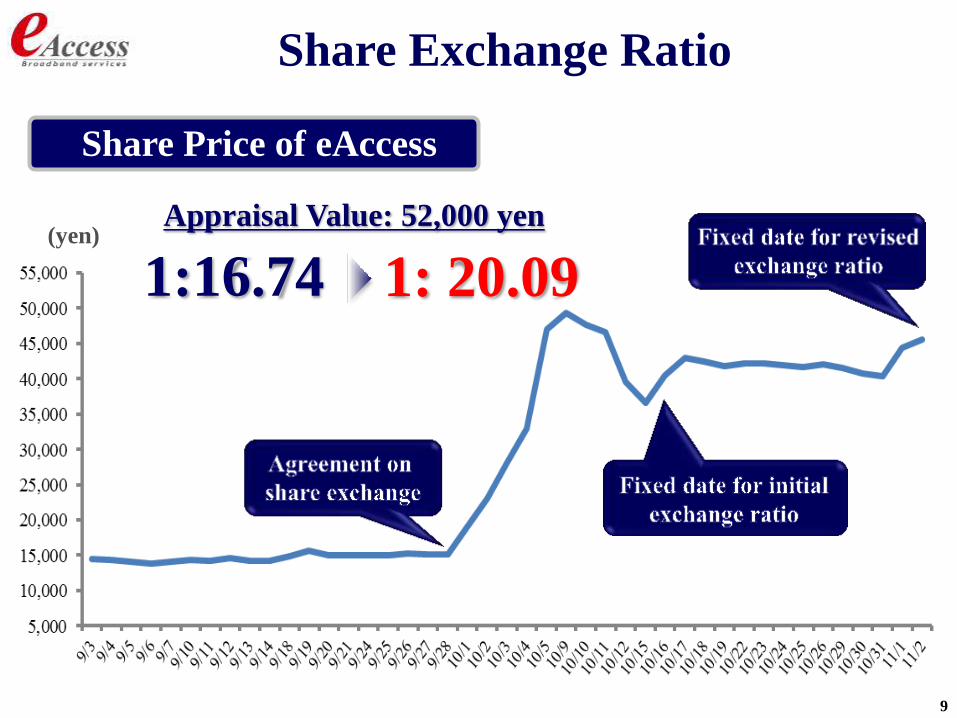
Share Exchange Ratio
Appraisal Value: 52,000 yen
Share Price of eAccess
(yen)
1:16.74 1: 20.09
10
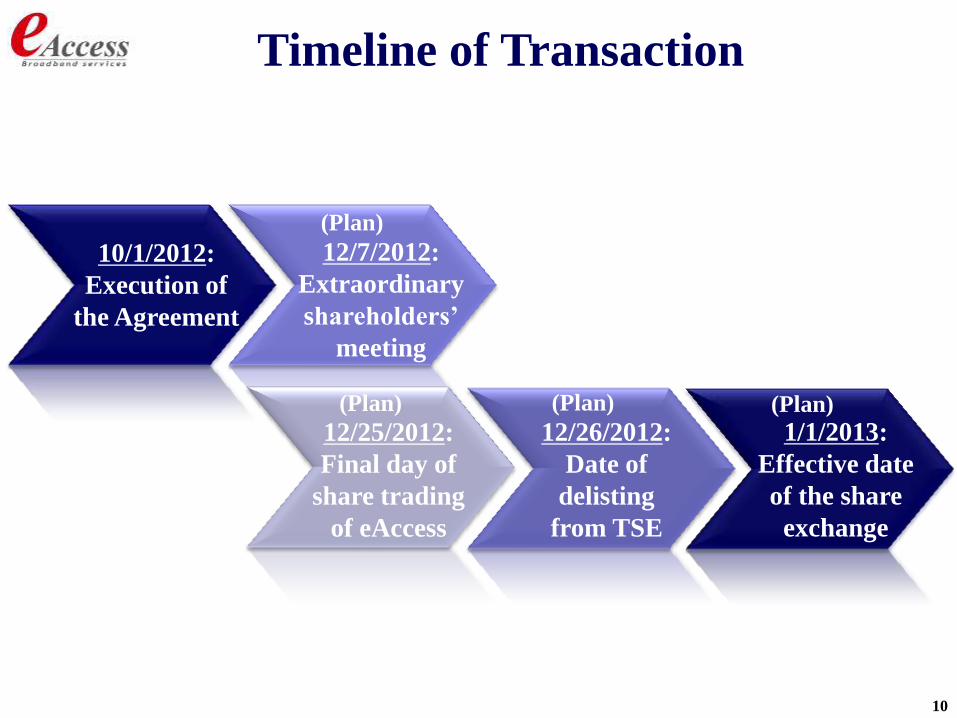
10/1/2012:
Execution of
the Agreement
12/25/2012:
Final day of
share trading
of eAccess
12/26/2012:
Date of
delisting
from TSE
1/1/2013:
Effective date
of the share
exchange
12/7/2012:
Extraordinary
shareholders’
meeting
Timeline of Transaction
(Plan)
(Plan) (Plan) (Plan)
11
EMOBILE LTE
12
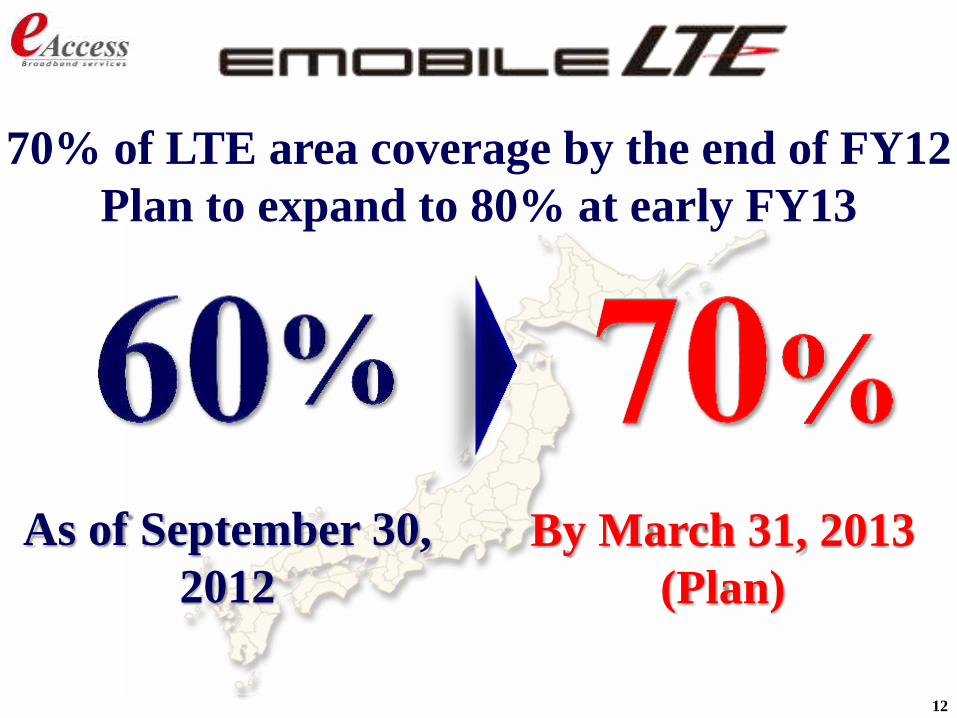
70% of LTE area coverage by the end of FY12
Plan to expand to 80% at early FY13
By March 31, 2013
(Plan)
As of September 30,
2012
13
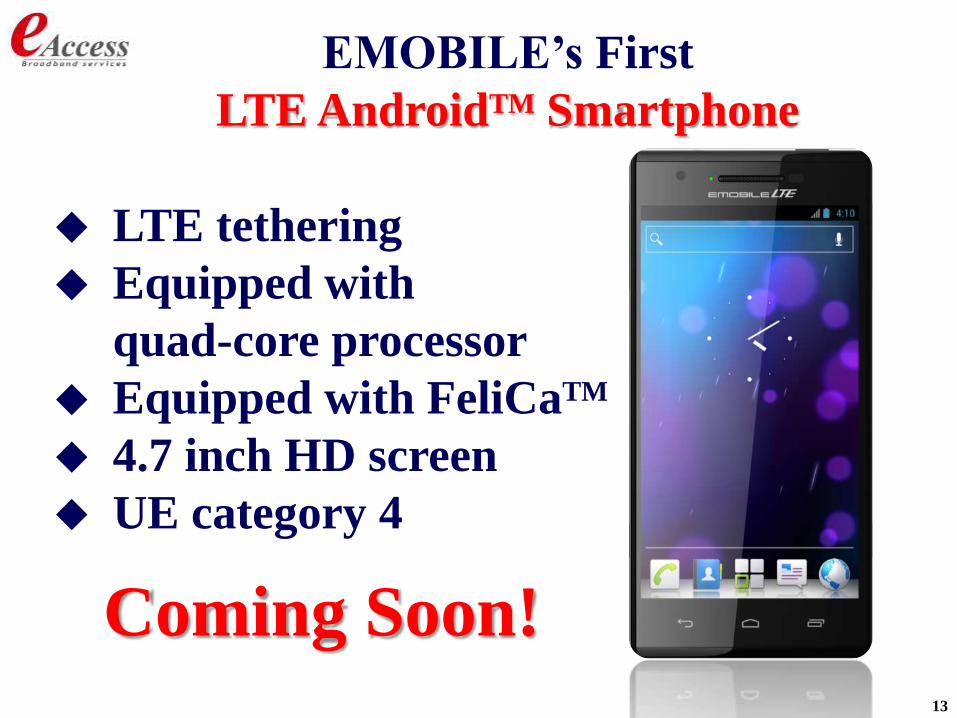
EMOBILE’s First
LTE AndroidTM Smartphone
Coming Soon!
LTE tethering
Equipped with
quad-core processor
Equipped with FeliCaTM
4.7 inch HD screen
UE category 4
14
1st Half FY3/2013 Results
15
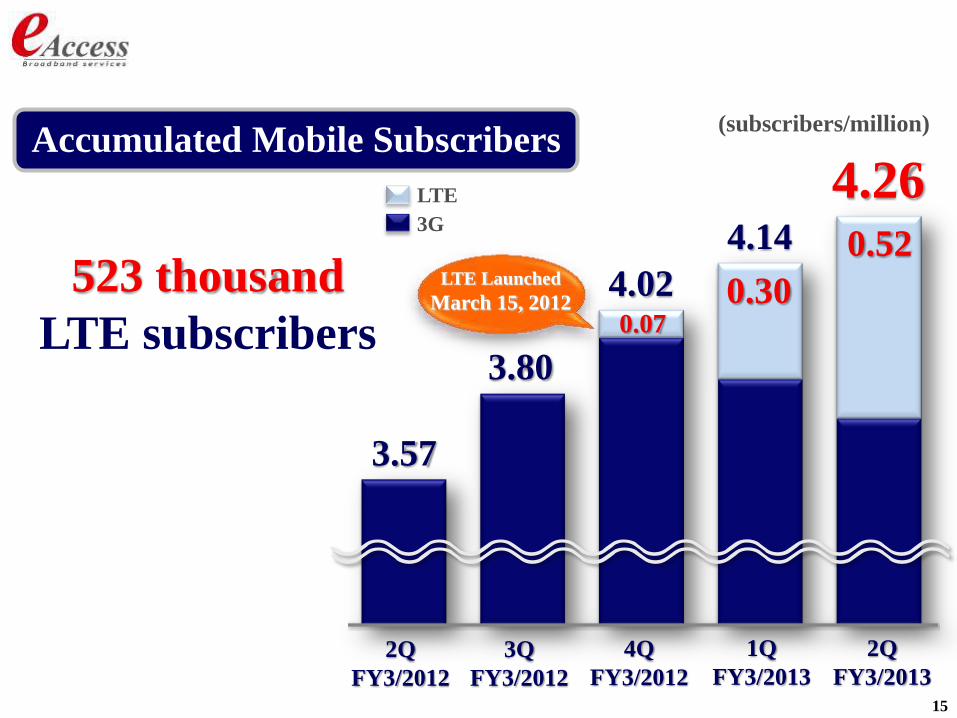
4.14
4.02
3.57
3.80
LTE
3G
4.26
LTE Launched
March 15, 2012
0.52
Accumulated Mobile Subscribers
523 thousand
LTE subscribers 0.30
0.07
2Q
FY3/2012
3Q
FY3/2012
4Q
FY3/2012
1Q
FY3/2013
2Q
FY3/2013
(subscribers/million)
16
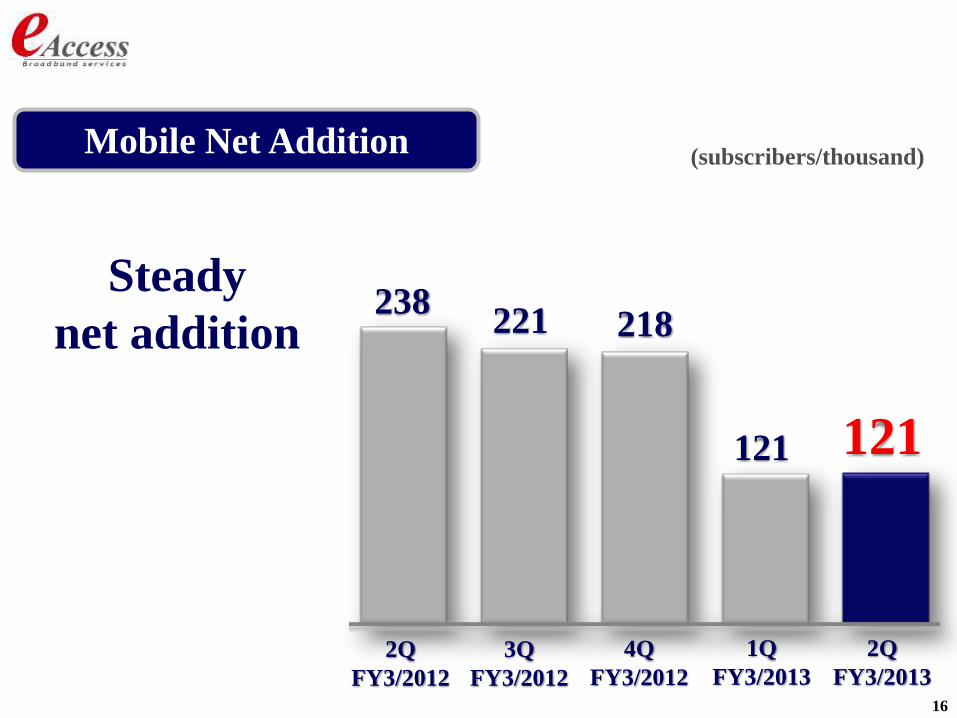
Mobile Net Addition
Steady
net addition
121
218 238
221
121
2Q
FY3/2012
3Q
FY3/2012
4Q
FY3/2012
1Q
FY3/2013
2Q
FY3/2013
(subscribers/thousand)
17
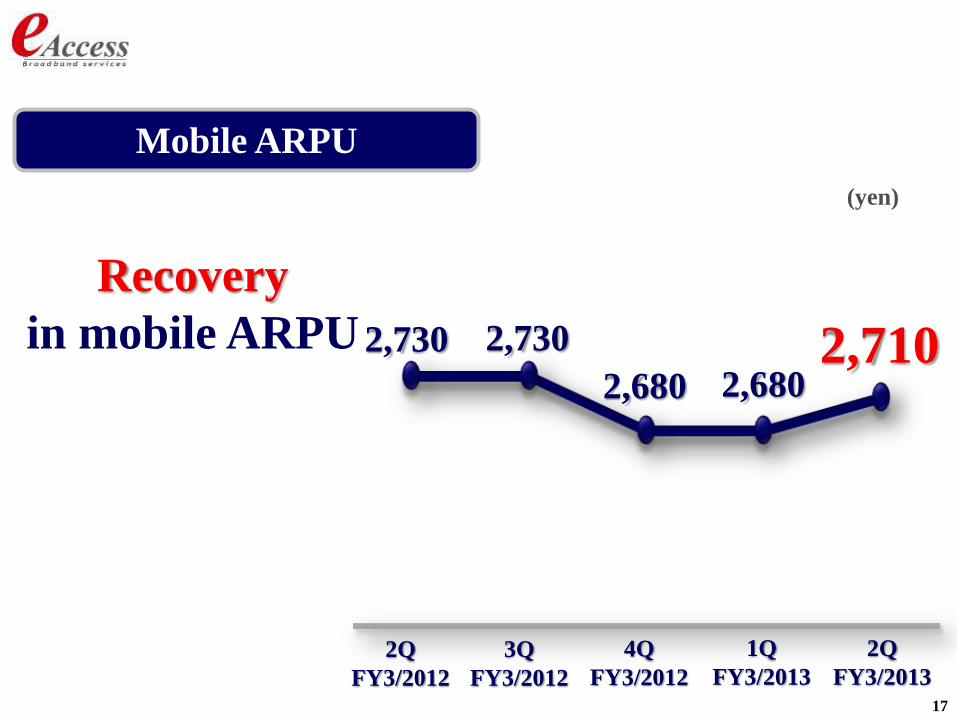
2,730 2,730
2,680 2,680 2,710
Mobile ARPU
(yen)
Recovery
in mobile ARPU
2Q
FY3/2012
3Q
FY3/2012
4Q
FY3/2012
1Q
FY3/2013
2Q
FY3/2013
18
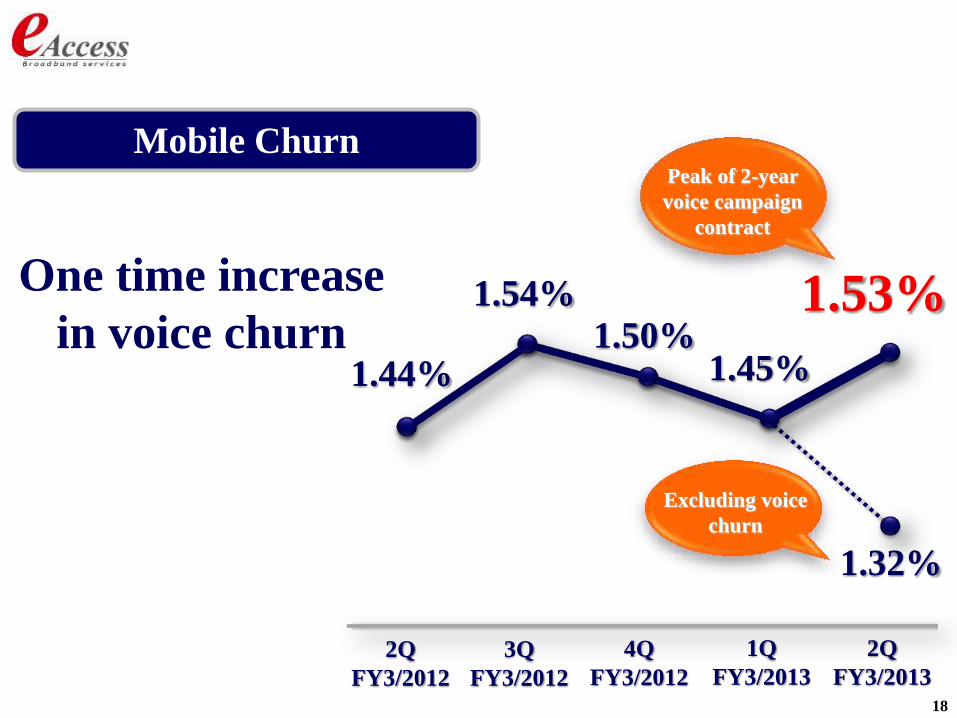
1.44%
1.54%
1.50% 1.45%
1.53%
Mobile Churn
One time increase
in voice churn
Peak of 2-year
voice campaign
contract
2Q
FY3/2012
3Q
FY3/2012
4Q
FY3/2012
1Q
FY3/2013
2Q
FY3/2013
1.32%
Excluding voice
churn
19
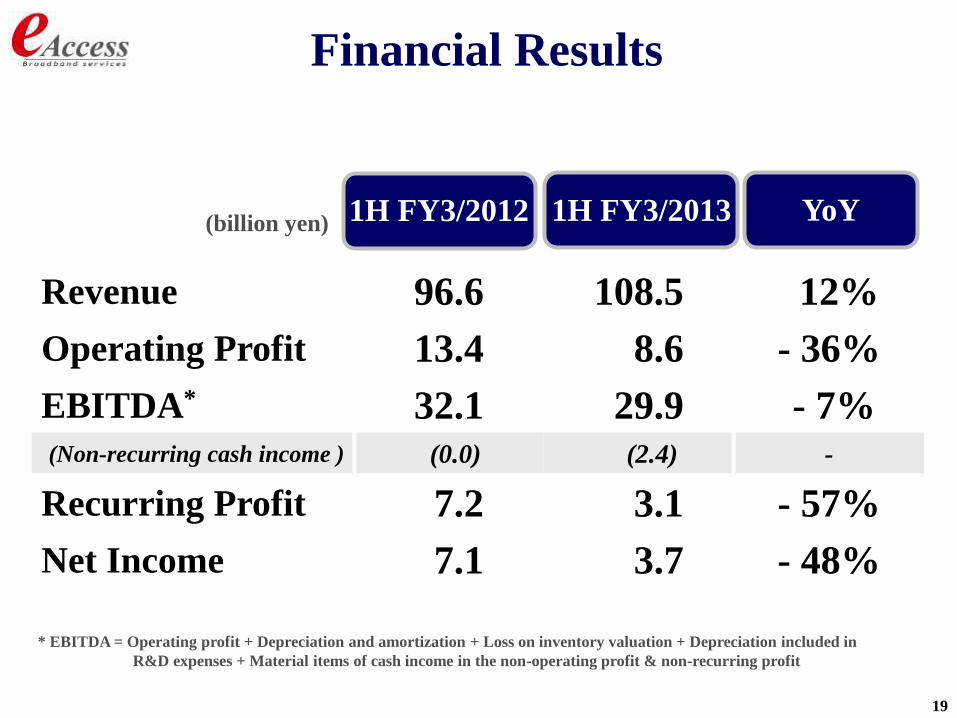
Revenue 96.6 108.5 12%
Operating Profit 13.4 8.6 - 36%
EBITDA* 32.1 29.9 - 7% (Non-recurring cash income ) (0.0) (2.4) -
Recurring Profit 7.2 3.1 - 57%
Net Income 7.1 3.7 - 48%
(billion yen)
Financial Results
* EBITDA = Operating profit + Depreciation and amortization + Loss on inventory valuation + Depreciation included in
R&D expenses + Material items of cash income in the non-operating profit & non-recurring profit
1H FY3/2013 1H FY3/2012 YoY
20
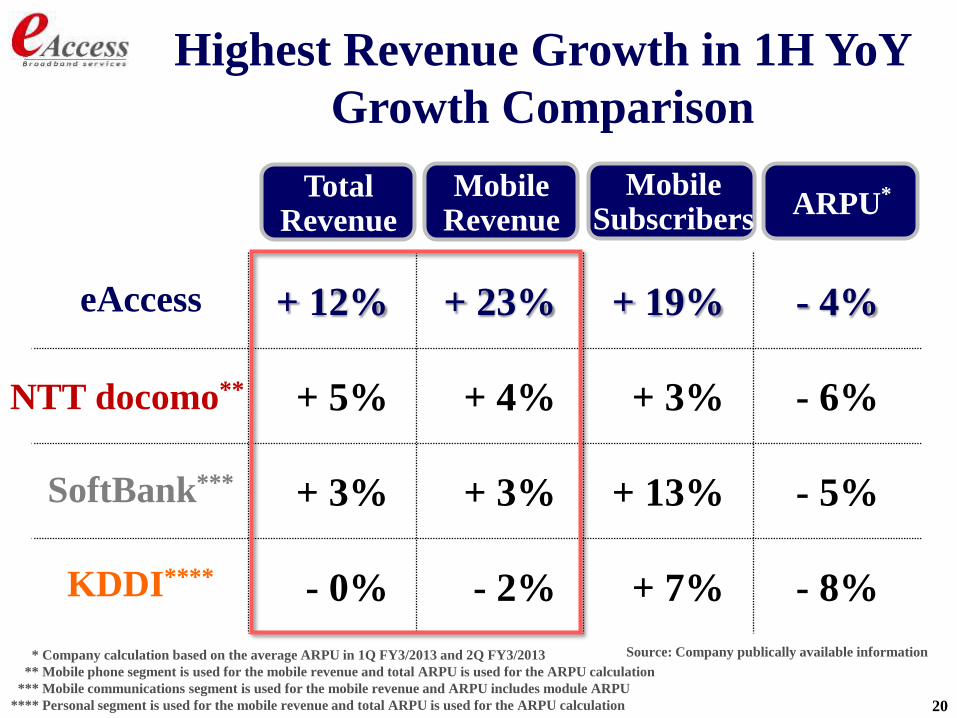
Highest Revenue Growth in 1H YoY
Growth Comparison
+ 12% + 23% + 19% - 4%
+ 5% + 4% + 3% - 6%
+ 3% + 3% + 13% - 5%
- 0% - 2% + 7% - 8%
eAccess
NTT docomo**
KDDI****
SoftBank***
Mobile Subscribers
Mobile Revenue
ARPU* Total Revenue
* Company calculation based on the average ARPU in 1Q FY3/2013 and 2Q FY3/2013
** Mobile phone segment is used for the mobile revenue and total ARPU is used for the ARPU calculation
*** Mobile communications segment is used for the mobile revenue and ARPU includes module ARPU
**** Personal segment is used for the mobile revenue and total ARPU is used for the ARPU calculation
Source: Company publically available information
21
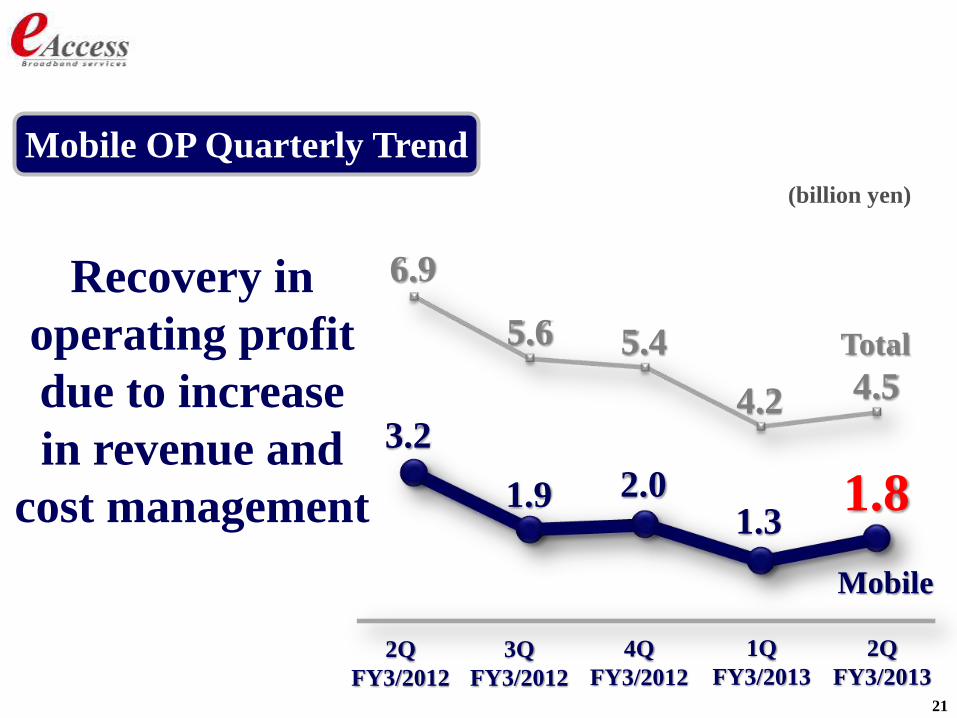
Mobile OP Quarterly Trend
2Q
FY3/2012
3Q
FY3/2012
4Q
FY3/2012
1Q
FY3/2013
2Q
FY3/2013
Recovery in
operating profit
due to increase
in revenue and
cost management
3.2
1.9 2.0 1.3
1.8
(billion yen)
6.9
5.6 5.4
4.2 4.5
Total
Mobile

22
Mobile OPEX Quarterly Trend
2Q
FY3/2012
3Q
FY3/2012
4Q
FY3/2012
1Q
FY3/2013
2Q
FY3/2013
34.4
39.7 43.3 43.5 43.3 OPEX peaked out
as advertising and
sales promotion
expense declined
14.8
19.4 21.5 22.0 21.7
(billion yen) Total OPEX Ad & Sales promotion
23
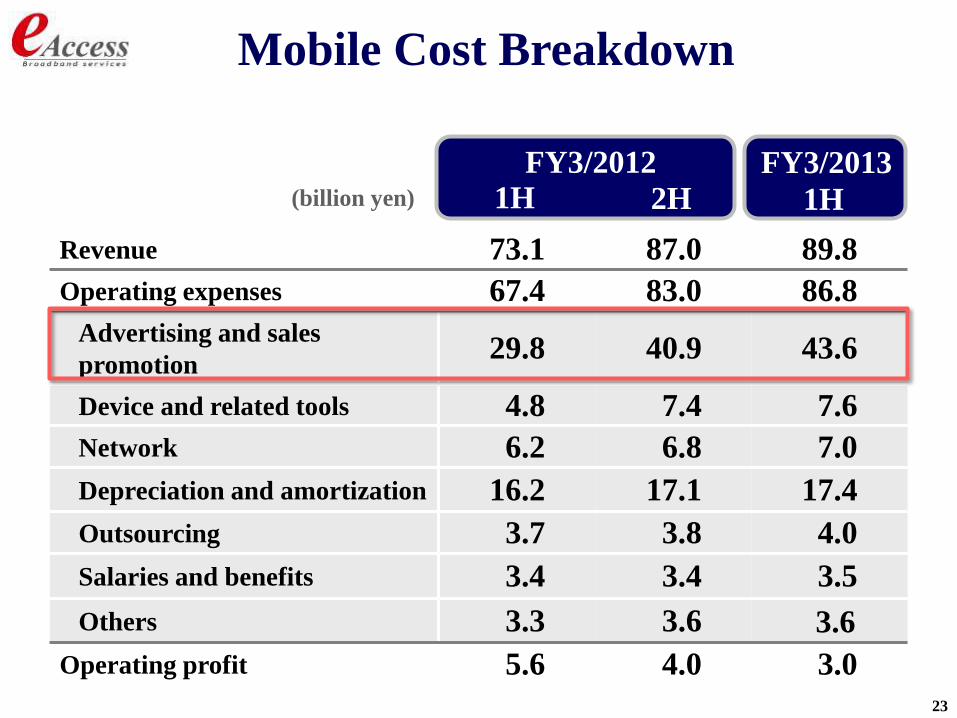
Mobile Cost Breakdown
Revenue 73.1 87.0 89.8
Operating expenses 67.4 83.0 86.8
Advertising and sales
promotion 29.8 40.9 43.6
Device and related tools 4.8 7.4 7.6
Network 6.2 6.8 7.0
Depreciation and amortization 16.2 17.1 17.4
Outsourcing 3.7 3.8 4.0
Salaries and benefits 3.4 3.4 3.5
Others 3.3 3.6 3.6
Operating profit 5.6 4.0 3.0
(billion yen)
FY3/2012 FY3/2013 1H 2H 1H

24
1H Mobile Operating Profit
YoY Comparison
+ 11.4
+ 2.5
5.6
- 13.8
- 0.8 - 1.2
- 0.7
3.0
(billion yen)
+ Service revenue
+ Device sales margin
+ Advertising and sales
promotion + Depreciation + Others
+ Network
1H
FY3/2012
1H
FY3/2013 ▲2.6
Increase in subscriber acquisition cost: 1.5 billion yen
Increase in fixed sales and marketing cost: 3.0 billion yen
Increase in customer retention cost (MVNO related) etc.: 9.3 billion yen
25
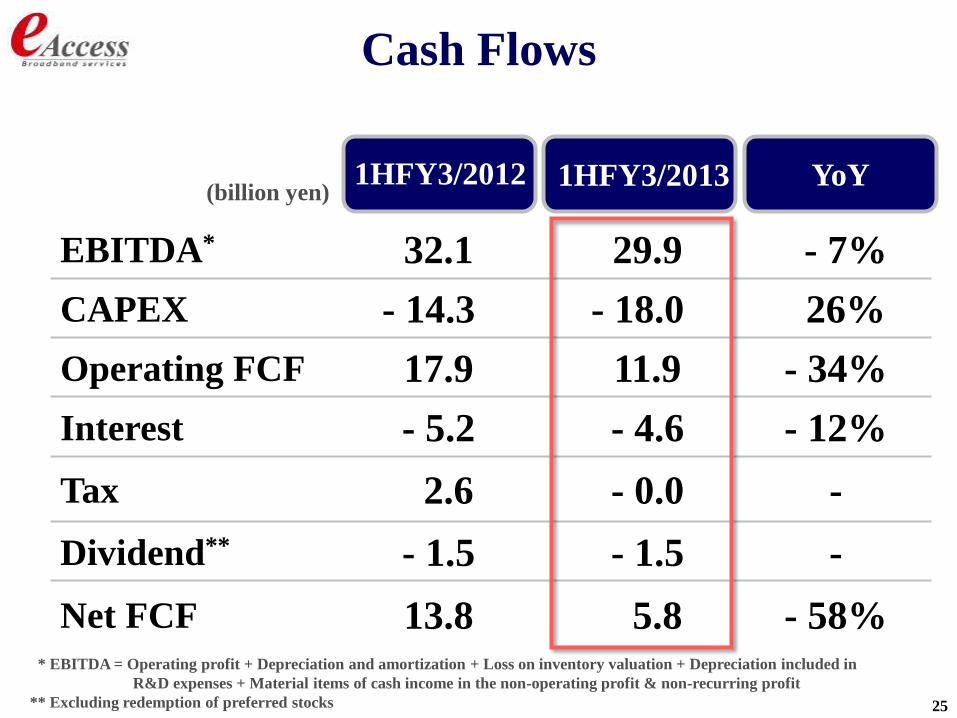
EBITDA* 32.1 29.9 - 7%
CAPEX - 14.3 - 18.0 26%
Operating FCF 17.9 11.9 - 34%
Interest - 5.2 - 4.6 - 12%
Tax 2.6 - 0.0 -
Dividend** - 1.5 - 1.5 -
Net FCF 13.8 5.8 - 58%
(billion yen)
Cash Flows
1HFY3/2013 1HFY3/2012 YoY
* EBITDA = Operating profit + Depreciation and amortization + Loss on inventory valuation + Depreciation included in
R&D expenses + Material items of cash income in the non-operating profit & non-recurring profit
** Excluding redemption of preferred stocks
26
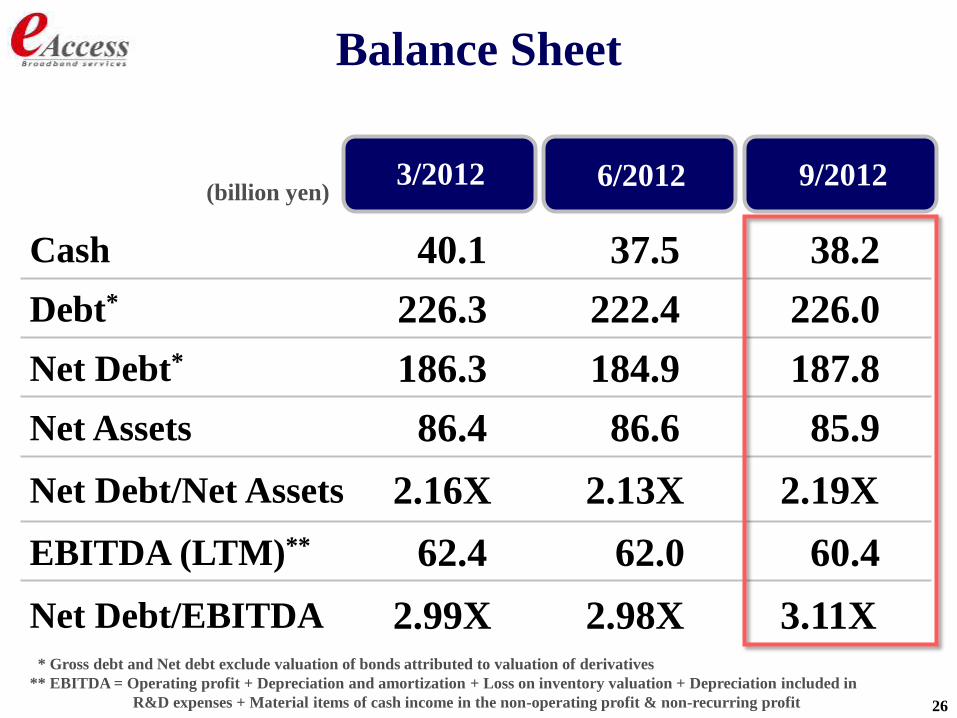
Cash 40.1 37.5 38.2
Debt* 226.3 222.4 226.0
Net Debt* 186.3 184.9 187.8
Net Assets 86.4 86.6 85.9
Net Debt/Net Assets 2.16X 2.13X 2.19X
EBITDA (LTM)** 62.4 62.0 60.4
Net Debt/EBITDA 2.99X 2.98X 3.11X
(billion yen)
Balance Sheet
6/2012 3/2012 9/2012
* Gross debt and Net debt exclude valuation of bonds attributed to valuation of derivatives
** EBITDA = Operating profit + Depreciation and amortization + Loss on inventory valuation + Depreciation included in
R&D expenses + Material items of cash income in the non-operating profit & non-recurring profit

27
28
Appendix
29
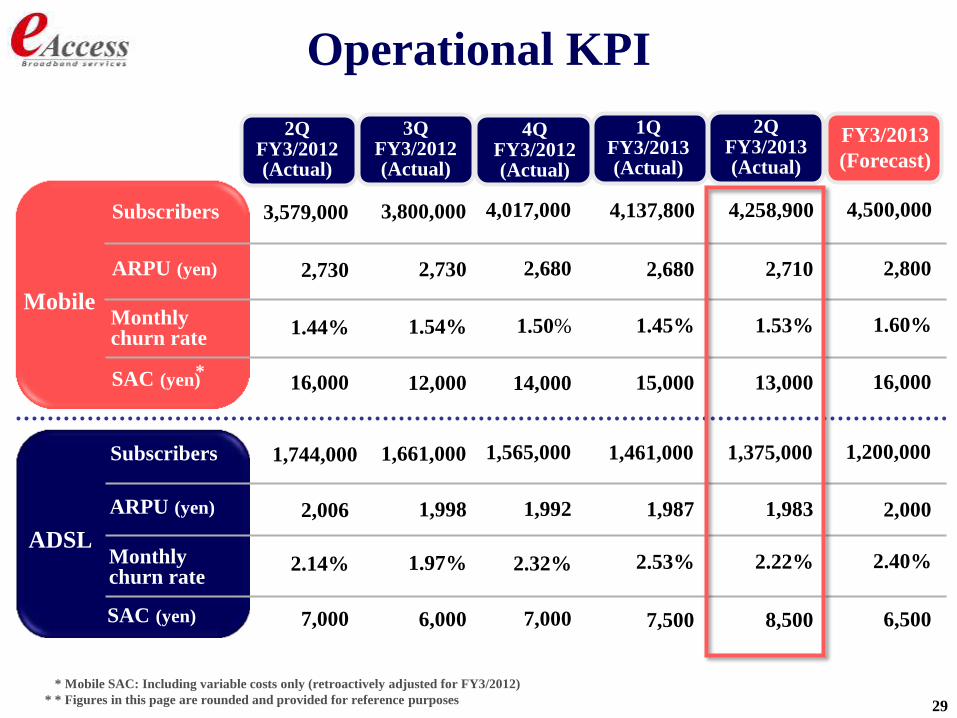
Monthly churn rate
Subscribers
ARPU (yen)
SAC (yen)
ARPU (yen)
SAC (yen)
Subscribers
Monthly churn rate
*
Mobile
ADSL
Operational KPI
2.32%
1,992
7,000
1,565,000
1.50%
4,017,000
2,680
14,000
2Q FY3/2013 (Actual)
4,137,800
1.45%
2,680
1,461,000
1,987
2.53%
7,500
15,000
FY3/2013
(Forecast)
4,500,000
1.60%
2,800
1,200,000
2,000
2.40%
6,500
16,000
2Q FY3/2012 (Actual)
3Q FY3/2012 (Actual)
3,579,000
1.44%
2,730
1,744,000
2,006
2.14%
7,000
16,000
4Q FY3/2012 (Actual)
3,800,000
1.54%
2,730
1,661,000
1,998
1.97%
6,000
12,000
1Q FY3/2013 (Actual)
* Mobile SAC: Including variable costs only (retroactively adjusted for FY3/2012)
* * Figures in this page are rounded and provided for reference purposes
4,258,900
1.53%
2,710
1,375,000
1,983
2.22%
8,500
13,000
30
This presentation has been prepared by eAccess Ltd. (“the Company”). This
presentation contains forward-looking statements, which are subject to risks,
uncertainties, and assumptions. This presentation is being presented solely for
your information and is subject to change without notice. No representation or
warranty, expressed or implied, is made and no reliance should be placed on the
accuracy, actuality, fairness, or completeness of the information presented. The
Company accept no liability whatsoever for any losses arising from any
information contained in the presentation.
This presentation does not constitute an offer or invitation to purchase or
subscribe for any shares of the Company, and no part of this presentation shall
form the basis of or be relied upon in connection with any contract or
commitment.
Disclaimer


![FY3-2011 Results.ppt [互換モード] - MUFG · FY3-2011 Results B èTokyo Stock ... Results announcement date : May 16, 2011 • Inquiries: Corporate Communications Department](https://img.pdfslide.tips/doc/110x75/5b4582137f8b9a202f8baf76/fy3-2011-mufg-fy3-2011-results-b-etokyo-stock-results.jpg)