Embed Size (px)
Citation preview

February 9, 2012
eAccess Ltd. (9427)
FY3/2012 3Q Results (4/2011 ~ 12/2011)

2
FY3/2012 3Q Results & Outlook
Platinum Band 900/700MHz
Appendix
Operational Targets & Progress

3
FY3/2012 3Q Results & Outlook
Platinum Band 900/700MHz
Appendix
Operational Targets & Progress

4
Focus on mobile broadband from 3Q
FY3/2012 3Q Results & Outlook
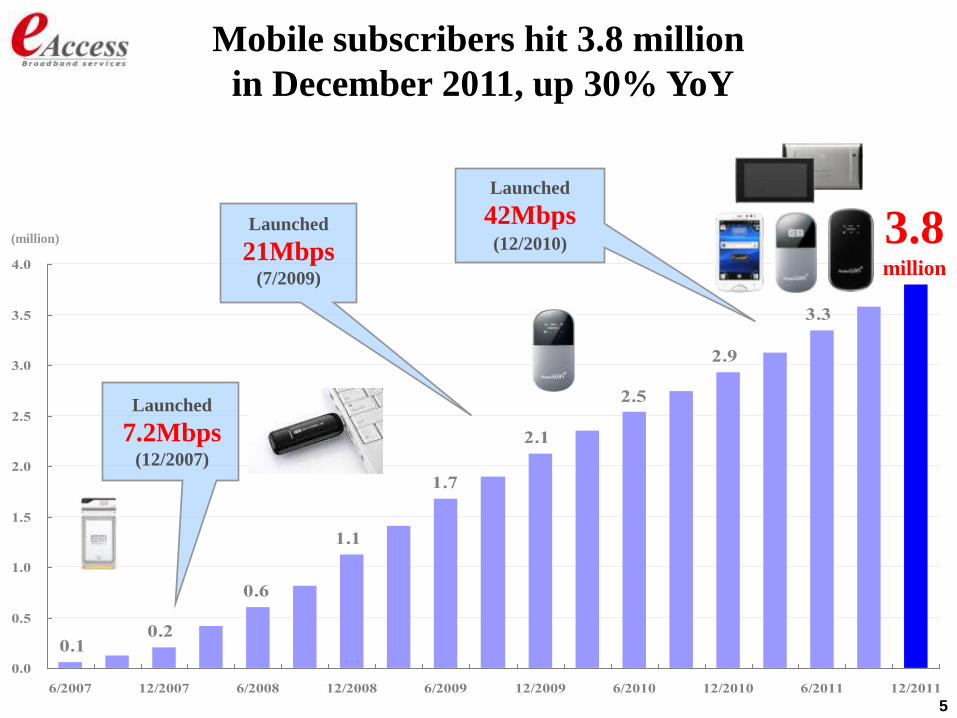
Mobile subscribers hit 3.8 million in Dec 2011
Earnings revision to reflect financials performance
5
2.1
2.9
1.1
0.2
3.3
2.5
1.7
0.6
0.1
0.0
0.5
1.0
1.5
2.0
2.5
3.0
3.5
4.0
6/2007 12/2007 6/2008 12/2008 6/2009 12/2009 6/2010 12/2010 6/2011 12/2011
(million) 3.8million
Launched
21Mbps(7/2009)
Launched
42Mbps(12/2010)
Launched
7.2Mbps(12/2007)
Mobile subscribers hit 3.8 million
in December 2011, up 30% YoY

6
0
100
200
300
Quarterly mobile subscribers
Added 221,000 net addition in 3Q, up 21% YoY
Mobile flat rate voice
one-time campaign
in 2Q
221thousand
238223
194183
204186
(thousand)
Voice customers
Datacard customers
FY3/2011 1Q FY3/2011 2Q FY3/2011 3Q FY3/2011 4Q FY3/2012 1Q FY3/2012 2Q FY3/2012 3Q

7
FY3/2010 3Q
(Pro-forma) *FY3/2011 3Q
(Pro-forma) *FY3/2012 3Q
(Actual)
YoY
(%)
Revenue 129.3 146.0 149.1 + 2%
Mobile 81.3 102.6 114.7 + 12%
Fixed Line 48.0 43.3 34.4 - 21%
EBITDA 30.4 46.5 47.3 + 2%
Mobile 9.4 28.1 32.4 +15%
Fixed Line 21.0 18.5 14.9 - 20%
EBITDA Margin 23% 32% 32% 0pt
Mobile 12% 27% 28% + 1pt
Fixed Line 44% 43% 43% 0pt
Operating Profit 7.6 20.0 19.0 - 5%
Recurring Profit - 0.6 12.0 9.7 - 19%
Net Income - 6.2 6.9 5.5 - 20%
Growth in mobile revenue & EBITDA
offset decline in fixed-line business
*Pro-forma: As if eAccess and EMOBILE were 100% consolidated and inter-company transactions were allocated to each business segment
(billion yen)
Net income for FY3/2012 3Q includes reversal of deferred tax assets of 4.1 billion yen due to the tax reform
8
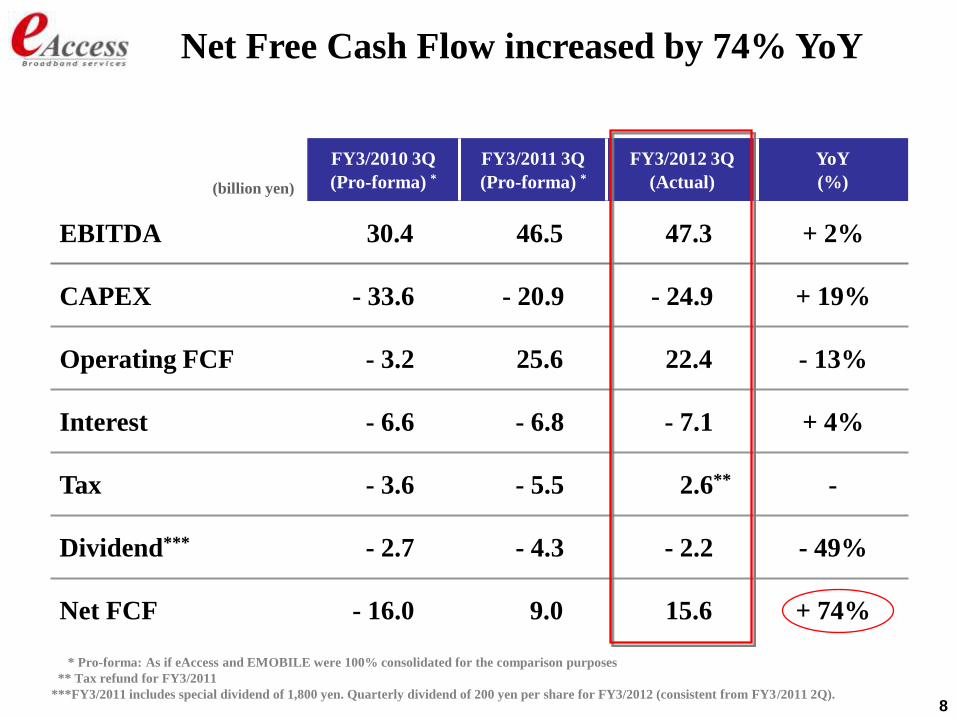
Net Free Cash Flow increased by 74% YoY
* Pro-forma: As if eAccess and EMOBILE were 100% consolidated for the comparison purposes
** Tax refund for FY3/2011
***FY3/2011 includes special dividend of 1,800 yen. Quarterly dividend of 200 yen per share for FY3/2012 (consistent from FY3/2011 2Q).
FY3/2010 3Q
(Pro-forma) *FY3/2011 3Q
(Pro-forma) *FY3/2012 3Q
(Actual)
YoY
(%)
EBITDA 30.4 46.5 47.3 + 2%
CAPEX - 33.6 - 20.9 - 24.9 + 19%
Operating FCF - 3.2 25.6 22.4 - 13%
Interest - 6.6 - 6.8 - 7.1 + 4%
Tax - 3.6 - 5.5 2.6** -
Dividend*** - 2.7 - 4.3 - 2.2 - 49%
Net FCF - 16.0 9.0 15.6 + 74%
(billion yen)
9
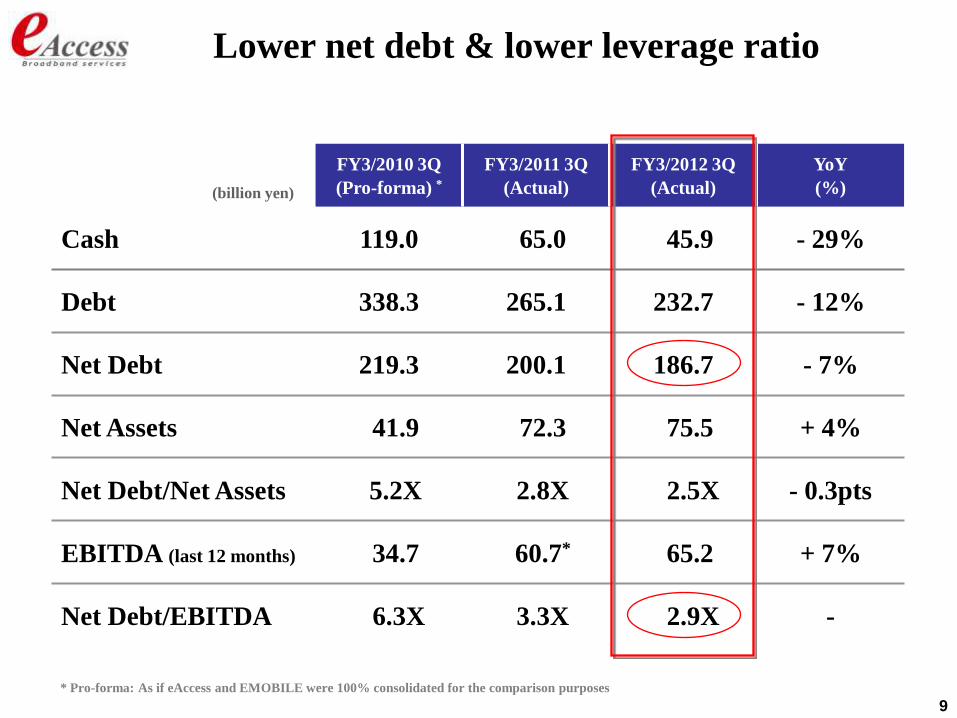
Lower net debt & lower leverage ratio
* Pro-forma: As if eAccess and EMOBILE were 100% consolidated for the comparison purposes
FY3/2010 3Q
(Pro-forma) *FY3/2011 3Q
(Actual)
FY3/2012 3Q
(Actual)
YoY
(%)
Cash 119.0 65.0 45.9 - 29%
Debt 338.3 265.1 232.7 - 12%
Net Debt 219.3 200.1 186.7 - 7%
Net Assets 41.9 72.3 75.5 + 4%
Net Debt/Net Assets 5.2X 2.8X 2.5X - 0.3pts
EBITDA (last 12 months) 34.7 60.7* 65.2 + 7%
Net Debt/EBITDA 6.3X 3.3X 2.9X -
(billion yen)

10
(billion yen)1Q
(Pro-forma)*
2Q (Pro-forma)*
3Q(Pro-forma)*
4Q(Pro-forma)*
1Q(Actual)
2Q(Actual)
3Q(Actual)
Revenue 49.0 48.2 48.8 49.7 47.6 49.0 52.5
Mobile 34.0 33.8 34.8 36.4 35.5 37.5 41.7
Fixed Line 15.0 14.4 14.0 13.3 12.1 11.5 10.9
EBITDA 15.3 14.9 16.4 17.9 15.7 16.4 15.2
Mobile 9.1 8.6 10.4 12.2 10.5 11.4 10.5
Fixed Line 6.2 6.3 6.0 5.7 5.2 5.0 4.7
EBITDA Margin 31% 31% 33% 36% 33% 34% 29%
Operating Profit 6.6 6.1 7.3 -0.7 6.5 6.9 5.6
Recurring Profit 3.7 3.5 4.9 -3.1 3.2 3.9 2.6
Net Income 1.9 1.7 3.3 9.8 3.2 3.9 - 1.6
Quarterly earnings trend
Mobile revenue with 11% QoQ growth in 3Q
Upfront investments in marketing to gain more
retail subscribers from 3Q
* Pro-forma: As if eAccess and EMOBILE were 100% consolidated and inter-company transactions were allocated to each business segment
FY3/2011 FY3/2012
Net income for FY3/2012 3Q includes reversal of deferred tax assets of 4.1 billion yen due to the tax reform
11
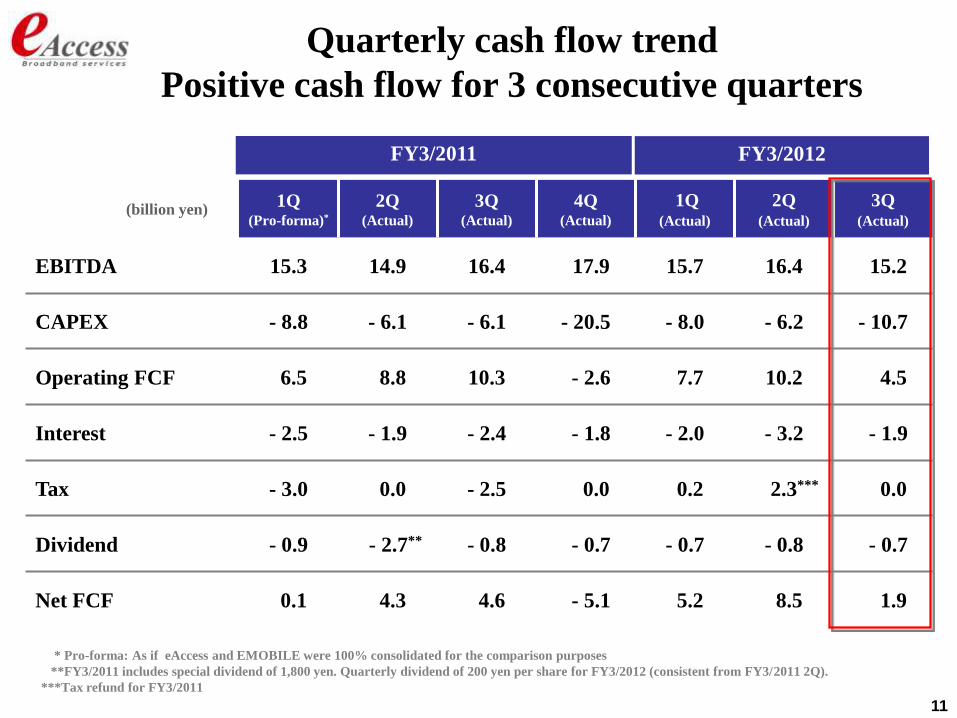
Quarterly cash flow trend
Positive cash flow for 3 consecutive quarters
* Pro-forma: As if eAccess and EMOBILE were 100% consolidated for the comparison purposes
**FY3/2011 includes special dividend of 1,800 yen. Quarterly dividend of 200 yen per share for FY3/2012 (consistent from FY3/2011 2Q).
***Tax refund for FY3/2011
(billion yen)1Q
(Pro-forma)*
2Q (Actual)
3Q(Actual)
4Q(Actual)
1Q(Actual)
2Q(Actual)
3Q(Actual)
EBITDA 15.3 14.9 16.4 17.9 15.7 16.4 15.2
CAPEX - 8.8 - 6.1 - 6.1 - 20.5 - 8.0 - 6.2 - 10.7
Operating FCF 6.5 8.8 10.3 - 2.6 7.7 10.2 4.5
Interest - 2.5 - 1.9 - 2.4 - 1.8 - 2.0 - 3.2 - 1.9
Tax - 3.0 0.0 - 2.5 0.0 0.2 2.3*** 0.0
Dividend - 0.9 - 2.7** - 0.8 - 0.7 - 0.7 - 0.8 - 0.7
Net FCF 0.1 4.3 4.6 - 5.1 5.2 8.5 1.9
FY3/2011 FY3/2012
12
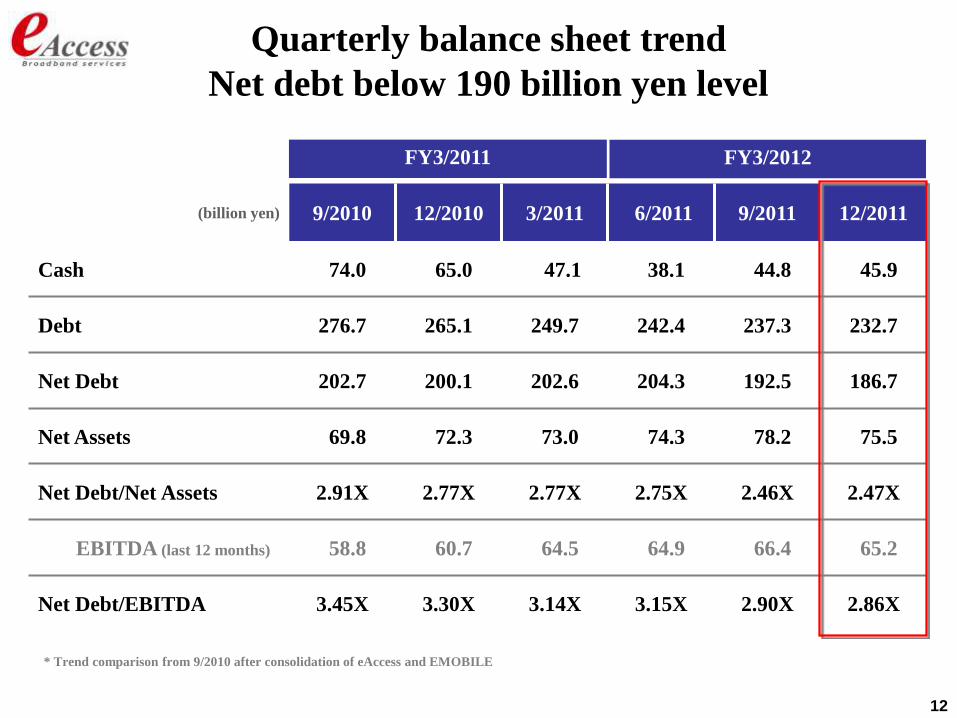
Quarterly balance sheet trend
Net debt below 190 billion yen level
* Trend comparison from 9/2010 after consolidation of eAccess and EMOBILE
(billion yen) 9/2010 12/2010 3/2011 6/2011 9/2011 12/2011
Cash 74.0 65.0 47.1 38.1 44.8 45.9
Debt 276.7 265.1 249.7 242.4 237.3 232.7
Net Debt 202.7 200.1 202.6 204.3 192.5 186.7
Net Assets 69.8 72.3 73.0 74.3 78.2 75.5
Net Debt/Net Assets 2.91X 2.77X 2.77X 2.75X 2.46X 2.47X
EBITDA (last 12 months) 58.8 60.7 64.5 64.9 66.4 65.2
Net Debt/EBITDA 3.45X 3.30X 3.14X 3.15X 2.90X 2.86X
FY3/2011 FY3/2012

13
Revenue 195.6 200.0 203.0 + 3.0
Mobile 139.1 158.0 161.0 + 3.0
Fixed Line 56.5 42.0 42.0 -
Operating Profit 19.2 30.0 25.0 - 5.0
Mobile 3.0 18.0 10.5 - 7.5
Fixed Line 16.2 12.0 14.5 + 2.5
Recurring Profit 8.9 17.0 12.5 - 4.5
Net Income 16.6 17.0 17.0 ** -
EBITDA 64.5 (33%) 67.0 (34%) 63.0 (31%) - 4.0 (- 3pts)
Mobile 40.3 51.3 44.0 - 7.3
Fixed Line 24.2 15.7 19.0 + 3.3
CAPEX 41.4 39.0 37.0 - 2.0
Mobile 39.1 37.1 35.0 - 2.1
Fixed Line 2.3 1.9 2.0 + 0.1
(billion yen)
Revision to reflect latest financials performance
Operating profit and net income
still represent all-time record high after the revision
* Pro-forma: As if eAccess and EMOBILE were 100% consolidated and inter-company transactions were allocated to each business segment
** Amount for additional deferred tax assets to be determined at year end
Pro-forma*Initial
ForecastRevisedForecast
Change in Amount
FY3/2011 FY3/2012
14
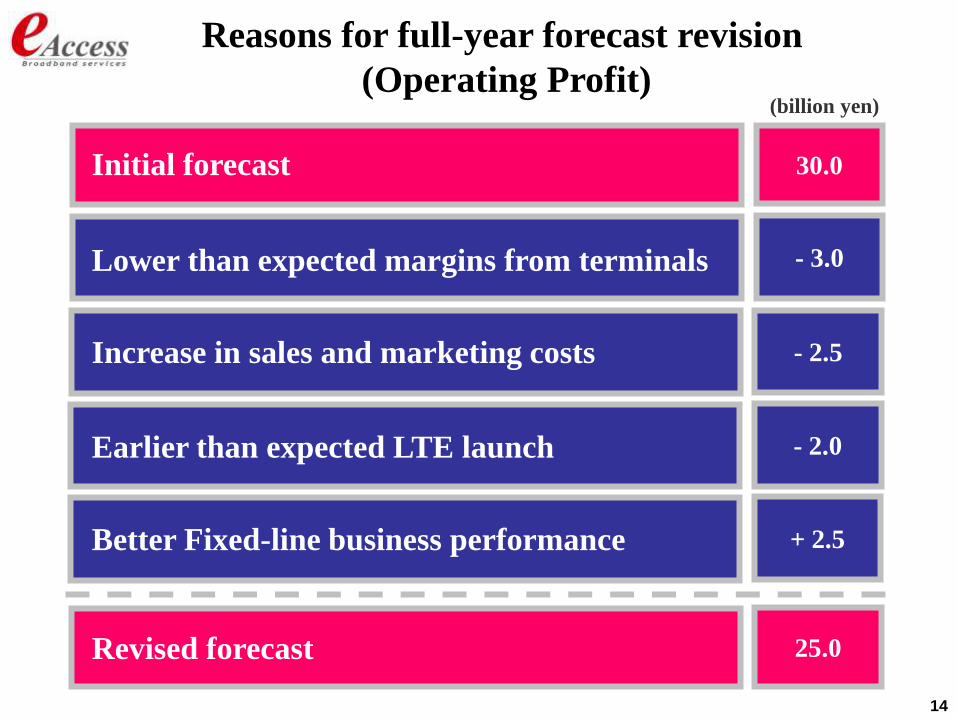
Reasons for full-year forecast revision
(Operating Profit)
Lower than expected margins from terminals - 3.0
(billion yen)
Initial forecast 30.0
- 2.5Increase in sales and marketing costs
- 2.0Earlier than expected LTE launch
+ 2.5Better Fixed-line business performance
25.0Revised forecast

15
FY3/2011 FY3/2012
Pro-forma*Initial
Forecast
Revised
Forecast
Change in
Amount
EBITDA 64.5 67.0 63.0 - 4.0
CAPEX - 41.4 - 39.0 - 37.0 - 2.0
Operating FCF 23.1 28.0 26.0 - 2.0
Interest - 8.6 - 11.0 - 11.0 -
Tax - 5.5 + 2.5 + 2.5 -
Dividend - 5.1 - 3.0 - 3.0 -
Net FCF 3.9 16.5 14.5 - 2.0
Revised Net Free Cash Flow
Maintain relatively high FCF with lower CAPEX
No change in quarterly dividend payout
(billion yen)
* Pro-forma: As if eAccess and EMOBILE were 100% consolidated for the comparison purposes

16
Operational Targets & Progress
FY3/2012 3Q Results & Outlook
Platinum Band 900/700MHz
Appendix

17
Operational targets and progress in 2H
1
2
3
Stabilize mobile ARPU
Marketing & branding investment
LTE launch in March 2012

18
Mobile ARPU trend
ARPU stabilized in 3Q mainly due to
recovery in retail subscribers as a result of
marketing investments(yen)
3,4003,250
3,1002,950 2,860
2,730 2,730
1,000
1,500
2,000
2,500
3,000
3,500
4,000
1Q
FY3/2011
2Q
FY3/2011
3Q
FY3/2011
4Q
FY3/2011
1Q
FY3/2012
2Q
FY3/2012
3Q
FY3/2012

19
1.44%1.50%1.45%1.40%
1.29%1.37%
0.0%
0.2%
0.4%
0.6%
0.8%
1.0%
1.2%
1.4%
1.6%
1.8%
1Q
FY3/2011
2Q
FY3/2011
3Q
FY3/2011
4Q
FY3/2011
1Q
FY3/2012
2Q
FY3/2012
3Q
FY3/2012
1.54%
Mobile monthly churn trend
MVNO churn increased in 3Q
Retention to increase retail subscriber mix to
achieve higher ARPU
Waive 10,000 yen contract cancellation fee for 2-year contract renewal
Free 42Mbps Pocket WiFi upgrade for 2-year contract renewal
3Q - 4Q Retention Scheme

20
Investing in marketing and branding
Strengthen product brand
position as “No. 1 Wi-Fi”
Marketing preparation for
LTE launch
Marketing Strategy
Increase company’s brand
recognition

21
LTE network strategy
Plan to launch LTE in March 2012
Expand area coverage to 70% by March 2013
* EMOBILE G4 area includes areas with 14.4Mbps, 21Mbps, and 42Mbps
LTE
HSPA+/DC-HSDPA 70%
HSPA93%
75/112Mbps
42Mbps
~21Mbps
14Mbps
Speed All IP Backbone (As of FY3/2012)

22
FY3/2012 3Q Results & Outlook
Platinum Band 900/700MHz
Appendix
Operational Targets & Progress

23
Summary of 900MHz spectrum application
Technology HSPA+ / LTE
Service LaunchMarch 2013 HSPA+ (5MHz)
December 2015 LTE (10MHz)
Population Coverage 99.4% in FY2018 (HSPA+ / LTE)
Migration Costs Up to 210 billion yen
Others
Develop Migration Scheme to resolve issues and
challenges regarding migration for existing license
holders (RFID and MCA)
Establish Migration Center as a consulting center and
Support Center for existing 900MHz (RFID and
MCA). Ensure fairness and transparency of the
migration process.
24
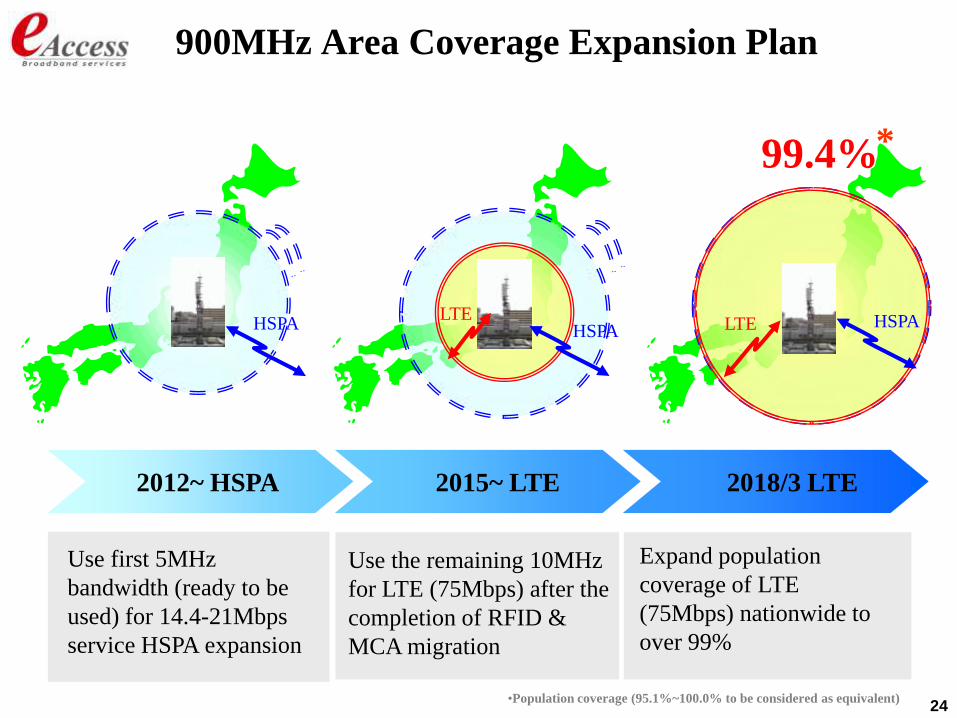
Expand population
coverage of LTE
(75Mbps) nationwide to
over 99%
LTEHSPA LTEHSPA
HSPA
900MHz Area Coverage Expansion Plan
Use the remaining 10MHz
for LTE (75Mbps) after the
completion of RFID &
MCA migration
2012~ HSPA 2015~ LTE 2018/3 LTE
•Population coverage (95.1%~100.0% to be considered as equivalent)
99.4%
Use first 5MHz
bandwidth (ready to be
used) for 14.4-21Mbps
service HSPA expansion
*

25
900/700MHz platinum band
allocation process
【900MHz】
12/9 12/14 1/27 End of Feb
【700MHz*】
* Allocation process for 700MHz based on company estimation
2011 2012 E
Allocation
Guideline
Application
began
Application
ended
Allocation
Apr May-Jun Jun-Jul
Allocation
Guideline &
public comment
Application
ends
Application
begins
Mar-
Guideline
release
Apr-May
Allocation

26
Summary
Focus on mobile broadband top-line growth
Invest in LTE and marketing and branding
Stabilize mobile ARPU
Revise current fiscal year earnings forecasts
Plan to launch LTE 75Mbps in March 2012

27
FY3/2012 3Q Results & Outlook
Platinum Band 900/700MHz
Appendix
Operational Targets & Progress

28
* Pro-forma: As if eAccess and EMOBILE were 100% consolidated and inter-company transactions were allocated to each business segment
** Extraordinary items, such as Inventory valuation loss, extraordinary losses and negative deferred income tax expense, were excluded from Pro-forma FY3/2011
for the comparison purposes
FY3/2010(Pro-forma)*
FY3/2011(Pro-forma)*
FY3/2012(Forecast)
YoY(%)
Revenue 176.5 195.6 203.0 + 3.8%
Mobile 113.6 139.1 161.0 + 15.8%
Fixed Line 62.9 56.5 42.0 - 25.7%
EBITDA 44.5 64.5 63.0 - 2.3%
Mobile 18.2 40.3 44.0 + 9.2%
Fixed Line 26.3 24.2 19.0 - 21.6%
EBITDA Margin 25.2% 33.0% 31.0% - 2.0pts
Operating Profit 11.8 19.2 25.0 + 30.1%
Recurring Profit 0.6 8.9 12.5 + 40.7%
Net Income -6.4 16.6 17.0 + 2.1%
CAPEX 55.5 41.4 37.0 - 10.6%
Debt 299.2 249.7 225.0 - 9.9%
Net Debt 224.4 202.6 185.0 - 8.7%
Net Debt/EBITDA 5.0X 3.1X 2.9X -
Pro-forma annual financials trend & forecasts
(billion yen)
29
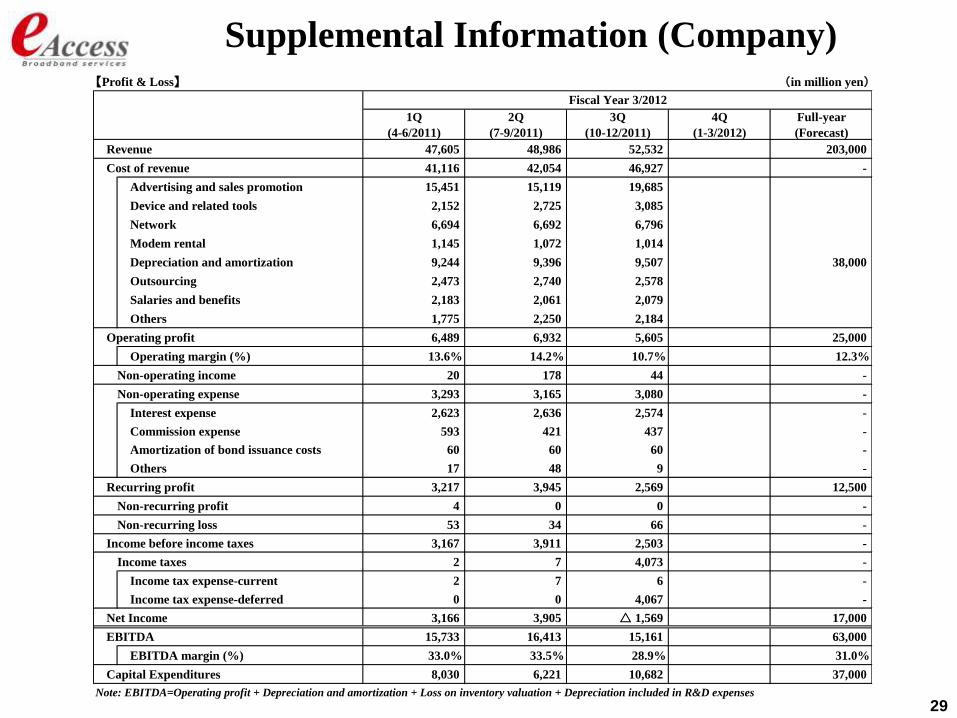
Supplemental Information (Company)【Profit & Loss】 (in million yen)
1Q
(4-6/2011)
2Q
(7-9/2011)
3Q
(10-12/2011)
4Q
(1-3/2012)
Full-year
(Forecast)
Revenue 47,605 48,986 52,532 203,000
Cost of revenue 41,116 42,054 46,927 -
Advertising and sales promotion 15,451 15,119 19,685
Device and related tools 2,152 2,725 3,085
Network 6,694 6,692 6,796
Modem rental 1,145 1,072 1,014
Depreciation and amortization 9,244 9,396 9,507 38,000
Outsourcing 2,473 2,740 2,578
Salaries and benefits 2,183 2,061 2,079
Others 1,775 2,250 2,184
Operating profit 6,489 6,932 5,605 25,000
Operating margin (%) 13.6% 14.2% 10.7% 12.3%
Non-operating income 20 178 44 -
Non-operating expense 3,293 3,165 3,080 -
Interest expense 2,623 2,636 2,574 -
Commission expense 593 421 437 -
Amortization of bond issuance costs 60 60 60 -
Others 17 48 9 -
Recurring profit 3,217 3,945 2,569 12,500
Non-recurring profit 4 0 0 -
Non-recurring loss 53 34 66 -
Income before income taxes 3,167 3,911 2,503 -
Income taxes 2 7 4,073 -
Income tax expense-current 2 7 6 -
Income tax expense-deferred 0 0 4,067 -
Net Income 3,166 3,905 △ 1,569 17,000
EBITDA 15,733 16,413 15,161 63,000
EBITDA margin (%) 33.0% 33.5% 28.9% 31.0%
Capital Expenditures 8,030 6,221 10,682 37,000
Note: EBITDA=Operating profit + Depreciation and amortization + Loss on inventory valuation + Depreciation included in R&D expenses
Fiscal Year 3/2012

30
Supplemental Information (Company)
【Balance Sheets】 (in million yen)
1Q
(4-6/2011)
2Q
(7-9/2011)
3Q
(10-12/2011)
4Q
(1-3/2012)
Full-year/
Year-end
Current assets 111,258 113,986 122,544 -
Cash and cash deposits 38,131 44,791 45,924 -
Other current assets 73,127 69,195 76,619 -
Fixed assets 227,640 223,535 219,957 -
Total Assets 340,196 338,759 343,679 -
Current liabilities 64,845 66,151 79,337
Current portion of long-term debt 43,283 43,905 45,230 -
Other current liabilities 21,562 22,246 34,107 -
Long-Term Liabilities 201,020 194,458 188,834 -
Long-term debt 199,409 189,387 183,235 -
Other long-term liabilities 1,611 5,071 5,599 -
Total Liabilities 265,865 260,609 268,170 -
Shareholders' equity 75,504 78,670 76,362
Capital stock and capital surplus 67,753 67,754 67,754 -
Retained earnings 7,751 10,917 8,609 -
Total Net Assets 74,330 78,151 75,509 -
Gross Debt 242,406 237,265 232,661 -
Bank loans 139,894 137,788 133,932 -
Bonds 69,321 68,792 68,297 -
Convertible bonds 10,851 10,841 10,832 -
Installment obligations 21,676 19,405 19,336 -
Lease obligations 664 438 263 -
Net Debt 204,275 192,474 186,737 -
Net debt/EBITDA ratio 3.15x 2.90x 2.86x -
Net debt/net assets ratio 2.75x 2.46x 2.47x -
Fiscal Year 3/2012
Note: Gross debt and Net debt exclude valuation of bonds attributed to valuation of delivertives
Note: Net debt/EBITDA ratio is calculated by dividing the Net debt by the EBITDA for the last twelve months

31
Supplemental Information (Company)
【Cash Flows】 (in million yen)
1Q
(4-6/2011)
2Q
(7-9/2011)
3Q
(10-12/2011)
4Q
(1-3/2012)
Full-year/
Year-end
12,458 19,899 13,538 -
△ 10,260 △ 10,308 △ 7,037 -
△ 9,119 △ 5,431 △ 5,367 -
Net change in cash and cash equivalents △ 6,921 4,160 1,134 -
36,477 40,637 41,770 -
【Other Indicators】
1Q
(4-6/2011)
2Q
(7-9/2011)
3Q
(10-12/2011)
4Q
(1-3/2012)
Full-year/
Year-end (Forecast)
Dividend per share (yen) 200 200 200 800
37,948 30,277 18,864 -
Dividend yield (annual) 2.1% 2.6% 4.2% -
3,465,165 3,465,180 3,465,180 -
3,464,227 3,464,700 3,464,861 -
Earnings per share (EPS) 900.63 2,014.22 1,547.99 4,853.29
Earnings per share-diluted 865.19 1,940.75 1,513.67 -
Price earnings ratio (PER) 7.34x 4.04x 3.72x -
Market capitalization 124,746 68,645 63,309 -
Net debt 204,275 192,474 186,737 -
Enterprise value (EV) 329,021 261,119 250,045 -
EV / EBITDA ratio 5.07x 3.93x 3.83x -
Number of employees 1,306 1,212 1,198 -
Note: PER is calculated by dividing the market capitalization by the full-year net income (forecast)
Note: Market capitalization is calculated by multiplying closing price at the end of the period by the number of shares of common stock at the end of the period
Note: EV/EBITDA ratio is calculated by dividing the EV by the EBITDA for the last twelve months
Fiscal Year 3/2012
Net cash provided by (used in) operating
activities
Net cash provided by (used in) investing
activities
Average number of shares of common stock
during the period
Net cash provided by (used in) financing
activities
Cash and cash equivalents at end of the period
Number of shares of common stock at the end
of the period
Average share price during the period (yen)
Fiscal Year 3/2012
32
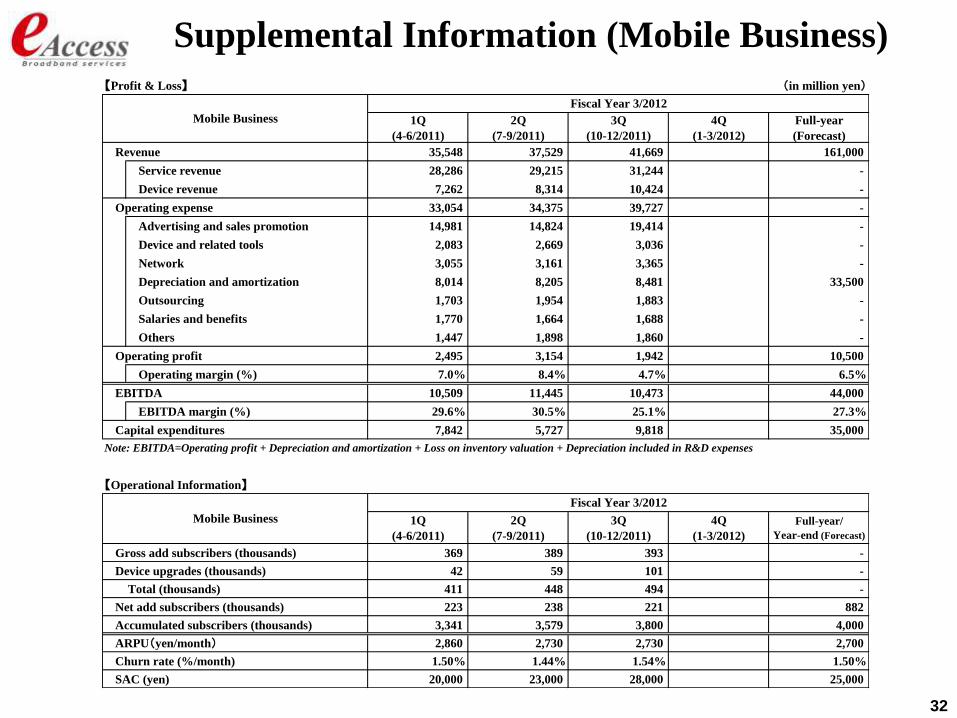
Supplemental Information (Mobile Business)
【Profit & Loss】 (in million yen)
1Q
(4-6/2011)
2Q
(7-9/2011)
3Q
(10-12/2011)
4Q
(1-3/2012)
Full-year
(Forecast)
Revenue 35,548 37,529 41,669 161,000
Service revenue 28,286 29,215 31,244 -
Device revenue 7,262 8,314 10,424 -
Operating expense 33,054 34,375 39,727 -
Advertising and sales promotion 14,981 14,824 19,414 -
Device and related tools 2,083 2,669 3,036 -
Network 3,055 3,161 3,365 -
Depreciation and amortization 8,014 8,205 8,481 33,500
Outsourcing 1,703 1,954 1,883 -
Salaries and benefits 1,770 1,664 1,688 -
Others 1,447 1,898 1,860 -
Operating profit 2,495 3,154 1,942 10,500
特別利益Operating margin (%) 7.0% 8.4% 4.7% 6.5%
EBITDA 10,509 11,445 10,473 44,000
EBITDA margin (%) 29.6% 30.5% 25.1% 27.3%
Capital expenditures 7,842 5,727 9,818 35,000
【Operational Information】
1Q
(4-6/2011)
2Q
(7-9/2011)
3Q
(10-12/2011)
4Q
(1-3/2012)
Full-year/
Year-end (Forecast)
Gross add subscribers (thousands) 369 389 393 -
Device upgrades (thousands) 42 59 101 -
Total (thousands) 411 448 494 -
Net add subscribers (thousands) 223 238 221 882
Accumulated subscribers (thousands) 3,341 3,579 3,800 4,000
ARPU(yen/month) 2,860 2,730 2,730 2,700
Churn rate (%/month) 1.50% 1.44% 1.54% 1.50%
SAC (yen) 20,000 23,000 28,000 25,000
Mobile Business
Fiscal Year 3/2012
Note: EBITDA=Operating profit + Depreciation and amortization + Loss on inventory valuation + Depreciation included in R&D expenses
Fiscal Year 3/2012
Mobile Business

33
Supplemental Information (Fixed-line Business)
【Profit & Loss】 (in million yen)
1Q
(4-6/2011)
2Q
(7-9/2011)
3Q
(10-12/2011)
4Q
(1-3/2012)
Full-year
(Forecast)
Revenue 12,057 11,457 10,863 42,000
Operating expense 8,063 7,680 7,201 -
Advertising and sales promotion 470 296 271 -
Network 3,639 3,531 3,431 -
Modem rental 1,145 1,072 1,014 -
Depreciation and amortization 1,231 1,191 1,026 4,500
Outsourcing 770 786 695 -
Salaries and benefits 413 397 391 -
Others 397 408 373 -
Operating profit 3,994 3,778 3,663 14,500
特別利益Operating margin (%) 33.1% 33.0% 33.7% 34.5%
EBITDA 5,225 4,969 4,689 19,000
EBITDA margin (%) 43.3% 43.4% 43.2% 45.2%
Capital expenditures 189 494 864 2,000
【Operational Information】
1Q
(4-6/2011)
2Q
(7-9/2011)
3Q
(10-12/2011)
4Q
(1-3/2012)
Full-year/
Year-end (Forecast)
Net add subscribers (thousands) △ 89 △ 95 △ 83 △328
Accumulated subscribers (thousands) 1,839 1,744 1,661 1,600
ARPU (yen/month) 2,009 2,006 1,998 1,900
Churn rate (%/month) 2.04% 2.14% 1.97% 2.10%
SAC (yen) 7,500 7,000 6,000 8,000
Fiscal Year 3/2012
Fixed-line Business
Fixed-line Business
Fiscal Year 3/2012
Note: EBITDA=Operating profit + Depreciation and amortization
34
This presentation has been prepared by eAccess Ltd. (“the Company”). This
presentation contains forward-looking statements, which are subject to risks,
uncertainties, and assumptions. This presentation is being presented solely for
your information and is subject to change without notice. No representation or
warranty, expressed or implied, is made and no reliance should be placed on the
accuracy, actuality, fairness, or completeness of the information presented. The
Company accept no liability whatsoever for any losses arising from any
information contained in the presentation.
This presentation does not constitute an offer or invitation to purchase or
subscribe for any shares of the Company, and no part of this presentation shall
form the basis of or be relied upon in connection with any contract or
commitment.
Disclaimer