Embed Size (px)
Citation preview
Dr. Hisham Abdelbaki Managerial Economics
1
ECON 340
Review of Mathematical Concepts
Dr. Hisham Abdelbaki Managerial Economics
2
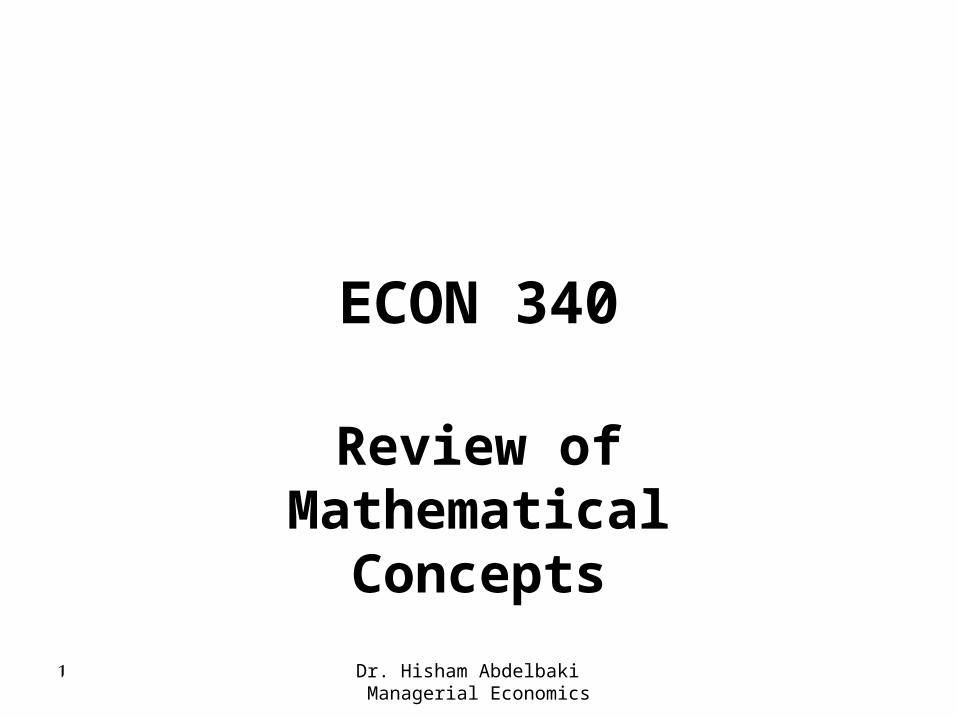
Types of DATA• Time series• Show the values of an
economic variable over period of time
• National income in Bahrain during the period 1995 – 2002
• A consumer’s consumption for pizza during a week
• Gross section• Show the values of an
economic variable for different groups at a point in time
• National income for Arab countries in 2002
• Households’ consumption of pizza on last Saturday.
BOTH
Dr. Hisham Abdelbaki Managerial Economics
3
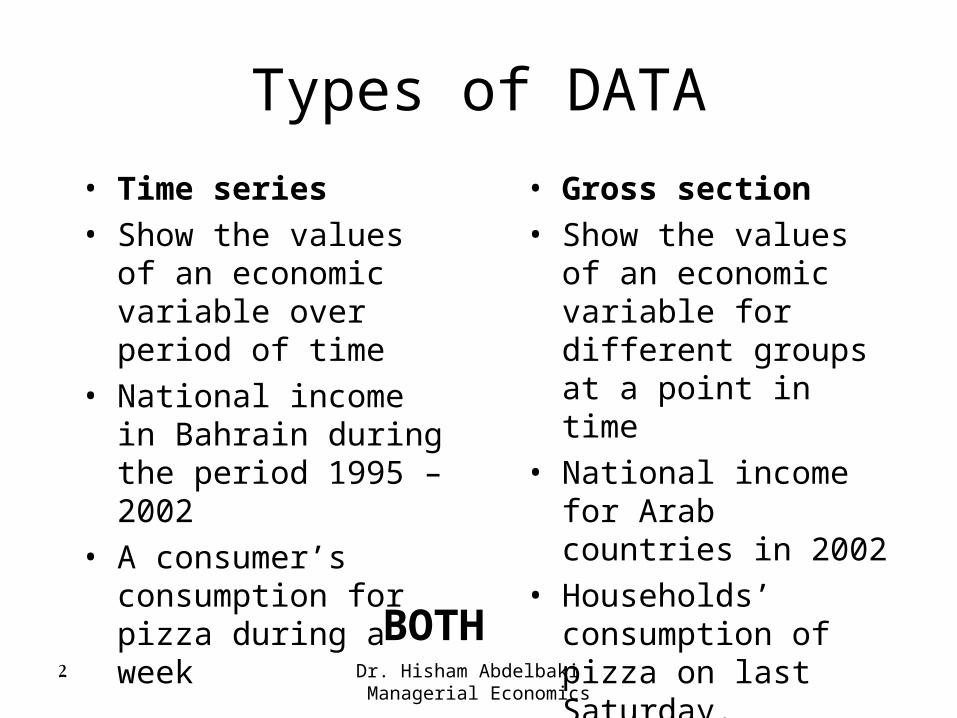
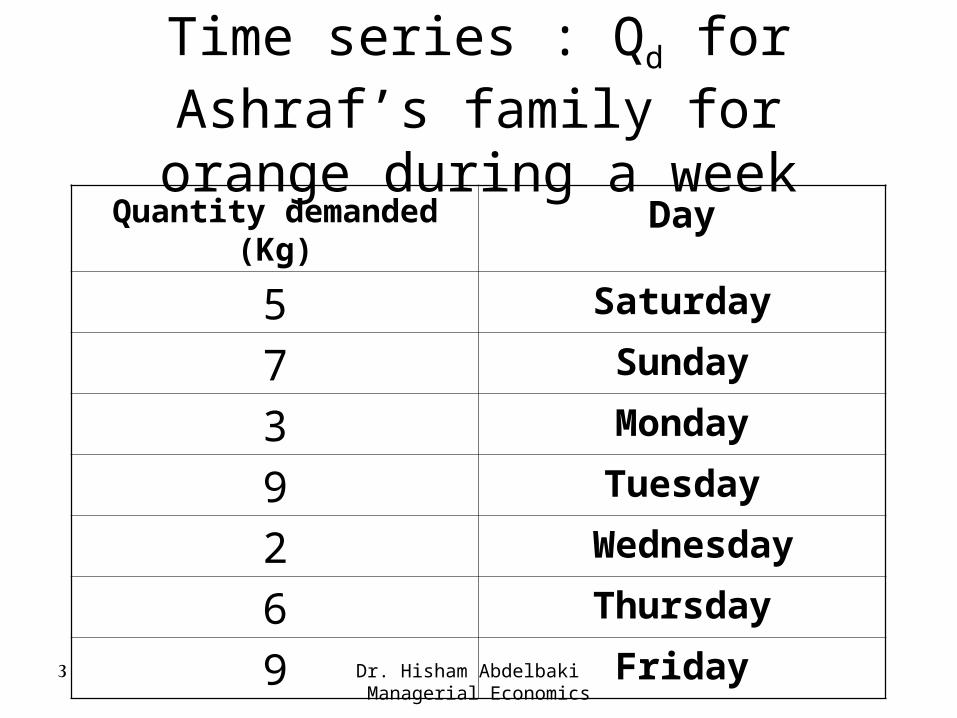
Time series : Qd for Ashraf’s family for orange during a week
DayQuantity demanded (Kg)
Saturday5Sunday7Monday3Tuesday9
Wednesday 2Thursday6
Friday9
Dr. Hisham Abdelbaki Managerial Economics
4
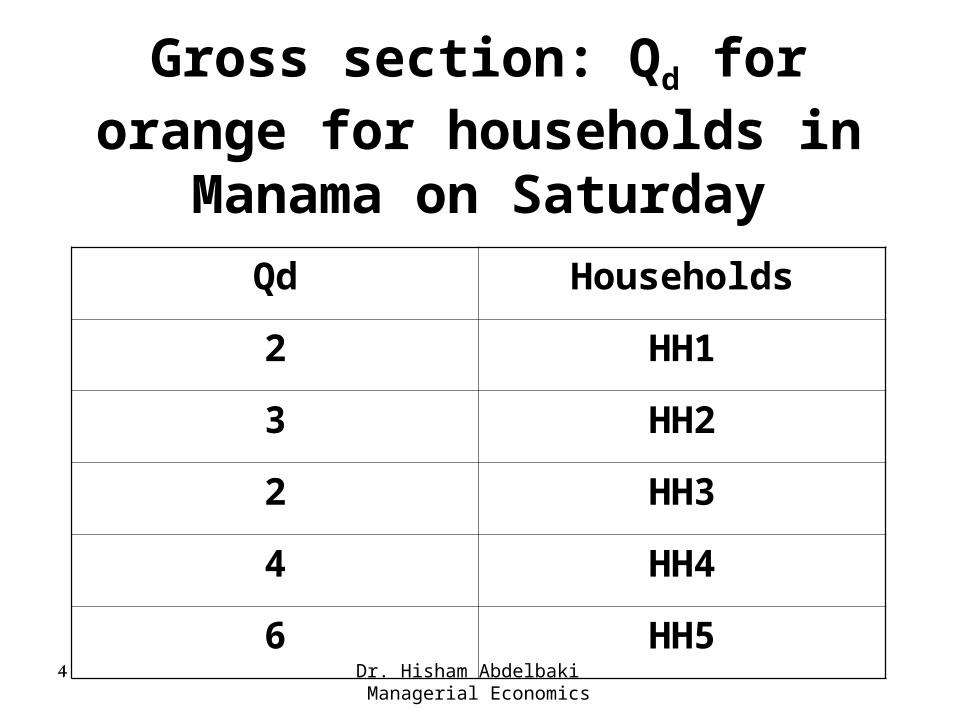
Gross section: Qd for orange for households in Manama on
SaturdayHouseholdsQd
HH12
HH23
HH32
HH44
HH56
Dr. Hisham Abdelbaki Managerial Economics
5
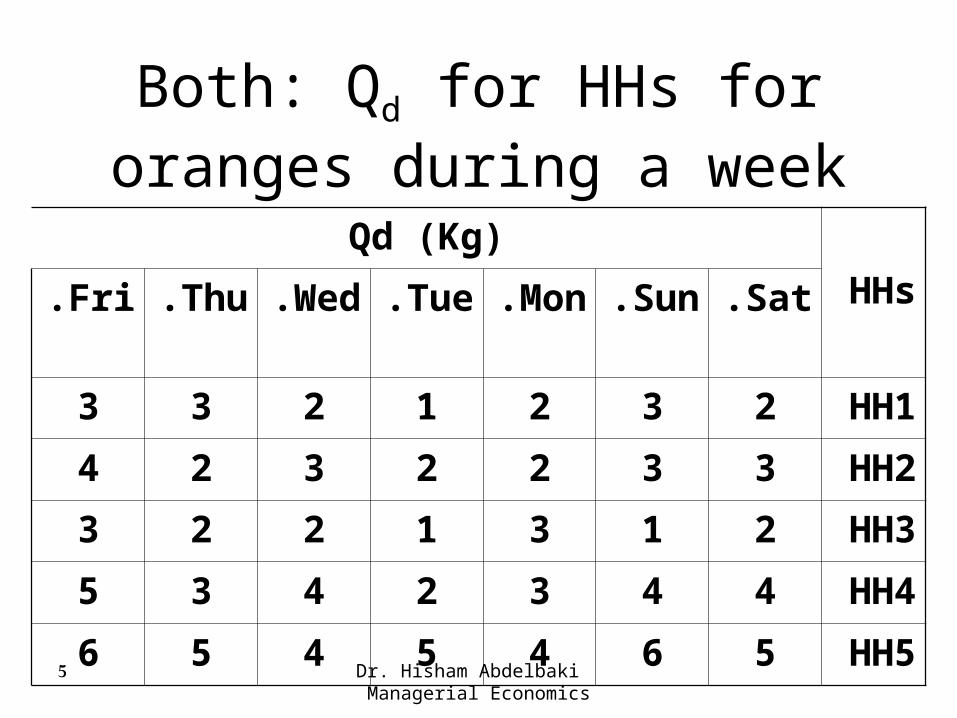
Both: Qd for HHs for oranges during a week
HHsQd (Kg)
Sat.Sun.Mon.Tue.Wed.Thu.Fri.
HH12321233HH23322324HH32131223HH44432435HH55645456
Dr. Hisham Abdelbaki Managerial Economics
6
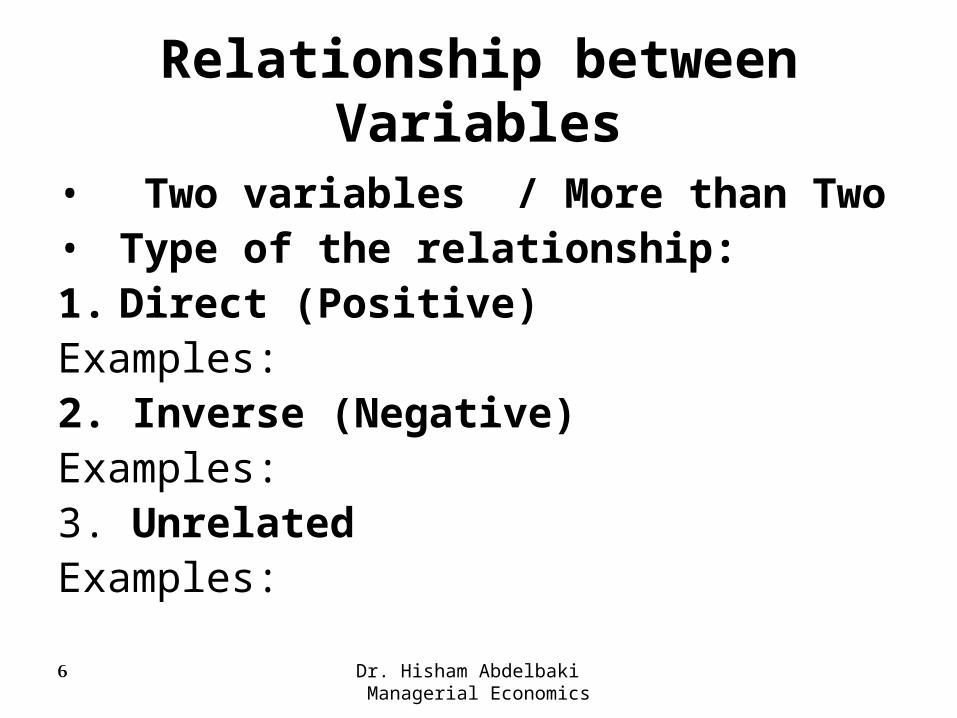
Relationship between Variables
• Two variables / More than Two• Type of the relationship:1. Direct (Positive)Examples:2. Inverse (Negative)Examples:3. UnrelatedExamples:
Dr. Hisham Abdelbaki Managerial Economics
7
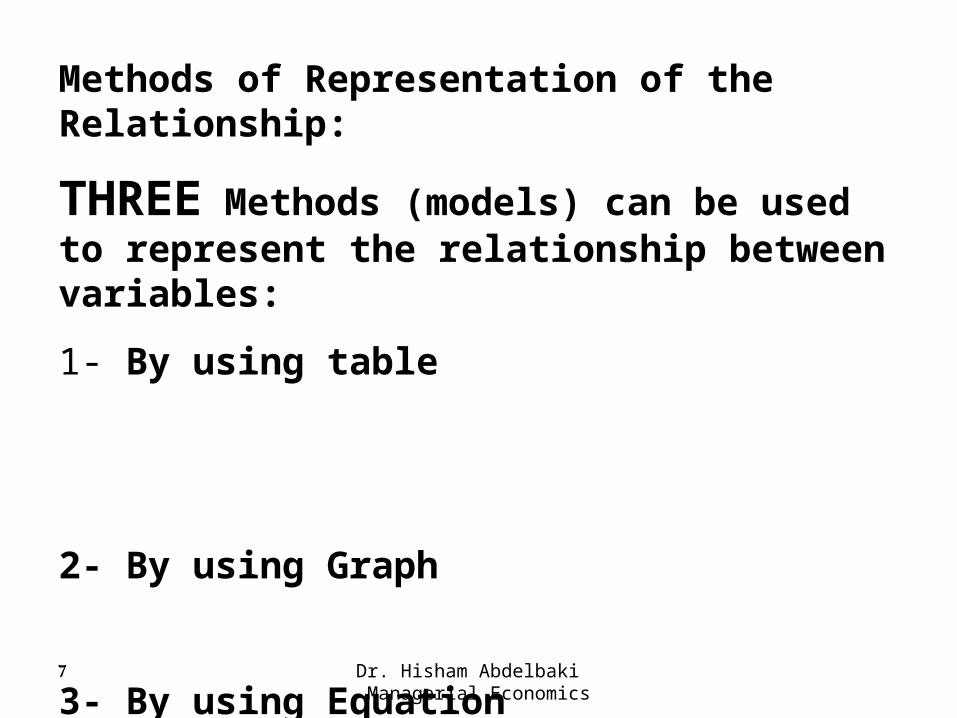
Methods of Representation of the Relationship:
THREE Methods (models) can be used to represent the relationship between variables:
1- By using table
2- By using Graph
3- By using Equation
Dr. Hisham Abdelbaki Managerial Economics
8
Functional Forms• Linear equation: the independent variable is raised to the
first power.
• Quadratic equation: the independent variable is raised to the
second power (i.e. squared).
• Cubic equation:the independent variable is raised to the third
power.
Dr. Hisham Abdelbaki Managerial Economics
9
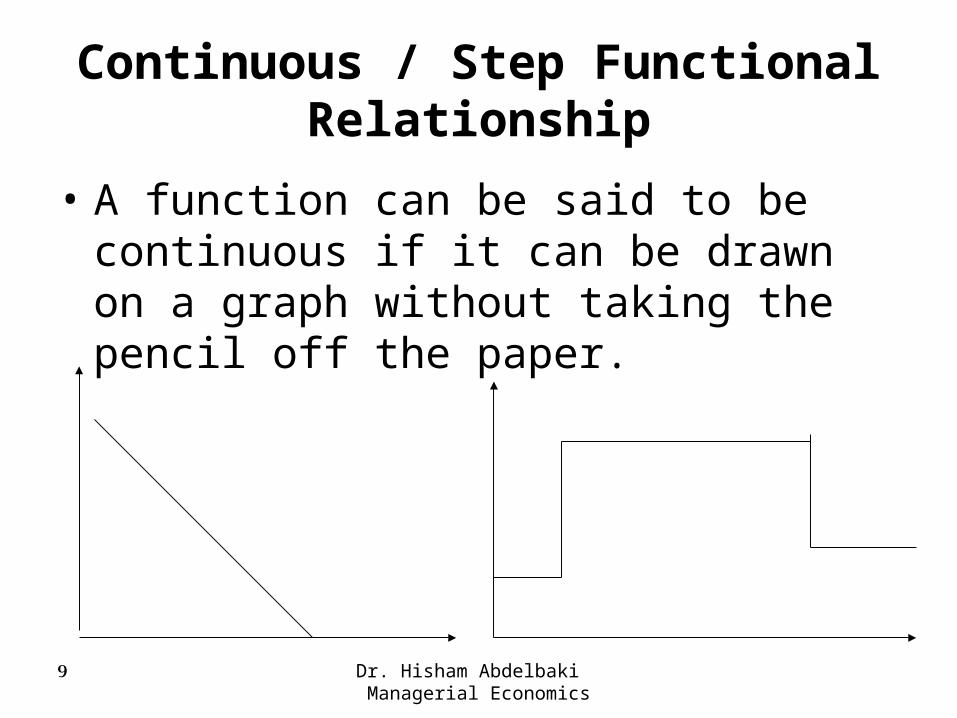
Continuous / Step Functional Relationship
• A function can be said to be continuous if it can be drawn on a graph without taking the pencil off the paper.
Dr. Hisham Abdelbaki Managerial Economics
10
5 Functions Used in The Textbook
1. Demand (linear)
2. Total Revenue (quadratic)
3. Production (cubic)
4. Cost (cubic)
5. Profit (cubic)
Dr. Hisham Abdelbaki Managerial Economics
11
Slope (Gradient) of a Curve• Change in the value of the variable measured on the –y axis divided by the change in the value of the variable measured on the – x axis.• = ∆Y / ∆ X (read “delta Y over delta X”)• = vertical distance between two points / horizontal distance between two points.
• Example: find the slope of the straight line passing through: A (1,2) and C (4, 1) = slope = (1-2) / (4-1) = -1 / 3
Dr. Hisham Abdelbaki Managerial Economics
12
Slope of Straight and Curved Line
• The slope of a straight line is constant.
• The slope of a curved line is NOT constant. Its slope depends on where on the line we calculate it.
• We can calculate the slope of a curved line by drawing a line tangent to the curve at that point (the slope of the curve will equal the slope of the tangent at that point)
Dr. Hisham Abdelbaki Managerial Economics
13
What is the difference between:
1- Intersection and tangent
2- Movement and Shifting
Dr. Hisham Abdelbaki Managerial Economics
14
Using Calculus (Derivative)• Calculus can be applied only if the function
is continuous.• Calculus is Slope – Finding• Calculus can be used to find the slope of
tangent to any point on a line. The slope of the graph of a function is called the derivative.
• An alternative notation for the derivative is dY / d X (read” dee Y by dee X”)
Dr. Hisham Abdelbaki Managerial Economics
15
Finding the Derivative of a Function• Rules:1. The derivative of a constant = ZERO
2. Power Functions: Y = Xn = n Xn-1
(bring down the power and subtract one from the power)
Example: Y = 5 X6 + X3 + 10
Dr. Hisham Abdelbaki Managerial Economics
16
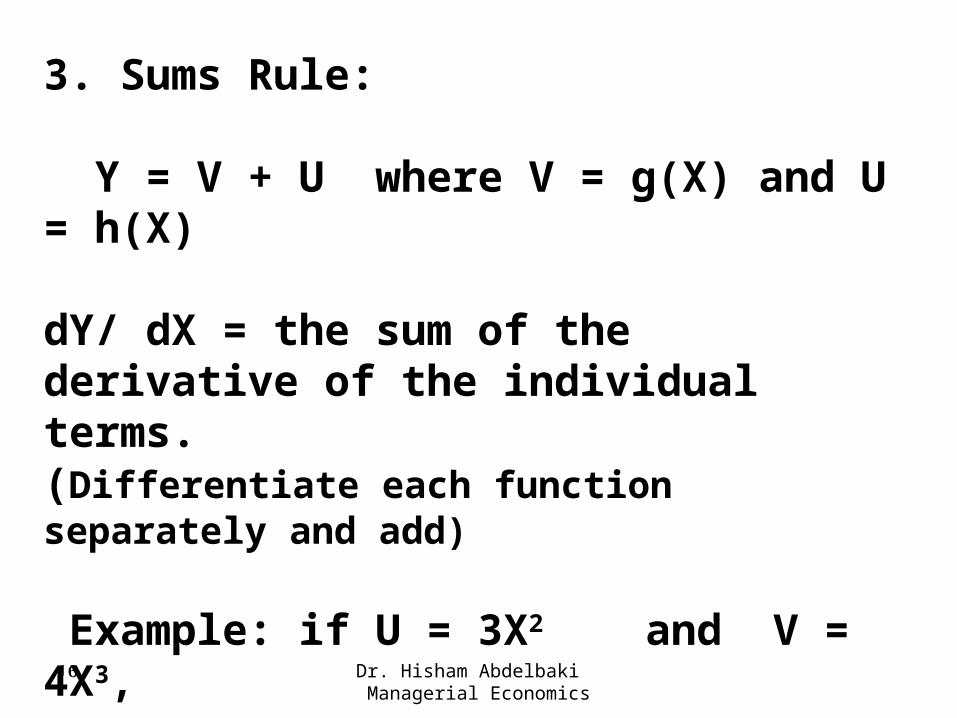
3. Sums Rule:
Y = V + U where V = g(X) and U = h(X)
dY/ dX = the sum of the derivative of the individual terms.(Differentiate each function separately and add)
Example: if U = 3X2 and V = 4X3,
so dY/ dX = 6X + 12 X2
Dr. Hisham Abdelbaki Managerial Economics
17
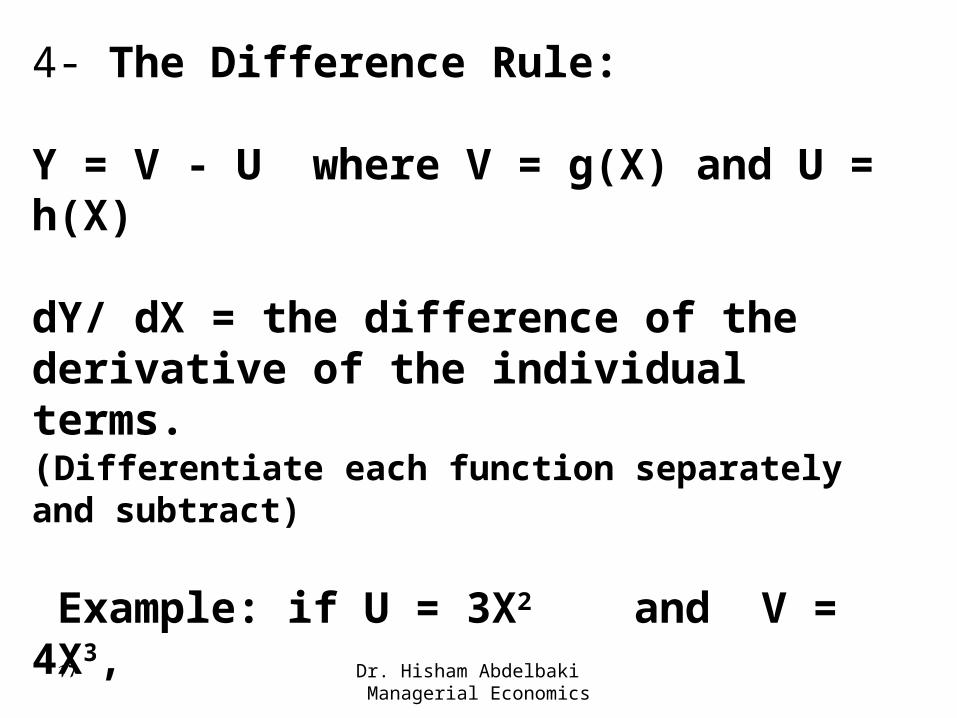
4- The Difference Rule:
Y = V - U where V = g(X) and U = h(X)
dY/ dX = the difference of the derivative of the individual terms.(Differentiate each function separately and subtract)
Example: if U = 3X2 and V = 4X3,
so dY/ dX = 6X - 12 X2
Dr. Hisham Abdelbaki Managerial Economics
18
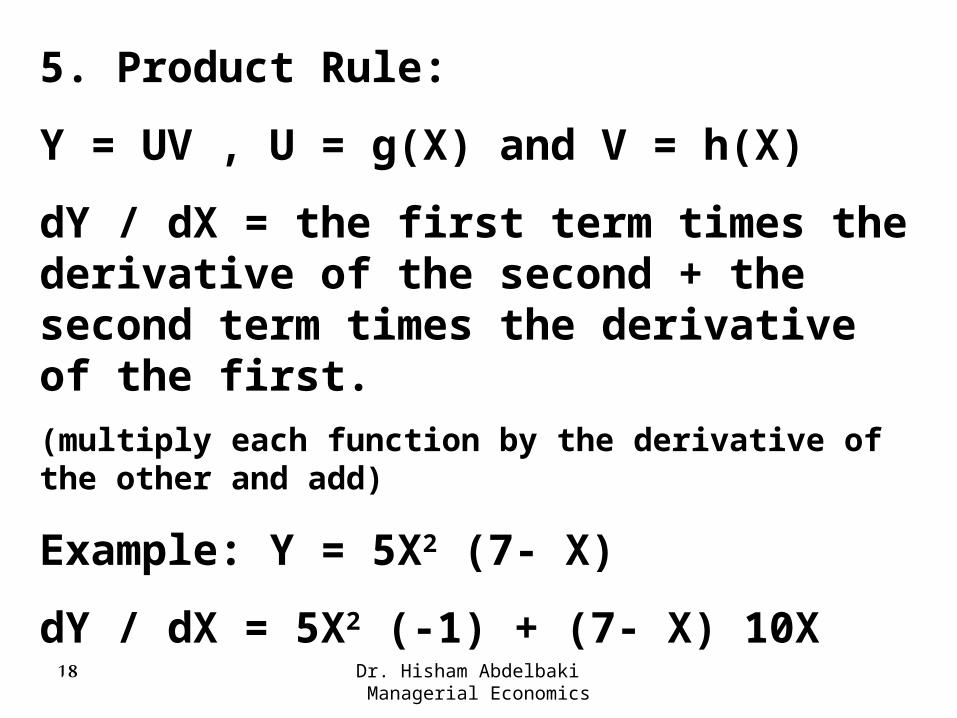
5. Product Rule:
Y = UV , U = g(X) and V = h(X)
dY / dX = the first term times the derivative of the second + the second term times the derivative of the first.(multiply each function by the derivative of the other and add)
Example: Y = 5X2 (7- X)
dY / dX = 5X2 (-1) + (7- X) 10X
Dr. Hisham Abdelbaki Managerial Economics
19
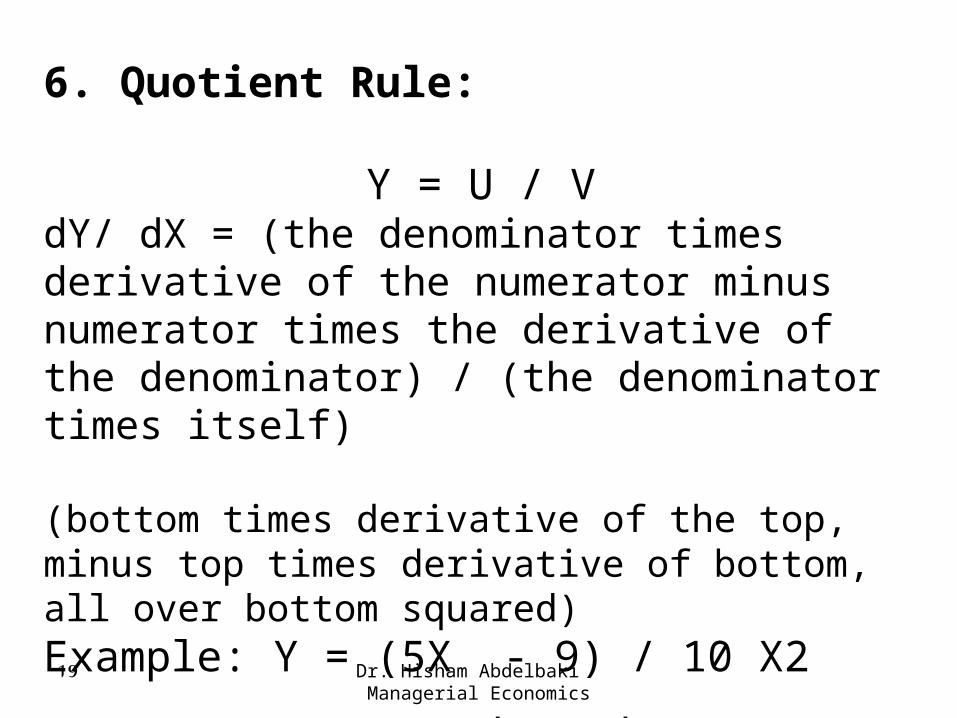
6. Quotient Rule:
Y = U / VdY/ dX = (the denominator times derivative of the numerator minus numerator times the derivative of the denominator) / (the denominator times itself)
(bottom times derivative of the top, minus top times derivative of bottom, all over bottom squared)Example: Y = (5X - 9) / 10 X2
dY / dX =
Dr. Hisham Abdelbaki Managerial Economics
20
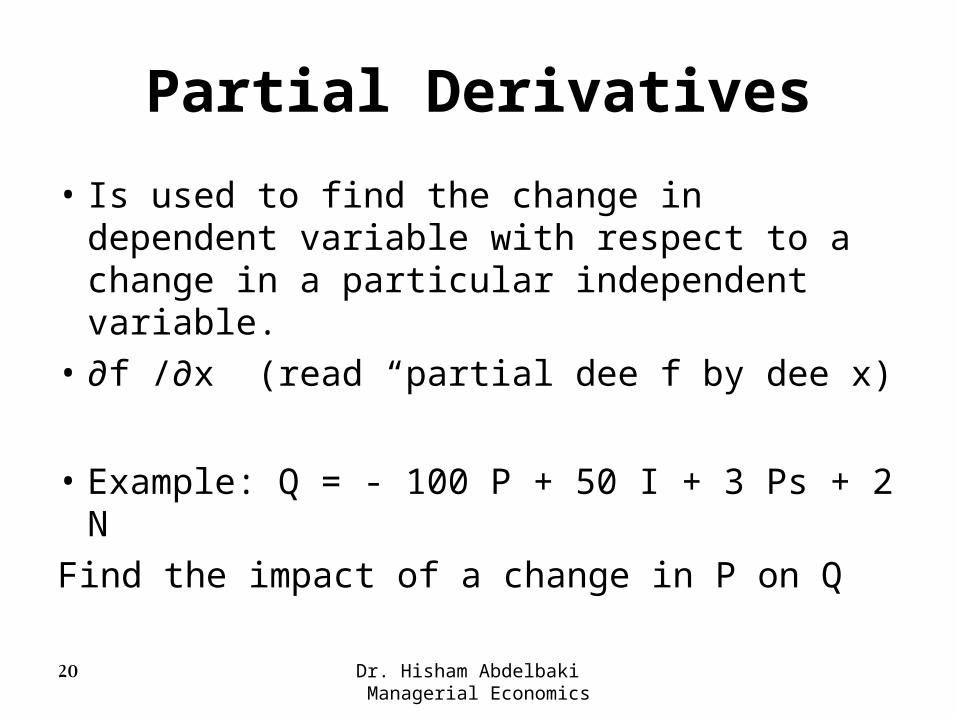
Partial Derivatives• Is used to find the change in dependent
variable with respect to a change in a particular independent variable.
• ∂f /∂x (read “partial dee f by dee x)
• Example: Q = - 100 P + 50 I + 3 Ps + 2 NFind the impact of a change in P on Q
Dr. Hisham Abdelbaki Managerial Economics
21
Finding the Max & Min Values of a Function
Optimization:TWO steps to find the optimized (optimum) point of a function:1- find out the first derivative of the function.2- put the result equals ZEROExample: find the optimum quantity
produced (quantity would the firm produce).
Dr. Hisham Abdelbaki Managerial Economics
22
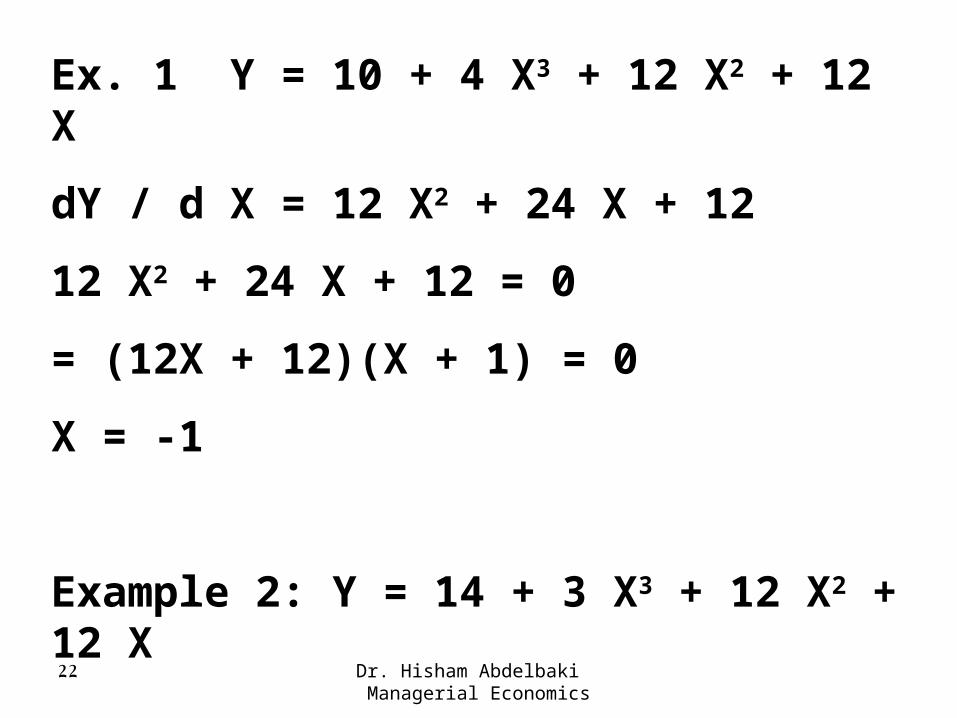
Ex. 1 Y = 10 + 4 X3 + 12 X2 + 12 X
dY / d X = 12 X2 + 24 X + 12
12 X2 + 24 X + 12 = 0
= (12X + 12)(X + 1) = 0
X = -1
Example 2: Y = 14 + 3 X3 + 12 X2 + 12 X
Dr. Hisham Abdelbaki Managerial Economics
23
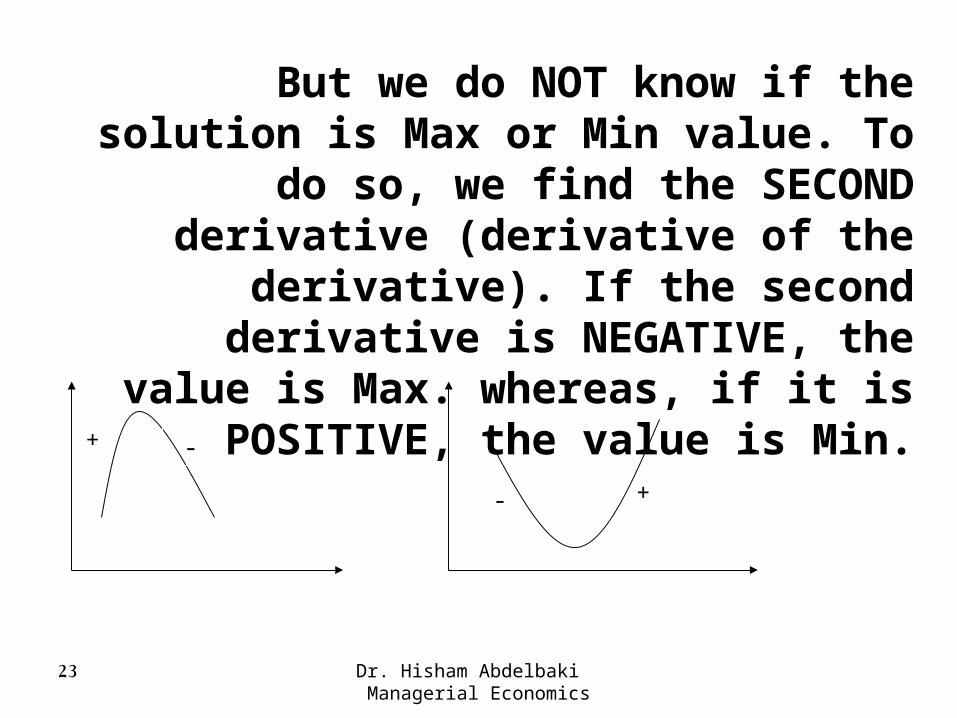
But we do NOT know if the solution is Max or Min value. To do so, we find the
SECOND derivative (derivative of the derivative). If the second derivative is
NEGATIVE, the value is Max. whereas, if it is POSITIVE, the value is Min.
-+
- +