Embed Size (px)
Citation preview
Enhancing Supply Chain Connectivity and Competitive ness of Malaysian Agriculture Products:
Identifying Chokepoints and Opportunities for Impro vement
Final Report submitted to
Economic Research Institute for ASEAN and East Asia (ERIA)
Fatimah Mohamed Arshad
Kusairi Mohd Noh Normaz Wana Ismail
Tai Shzee Yew Amna Awad Abdel Hameed
Ahmad Hanis Izani Abdul Hadi Ng Xin Khai
Mohd Khairul Rafiz Ramli Ng Keng Yap
Sahra Mohammadi
31st July 2013
Institute of Agricultural and Food Policy Studies (Institut Kajian Dasar Pertanian dan Makanan) Putra Infoport Universiti Putra Malaysia 43400 UPM Serdang Selangor, Malaysia Tel: (+6)03-8947 1076 Fax: (+6)03-8947 1077 Website: www.ikdpm.upm.edu.my Email: [email protected]

Enhancing Supply Chain Connectivity and Competitive ness of Malaysian Agriculture Products:
Identifying Chokepoints and Opportunities for Impro vement
Final Report submitted to
Economic Research Institute for ASEAN and East Asia (ERIA)
Fatimah Mohamed Arshad Kusairi Mohd Noh
Normaz Wana Ismail Tai Shzee Yew
Amna Awad Abdel Hameed Ahmad Hanis Izani Abdul Hadi
Ng Xin Khai Mohd Khairul Rafiz Ramli
Ng Keng Yap Sahra Mohammadi
31st July 2013
Institute of Agricultural and Food Policy Studies (Institut Kajian Dasar Pertanian dan Makanan) Putra Infoport Universiti Putra Malaysia 43400 UPM Serdang Selangor, Malaysia Tel: (+6)03-8947 1076 Fax: (+6)03-8947 1077 Website: www.ikdpm.upm.edu.my Email: [email protected]
iii
Acknowledgements
We would like to record our utmost appreciation to the Economic Research Institute for ASEAN and East Asia Economic (ERIA) for giving us the opportunity to conduct this research titled “Enhancing Supply Chain Connectivity and Competitiveness of Malaysian Agriculture Products: Identifying Chokepoints and Opportunities for Improvement”. In particular, we would like to thank the Executive Director of ERIA, Prof. Hidetoshi Nishimura, and Dr. Ponciano S. Intal, Jr, Leader and Coordinator of the Project for their trust in us. Our sincere thanks to Universiti Putra Malaysia for their support and facilities which enables us to conduct the project smoothly. We also are highly indebted to line agencies for providing insights, suggestions, comments and ideas in order to identify the chokepoints along the supply chain of palm oil and fish products as well as opportunities for improvement. The agencies involved are:
i. Ministry of Plantation Industries and Commodities (MPIC), ii. Malaysian Palm Oil Board (MPOB), iii. The Palm Oil Refiners Association of Malaysia (PORAM), iv. Royal Malaysian Customs Departments (Selangor, Kedah, Penang and Johor), v. Fisheries Development Authority of Malaysia (LKIM) (HQ, Penang and Kedah), vi. Department of Fisheries Malaysia (DoF) (Penang, Kedah, Putrajaya), vii. Northport (Malaysia) Bhd, viii. Johor Port Sdn. Bhd, ix. Asa Niaga Pelabuhan Barter Trade Sdn. Bhd., x. Sidhu Brothers Transport Sdn. Bhd, xi. Pasir Gudang Edible Oils Sdn. Bhd., xii. Felda Bulkers Sdn. Bhd., xiii. Syarikat Doyan Shipping & Forwarding (M) Sdn. Bhd., xiv. Seasons Forwarding and Distribution Agency Sdd. Bhd., xv. Orchid Shipping Forwarding & Contract Services Sdn. Bhd., and xvi. Malaysia Airlines Cargo Sdn. Bhd. A special thanks is due to Mr. Abdul Wahab Hassan, Senior Manager, Productivity and Quality Management at Northport (Malaysia) Bhd for his kindness in providing supports and insights into the study.
iv
We owe greatly to Dato’ Azis Bin Yacob, Director of Malaysian Royal Customs Department, Selangor for his warmth and kindness in receiving us at his office and his support to this study. We would like to express our gratitute towards our colleagues and members of the Institut Kajian Dasar Pertanian dan Makanan, Universiti Putra Malaysia for their tireless support which contributed to the successful completion of the project. Last but not least, we thank all the institutions and individuals who had lent their supports in providing inputs to the study. Fatimah Mohamed Arshad Kusairi Mohd Noh Normaz Wana Ismail Tai Shzee Yew Amna Awad Abdel Hameed Ahmad Hanis Izani Abdul Hadi Ng Xin Khai Mohd Khairul Rafiz Ramli Ng Keng Yap Sahra Mohammadi Institut Kajian Dasar Pertanian dan Makanan (Institute of Agricultural and Food Policy Studies) Putra Infoport, Universiti Putra Malaysia 43400 UPM Serdang Selangor, Malaysia 31st July 2013
v
Abstract This study aims to identify the chokepoints along the supply chain of palm oil and fish products in Malaysia as well as opportunities for improvement. Palm oil is categorised as “animal/vegetable fats and oils” (HS15) and fish products is categorised as “fish and crustaceans molluscs, and other aquatic invertebrates” (HS03). Both products play an important role in the country’s economy. In 2012, palm oil accounted for 49% of the agricultural GDP while fish (11%). Malaysia is the world’s second largest exporter of palm oil contributing RM 60 bn worth of foreign earning to the country. Very few references are available on the supply chain of agricultural produce and hence their competitiveness in the trade arena. In view of the growing importance of food trade in ASEAN, there is a need to review the supply chain of these two commodities particularly in terms of serious delays along the supply chain that is from the production point to the export/import sector. This study utilises a Key Informant Survey method to obtain relevant data and insights on the supply chains of the said commodities. This involved an in-depth interview with relevant stakeholders which include government agencies (such as Malaysian Palm Oil Board (MPOB), Fisheries Development Authority of Malaysia (LKIM), Department of Fisheries Malaysia (DoF) and Malaysian Royal Customs Department), port authorities, transporters and traders. A field survey using questionnaires prepared by Economic Research Institute for ASEAN and East Asia Economic (ERIA) (available at http://wbc.upm.edu.my/eria/) has been carried out from February to May 2013. A total of 111 questionnaires have been distributed to various agencies and stakeholders. However, only 87 responded and out of this total only 52 questionnaires are useable for analysis because of some of the respondents come from the same department hence they provide more or less similar answers. A case study approach is used in analysing the data or responses which are largely qualitative in nature. The study shows that a number of chokepoints exist in the supply chain of both commodities. In terms of the quality of infrastructure, the chokepoints identified are; limited capacities of most authorised laboratories, unstrategic location of these laboratories, limited number of refinery mills and bulking installations for palm oil in selected production areas such as in East Malaysia, congestion at the ports during peak period, lack of maintenance of port’s facilities and in the case of fish; insufficient import gates for land border crossing. In terms of internal transport and logistics, the chokepoints traced are: poor road condition (particularly around the port areas); traffic congestion at the port; high transportation cost; and pilferage of oil during transit. Pilferage of oil may not directly cause “choke”, but it has serious implication on food safety and the need for stringent testing. As for import and export clearance, the chokepoints observed are; firstly, different requirement of certificates demanded by importing countries which are strecthing the limited resources and facilities at the ports particularly the laboratories. Secondly, it was detected that some health certificates were written in foreign languanges by the importing countries. The chokepoints for certification and permit processes include; the requirement for halal certificate; non-standardised documentation requirements from importing countries; glitches in information system, threats to palm oil credibility due to Lynas rare earth processing project, preference on manual submission of documents, and lengthy period for import and export licenses issuance.
vi
There is lack of transparency and awareness of regulations. For instance, traders are not aware of International Air Transport Association (IATA) regulations on packaging and labelling requirements for transportation of fish through air cargo. Poor dissemination of rules and regulations has resulted in inconsistent intepretations among the officers at the port facilities. There are evidences to show that the industry is unable to handle strict hygienic standards required by the importing countries. It is clear that these chokepoints may hinder further progress of both sectors. The study has proposed some policies to rectify these problematic areas. These include; extensive infrastructural development and maintenance (such as roads, ports, bulking installations and laboratories), capacity building of staffs, total quality management of processes and procedures, monitoring of physical flow of products, effective maintenance of computer systems and effective regional collaboration and coordination.
vii
Contents Page
Acknowledgements ...................................................................................................... iii Abstract ......................................................................................................................... v
List of Abbreviations ................................................................................................... viii List of Tables ................................................................................................................ xi List of Figures .............................................................................................................. xii 1. Introduction .............................................................................................................. 1
2. Supply Chain of Palm Oil and Fish ........................................................................... 5
2.1 Palm Oil .............................................................................................................. 5
2.1.1 The Importance of Palm Oil to the Economy ................................................ 5
2.1.2 Product Description .....................................................................................10
2.1.3 Supply Chain of Palm Oil .............................................................................12
2.2 Fish Products .....................................................................................................30
2.2.1 Importance of Fish to the Economy .............................................................30
2.2.2 Product Description .....................................................................................32
2.2.3 Supply Chain of Fish ...................................................................................32
3. Chokepoints in the Supply Chain .............................................................................40
3.1 Palm Oil .............................................................................................................40
3.1.1 The Quality of Infrastructure ........................................................................40
3.1.2 Internal Transport and Logistics ..................................................................42
3.1.3 Import and Export Clearance .......................................................................43
3.1.4 Certification and Permit Processes ..............................................................44
3.1.5 Transparency and Awareness of Regulations .............................................45
3.2 Fish Products .....................................................................................................46
3.2.1 The Quality of Infrastructure and Cold Chain ...............................................46
3.2.2 Internal Transport and Logistics ..................................................................46
3.2.3 Import and Export Clearance .......................................................................47
3.2.4 Certification and Permit Processes ..............................................................48
3.2.5 Transparency and Awareness of Regulations .............................................48
3.2.6 Non-tariff Measures .....................................................................................49
4. Policy, Regulatory and Institutional Issues...............................................................50
4.1 Palm Oil .............................................................................................................50
4.1.1 Acts, Regulations and Institutions Ruling the Palm Oil Industry ...................50
4.2 Fish Products .....................................................................................................55
4.2.1 Public Institutions Involved in Fishery Trade ................................................55
4.2.2 Acts, Regulations and Institutions Ruling the Fish Trade .............................55
4.2.3 Rules and Regulations for the Malaysian Fish Products in International Market ..................................................................................................................56
5. Conclusions and Recommendations .......................................................................58
5.1 Conclusions .......................................................................................................58
5.2 Recommendations .............................................................................................60
5.2.1 The Quality of Infrastructure ........................................................................60
5.2.2 Internal Transport and Logistics ..................................................................60
5.2.3 Import and Export Clearance .......................................................................61
5.2.4 Certification and Permit Processes ..............................................................61
5.2.5 Transparency and Awareness of Regulations .............................................62
5.2.6 Non-tariff Measures .....................................................................................62
References ..................................................................................................................63
Appendices .................................................................................................................67
Appendix 1 Sampling and Research Activities .........................................................67
Appendix 2 List of Meetings and Discussion Sessions .............................................70
Appendix 3 List of Contacts .....................................................................................71
Appendix 4 List of Acts and Regulations ..................................................................74
Appendix 5 Summary of Questionnaires ..................................................................83
viii
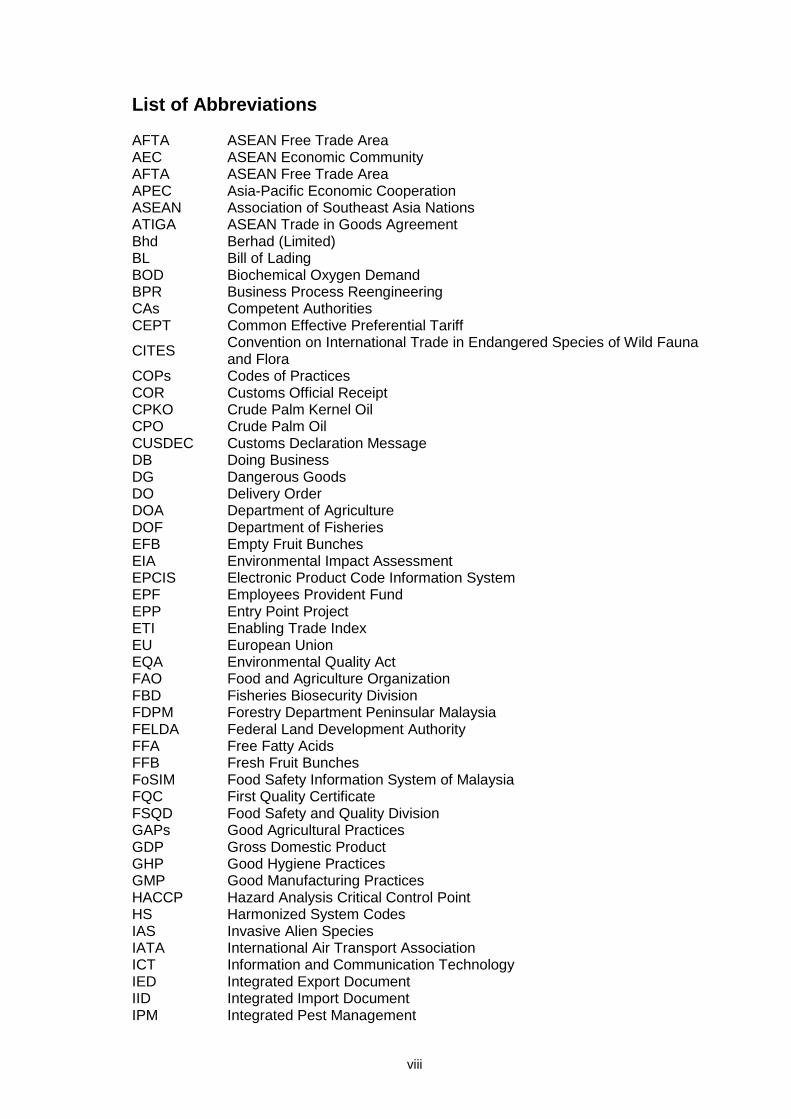
List of Abbreviations AFTA ASEAN Free Trade Area AEC ASEAN Economic Community AFTA ASEAN Free Trade Area APEC Asia-Pacific Economic Cooperation ASEAN Association of Southeast Asia Nations ATIGA ASEAN Trade in Goods Agreement Bhd Berhad (Limited) BL Bill of Lading BOD Biochemical Oxygen Demand BPR Business Process Reengineering CAs Competent Authorities CEPT Common Effective Preferential Tariff
CITES Convention on International Trade in Endangered Species of Wild Fauna and Flora
COPs Codes of Practices COR Customs Official Receipt CPKO Crude Palm Kernel Oil CPO Crude Palm Oil CUSDEC Customs Declaration Message DB Doing Business DG Dangerous Goods DO Delivery Order DOA Department of Agriculture DOF Department of Fisheries EFB Empty Fruit Bunches EIA Environmental Impact Assessment EPCIS Electronic Product Code Information System EPF Employees Provident Fund EPP Entry Point Project ETI Enabling Trade Index EU European Union EQA Environmental Quality Act FAO Food and Agriculture Organization FBD Fisheries Biosecurity Division FDPM Forestry Department Peninsular Malaysia FELDA Federal Land Development Authority FFA Free Fatty Acids FFB Fresh Fruit Bunches FoSIM Food Safety Information System of Malaysia FQC First Quality Certificate FSQD Food Safety and Quality Division GAPs Good Agricultural Practices GDP Gross Domestic Product GHP Good Hygiene Practices GMP Good Manufacturing Practices HACCP Hazard Analysis Critical Control Point HS Harmonized System Codes IAS Invasive Alien Species IATA International Air Transport Association ICT Information and Communication Technology IED Integrated Export Document IID Integrated Import Document IPM Integrated Pest Management
ix
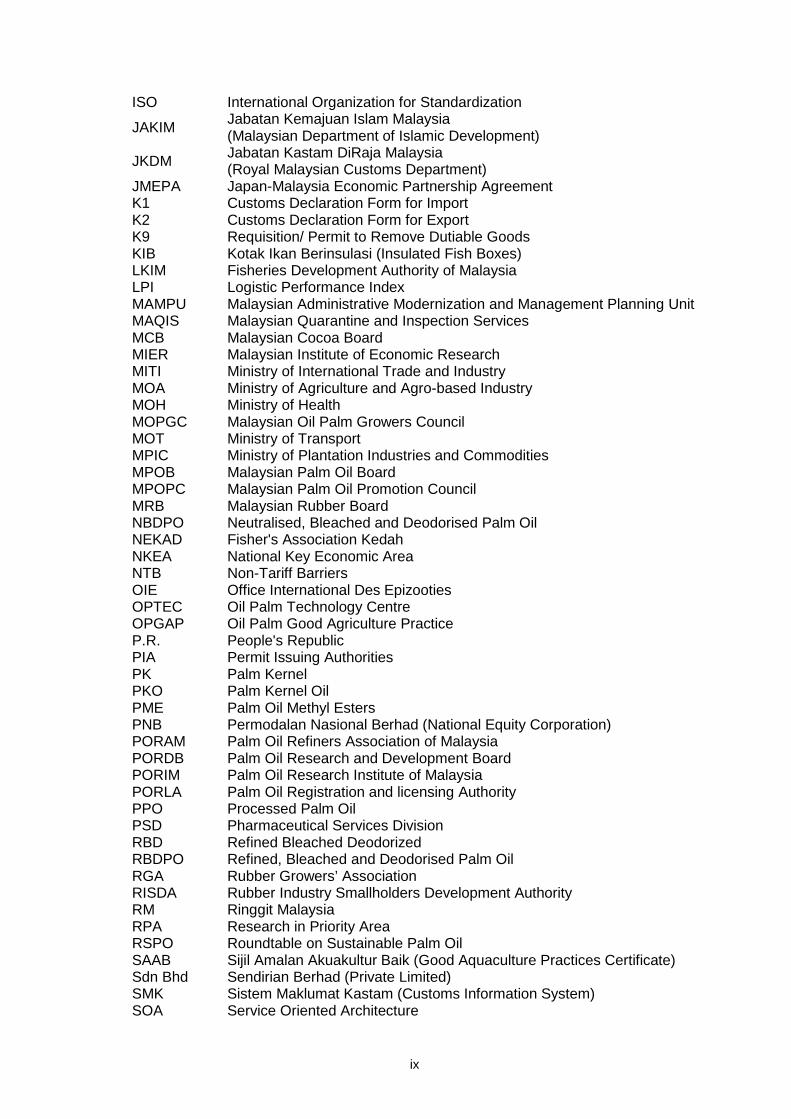
ISO International Organization for Standardization
JAKIM Jabatan Kemajuan Islam Malaysia (Malaysian Department of Islamic Development)
JKDM Jabatan Kastam DiRaja Malaysia (Royal Malaysian Customs Department)
JMEPA Japan-Malaysia Economic Partnership Agreement K1 Customs Declaration Form for Import K2 Customs Declaration Form for Export K9 Requisition/ Permit to Remove Dutiable Goods KIB Kotak Ikan Berinsulasi (Insulated Fish Boxes) LKIM Fisheries Development Authority of Malaysia LPI Logistic Performance Index MAMPU Malaysian Administrative Modernization and Management Planning Unit MAQIS Malaysian Quarantine and Inspection Services MCB Malaysian Cocoa Board MIER Malaysian Institute of Economic Research MITI Ministry of International Trade and Industry MOA Ministry of Agriculture and Agro-based Industry MOH Ministry of Health MOPGC Malaysian Oil Palm Growers Council MOT Ministry of Transport MPIC Ministry of Plantation Industries and Commodities MPOB Malaysian Palm Oil Board MPOPC Malaysian Palm Oil Promotion Council MRB Malaysian Rubber Board NBDPO Neutralised, Bleached and Deodorised Palm Oil NEKAD Fisher's Association Kedah NKEA National Key Economic Area NTB Non-Tariff Barriers OIE Office International Des Epizooties OPTEC Oil Palm Technology Centre OPGAP Oil Palm Good Agriculture Practice P.R. People's Republic PIA Permit Issuing Authorities PK Palm Kernel PKO Palm Kernel Oil PME Palm Oil Methyl Esters PNB Permodalan Nasional Berhad (National Equity Corporation) PORAM Palm Oil Refiners Association of Malaysia PORDB Palm Oil Research and Development Board PORIM Palm Oil Research Institute of Malaysia PORLA Palm Oil Registration and licensing Authority PPO Processed Palm Oil PSD Pharmaceutical Services Division RBD Refined Bleached Deodorized RBDPO Refined, Bleached and Deodorised Palm Oil RGA Rubber Growers’ Association RISDA Rubber Industry Smallholders Development Authority RM Ringgit Malaysia RPA Research in Priority Area RSPO Roundtable on Sustainable Palm Oil SAAB Sijil Amalan Akuakultur Baik (Good Aquaculture Practices Certificate) Sdn Bhd Sendirian Berhad (Private Limited) SMK Sistem Maklumat Kastam (Customs Information System) SOA Service Oriented Architecture
x
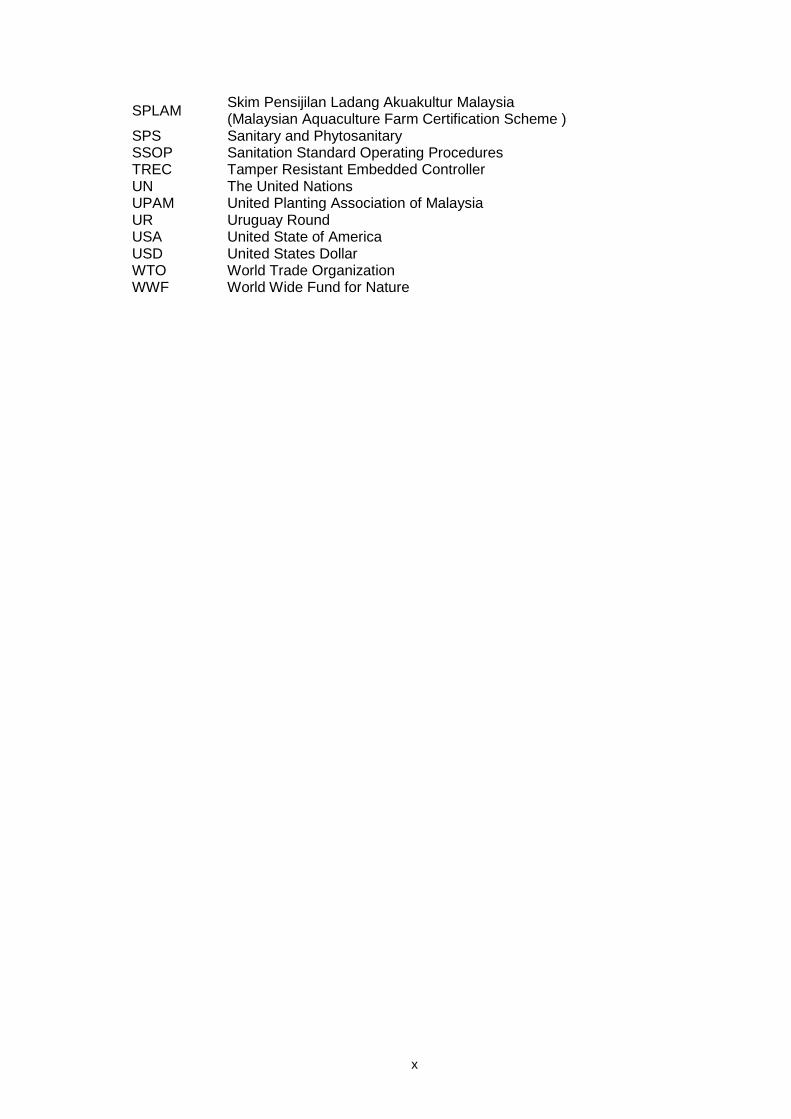
SPLAM Skim Pensijilan Ladang Akuakultur Malaysia (Malaysian Aquaculture Farm Certification Scheme )
SPS Sanitary and Phytosanitary SSOP Sanitation Standard Operating Procedures TREC Tamper Resistant Embedded Controller UN The United Nations UPAM United Planting Association of Malaysia UR Uruguay Round USA United State of America USD United States Dollar WTO World Trade Organization WWF World Wide Fund for Nature
xi
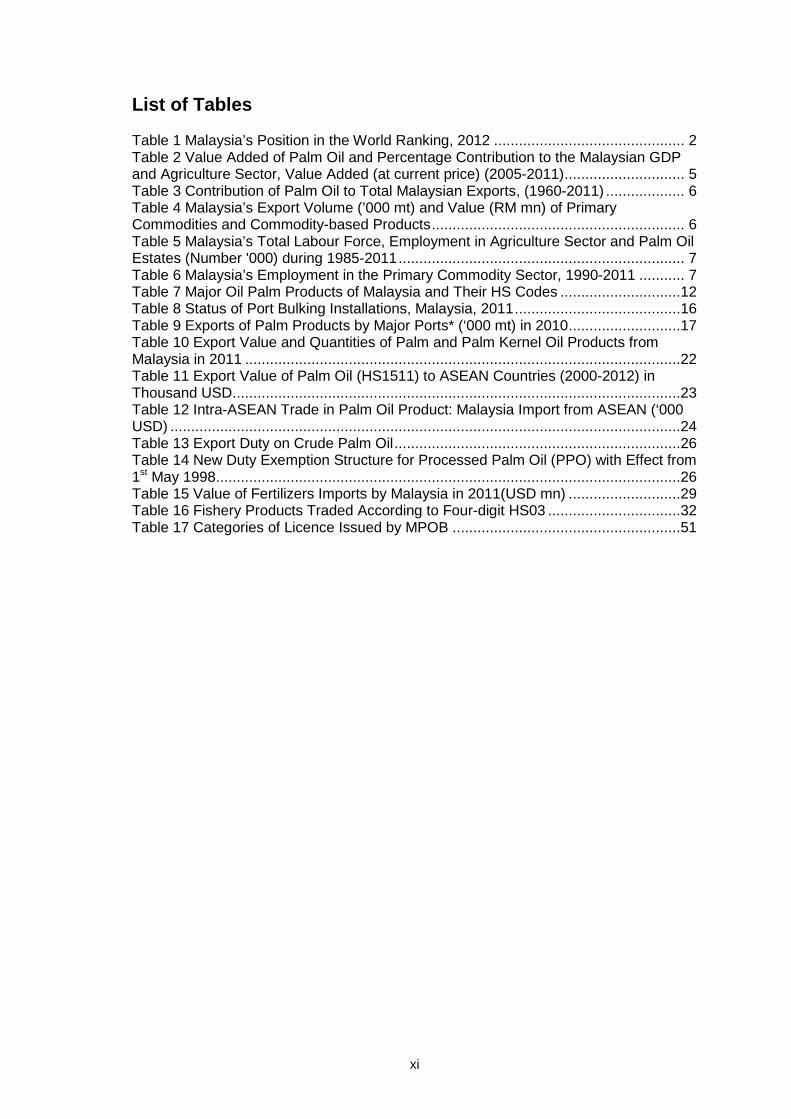
List of Tables Table 1 Malaysia’s Position in the World Ranking, 2012 .............................................. 2
Table 2 Value Added of Palm Oil and Percentage Contribution to the Malaysian GDP and Agriculture Sector, Value Added (at current price) (2005-2011) ............................. 5
Table 3 Contribution of Palm Oil to Total Malaysian Exports, (1960-2011) ................... 6
Table 4 Malaysia’s Export Volume (’000 mt) and Value (RM mn) of Primary Commodities and Commodity-based Products ............................................................. 6
Table 5 Malaysia’s Total Labour Force, Employment in Agriculture Sector and Palm Oil Estates (Number '000) during 1985-2011 ..................................................................... 7
Table 6 Malaysia’s Employment in the Primary Commodity Sector, 1990-2011 ........... 7
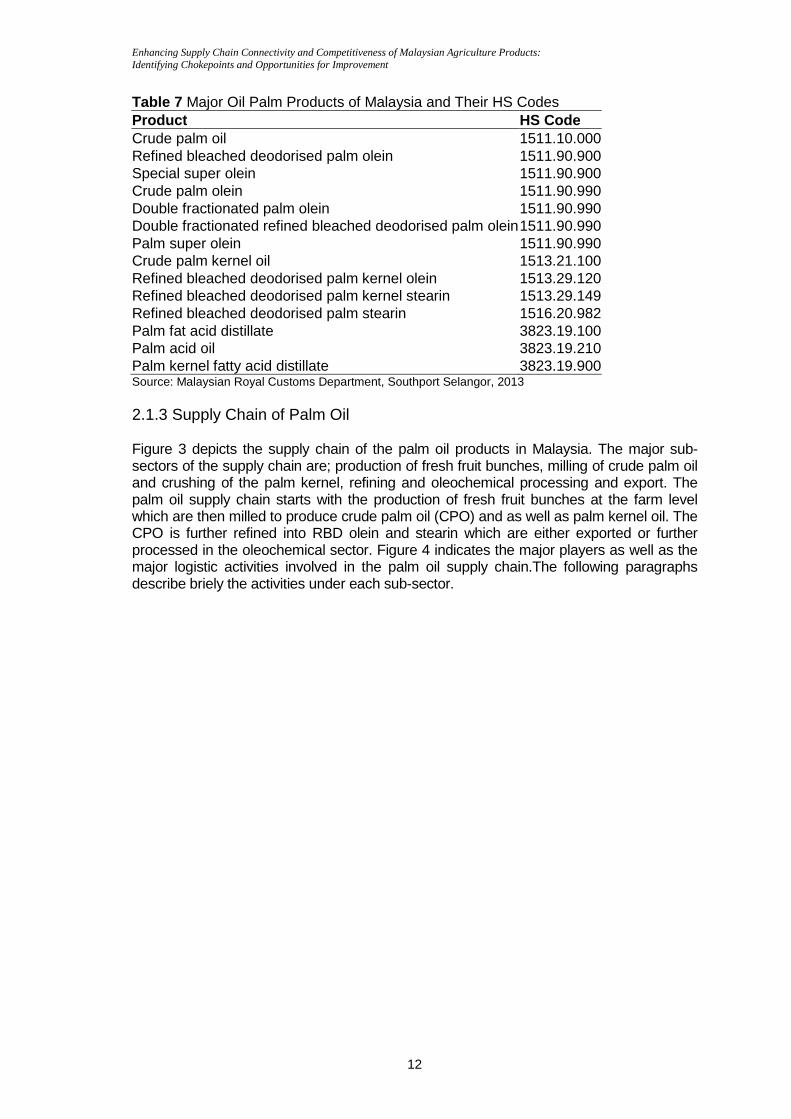
Table 7 Major Oil Palm Products of Malaysia and Their HS Codes .............................12
Table 8 Status of Port Bulking Installations, Malaysia, 2011 ........................................16
Table 9 Exports of Palm Products by Major Ports* (‘000 mt) in 2010 ...........................17
Table 10 Export Value and Quantities of Palm and Palm Kernel Oil Products from Malaysia in 2011 .........................................................................................................22
Table 11 Export Value of Palm Oil (HS1511) to ASEAN Countries (2000-2012) in Thousand USD ............................................................................................................23
Table 12 Intra-ASEAN Trade in Palm Oil Product: Malaysia Import from ASEAN (‘000 USD) ...........................................................................................................................24
Table 13 Export Duty on Crude Palm Oil .....................................................................26
Table 14 New Duty Exemption Structure for Processed Palm Oil (PPO) with Effect from 1st May 1998 ................................................................................................................26
Table 15 Value of Fertilizers Imports by Malaysia in 2011(USD mn) ...........................29
Table 16 Fishery Products Traded According to Four-digit HS03 ................................32
Table 17 Categories of Licence Issued by MPOB .......................................................51
xii
List of Figures Figure 1 Major Players in the Palm Oil Supply Chain in Malaysia ..................................10
Figure 2 Palm Oil Processing Chart ............................................................................11
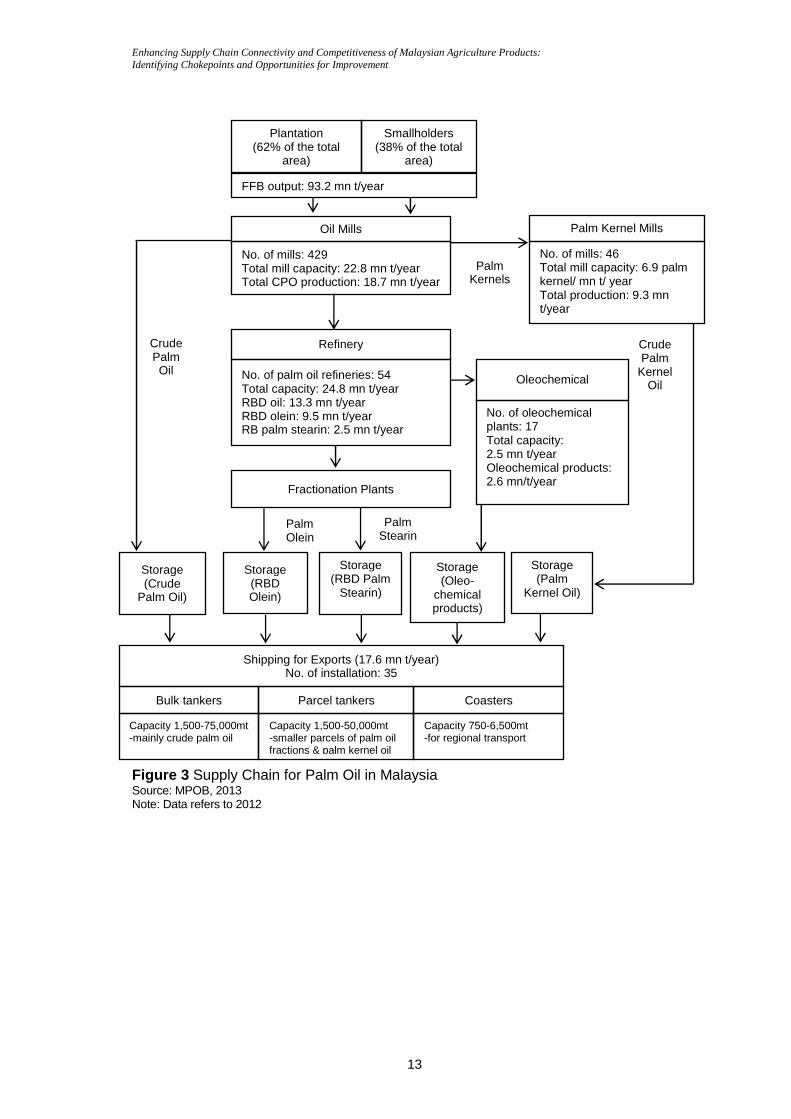
Figure 3 Supply Chain for Palm Oil in Malaysia ...........................................................13
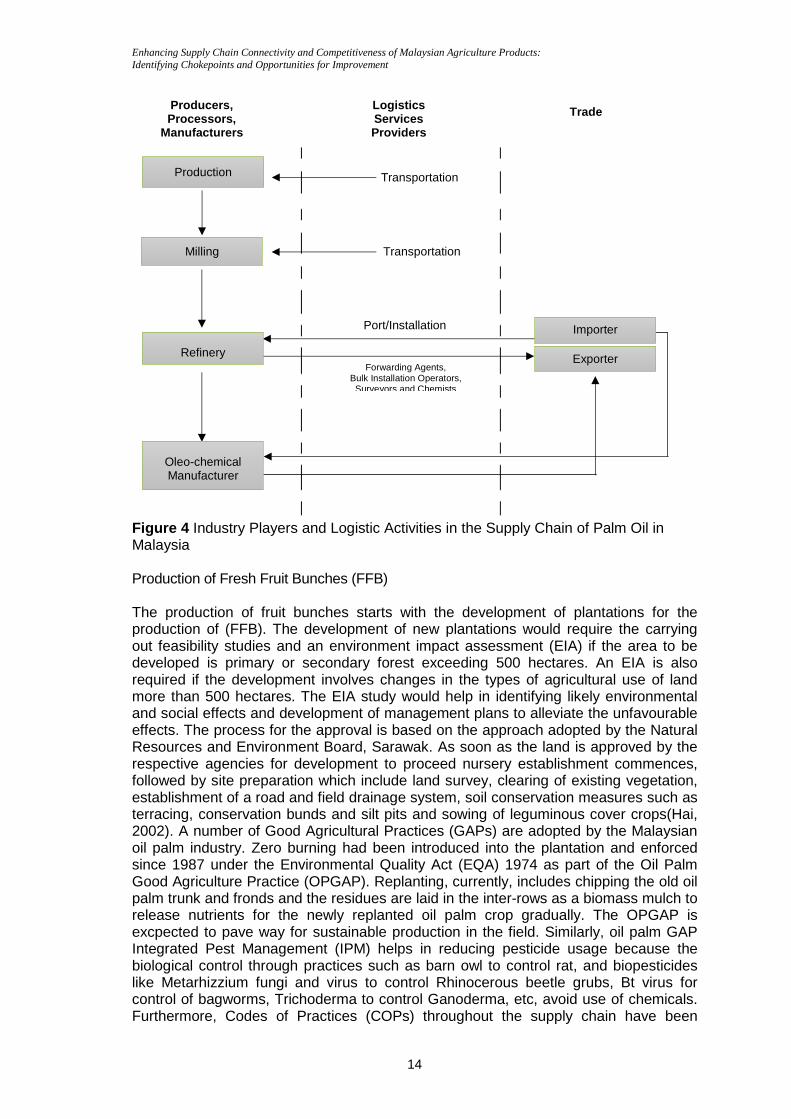
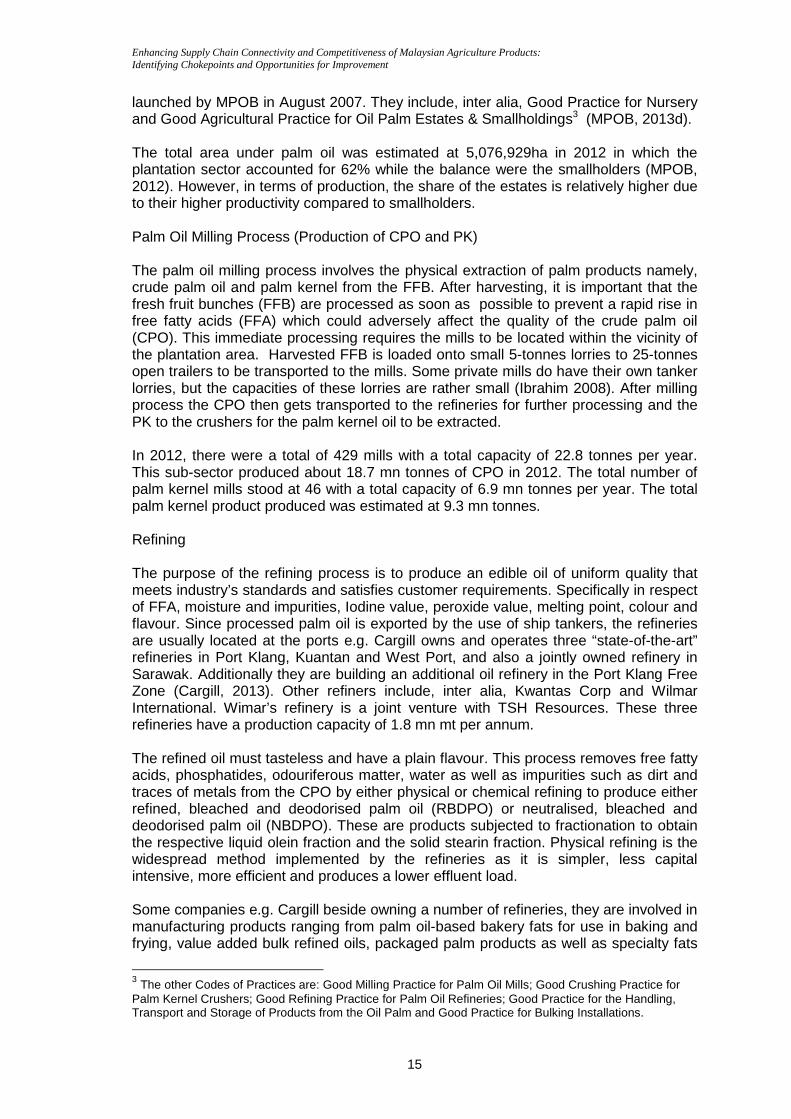
Figure 4 Industry Players and Logistic Activities in the Supply Chain of Palm Oil in Malaysia ......................................................................................................................14
Figure 5 Export Flow: Liquid Bulk ................................................................................18
Figure 6 Import Flow: Liquid Bulk ................................................................................19
Figure 7 Palm Oil Exports from Major Exporting Countries 1970-2012(‘000 mt) ..........20
Figure 8 Palm Oil Exports from Malaysia in 1980 and 2012, by Destinations (%) ........21
Figure 9 Export Revenue Shares of Palm Oil Products from Malaysia in 2012 ............21
Figure 10 Annual Crude Palm Oil Import Demand by Malaysia, 1985- 2012(‘000 mt) .22
Figure 11 Export Value of Palm Oil Products (HS1511) by ASEAN Countries (2000-2001) USD mn ............................................................................................................23
Figure 12 Intra-ASEAN Trade in Palm Oil Products: Malaysia Export to ASEAN (Mt) by Country, 2008-2012 Averages .....................................................................................24
Figure 13 Intra-ASEAN Trade in Palm Oil Products: Malaysia Import from ASEAN (Percentage Shares), 2010-2012 Averages ................................................................25
Figure 14 Marketing and Distribution Channel of Fertilizers in Malaysia ......................29
Figure 15 Number of People Directly Involved in the Malaysian Fish Sector, 1982 – 2011 (selected years) ..................................................................................................30
Figure 16 Balance of Trade for the Malaysian Fishery Products, 2002 – 2012 (USD) .31
Figure 17 Balance of Trade for the Malaysian Fishery Products by Category, 2002 – 2012 (USD) .................................................................................................................31
Figure 18 Fisheries Balance Sheet (Production and Trade), 2010 (mt) .......................32
Figure 19 Major Upstream and Midstream Inputs to the Marine Capture Fisheries Sub-Sector..........................................................................................................................33
Figure 20 Major Upstream and Midstream Inputs to the Aquaculture Sub-Sector ........33
Figure 21 Malaysia: Fishery Products Imports and Exports (HS03), 2002 – 2012 (USD) ....................................................................................................................................34
Figure 22 Malaysia: Imports of Fishery Products by Category, 2012 (%) .....................34
Figure 23 Malaysia: Imports of Fishery Products by Category, 2002 – 2012 (USD) .....35
Figure 24 Malaysia: Fish Imports from ASEAN by Category, 2012 (%) .......................35
Figure 25 Malaysia: Fish Imports from ASEAN by Nation, 2012 (%) ...........................36
Figure 26 Malaysia: Fish Imports from Indonesia by Category, 2012 (%) ....................36
Figure 27 Malaysia: Fish Imports from Thailand by Category, 2012 (%) ......................37
Figure 28 Malaysia: Exports of Fishery Products by Category, 2012 (%) ....................38
Figure 29 Malaysia: Export of Fishery Products by Category, 2002 – 2012 (USD) ......38
Figure 30 Malaysia: Fish Exports to ASEAN by Category, 2012 (percent of value) .....39
Figure 31 Malaysia: Fish Exports to ASEAN by Nation, 2012 (% of total export value) 39
Figure 32 MPOB’s Licensing and Enforcement Division .............................................52
Figure 33 Major Institutions Involved in the Fish Imports and Exports POB’s Licensing and Enforcement Division............................................................................................56
Enhancing Supply Chain Connectivity and Competitiveness of Malaysian Agriculture Products: Identifying Chokepoints and Opportunities for Improvement
1
1. Introduction Supply chain evolves with changes in the trade landscape and environs. These changes include: globalization, technological advancement and emergence of new economic growth centres in Asia and other parts of the world. The ICT in particular revolutionize how trade and businesses are conducted across borders. For instance, the global supply network is characterized by speed delivery and definite delivery and high degree of custodial control throughout the supply chain. Under such a system, customs facilitation and logistics management are important processes in ensuring fast and reliable links to international markets and supply chains. One new dimension added to the framework of supply chain is the importance of connectivity which is defined as the “conduits” for flows of goods, services, capital, information and ideas around the world (PECC, 2009). These conduits provide the links between supply chain members, stakeholders and customers. Connectivity allows sharing of information between customers and suppliers, supply chain collaboration and time-based logistics solutions (Hoffmann, 2009). This in turn may lead to cost reductions and higher efficiency, i.e. savings in cycle times and reduction in ordering errors. Connectivity is a catalyst for trade and investment with enabler and multiplier effects for the wider socio-economy. However, as summarized by a study carried by USC (2011), the supply chain in ASEAN countries are plagued with “chokepoints”, inefficiencies and barriers which impose time delays, raise transaction costs, increase supply chain risk and uncertainty. The supply chain for food products in particular are at a higher risk due to its unique characteristics such as unstable or seasonal production, products are often bulky and perishable and require specialized equipments. In this regard, Asean Economic Community (AEC) Blueprint has identified the need for enhancing intra-and extra-ASEAN trade and long term competitiveness of ASEAN’s food, agriculture and forestry products/commodities. Identifying supply “chokepoints” is necessary as they are the pre-requisite inputs for the formulation of a more integrated, and hence more competitive ASEAN food trade. Staying competitive is neccesary for growth in a highly globalised world. “Competitiveness index” is the currency of trade as it provides the business climate of a country to investors. Malaysia performs fairly on a number of rating scales of supply chain and potential chokepoints as summarised by the World Economic Forum’s Global Enabling Trade Report-Enabling Trade Index (ETI) in 2012, World Bank’s Connecting to Compete Report 2012-Logistic Performance Index (LPI) and Doing Business 2012 (DB). Malaysia is the top 20% in ETI and LPI, and top 6% in DB (Table 1).
Enhancing Supply Chain Connectivity and Competitiveness of Malaysian Agriculture Products: Identifying Chokepoints and Opportunities for Improvement
2
Table 1 Malaysia’s Position in the World Ranking, 2012
Report Description Malaysia’s rank
Enabling Trade Index (ETI)
Measures the factors, policies and services facilitating the free flow of goods over national borders, and to and from destination.
24th/124
Logistic Performance Index (LPI)
Measure logistics environment: efficiency of the customs clearance process; quality of trade and transport-related infrastructure; ease of arranging competitively priced shipments; competence and quality of logistics services; ability to track and trace consignments; frequency with which shipments reach the consignee within the scheduled or expected time.
29th/155
Doing Business 2012
Doing business evaluation: starting a business, dealing with construction permits, getting electricity, registering property, getting credit, protecting investors, paying taxes, trading across borders, enforcing contracts and resolving insolvency.
12th/185
Source: World Economic Forum’s Global Enabling Trade Report, 2010 and 2012. World Bank’s Connecting to Compete Report 2012
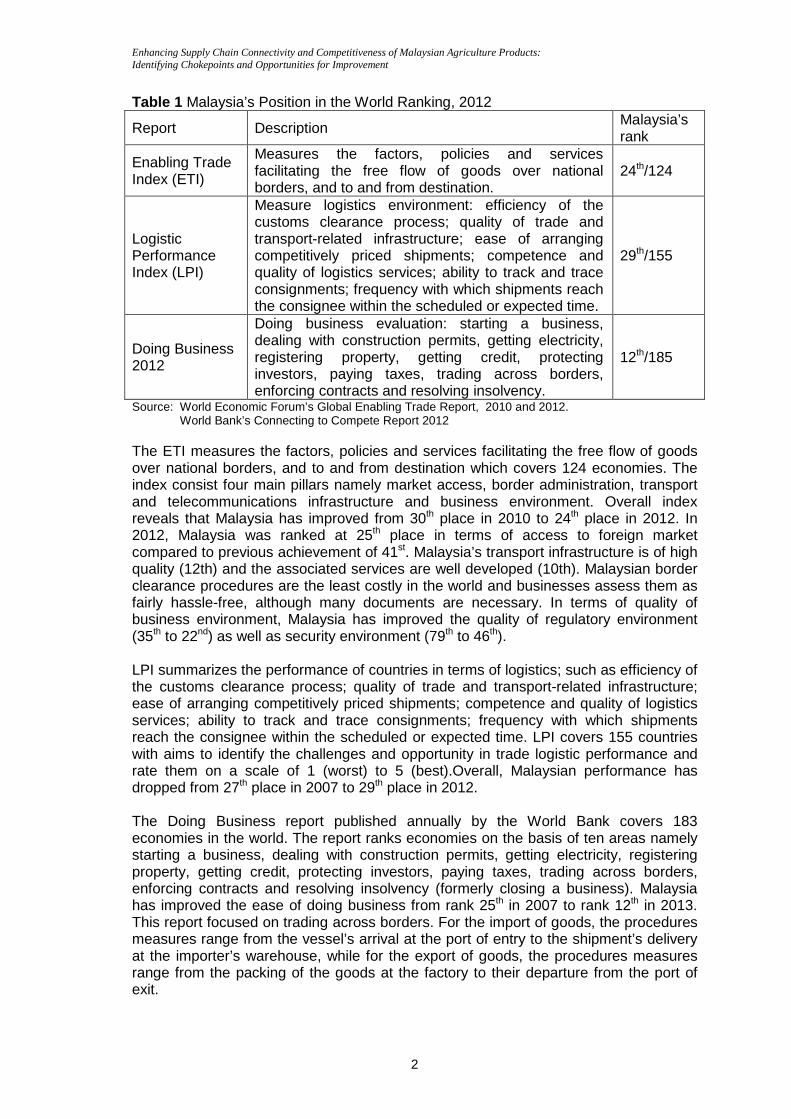
The ETI measures the factors, policies and services facilitating the free flow of goods over national borders, and to and from destination which covers 124 economies. The index consist four main pillars namely market access, border administration, transport and telecommunications infrastructure and business environment. Overall index reveals that Malaysia has improved from 30th place in 2010 to 24th place in 2012. In 2012, Malaysia was ranked at 25th place in terms of access to foreign market compared to previous achievement of 41st. Malaysia’s transport infrastructure is of high quality (12th) and the associated services are well developed (10th). Malaysian border clearance procedures are the least costly in the world and businesses assess them as fairly hassle-free, although many documents are necessary. In terms of quality of business environment, Malaysia has improved the quality of regulatory environment (35th to 22nd) as well as security environment (79th to 46th). LPI summarizes the performance of countries in terms of logistics; such as efficiency of the customs clearance process; quality of trade and transport-related infrastructure; ease of arranging competitively priced shipments; competence and quality of logistics services; ability to track and trace consignments; frequency with which shipments reach the consignee within the scheduled or expected time. LPI covers 155 countries with aims to identify the challenges and opportunity in trade logistic performance and rate them on a scale of 1 (worst) to 5 (best).Overall, Malaysian performance has dropped from 27th place in 2007 to 29th place in 2012. The Doing Business report published annually by the World Bank covers 183 economies in the world. The report ranks economies on the basis of ten areas namely starting a business, dealing with construction permits, getting electricity, registering property, getting credit, protecting investors, paying taxes, trading across borders, enforcing contracts and resolving insolvency (formerly closing a business). Malaysia has improved the ease of doing business from rank 25th in 2007 to rank 12th in 2013. This report focused on trading across borders. For the import of goods, the procedures measures range from the vessel’s arrival at the port of entry to the shipment’s delivery at the importer’s warehouse, while for the export of goods, the procedures measures range from the packing of the goods at the factory to their departure from the port of exit.
Enhancing Supply Chain Connectivity and Competitiveness of Malaysian Agriculture Products: Identifying Chokepoints and Opportunities for Improvement
3
The above ratings cover mainly industrial products in Malaysia and serve as a benchmark for the country. Thus far, a similar ranking and rating on agricultural produce are limited. In view of the growing importance of agriculture and food commodities in the ASEAN trade, there is a need to examine the trade performance of this sector to gauge its competitiveness and efficiency. While “competitiveness” measurement involves a gamut of indicators, this report chooses to scrutinise the performance of the supply chain before further inference is made on the said concept. A good investigation of the supply chain is a broad measure to indicate competitiveness of the chosen sector. The two most important commodities traded within the ASEAN are palm oil and fish, which accounted for more than one fifth of intra-ASEAN agricultural trade (WITS database, 2011). Being agricultural products, these two commodities suffer a number of setbacks and experience “chokepoints” which impair their trade performance. Hence, this study attempts to examine the relative importance “chokepoints” in the supply chain of these two commodities in Malaysia. The study utilised both the primary and secondary data to examine the “chokepoints” in the supply chain system. The primary data is collected through a Key Informant Survey method using pre-designed questionnaires prepared by ERIA as shown on http://wbc.upm.edu.my/eria/ There are eight set of questionnaires (Q1-Q8) covering relevant ministry, custom and inspection at land border crossing and port, logistics provider, shipping services, road transport services,importers and exporters. An in-depth interview was carried out on relevant stakeholders which include government agencies (such as Malaysian Palm Oil Board (MPOB), Ministry of Agriculture and Agro-based Industries (MoA), Fisheries Development Authority of Malaysia (LKIM), Department of Fisheries Malaysia (DoF) and Malaysian Royal Customs Department), port authorities, transporters and traders. The survey was carried out during the months of February to May 2013. The study has adopted the mixed mode survey in that it involved a face-to-face interview with selected stakeholders as well as on-line survey and group discussion. An online questionnaire was also implemented to allow busy participants to fill up at their convenience. A total of 111 questionnaires have been distributed to various agencies and stakeholders. However, only 87 responded and out of this total only 52 questionnaires are useable for analysis because of some of the respondents come from the same department hence they provide more or less similar answers. A case study approach is used in analysing the data which are largely qualititative in nature and the sampling method is not probabilistic where meaningful statistical inference cannot be made. The study focuses on the findings that are considered insightful in contributing the chokepoints in the system1. The list and number of questionnaires analysed and face to face, group discussion and in-depth initerview carried out are presented in Appendix 1. This report presents the findings of Malaysian supply chain for two selected agriculture commodity groups namely animal/vegetable fats and oils (HS15) and fish and crustaceans molluscs, and other aquatic invertebrates (HS03). The reports provides the description of the two commodity and its supply chain processes, relative importance of chokepoints in the supply chain and a brief overview of policy, regulatory and institutional issues affecting major internal choke points and policy reccomendations. The report is organized as follows. Section 2 provides a brief institutional background and the economic roles of the two commodities. This is followed by a brief description 1 The rest of the data such as descriptive data and attitudinal scales are being used by ERIA for the preparation of the ASEAN report on a similar subject matter.
Enhancing Supply Chain Connectivity and Competitiveness of Malaysian Agriculture Products: Identifying Chokepoints and Opportunities for Improvement
4
of the products traded and their supply chain. Section 3 focuses on the chokepoints in the system and Section 4 provides the policy, regulatory and institutional issues. Section 5 concludes the study and provides some recommendations towards enhancing the supply chain and connectivity for both palm oil and fish commodities. List of samples, project activities, meetings and discussion, contacts, acts and regulations and summary of questionnaires are provided in the Appendices.
Enhancing Supply Chain Connectivity and Competitiveness of Malaysian Agriculture Products: Identifying Chokepoints and Opportunities for Improvement
5
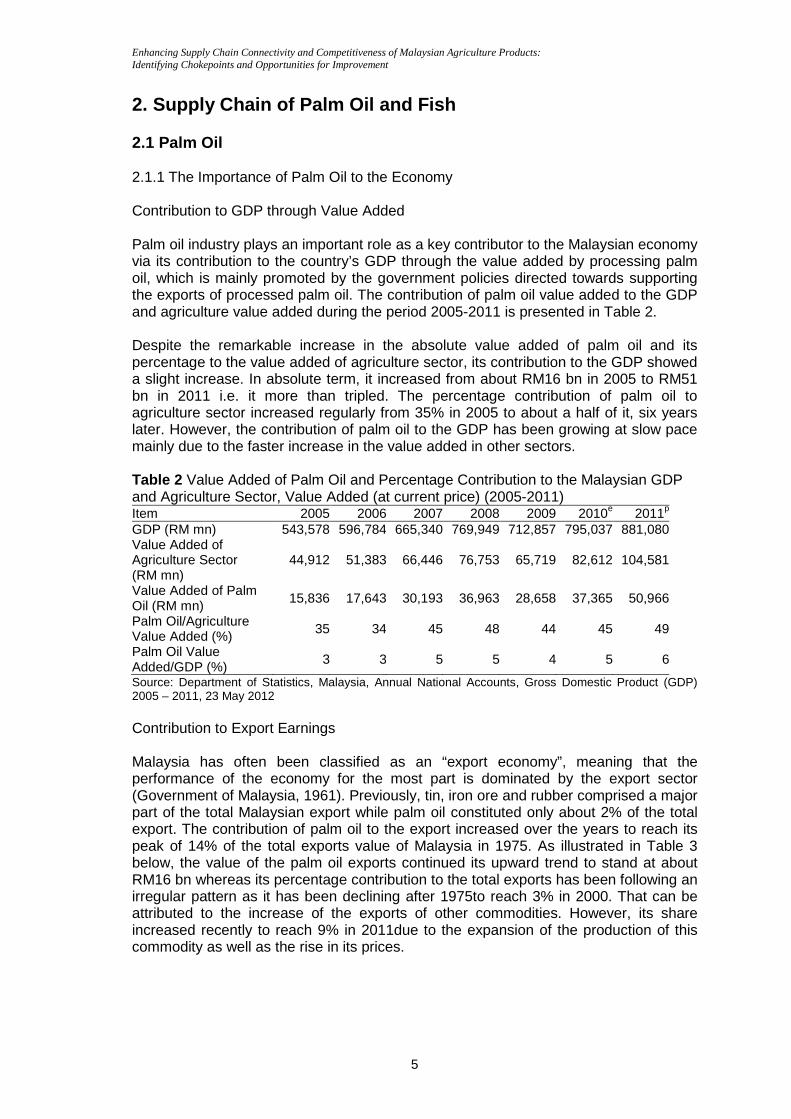
2. Supply Chain of Palm Oil and Fish 2.1 Palm Oil 2.1.1 The Importance of Palm Oil to the Economy Contribution to GDP through Value Added Palm oil industry plays an important role as a key contributor to the Malaysian economy via its contribution to the country’s GDP through the value added by processing palm oil, which is mainly promoted by the government policies directed towards supporting the exports of processed palm oil. The contribution of palm oil value added to the GDP and agriculture value added during the period 2005-2011 is presented in Table 2. Despite the remarkable increase in the absolute value added of palm oil and its percentage to the value added of agriculture sector, its contribution to the GDP showed a slight increase. In absolute term, it increased from about RM16 bn in 2005 to RM51 bn in 2011 i.e. it more than tripled. The percentage contribution of palm oil to agriculture sector increased regularly from 35% in 2005 to about a half of it, six years later. However, the contribution of palm oil to the GDP has been growing at slow pace mainly due to the faster increase in the value added in other sectors. Table 2 Value Added of Palm Oil and Percentage Contribution to the Malaysian GDP and Agriculture Sector, Value Added (at current price) (2005-2011) Item 2005 2006 2007 2008 2009 2010e 2011p
GDP (RM mn) 543,578 596,784 665,340 769,949 712,857 795,037 881,080Value Added of Agriculture Sector (RM mn)
44,912 51,383 66,446 76,753 65,719 82,612 104,581
Value Added of Palm Oil (RM mn)
15,836 17,643 30,193 36,963 28,658 37,365 50,966
Palm Oil/Agriculture Value Added (%) 35 34 45 48 44 45 49
Palm Oil Value Added/GDP (%)
3 3 5 5 4 5 6
Source: Department of Statistics, Malaysia, Annual National Accounts, Gross Domestic Product (GDP) 2005 – 2011, 23 May 2012 Contribution to Export Earnings Malaysia has often been classified as an “export economy”, meaning that the performance of the economy for the most part is dominated by the export sector (Government of Malaysia, 1961). Previously, tin, iron ore and rubber comprised a major part of the total Malaysian export while palm oil constituted only about 2% of the total export. The contribution of palm oil to the export increased over the years to reach its peak of 14% of the total exports value of Malaysia in 1975. As illustrated in Table 3 below, the value of the palm oil exports continued its upward trend to stand at about RM16 bn whereas its percentage contribution to the total exports has been following an irregular pattern as it has been declining after 1975to reach 3% in 2000. That can be attributed to the increase of the exports of other commodities. However, its share increased recently to reach 9% in 2011due to the expansion of the production of this commodity as well as the rise in its prices.
Enhancing Supply Chain Connectivity and Competitiveness of Malaysian Agriculture Products: Identifying Chokepoints and Opportunities for Improvement
6
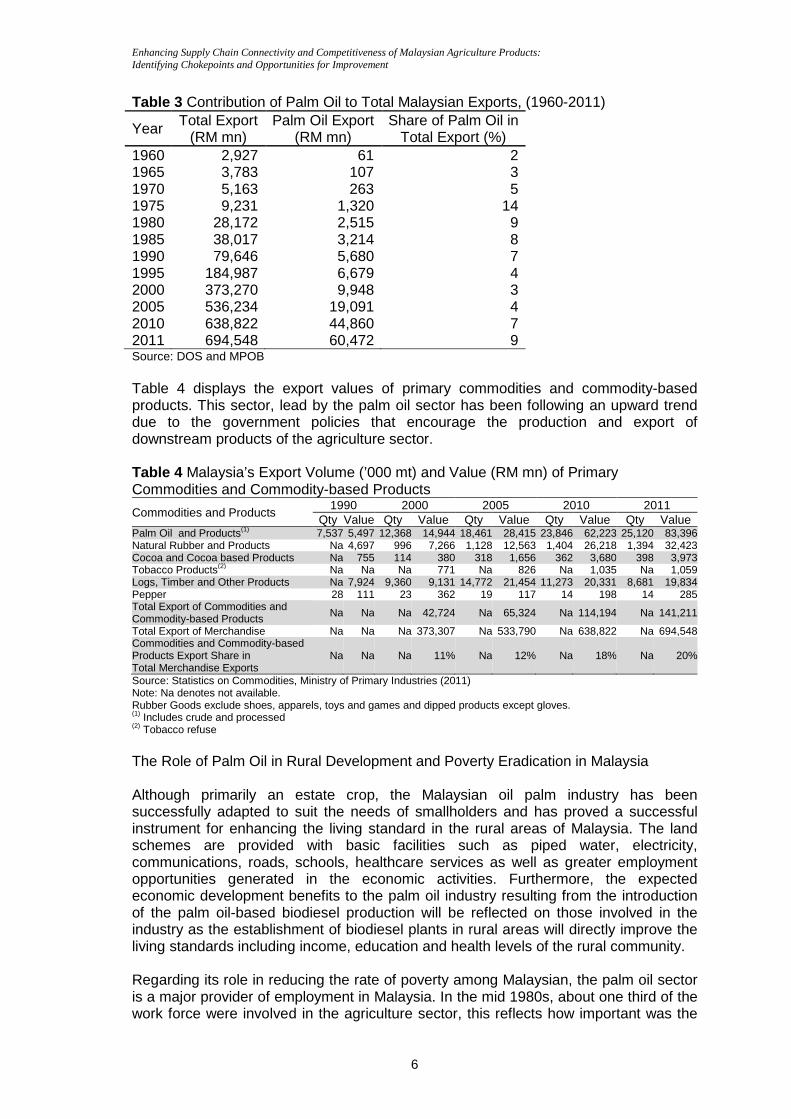
Table 3 Contribution of Palm Oil to Total Malaysian Exports, (1960-2011)
Year Total Export (RM mn)
Palm Oil Export (RM mn)
Share of Palm Oil in Total Export (%)
1960 2,927 61 2 1965 3,783 107 3 1970 5,163 263 5 1975 9,231 1,320 14 1980 28,172 2,515 9 1985 38,017 3,214 8 1990 79,646 5,680 7 1995 184,987 6,679 4 2000 373,270 9,948 3 2005 536,234 19,091 4 2010 638,822 44,860 7 2011 694,548 60,472 9 Source: DOS and MPOB Table 4 displays the export values of primary commodities and commodity-based products. This sector, lead by the palm oil sector has been following an upward trend due to the government policies that encourage the production and export of downstream products of the agriculture sector. Table 4 Malaysia’s Export Volume (’000 mt) and Value (RM mn) of Primary Commodities and Commodity-based Products
Commodities and Products 1990 2000 2005 2010 2011
Qty Value Qty Value Qty Value Qty Value Qty Value Palm Oil and Products(1) 7,537 5,497 12,368 14,944 18,461 28,415 23,846 62,223 25,120 83,396Natural Rubber and Products Na 4,697 996 7,266 1,128 12,563 1,404 26,218 1,394 32,423Cocoa and Cocoa based Products Na 755 114 380 318 1,656 362 3,680 398 3,973Tobacco Products(2) Na Na Na 771 Na 826 Na 1,035 Na 1,059Logs, Timber and Other Products Na 7,924 9,360 9,131 14,772 21,454 11,273 20,331 8,681 19,834Pepper 28 111 23 362 19 117 14 198 14 285Total Export of Commodities and Commodity-based Products Na Na Na 42,724 Na 65,324 Na 114,194 Na 141,211
Total Export of Merchandise Na Na Na 373,307 Na 533,790 Na 638,822 Na 694,548Commodities and Commodity-based Products Export Share in Total Merchandise Exports
Na Na Na 11% Na 12% Na 18% Na 20%
Source: Statistics on Commodities, Ministry of Primary Industries (2011) Note: Na denotes not available. Rubber Goods exclude shoes, apparels, toys and games and dipped products except gloves. (1) Includes crude and processed (2) Tobacco refuse
The Role of Palm Oil in Rural Development and Poverty Eradication in Malaysia Although primarily an estate crop, the Malaysian oil palm industry has been successfully adapted to suit the needs of smallholders and has proved a successful instrument for enhancing the living standard in the rural areas of Malaysia. The land schemes are provided with basic facilities such as piped water, electricity, communications, roads, schools, healthcare services as well as greater employment opportunities generated in the economic activities. Furthermore, the expected economic development benefits to the palm oil industry resulting from the introduction of the palm oil-based biodiesel production will be reflected on those involved in the industry as the establishment of biodiesel plants in rural areas will directly improve the living standards including income, education and health levels of the rural community. Regarding its role in reducing the rate of poverty among Malaysian, the palm oil sector is a major provider of employment in Malaysia. In the mid 1980s, about one third of the work force were involved in the agriculture sector, this reflects how important was the
Enhancing Supply Chain Connectivity and Competitiveness of Malaysian Agriculture Products: Identifying Chokepoints and Opportunities for Improvement
7
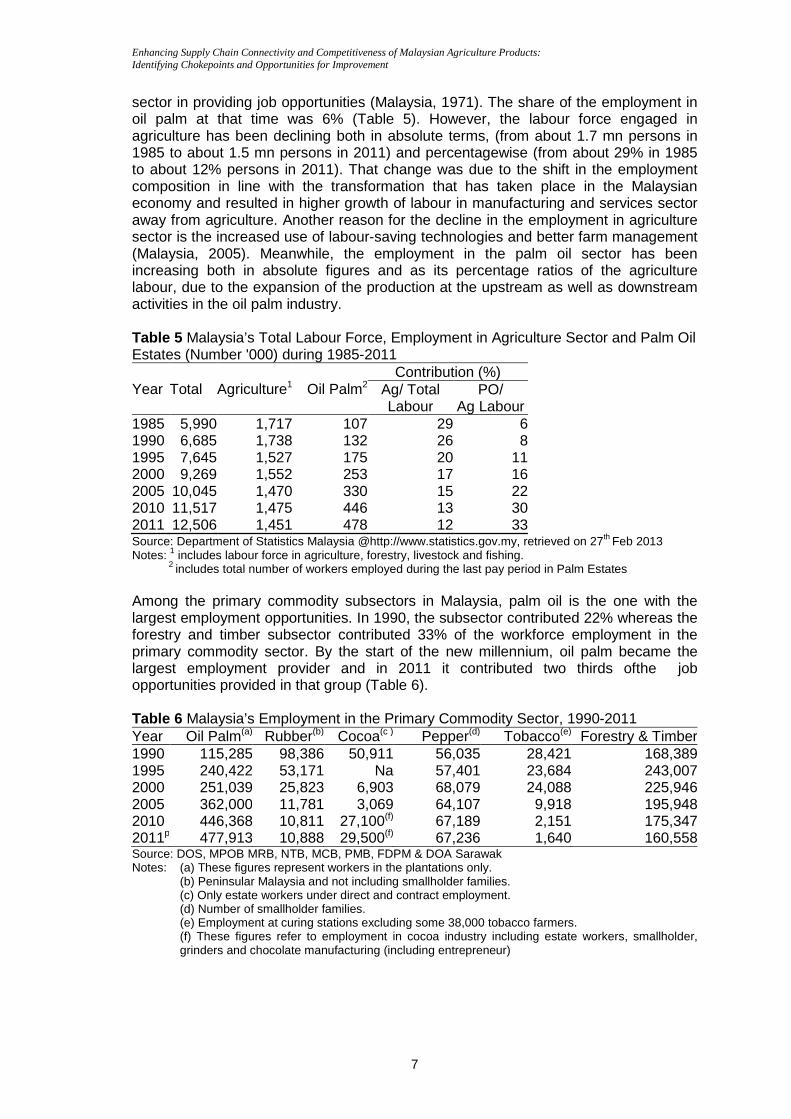
sector in providing job opportunities (Malaysia, 1971). The share of the employment in oil palm at that time was 6% (Table 5). However, the labour force engaged in agriculture has been declining both in absolute terms, (from about 1.7 mn persons in 1985 to about 1.5 mn persons in 2011) and percentagewise (from about 29% in 1985 to about 12% persons in 2011). That change was due to the shift in the employment composition in line with the transformation that has taken place in the Malaysian economy and resulted in higher growth of labour in manufacturing and services sector away from agriculture. Another reason for the decline in the employment in agriculture sector is the increased use of labour-saving technologies and better farm management (Malaysia, 2005). Meanwhile, the employment in the palm oil sector has been increasing both in absolute figures and as its percentage ratios of the agriculture labour, due to the expansion of the production at the upstream as well as downstream activities in the oil palm industry. Table 5 Malaysia’s Total Labour Force, Employment in Agriculture Sector and Palm Oil Estates (Number '000) during 1985-2011
Year Total Agriculture1 Oil Palm2 Contribution (%)
Ag/ Total Labour
PO/ Ag Labour
1985 5,990 1,717 107 29 61990 6,685 1,738 132 26 81995 7,645 1,527 175 20 112000 9,269 1,552 253 17 162005 10,045 1,470 330 15 222010 11,517 1,475 446 13 302011 12,506 1,451 478 12 33Source: Department of Statistics Malaysia @http://www.statistics.gov.my, retrieved on 27th Feb 2013 Notes: 1 includes labour force in agriculture, forestry, livestock and fishing. 2 includes total number of workers employed during the last pay period in Palm Estates Among the primary commodity subsectors in Malaysia, palm oil is the one with the largest employment opportunities. In 1990, the subsector contributed 22% whereas the forestry and timber subsector contributed 33% of the workforce employment in the primary commodity sector. By the start of the new millennium, oil palm became the largest employment provider and in 2011 it contributed two thirds ofthe job opportunities provided in that group (Table 6). Table 6 Malaysia’s Employment in the Primary Commodity Sector, 1990-2011 Year Oil Palm(a) Rubber(b) Cocoa(c ) Pepper(d) Tobacco(e) Forestry & Timber1990 115,285 98,386 50,911 56,035 28,421 168,3891995 240,422 53,171 Na 57,401 23,684 243,0072000 251,039 25,823 6,903 68,079 24,088 225,9462005 362,000 11,781 3,069 64,107 9,918 195,9482010 446,368 10,811 27,100(f) 67,189 2,151 175,3472011p 477,913 10,888 29,500(f) 67,236 1,640 160,558Source: DOS, MPOB MRB, NTB, MCB, PMB, FDPM & DOA Sarawak Notes: (a) These figures represent workers in the plantations only. (b) Peninsular Malaysia and not including smallholder families. (c) Only estate workers under direct and contract employment. (d) Number of smallholder families. (e) Employment at curing stations excluding some 38,000 tobacco farmers.
(f) These figures refer to employment in cocoa industry including estate workers, smallholder, grinders and chocolate manufacturing (including entrepreneur)
Enhancing Supply Chain Connectivity and Competitiveness of Malaysian Agriculture Products: Identifying Chokepoints and Opportunities for Improvement
8
Major Players in the Industry The major players in the industry comprise upstream and downstream producers, exporters and importers, customers, Government agencies and non-governmental organisations (NGOs). The largest upstream player is the Federal Land Development Authority (FELDA). Plantation companies vary considerably in size, from a few hundred hectares to more than 100,000 hectares. The five largest companies in terms of planted area are Kumpulan Guthrie Berhad, Golden Hope Plantations Berhad, IOI Corporation Berhad and Sime Darby Berhad. Many current plantation companies have their beginnings in the colonial era at the turn of the 20th century when English and other European entrepreneurs transformed forest land into tea and coffee and rubber estates. Amongst the ‘old’ companies are Kumpulan Guthrie Berhad, Golden Hope Plantations Berhad, Sime Darby Berhad, Kuala Lumpur Kepong Berhad and United Plantations Berhad. Since the 1970s, several ‘home grown’ companies have entered the industry, the most notable example being IOI Corporation Berhad which started form zero base in 1983 to become one of the largest plantation companies today. The equity of plantation companies in the country is largely under Malaysian ownership, the largest investors being the national equity corporation, Permodalan Nasional Berhad (PNB) and the Employees Provident Fund (EPF). PNB has substantial holdings in seven major plantation companies while EPF which provide retirement benefits for its members has made substantial investments in more than 14 plantation companies listed on the Kuala Lumpur Stock Exchange. Only a few companies have substantial or controlling foreign shareholding, notable examples being United Plantations Berhad and Pamol Plantatins Sdn Bhd which is Unilever’s plantation interest in Malaysia. However, the latter had recently announced to dispose all its plantations in the Malaysia. In addition to producing crude palm oil, many companies are also engaged in downstream production activities along the supply chain, such as palm oil refining, production of edible oil and palm-based products and manufacture of basic oleochemicals. The larger companies have also expanded their downstream operations offshore by establishing palm oil refineries in consuming countries such as India, Bangladesh, Pakistan, China and Egypt. Recently, two plantation companies established their presence in edible oils in Europe; Golden Hope Plantations Berhad acquired Unlilever’s Unimills BV which is second largest processor of edible oils in Europe while IOI Corporation Berhad took control of Loders Croklaan BV, a global producer and supplier of specialty oils and fats. Moving in the opposite direction, several companies have ventured into establishment of oil palm plantations off-shore, particularly in Indonesia to take advantage of the availability of land and workers and lower cost of production. The biggest player in this context is Kumpulan Guthrie Berhad which acquired about 200,000 hectares in Minamas Plantations in 2001. The major players also include a number of industry organisations standing for the different interests of upstream and downstream producers of palm oil and palm-based products and their derivatives. The most important organisations are the Malaysian Palm Oil Association (MPOA), the Malaysian Palm Oil Board (MPOB) and the Malaysian Palm Oil Promotional Council (MPOPC). MPOA is the government supported organization that replaced three large plantation sector organisations, namely the Rubber Growers Association (RGA), the United Planting Association of Malaysia (UPAM) and the Malaysian Oil Palm Growers Council (MOPGC). Its mission is to guarantee the long term profitability and development of the Malaysian palm oil industry. It has been entrusted with the task of balancing the
Enhancing Supply Chain Connectivity and Competitiveness of Malaysian Agriculture Products: Identifying Chokepoints and Opportunities for Improvement
9
requirements and interests of the various sectors for synergy and development of the plantation industry as a whole. Its membership is open for any individual or company that owns or manages plantation in Malaysian with minimum 40 hectares or above (MPOA, 2013). The Malaysian Palm Oil Board (MPOB) is the main government agency entrusted with looking after the wellbeing of the overall performance the country's oil palm industry. Its main role is to promote and develop national objectives, policies and priorities for the interests of the Malaysian oil palm industry. The recent rapid expansion in the industry and changing global oils and fats market called for amendment in the regulations of MPOB to keep in pace with world market needs to controll the quality of palm oil products. Role and responsibilities of serving the country's palm oil industry. It has been established on 1st May 2000, to take over the functions of the former Palm Oil Research and Development Board (PORDB), Palm Oil Research Institute of Malaysia (PORIM) and the Palm Oil Registration and Licensing Authority (PORLA) (MPOB, 2004, 2013). It is financed mainly from cess imposed on the industry for palm oil and palm kernel oil produce. Besides, it obtains allocations from the government to support development projects and for approved research projects under the Intensification of Research in Priority Areas (IRPA) programme. The main functions of MPOB are: inter alia, to implement policies and development programmes, regulate, register, co-ordinate and promote all activities toward assuring the viability of the oil palm industry of Malaysia. Another function is to carry out and upgrade research and development activities and commercialise research result s as well as provide technical, advisory and consultancy services to the industry. It acts as a centre for the oil palm industry resource and information, including the publication and dissemination of information on oil palm as well as other oils and fats. The Malaysian Palm Oil Promotion Council (MPOPC), established by the industry in 1990 to undertake promotional programmes and to create market opportunities for Malaysian palm oil in the world market (Panapanaan et al., 2009). Its activities are focused on marketing communications, technical marketing and market promotion locally and in several edible oil consuming countries. MPOPC’s operations are supported by contributions from the industry, based on volume of palm oil production, to the Palm Oil Promotion Fund.
Enhancing Supply Chain Connectivity and Competitiveness of Malaysian Agriculture Products: Identifying Chokepoints and Opportunities for Improvement
Figure 1 Major Players in tSource: Hai, 2002 Morerover, three government organisations the Natural Resources and Environmental Board (NREB) of Sarawak and the Environment Conservation Department (ECD) of Sabahthat perform approximately similar functions as their main activities inevaluation, monitoring in orders as prescribed under their corresponding legislation. 2.1.2 Product Description About the Palm Oil Palm oil is produced from the fruit of the oil palm or tree that originated in the tropical rain forest of West Africa. The fruits of oil palm are commonly referred to as fresh fruit bunches (FFB). The economic life of a is about 20-30 years and its highest fruit yield and oil extraction is achieved when it is seven to nine years old. It yields continuously throughout the year. The oil palm produces two types of oils, crude palm oil (CPO) is extracted from thmesocarp part of the fruits while lauric or palm kernel oil (PKO) is produced from the fruit kernel. The two types of oils are mostly produced in a ratio of ten to one. The annual average yield of oil palm is more than 3.8 mt of oil per hectare, other oil crops, such as rape seed, sunflower seed and soybean, which yield 0.7 mt, 0.6mt and 0.4 mt respectively24 hours so as to avoid deterioration of quality.
2 According to 2011/12 estimates
Enhancing Supply Chain Connectivity and Competitiveness of Malaysian Agriculture Products: Identifying Chokepoints and Opportunities for Improvement
10
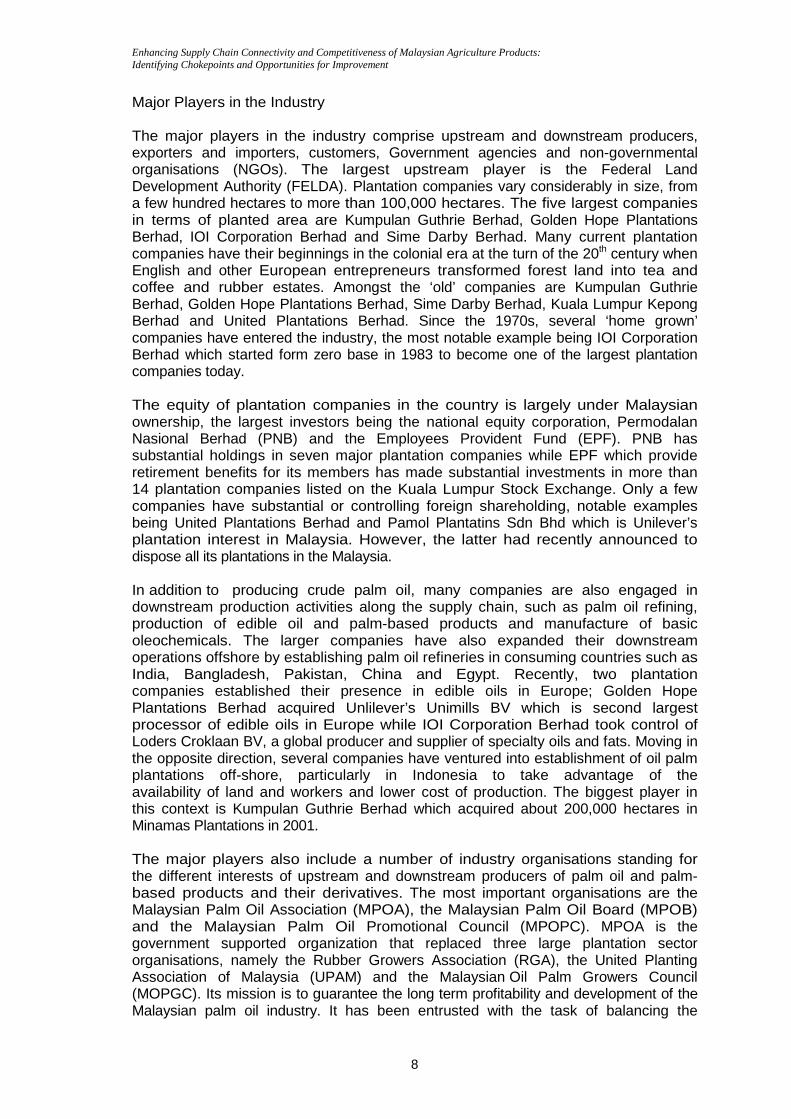
Players in the Palm Oil Supply Chain in Malaysia
government organisations Department of Environment Malaysia (DOE), the Natural Resources and Environmental Board (NREB) of Sarawak and the Environment Conservation Department (ECD) of Sabah are government Organisations that perform approximately similar functions as their main activities include environmental
in addition to the enforcement of environmental regulations and under their corresponding legislation.
Product Description
Palm oil is produced from the fruit of the oil palm or Elaeis Guineenistree that originated in the tropical rain forest of West Africa. The fruits of oil palm are commonly referred to as fresh fruit bunches (FFB). The economic life of a
30 years and its highest fruit yield and oil extraction is achieved when it is seven to nine years old. It yields continuously throughout the year. The oil palm produces two types of oils, crude palm oil (CPO) is extracted from thmesocarp part of the fruits while lauric or palm kernel oil (PKO) is produced from the fruit kernel. The two types of oils are mostly produced in a ratio of ten to one. The annual average yield of oil palm is more than 3.8 mt of oil per hectare, other oil crops, such as rape seed, sunflower seed and soybean, which yield 0.7 mt, 0.6mt and 0.4 mt respectively2 (MPIC, 2012). Fruit bunches should be processed within 24 hours so as to avoid deterioration of quality.
estimates
of Environment Malaysia (DOE), the Natural Resources and Environmental Board (NREB) of Sarawak and the
are government Organisations clude environmental
addition to the enforcement of environmental regulations and
Elaeis Guineenis tree, a perennial tree that originated in the tropical rain forest of West Africa. The fruits of oil palm are commonly referred to as fresh fruit bunches (FFB). The economic life of a palm oil tree
30 years and its highest fruit yield and oil extraction is achieved when it is seven to nine years old. It yields continuously throughout the year. The oil palm produces two types of oils, crude palm oil (CPO) is extracted from the fibrous mesocarp part of the fruits while lauric or palm kernel oil (PKO) is produced from the fruit kernel. The two types of oils are mostly produced in a ratio of ten to one. The annual average yield of oil palm is more than 3.8 mt of oil per hectare, in contrast with other oil crops, such as rape seed, sunflower seed and soybean, which yield 0.7 mt,
(MPIC, 2012). Fruit bunches should be processed within
Enhancing Supply Chain Connectivity and Competitiveness of Malaysian Agriculture Products: Identifying Chokepoints and Opportunities for Improvement
11
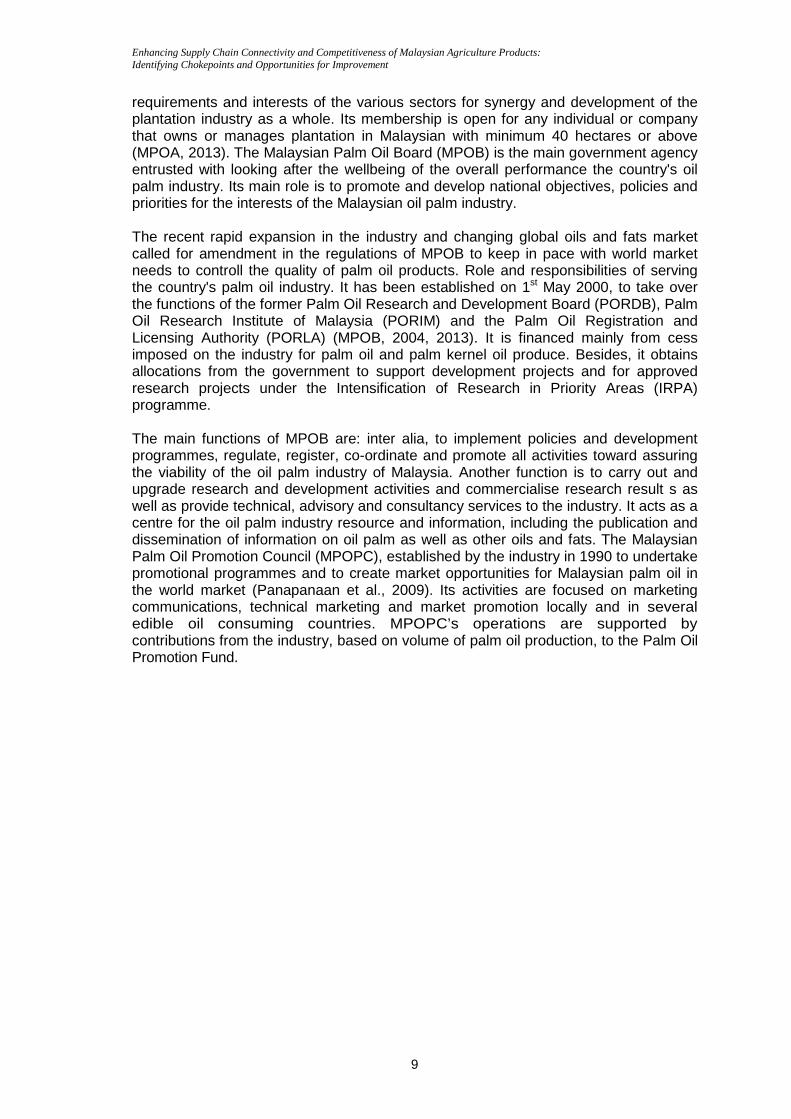
Palm and palm kernel oils have a wide range of applications, with about 80% used for food products while the rest is used in a number of non-food purposes (Salmiah, 2000).Crude palm oil is a fairly stable product, which can be stored before being processed into end products. The oil contains about 53% saturated fatty acids and about 47% unsaturated fatty acids, unlike other edible vegetable oils which consist of higher ratio of unsaturated fatty acids (Moll, 1987). Crude oil can be fractionated first then refined. Refined palm oil can be fractionated into palm olein (the liquid fraction of palm oil) and palm stearin (the solid fraction). The refined products are odourless and tasteless fats and oils which can be used for edible purposes such as household cooking, industrial frying, and as raw material for the manufacture of margarine, shortening, vegetable ghee, ice-cream, cocoa butter and none –diary creamers. Palm oil and its fractions can also be used as raw material for none-edible uses such as the manufacture of soaps, cosmetics, pharmaceuticals and water-treatment (for details see Figure 2). More recently, the biofuels market has provided a significant new non-food use for palm oil where it can be used as a biofuel either directly (CPO) as an alternative to mineral oils for use in power stations, or as palm oil methyl esters (PME) used as the feedstock for the production of biodiesel. Table 7 shows the major palm oil products with their respective Harmonized System (HS) codes.
Figure 2 Palm Oil Processing Chart Source: MPIC, Statistics on Commodities, 2011, p.163.
Enhancing Supply Chain Connectivity and Competitiveness of Malaysian Agriculture Products: Identifying Chokepoints and Opportunities for Improvement
12
Table 7 Major Oil Palm Products of Malaysia and Their HS Codes Product HS Code Crude palm oil 1511.10.000 Refined bleached deodorised palm olein 1511.90.900 Special super olein 1511.90.900 Crude palm olein 1511.90.990 Double fractionated palm olein 1511.90.990 Double fractionated refined bleached deodorised palm olein 1511.90.990 Palm super olein 1511.90.990 Crude palm kernel oil 1513.21.100 Refined bleached deodorised palm kernel olein 1513.29.120 Refined bleached deodorised palm kernel stearin 1513.29.149 Refined bleached deodorised palm stearin 1516.20.982 Palm fat acid distillate 3823.19.100 Palm acid oil 3823.19.210 Palm kernel fatty acid distillate 3823.19.900 Source: Malaysian Royal Customs Department, Southport Selangor, 2013 2.1.3 Supply Chain of Palm Oil Figure 3 depicts the supply chain of the palm oil products in Malaysia. The major sub-sectors of the supply chain are; production of fresh fruit bunches, milling of crude palm oil and crushing of the palm kernel, refining and oleochemical processing and export. The palm oil supply chain starts with the production of fresh fruit bunches at the farm level which are then milled to produce crude palm oil (CPO) and as well as palm kernel oil. The CPO is further refined into RBD olein and stearin which are either exported or further processed in the oleochemical sector. Figure 4 indicates the major players as well as the major logistic activities involved in the palm oil supply chain.The following paragraphs describe briely the activities under each sub-sector.
Enhancing Supply Chain Connectivity and Competitiveness of Malaysian Agriculture Products: Identifying Chokepoints and Opportunities for Improvement
13
Figure 3 Supply Chain for Palm Oil in Malaysia Source: MPOB, 2013 Note: Data refers to 2012
Storage (Palm
Kernel Oil)
Storage (Oleo-
chemical products)
No. of oleochemical plants: 17 Total capacity: 2.5 mn t/year Oleochemical products: 2.6 mn/t/year
Refinery
Fractionation Plants
Storage (RBD Olein)
Storage (RBD Palm
Stearin)
Shipping for Exports (17.6 mn t/year) No. of installation: 35
Palm Kernels
No. of palm oil refineries: 54 Total capacity: 24.8 mn t/year RBD oil: 13.3 mn t/year RBD olein: 9.5 mn t/year RB palm stearin: 2.5 mn t/year
Palm Stearin
Palm Olein
Crude Palm
Kernel Oil Oleochemical
Storage (Crude
Palm Oil)
Bulk tankers Parcel tankers Coasters
Capacity 1,500-75,000mt -mainly crude palm oil
Capacity 1,500-50,000mt -smaller parcels of palm oil fractions & palm kernel oil
Capacity 750-6,500mt -for regional transport
Plantation (62% of the total
area)
Smallholders (38% of the total
area)
Oil Mills Palm Kernel Mills
No. of mills: 429 Total mill capacity: 22.8 mn t/year Total CPO production: 18.7 mn t/year
No. of mills: 46 Total mill capacity: 6.9 palm kernel/ mn t/ year Total production: 9.3 mn t/year
FFB output: 93.2 mn t/year
Crude Palm Oil
Enhancing Supply Chain Connectivity and Competitiveness of Malaysian Agriculture Products: Identifying Chokepoints and Opportunities for Improvement
14
Figure 4 Industry Players and Logistic Activities in the Supply Chain of Palm Oil in Malaysia Production of Fresh Fruit Bunches (FFB) The production of fruit bunches starts with the development of plantations for the production of (FFB). The development of new plantations would require the carrying out feasibility studies and an environment impact assessment (EIA) if the area to be developed is primary or secondary forest exceeding 500 hectares. An EIA is also required if the development involves changes in the types of agricultural use of land more than 500 hectares. The EIA study would help in identifying likely environmental and social effects and development of management plans to alleviate the unfavourable effects. The process for the approval is based on the approach adopted by the Natural Resources and Environment Board, Sarawak. As soon as the land is approved by the respective agencies for development to proceed nursery establishment commences, followed by site preparation which include land survey, clearing of existing vegetation, establishment of a road and field drainage system, soil conservation measures such as terracing, conservation bunds and silt pits and sowing of leguminous cover crops(Hai, 2002). A number of Good Agricultural Practices (GAPs) are adopted by the Malaysian oil palm industry. Zero burning had been introduced into the plantation and enforced since 1987 under the Environmental Quality Act (EQA) 1974 as part of the Oil Palm Good Agriculture Practice (OPGAP). Replanting, currently, includes chipping the old oil palm trunk and fronds and the residues are laid in the inter-rows as a biomass mulch to release nutrients for the newly replanted oil palm crop gradually. The OPGAP is excpected to pave way for sustainable production in the field. Similarly, oil palm GAP Integrated Pest Management (IPM) helps in reducing pesticide usage because the biological control through practices such as barn owl to control rat, and biopesticides like Metarhizzium fungi and virus to control Rhinocerous beetle grubs, Bt virus for control of bagworms, Trichoderma to control Ganoderma, etc, avoid use of chemicals. Furthermore, Codes of Practices (COPs) throughout the supply chain have been
Transportation
Forwarding Agents, Bulk Installation Operators, Surveyors and Chemists
Port/Installation
Transportation
Trade Producers, Processors,
Manufacturers
Refinery
Milling
Oleo-chemical Manufacturer
Importer
Exporter
Logistics Services Providers
Production
Enhancing Supply Chain Connectivity and Competitiveness of Malaysian Agriculture Products: Identifying Chokepoints and Opportunities for Improvement
15
launched by MPOB in August 2007. They include, inter alia, Good Practice for Nursery and Good Agricultural Practice for Oil Palm Estates & Smallholdings3 (MPOB, 2013d). The total area under palm oil was estimated at 5,076,929ha in 2012 in which the plantation sector accounted for 62% while the balance were the smallholders (MPOB, 2012). However, in terms of production, the share of the estates is relatively higher due to their higher productivity compared to smallholders. Palm Oil Milling Process (Production of CPO and PK) The palm oil milling process involves the physical extraction of palm products namely, crude palm oil and palm kernel from the FFB. After harvesting, it is important that the fresh fruit bunches (FFB) are processed as soon as possible to prevent a rapid rise in free fatty acids (FFA) which could adversely affect the quality of the crude palm oil (CPO). This immediate processing requires the mills to be located within the vicinity of the plantation area. Harvested FFB is loaded onto small 5-tonnes lorries to 25-tonnes open trailers to be transported to the mills. Some private mills do have their own tanker lorries, but the capacities of these lorries are rather small (Ibrahim 2008). After milling process the CPO then gets transported to the refineries for further processing and the PK to the crushers for the palm kernel oil to be extracted. In 2012, there were a total of 429 mills with a total capacity of 22.8 tonnes per year. This sub-sector produced about 18.7 mn tonnes of CPO in 2012. The total number of palm kernel mills stood at 46 with a total capacity of 6.9 mn tonnes per year. The total palm kernel product produced was estimated at 9.3 mn tonnes. Refining The purpose of the refining process is to produce an edible oil of uniform quality that meets industry’s standards and satisfies customer requirements. Specifically in respect of FFA, moisture and impurities, Iodine value, peroxide value, melting point, colour and flavour. Since processed palm oil is exported by the use of ship tankers, the refineries are usually located at the ports e.g. Cargill owns and operates three “state-of-the-art” refineries in Port Klang, Kuantan and West Port, and also a jointly owned refinery in Sarawak. Additionally they are building an additional oil refinery in the Port Klang Free Zone (Cargill, 2013). Other refiners include, inter alia, Kwantas Corp and Wilmar International. Wimar’s refinery is a joint venture with TSH Resources. These three refineries have a production capacity of 1.8 mn mt per annum. The refined oil must tasteless and have a plain flavour. This process removes free fatty acids, phosphatides, odouriferous matter, water as well as impurities such as dirt and traces of metals from the CPO by either physical or chemical refining to produce either refined, bleached and deodorised palm oil (RBDPO) or neutralised, bleached and deodorised palm oil (NBDPO). These are products subjected to fractionation to obtain the respective liquid olein fraction and the solid stearin fraction. Physical refining is the widespread method implemented by the refineries as it is simpler, less capital intensive, more efficient and produces a lower effluent load. Some companies e.g. Cargill beside owning a number of refineries, they are involved in manufacturing products ranging from palm oil-based bakery fats for use in baking and frying, value added bulk refined oils, packaged palm products as well as specialty fats
3 The other Codes of Practices are: Good Milling Practice for Palm Oil Mills; Good Crushing Practice for Palm Kernel Crushers; Good Refining Practice for Palm Oil Refineries; Good Practice for the Handling, Transport and Storage of Products from the Oil Palm and Good Practice for Bulking Installations.
Enhancing Supply Chain Connectivity and Competitiveness of Malaysian Agriculture Products: Identifying Chokepoints and Opportunities for Improvement
16
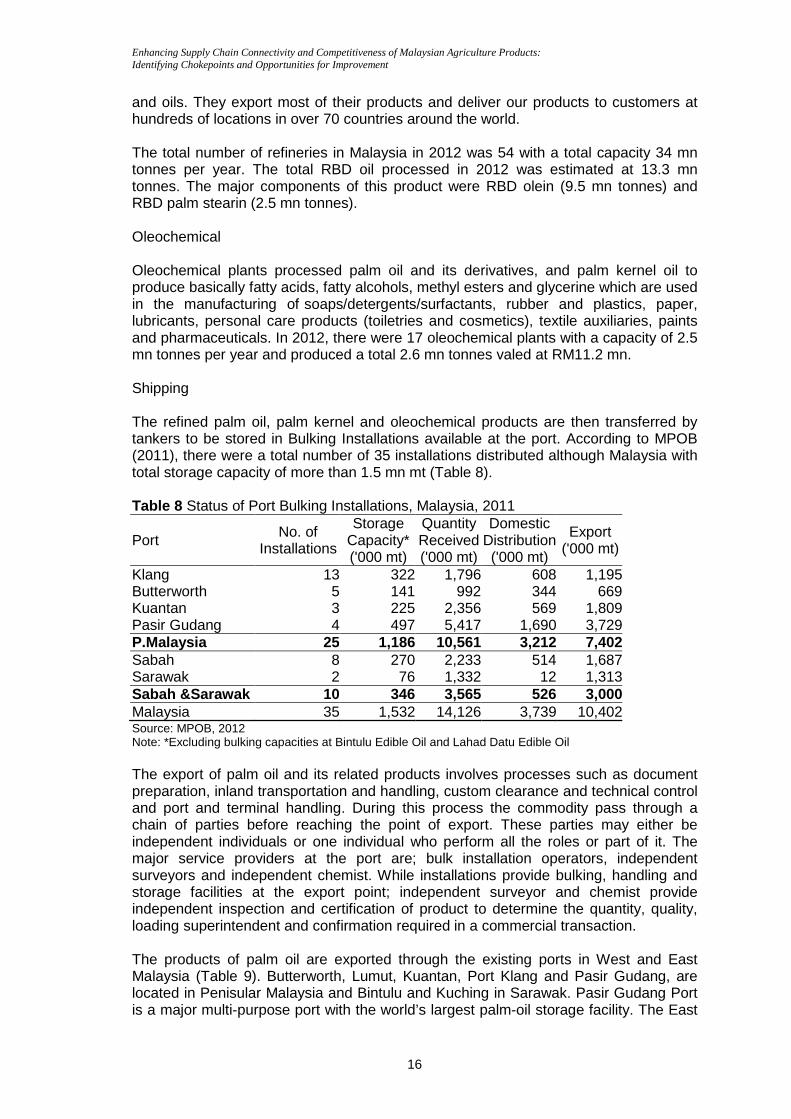
and oils. They export most of their products and deliver our products to customers at hundreds of locations in over 70 countries around the world. The total number of refineries in Malaysia in 2012 was 54 with a total capacity 34 mn tonnes per year. The total RBD oil processed in 2012 was estimated at 13.3 mn tonnes. The major components of this product were RBD olein (9.5 mn tonnes) and RBD palm stearin (2.5 mn tonnes). Oleochemical Oleochemical plants processed palm oil and its derivatives, and palm kernel oil to produce basically fatty acids, fatty alcohols, methyl esters and glycerine which are used in the manufacturing of soaps/detergents/surfactants, rubber and plastics, paper, lubricants, personal care products (toiletries and cosmetics), textile auxiliaries, paints and pharmaceuticals. In 2012, there were 17 oleochemical plants with a capacity of 2.5 mn tonnes per year and produced a total 2.6 mn tonnes valed at RM11.2 mn. Shipping The refined palm oil, palm kernel and oleochemical products are then transferred by tankers to be stored in Bulking Installations available at the port. According to MPOB (2011), there were a total number of 35 installations distributed although Malaysia with total storage capacity of more than 1.5 mn mt (Table 8). Table 8 Status of Port Bulking Installations, Malaysia, 2011
Port No. of Installations
Storage Capacity* ('000 mt)
Quantity Received ('000 mt)
Domestic Distribution ('000 mt)
Export ('000 mt)
Klang 13 322 1,796 608 1,195Butterworth 5 141 992 344 669Kuantan 3 225 2,356 569 1,809Pasir Gudang 4 497 5,417 1,690 3,729P.Malaysia 25 1,186 10,561 3,212 7,402Sabah 8 270 2,233 514 1,687Sarawak 2 76 1,332 12 1,313Sabah &Sarawak 10 346 3,565 526 3,000Malaysia 35 1,532 14,126 3,739 10,402Source: MPOB, 2012 Note: *Excluding bulking capacities at Bintulu Edible Oil and Lahad Datu Edible Oil The export of palm oil and its related products involves processes such as document preparation, inland transportation and handling, custom clearance and technical control and port and terminal handling. During this process the commodity pass through a chain of parties before reaching the point of export. These parties may either be independent individuals or one individual who perform all the roles or part of it. The major service providers at the port are; bulk installation operators, independent surveyors and independent chemist. While installations provide bulking, handling and storage facilities at the export point; independent surveyor and chemist provide independent inspection and certification of product to determine the quantity, quality, loading superintendent and confirmation required in a commercial transaction. The products of palm oil are exported through the existing ports in West and East Malaysia (Table 9). Butterworth, Lumut, Kuantan, Port Klang and Pasir Gudang, are located in Penisular Malaysia and Bintulu and Kuching in Sarawak. Pasir Gudang Port is a major multi-purpose port with the world’s largest palm-oil storage facility. The East
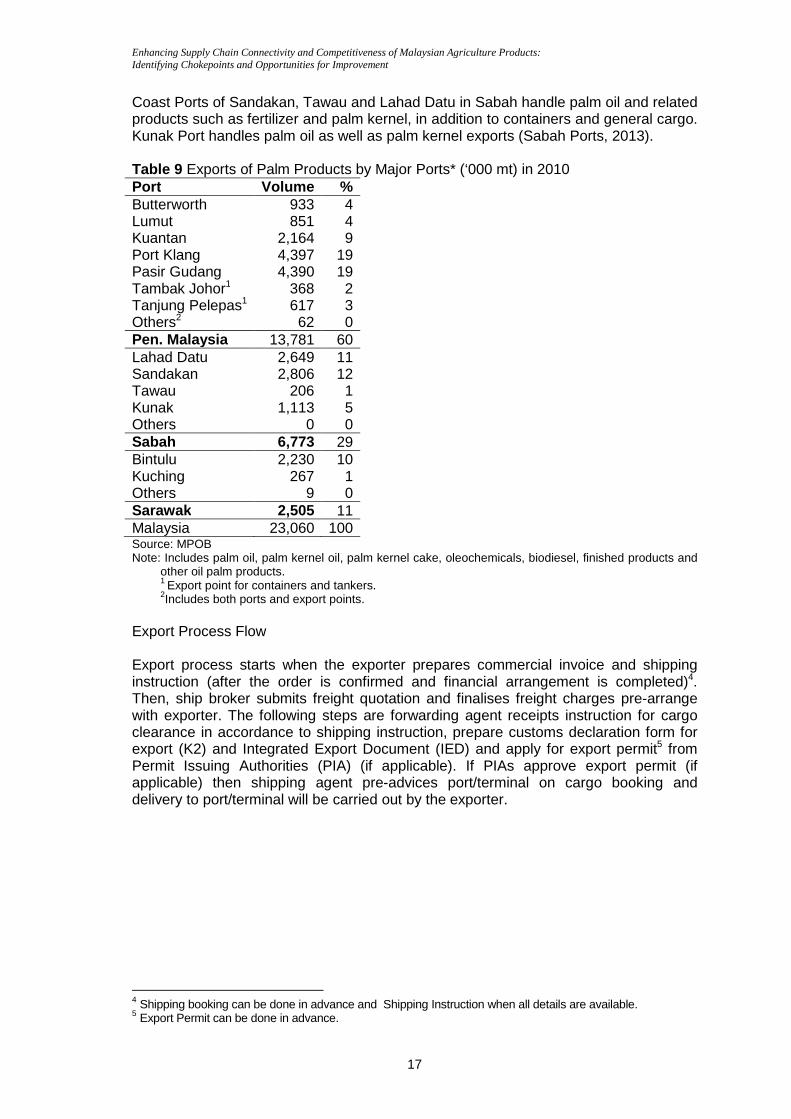
Enhancing Supply Chain Connectivity and Competitiveness of Malaysian Agriculture Products: Identifying Chokepoints and Opportunities for Improvement
17
Coast Ports of Sandakan, Tawau and Lahad Datu in Sabah handle palm oil and related products such as fertilizer and palm kernel, in addition to containers and general cargo. Kunak Port handles palm oil as well as palm kernel exports (Sabah Ports, 2013). Table 9 Exports of Palm Products by Major Ports* (‘000 mt) in 2010 Port Volume % Butterworth 933 4 Lumut 851 4 Kuantan 2,164 9 Port Klang 4,397 19 Pasir Gudang 4,390 19 Tambak Johor1 368 2 Tanjung Pelepas1 617 3 Others2 62 0 Pen. Malaysia 13,781 60 Lahad Datu 2,649 11 Sandakan 2,806 12 Tawau 206 1 Kunak 1,113 5 Others 0 0 Sabah 6,773 29 Bintulu 2,230 10 Kuching 267 1 Others 9 0 Sarawak 2,505 11 Malaysia 23,060 100 Source: MPOB Note: Includes palm oil, palm kernel oil, palm kernel cake, oleochemicals, biodiesel, finished products and
other oil palm products. 1 Export point for containers and tankers. 2Includes both ports and export points.
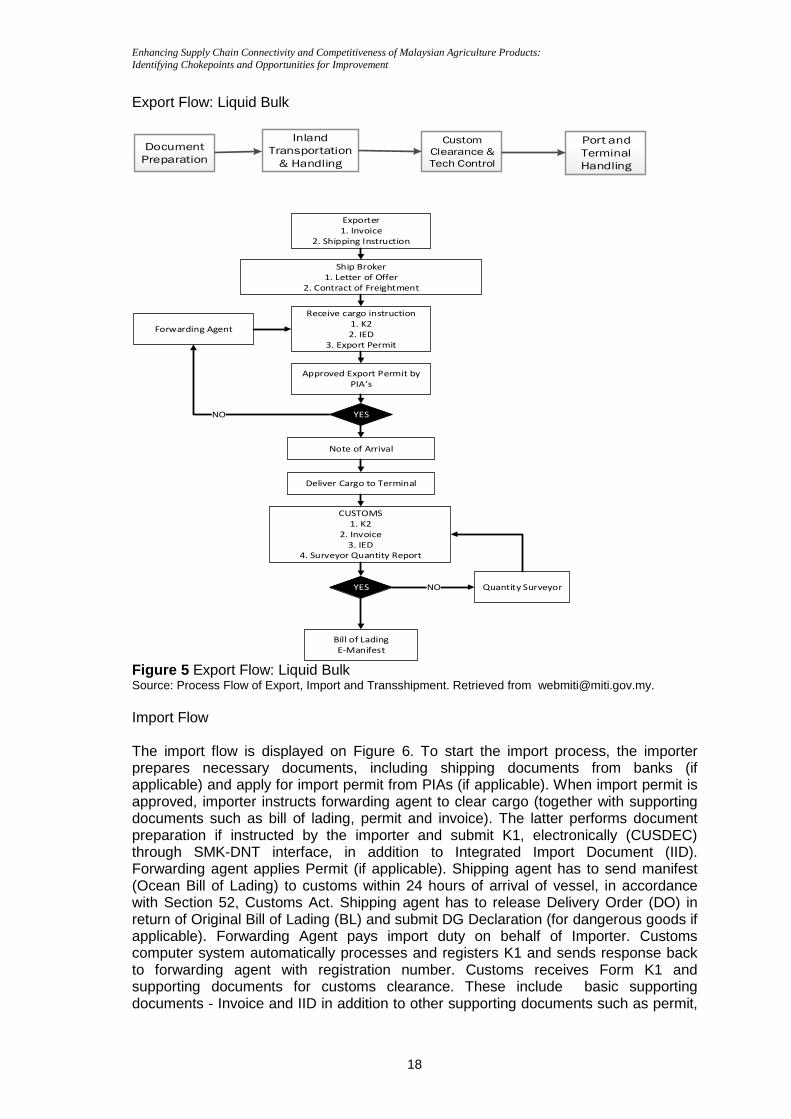
Export Process Flow Export process starts when the exporter prepares commercial invoice and shipping instruction (after the order is confirmed and financial arrangement is completed)4. Then, ship broker submits freight quotation and finalises freight charges pre-arrange with exporter. The following steps are forwarding agent receipts instruction for cargo clearance in accordance to shipping instruction, prepare customs declaration form for export (K2) and Integrated Export Document (IED) and apply for export permit5 from Permit Issuing Authorities (PIA) (if applicable). If PIAs approve export permit (if applicable) then shipping agent pre-advices port/terminal on cargo booking and delivery to port/terminal will be carried out by the exporter.
4 Shipping booking can be done in advance and Shipping Instruction when all details are available. 5 Export Permit can be done in advance.
Enhancing Supply Chain Connectivity and Competitiveness of Malaysian Agriculture Products: Identifying Chokepoints and Opportunities for Improvement
18
Export Flow: Liquid Bulk
Document
Preparation
Inland
Transportation
& Handling
Custom Clearance &
Tech Control
Port and
Terminal
Handling
Exporter
1. Invoice
2. Shipping Instruction
Forwarding Agent
Ship Broker
1. Letter of Offer
2. Contract of Freightment
Receive cargo instruction
1. K2
2. IED
3. Export Permit
Approved Export Permit by
PIA’s
YESNO
Note of Arrival
Deliver Cargo to Terminal
CUSTOMS
1. K2
2. Invoice
3. IED
4. Surveyor Quantity Report
YES Quantity Surveyor
Bill of Lading
E-Manifest
NO
Figure 5 Export Flow: Liquid Bulk Source: Process Flow of Export, Import and Transshipment. Retrieved from [email protected]. Import Flow The import flow is displayed on Figure 6. To start the import process, the importer prepares necessary documents, including shipping documents from banks (if applicable) and apply for import permit from PIAs (if applicable). When import permit is approved, importer instructs forwarding agent to clear cargo (together with supporting documents such as bill of lading, permit and invoice). The latter performs document preparation if instructed by the importer and submit K1, electronically (CUSDEC) through SMK-DNT interface, in addition to Integrated Import Document (IID). Forwarding agent applies Permit (if applicable). Shipping agent has to send manifest (Ocean Bill of Lading) to customs within 24 hours of arrival of vessel, in accordance with Section 52, Customs Act. Shipping agent has to release Delivery Order (DO) in return of Original Bill of Lading (BL) and submit DG Declaration (for dangerous goods if applicable). Forwarding Agent pays import duty on behalf of Importer. Customs computer system automatically processes and registers K1 and sends response back to forwarding agent with registration number. Customs receives Form K1 and supporting documents for customs clearance. These include basic supporting documents - Invoice and IID in addition to other supporting documents such as permit,
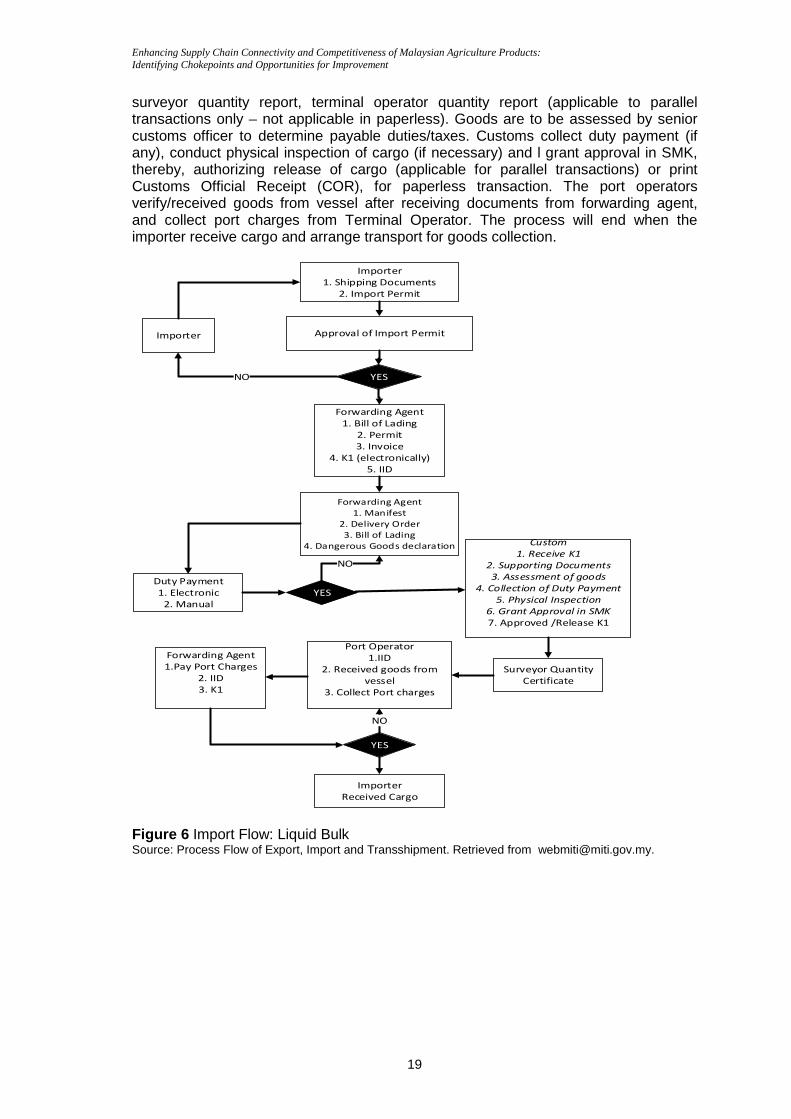
Enhancing Supply Chain Connectivity and Competitiveness of Malaysian Agriculture Products: Identifying Chokepoints and Opportunities for Improvement
19
surveyor quantity report, terminal operator quantity report (applicable to parallel transactions only – not applicable in paperless). Goods are to be assessed by senior customs officer to determine payable duties/taxes. Customs collect duty payment (if any), conduct physical inspection of cargo (if necessary) and l grant approval in SMK, thereby, authorizing release of cargo (applicable for parallel transactions) or print Customs Official Receipt (COR), for paperless transaction. The port operators verify/received goods from vessel after receiving documents from forwarding agent, and collect port charges from Terminal Operator. The process will end when the importer receive cargo and arrange transport for goods collection.
Importer
1. Shipping Documents
2. Import Permit
Approval of Import Permit
Forwarding Agent
1. Manifest
2. Delivery Order
3. Bill of Lading
4. Dangerous Goods declaration
YES
Duty Payment
1. Electronic
2. Manual
Custom
1. Receive K1
2. Supporting Documents
3. Assessment of goods
4. Collection of Duty Payment
5. Physical Inspection
6. Grant Approval in SMK
7. Approved /Release K1
Forwarding Agent
1.Pay Port Charges
2. IID
3. K1
YES
Importer
Received Cargo
Importer
YESNO
Forwarding Agent
1. Bill of Lading
2. Permit
3. Invoice
4. K1 (electronically)
5. IID
NO
Surveyor Quantity
Certificate
Port Operator
1.IID
2. Received goods from
vessel
3. Collect Port charges
NO
Figure 6 Import Flow: Liquid Bulk Source: Process Flow of Export, Import and Transshipment. Retrieved from [email protected].
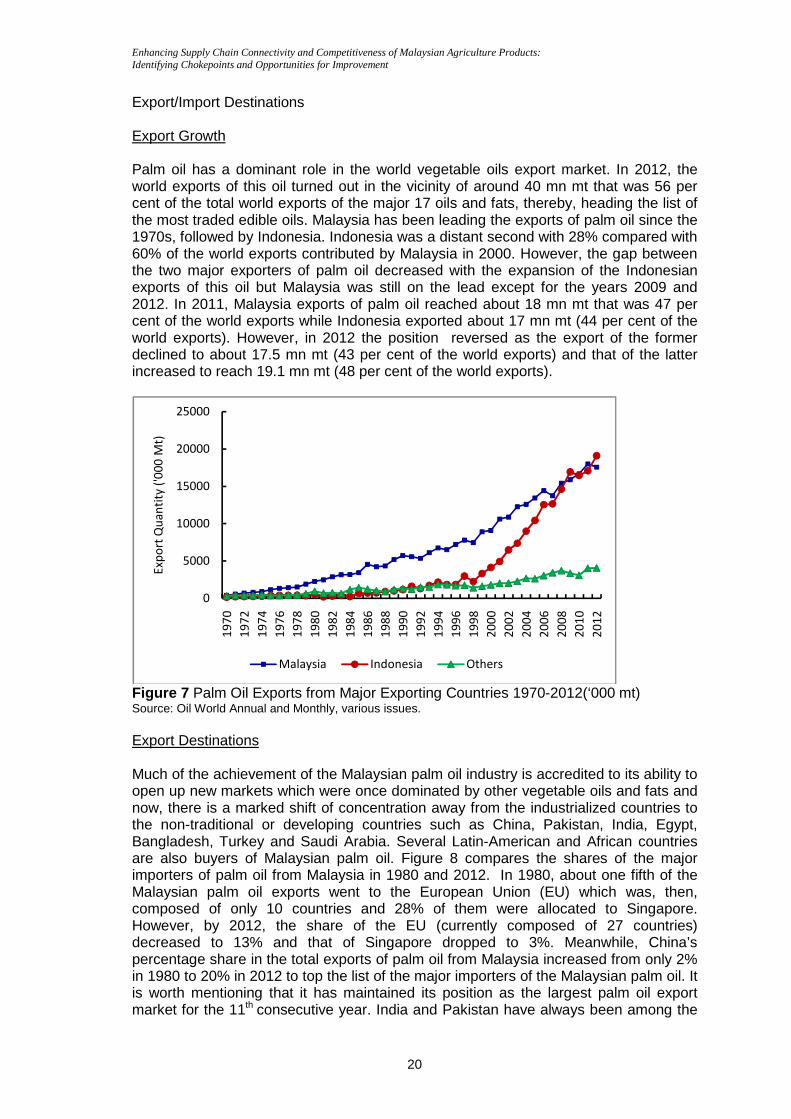
Enhancing Supply Chain Connectivity and Competitiveness of Malaysian Agriculture Products: Identifying Chokepoints and Opportunities for Improvement
20
Export/Import Destinations Export Growth Palm oil has a dominant role in the world vegetable oils export market. In 2012, the world exports of this oil turned out in the vicinity of around 40 mn mt that was 56 per cent of the total world exports of the major 17 oils and fats, thereby, heading the list of the most traded edible oils. Malaysia has been leading the exports of palm oil since the 1970s, followed by Indonesia. Indonesia was a distant second with 28% compared with 60% of the world exports contributed by Malaysia in 2000. However, the gap between the two major exporters of palm oil decreased with the expansion of the Indonesian exports of this oil but Malaysia was still on the lead except for the years 2009 and 2012. In 2011, Malaysia exports of palm oil reached about 18 mn mt that was 47 per cent of the world exports while Indonesia exported about 17 mn mt (44 per cent of the world exports). However, in 2012 the position reversed as the export of the former declined to about 17.5 mn mt (43 per cent of the world exports) and that of the latter increased to reach 19.1 mn mt (48 per cent of the world exports).
Figure 7 Palm Oil Exports from Major Exporting Countries 1970-2012(‘000 mt) Source: Oil World Annual and Monthly, various issues. Export Destinations Much of the achievement of the Malaysian palm oil industry is accredited to its ability to open up new markets which were once dominated by other vegetable oils and fats and now, there is a marked shift of concentration away from the industrialized countries to the non-traditional or developing countries such as China, Pakistan, India, Egypt, Bangladesh, Turkey and Saudi Arabia. Several Latin-American and African countries are also buyers of Malaysian palm oil. Figure 8 compares the shares of the major importers of palm oil from Malaysia in 1980 and 2012. In 1980, about one fifth of the Malaysian palm oil exports went to the European Union (EU) which was, then, composed of only 10 countries and 28% of them were allocated to Singapore. However, by 2012, the share of the EU (currently composed of 27 countries) decreased to 13% and that of Singapore dropped to 3%. Meanwhile, China’s percentage share in the total exports of palm oil from Malaysia increased from only 2% in 1980 to 20% in 2012 to top the list of the major importers of the Malaysian palm oil. It is worth mentioning that it has maintained its position as the largest palm oil export market for the 11th consecutive year. India and Pakistan have always been among the
0
5000
10000
15000
20000
25000
19
70
19
72
19
74
19
76
19
78
19
80
19
82
19
84
19
86
19
88
19
90
19
92
19
94
19
96
19
98
20
00
20
02
20
04
20
06
20
08
20
10
20
12
Exp
ort
Qu
an
tity
('0
00
Mt)
Malaysia Indonesia Others
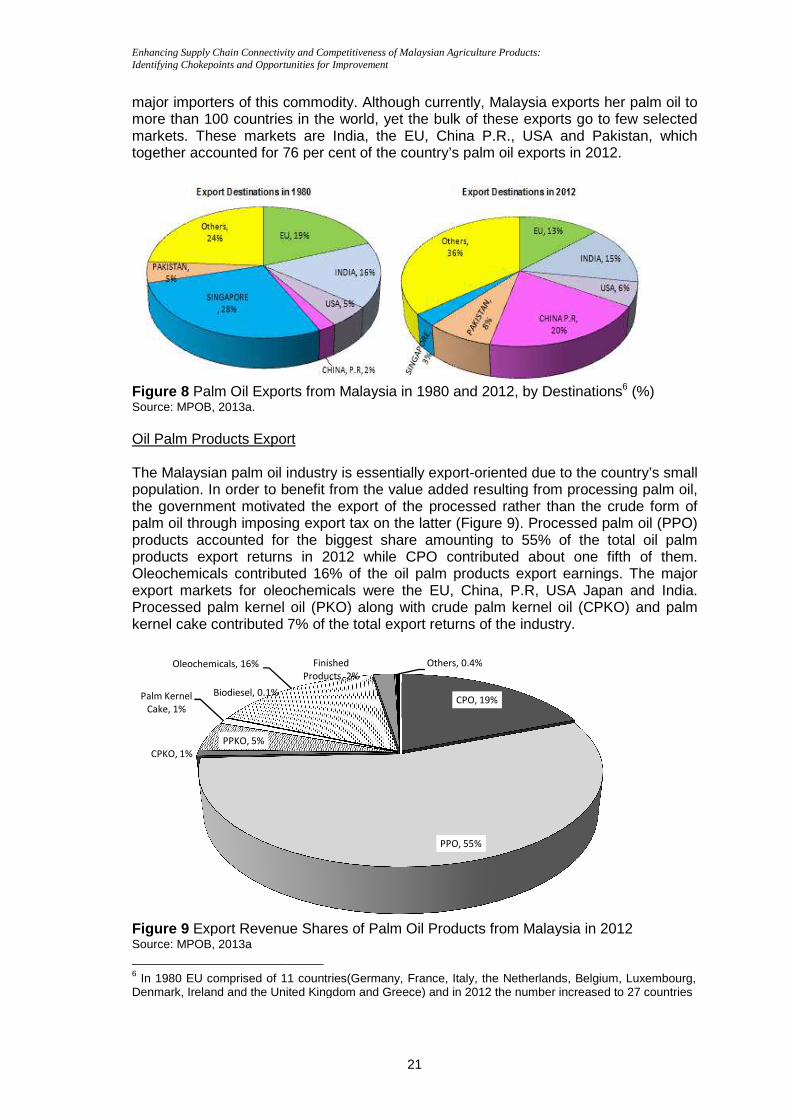
Enhancing Supply Chain Connectivity and Competitiveness of Malaysian Agriculture Products: Identifying Chokepoints and Opportunities for Improvement
major importers of this commodity. Amore than 100 countries in the world, yet the bulk of these exports go to few selected markets. These markets are India, the EU, China P.R., USA and Pakistan, which together accounted for 76 per cent of t
Figure 8 Palm Oil Exports from Malaysia in 1980 and 2012, by DestinationsSource: MPOB, 2013a. Oil Palm Products Export The Malaysian palm oil industry is essentially exportpopulation. In order to benefit from the value added resulting from processing palm oil, the government motivated the export of the processed rather than the crude fopalm oil through imposing export tax on the latter (Figure products accounted for the biggest share amounting to 55% of the total oil palm products export returns in 2012 while CPO contributed about one fifth of theOleochemicals contributed 16export markets for oleochemicals were the EU, China, P.R, USA Japan and India. Processed palm kernel oil (PKO) along with crude palm kernel oil (CPKO) and palm kernel cake contributed 7% of the total export returns of the industry.
Figure 9 Export Revenue Shares of Palm Oil Products from Malaysia in 2012Source: MPOB, 2013a
6 In 1980 EU comprised of 11 countries(Germany, France, Italy, the Netherlands, Belgium, Luxembourg, Denmark, Ireland and the United Kingdom and Greece) and in 2012 the number increased to 27 countries
CPKO, 1%
PPKO, 5%
Palm Kernel
Cake, 1%
Oleochemicals, 16%
Biodiesel, 0.1%
Enhancing Supply Chain Connectivity and Competitiveness of Malaysian Agriculture Products: Identifying Chokepoints and Opportunities for Improvement
21
major importers of this commodity. Although currently, Malaysia exports her palm oil to 100 countries in the world, yet the bulk of these exports go to few selected
markets. These markets are India, the EU, China P.R., USA and Pakistan, which together accounted for 76 per cent of the country’s palm oil exports in 2012.
Palm Oil Exports from Malaysia in 1980 and 2012, by Destinations
Oil Palm Products Export
The Malaysian palm oil industry is essentially export-oriented due to the country’s small population. In order to benefit from the value added resulting from processing palm oil, the government motivated the export of the processed rather than the crude fopalm oil through imposing export tax on the latter (Figure 9). Processed palm oil (PPO) products accounted for the biggest share amounting to 55% of the total oil palm products export returns in 2012 while CPO contributed about one fifth of the
ochemicals contributed 16% of the oil palm products export earnings. The major export markets for oleochemicals were the EU, China, P.R, USA Japan and India. Processed palm kernel oil (PKO) along with crude palm kernel oil (CPKO) and palm
ibuted 7% of the total export returns of the industry.
Export Revenue Shares of Palm Oil Products from Malaysia in 2012
In 1980 EU comprised of 11 countries(Germany, France, Italy, the Netherlands, Belgium, Luxembourg,
Denmark, Ireland and the United Kingdom and Greece) and in 2012 the number increased to 27 countries
CPO, 19%
PPO, 55%
Finished
Products, 2%
Others, 0.4%
lthough currently, Malaysia exports her palm oil to 100 countries in the world, yet the bulk of these exports go to few selected
markets. These markets are India, the EU, China P.R., USA and Pakistan, which he country’s palm oil exports in 2012.
Palm Oil Exports from Malaysia in 1980 and 2012, by Destinations6 (%)
oriented due to the country’s small population. In order to benefit from the value added resulting from processing palm oil, the government motivated the export of the processed rather than the crude form of
). Processed palm oil (PPO) products accounted for the biggest share amounting to 55% of the total oil palm products export returns in 2012 while CPO contributed about one fifth of them.
% of the oil palm products export earnings. The major export markets for oleochemicals were the EU, China, P.R, USA Japan and India. Processed palm kernel oil (PKO) along with crude palm kernel oil (CPKO) and palm
ibuted 7% of the total export returns of the industry.
Export Revenue Shares of Palm Oil Products from Malaysia in 2012
In 1980 EU comprised of 11 countries(Germany, France, Italy, the Netherlands, Belgium, Luxembourg, Denmark, Ireland and the United Kingdom and Greece) and in 2012 the number increased to 27 countries
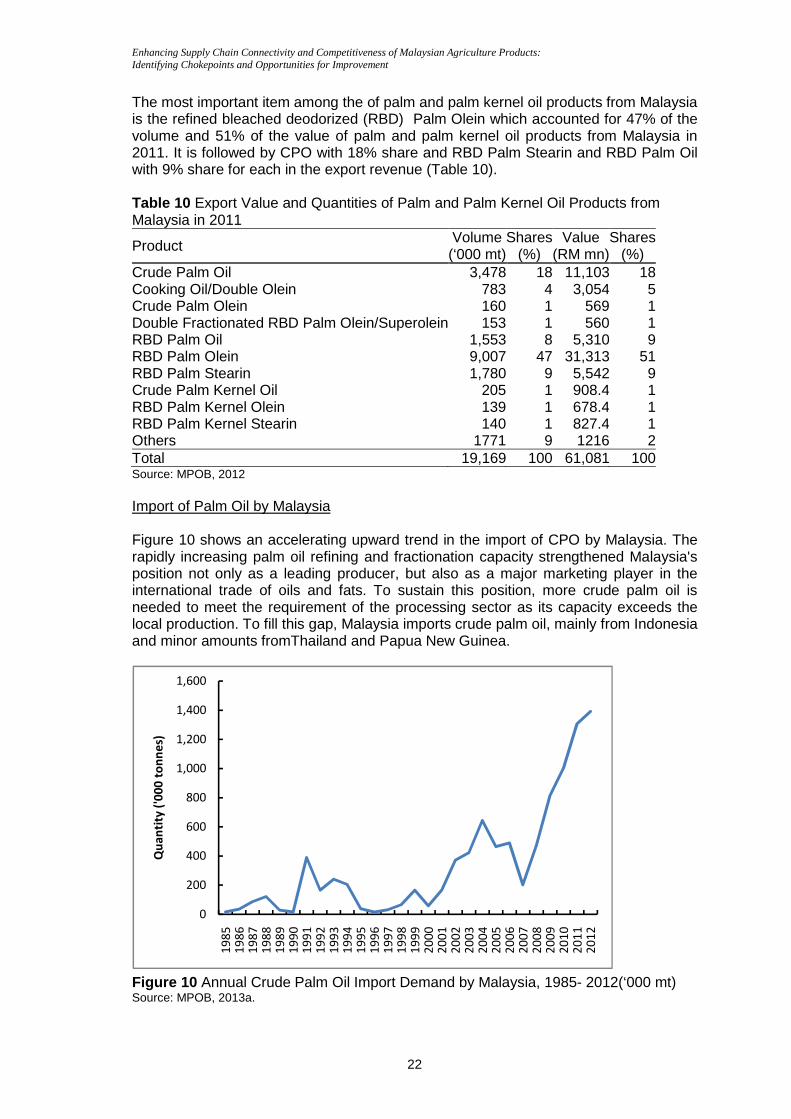
Enhancing Supply Chain Connectivity and Competitiveness of Malaysian Agriculture Products: Identifying Chokepoints and Opportunities for Improvement
22
The most important item among the of palm and palm kernel oil products from Malaysia is the refined bleached deodorized (RBD) Palm Olein which accounted for 47% of the volume and 51% of the value of palm and palm kernel oil products from Malaysia in 2011. It is followed by CPO with 18% share and RBD Palm Stearin and RBD Palm Oil with 9% share for each in the export revenue (Table 10). Table 10 Export Value and Quantities of Palm and Palm Kernel Oil Products from Malaysia in 2011
Product Volume (‘000 mt)
Shares (%)
Value (RM mn)
Shares (%)
Crude Palm Oil 3,478 18 11,103 18Cooking Oil/Double Olein 783 4 3,054 5Crude Palm Olein 160 1 569 1Double Fractionated RBD Palm Olein/Superolein 153 1 560 1RBD Palm Oil 1,553 8 5,310 9RBD Palm Olein 9,007 47 31,313 51RBD Palm Stearin 1,780 9 5,542 9Crude Palm Kernel Oil 205 1 908.4 1RBD Palm Kernel Olein 139 1 678.4 1RBD Palm Kernel Stearin 140 1 827.4 1Others 1771 9 1216 2Total 19,169 100 61,081 100Source: MPOB, 2012 Import of Palm Oil by Malaysia Figure 10 shows an accelerating upward trend in the import of CPO by Malaysia. The rapidly increasing palm oil refining and fractionation capacity strengthened Malaysia's position not only as a leading producer, but also as a major marketing player in the international trade of oils and fats. To sustain this position, more crude palm oil is needed to meet the requirement of the processing sector as its capacity exceeds the local production. To fill this gap, Malaysia imports crude palm oil, mainly from Indonesia and minor amounts fromThailand and Papua New Guinea.
Figure 10 Annual Crude Palm Oil Import Demand by Malaysia, 1985- 2012(‘000 mt) Source: MPOB, 2013a.
0
200
400
600
800
1,000
1,200
1,400
1,600
19
85
19
86
19
87
19
88
19
89
19
90
19
91
19
92
19
93
19
94
19
95
19
96
19
97
19
98
19
99
20
00
20
01
20
02
20
03
20
04
20
05
20
06
20
07
20
08
20
09
20
10
20
11
20
12
Qu
an
tity
('0
00
to
nn
es)
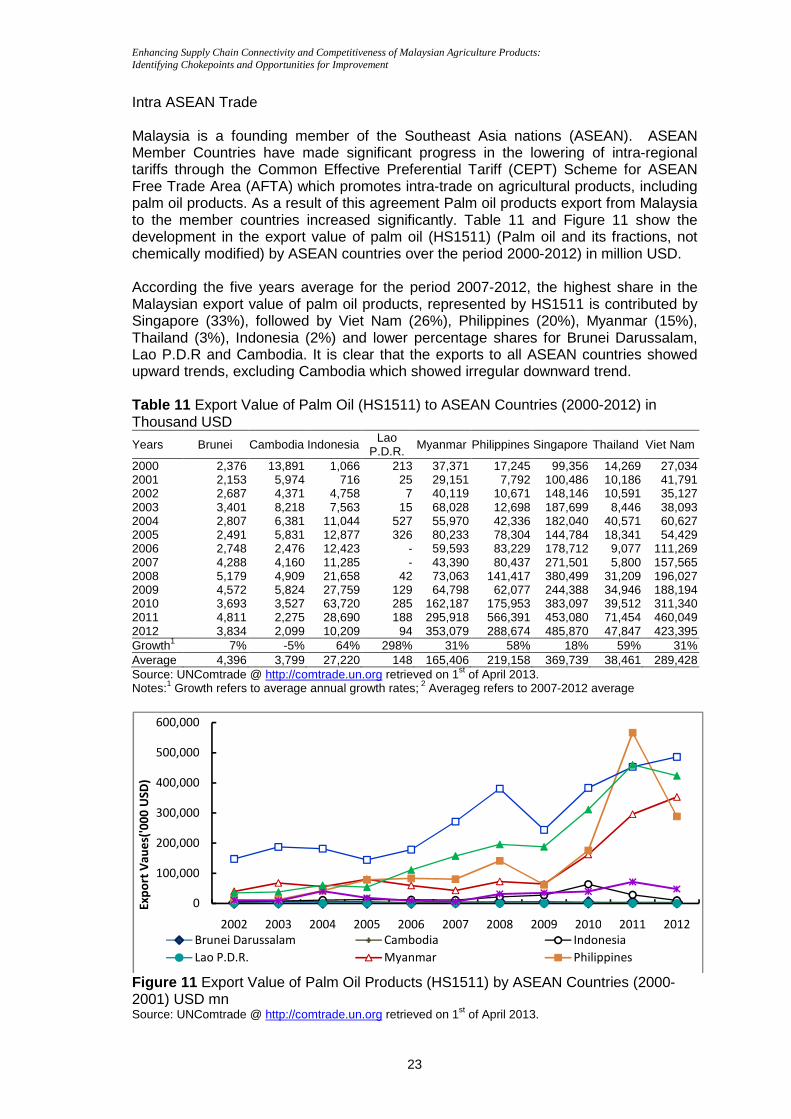
Enhancing Supply Chain Connectivity and Competitiveness of Malaysian Agriculture Products: Identifying Chokepoints and Opportunities for Improvement
23
Intra ASEAN Trade Malaysia is a founding member of the Southeast Asia nations (ASEAN). ASEAN Member Countries have made significant progress in the lowering of intra-regional tariffs through the Common Effective Preferential Tariff (CEPT) Scheme for ASEAN Free Trade Area (AFTA) which promotes intra-trade on agricultural products, including palm oil products. As a result of this agreement Palm oil products export from Malaysia to the member countries increased significantly. Table 11 and Figure 11 show the development in the export value of palm oil (HS1511) (Palm oil and its fractions, not chemically modified) by ASEAN countries over the period 2000-2012) in million USD. According the five years average for the period 2007-2012, the highest share in the Malaysian export value of palm oil products, represented by HS1511 is contributed by Singapore (33%), followed by Viet Nam (26%), Philippines (20%), Myanmar (15%), Thailand (3%), Indonesia (2%) and lower percentage shares for Brunei Darussalam, Lao P.D.R and Cambodia. It is clear that the exports to all ASEAN countries showed upward trends, excluding Cambodia which showed irregular downward trend. Table 11 Export Value of Palm Oil (HS1511) to ASEAN Countries (2000-2012) in Thousand USD
Years Brunei Cambodia Indonesia Lao P.D.R. Myanmar Philippines Singapore Thailand Viet Nam
2000 2,376 13,891 1,066 213 37,371 17,245 99,356 14,269 27,034 2001 2,153 5,974 716 25 29,151 7,792 100,486 10,186 41,791 2002 2,687 4,371 4,758 7 40,119 10,671 148,146 10,591 35,127 2003 3,401 8,218 7,563 15 68,028 12,698 187,699 8,446 38,093 2004 2,807 6,381 11,044 527 55,970 42,336 182,040 40,571 60,627 2005 2,491 5,831 12,877 326 80,233 78,304 144,784 18,341 54,429 2006 2,748 2,476 12,423 - 59,593 83,229 178,712 9,077 111,269 2007 4,288 4,160 11,285 - 43,390 80,437 271,501 5,800 157,565 2008 5,179 4,909 21,658 42 73,063 141,417 380,499 31,209 196,027 2009 4,572 5,824 27,759 129 64,798 62,077 244,388 34,946 188,194 2010 3,693 3,527 63,720 285 162,187 175,953 383,097 39,512 311,340 2011 4,811 2,275 28,690 188 295,918 566,391 453,080 71,454 460,049 2012 3,834 2,099 10,209 94 353,079 288,674 485,870 47,847 423,395 Growth1 7% -5% 64% 298% 31% 58% 18% 59% 31% Average 4,396 3,799 27,220 148 165,406 219,158 369,739 38,461 289,428 Source: UNComtrade @ http://comtrade.un.org retrieved on 1st of April 2013. Notes:1 Growth refers to average annual growth rates; 2 Averageg refers to 2007-2012 average
Figure 11 Export Value of Palm Oil Products (HS1511) by ASEAN Countries (2000-2001) USD mn Source: UNComtrade @ http://comtrade.un.org retrieved on 1st of April 2013.
0
100,000
200,000
300,000
400,000
500,000
600,000
2002 2003 2004 2005 2006 2007 2008 2009 2010 2011 2012
Ex
po
rt V
au
es(
'00
0 U
SD
)
Brunei Darussalam Cambodia Indonesia
Lao P.D.R. Myanmar Philippines
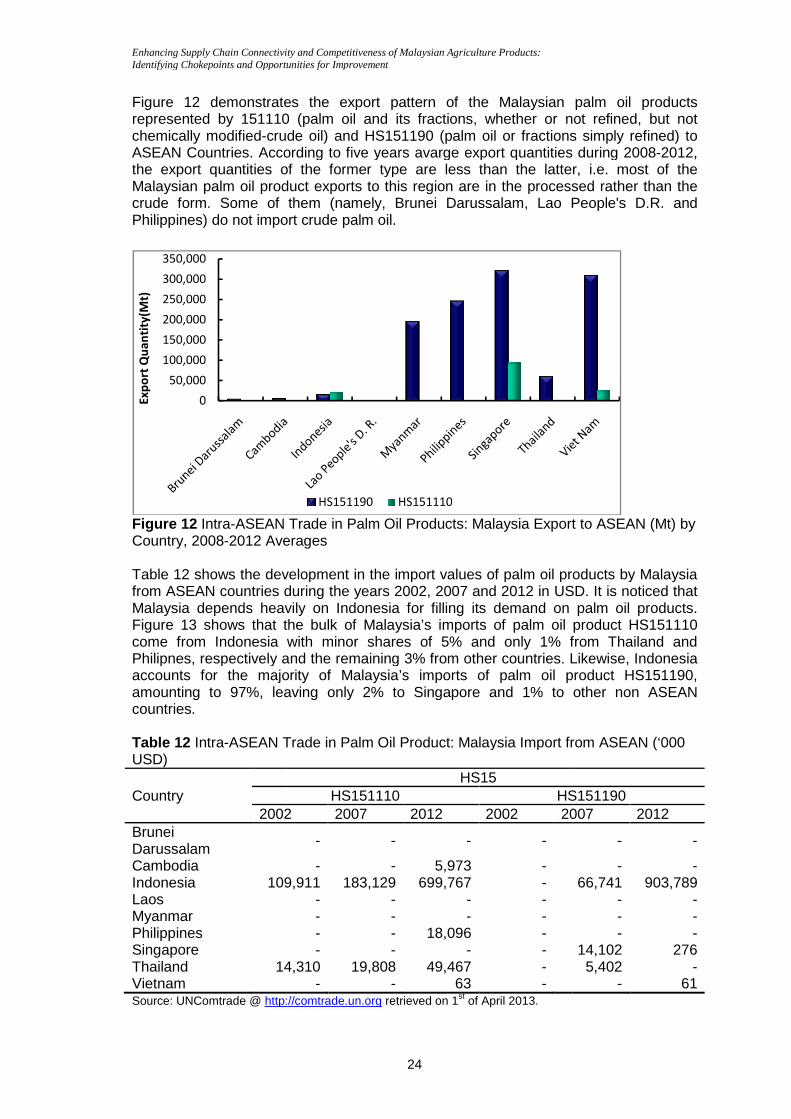
Enhancing Supply Chain Connectivity and Competitiveness of Malaysian Agriculture Products: Identifying Chokepoints and Opportunities for Improvement
Figure 12 demonstrates the export represented by 151110chemically modified-crude oil)ASEAN Countries. According to five years avarge export quantities during 2008the export quantities of the former type are less than the latter, i.e. most of the Malaysian palm oil product crude form. Some of them (namely,Philippines) do not import crude palm oil.
Figure 12 Intra-ASEAN Trade in Palm Oil Products: Malaysia Export to Country, 2008-2012 Averages Table 12 shows the development in the import values of palm oil products by Malaysia from ASEAN countries during the years 2002, 2007 and 2012 in USD. It is noticed that Malaysia depends heavily on Indonesia for fFigure 13 shows that the bulk of Malaysia’s imports of palm oil product HS151110 come from Indonesia withPhilipnes, respectively and the remainingaccounts for the majority of Malaysia’s imports of palm oil product HS151190, amounting to 97%, leaving only 2% to Singapore and 1% to other non ASEAN countries. Table 12 Intra-ASEAN Trade in Palm Oil ProdUSD)
Country 2002
Brunei Darussalam Cambodia Indonesia 109,911Laos Myanmar Philippines Singapore Thailand 14,310Vietnam Source: UNComtrade @ http://comtrade.un.org
0
50,000
100,000
150,000
200,000
250,000
300,000
350,000
Ex
po
rt Q
ua
nti
ty(M
t)
Enhancing Supply Chain Connectivity and Competitiveness of Malaysian Agriculture Products: Identifying Chokepoints and Opportunities for Improvement
24
demonstrates the export pattern of the Malaysian palm oil products 151110 (palm oil and its fractions, whether or not refined, but not
crude oil) and HS151190 (palm oil or fractions simply refined) to ASEAN Countries. According to five years avarge export quantities during 2008the export quantities of the former type are less than the latter, i.e. most of the Malaysian palm oil product exports to this region are in the processed rather than the crude form. Some of them (namely, Brunei Darussalam, Lao People's D.
) do not import crude palm oil.
ASEAN Trade in Palm Oil Products: Malaysia Export to 2012 Averages
shows the development in the import values of palm oil products by Malaysia from ASEAN countries during the years 2002, 2007 and 2012 in USD. It is noticed that Malaysia depends heavily on Indonesia for filling its demand on palm oil products.
shows that the bulk of Malaysia’s imports of palm oil product HS151110 come from Indonesia with minor shares of 5% and only 1% from Thailand and Philipnes, respectively and the remaining 3% from other countries. Likewise, Indonesia accounts for the majority of Malaysia’s imports of palm oil product HS151190, amounting to 97%, leaving only 2% to Singapore and 1% to other non ASEAN
ASEAN Trade in Palm Oil Product: Malaysia Import from ASEAN
HS15 HS151110 HS151190
2002 2007 2012 2002 2007
- - - -
- - 5,973 - 109,911 183,129 699,767 -
- - - - - - - - - - 18,096 - - - - -
14,310 19,808 49,467 - - - 63 -
http://comtrade.un.org retrieved on 1st of April 2013.
HS151190 HS151110
pattern of the Malaysian palm oil products alm oil and its fractions, whether or not refined, but not
alm oil or fractions simply refined) to ASEAN Countries. According to five years avarge export quantities during 2008-2012, the export quantities of the former type are less than the latter, i.e. most of the
n are in the processed rather than the Lao People's D.R. and
ASEAN Trade in Palm Oil Products: Malaysia Export to ASEAN (Mt) by
shows the development in the import values of palm oil products by Malaysia from ASEAN countries during the years 2002, 2007 and 2012 in USD. It is noticed that
illing its demand on palm oil products. shows that the bulk of Malaysia’s imports of palm oil product HS151110
minor shares of 5% and only 1% from Thailand and ries. Likewise, Indonesia
accounts for the majority of Malaysia’s imports of palm oil product HS151190, amounting to 97%, leaving only 2% to Singapore and 1% to other non ASEAN
uct: Malaysia Import from ASEAN (‘000
HS151190 2007 2012
- -
- - 66,741 903,789
- - - - - -
14,102 276 5,402 -
- 61
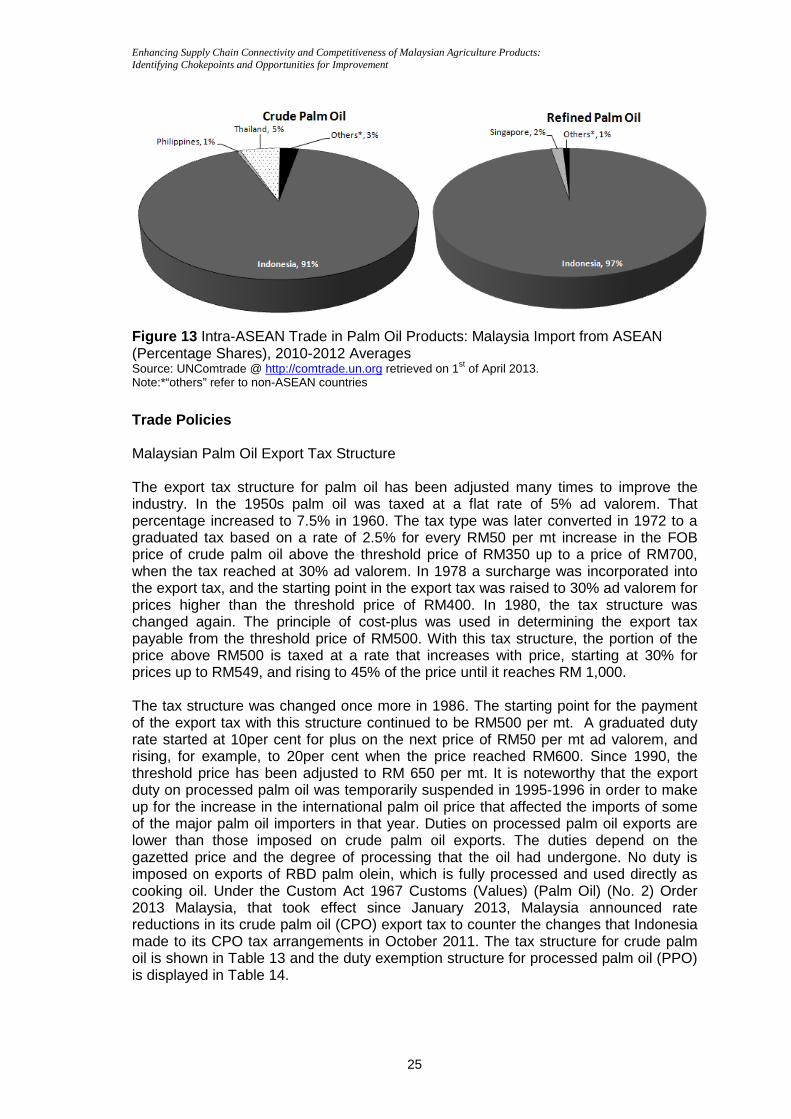
Enhancing Supply Chain Connectivity and Competitiveness of Malaysian Agriculture Products: Identifying Chokepoints and Opportunities for Improvement
25
Figure 13 Intra-ASEAN Trade in Palm Oil Products: Malaysia Import from ASEAN (Percentage Shares), 2010-2012 Averages Source: UNComtrade @ http://comtrade.un.org retrieved on 1st of April 2013. Note:*“others” refer to non-ASEAN countries
Trade Policies Malaysian Palm Oil Export Tax Structure The export tax structure for palm oil has been adjusted many times to improve the industry. In the 1950s palm oil was taxed at a flat rate of 5% ad valorem. That percentage increased to 7.5% in 1960. The tax type was later converted in 1972 to a graduated tax based on a rate of 2.5% for every RM50 per mt increase in the FOB price of crude palm oil above the threshold price of RM350 up to a price of RM700, when the tax reached at 30% ad valorem. In 1978 a surcharge was incorporated into the export tax, and the starting point in the export tax was raised to 30% ad valorem for prices higher than the threshold price of RM400. In 1980, the tax structure was changed again. The principle of cost-plus was used in determining the export tax payable from the threshold price of RM500. With this tax structure, the portion of the price above RM500 is taxed at a rate that increases with price, starting at 30% for prices up to RM549, and rising to 45% of the price until it reaches RM 1,000. The tax structure was changed once more in 1986. The starting point for the payment of the export tax with this structure continued to be RM500 per mt. A graduated duty rate started at 10per cent for plus on the next price of RM50 per mt ad valorem, and rising, for example, to 20per cent when the price reached RM600. Since 1990, the threshold price has been adjusted to RM 650 per mt. It is noteworthy that the export duty on processed palm oil was temporarily suspended in 1995-1996 in order to make up for the increase in the international palm oil price that affected the imports of some of the major palm oil importers in that year. Duties on processed palm oil exports are lower than those imposed on crude palm oil exports. The duties depend on the gazetted price and the degree of processing that the oil had undergone. No duty is imposed on exports of RBD palm olein, which is fully processed and used directly as cooking oil. Under the Custom Act 1967 Customs (Values) (Palm Oil) (No. 2) Order 2013 Malaysia, that took effect since January 2013, Malaysia announced rate reductions in its crude palm oil (CPO) export tax to counter the changes that Indonesia made to its CPO tax arrangements in October 2011. The tax structure for crude palm oil is shown in Table 13 and the duty exemption structure for processed palm oil (PPO) is displayed in Table 14.
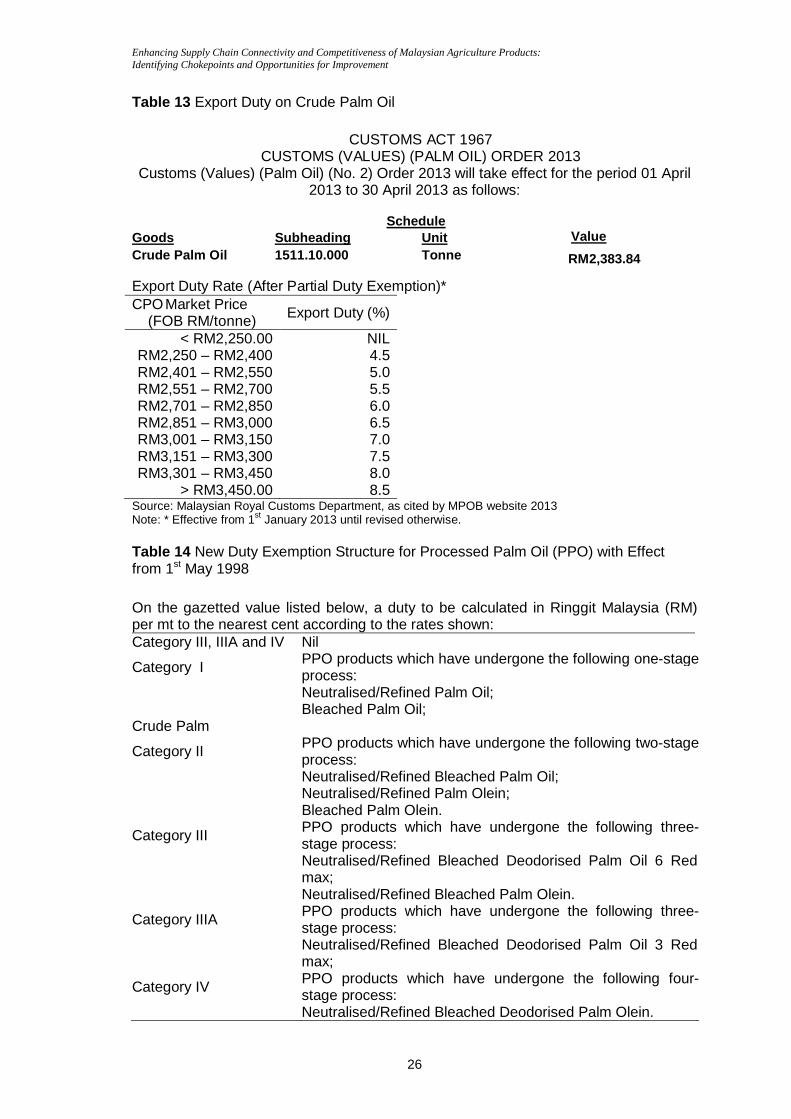
Enhancing Supply Chain Connectivity and Competitiveness of Malaysian Agriculture Products: Identifying Chokepoints and Opportunities for Improvement
26
Table 13 Export Duty on Crude Palm Oil
CUSTOMS ACT 1967 CUSTOMS (VALUES) (PALM OIL) ORDER 2013
Customs (Values) (Palm Oil) (No. 2) Order 2013 will take effect for the period 01 April 2013 to 30 April 2013 as follows:
Schedule
Goods Subheading Unit Value Crude Palm Oil 1511.10.000 Tonne RM2,383.84
Export Duty Rate (After Partial Duty Exemption)* CPO Market Price
(FOB RM/tonne) Export Duty (%)
< RM2,250.00 NIL RM2,250 – RM2,400 4.5 RM2,401 – RM2,550 5.0 RM2,551 – RM2,700 5.5 RM2,701 – RM2,850 6.0 RM2,851 – RM3,000 6.5 RM3,001 – RM3,150 7.0 RM3,151 – RM3,300 7.5 RM3,301 – RM3,450 8.0
> RM3,450.00 8.5 Source: Malaysian Royal Customs Department, as cited by MPOB website 2013 Note: * Effective from 1st January 2013 until revised otherwise. Table 14 New Duty Exemption Structure for Processed Palm Oil (PPO) with Effect from 1st May 1998
On the gazetted value listed below, a duty to be calculated in Ringgit Malaysia (RM) per mt to the nearest cent according to the rates shown: Category III, IIIA and IV Nil
Category I PPO products which have undergone the following one-stage process:
Neutralised/Refined Palm Oil;
Bleached Palm Oil;
Crude Palm
Category II PPO products which have undergone the following two-stage process:
Neutralised/Refined Bleached Palm Oil;
Neutralised/Refined Palm Olein;
Bleached Palm Olein.
Category III PPO products which have undergone the following three-stage process:
Neutralised/Refined Bleached Deodorised Palm Oil 6 Red max;
Neutralised/Refined Bleached Palm Olein.
Category IIIA PPO products which have undergone the following three-stage process:
Neutralised/Refined Bleached Deodorised Palm Oil 3 Red max;
Category IV PPO products which have undergone the following four-stage process:
Neutralised/Refined Bleached Deodorised Palm Olein.
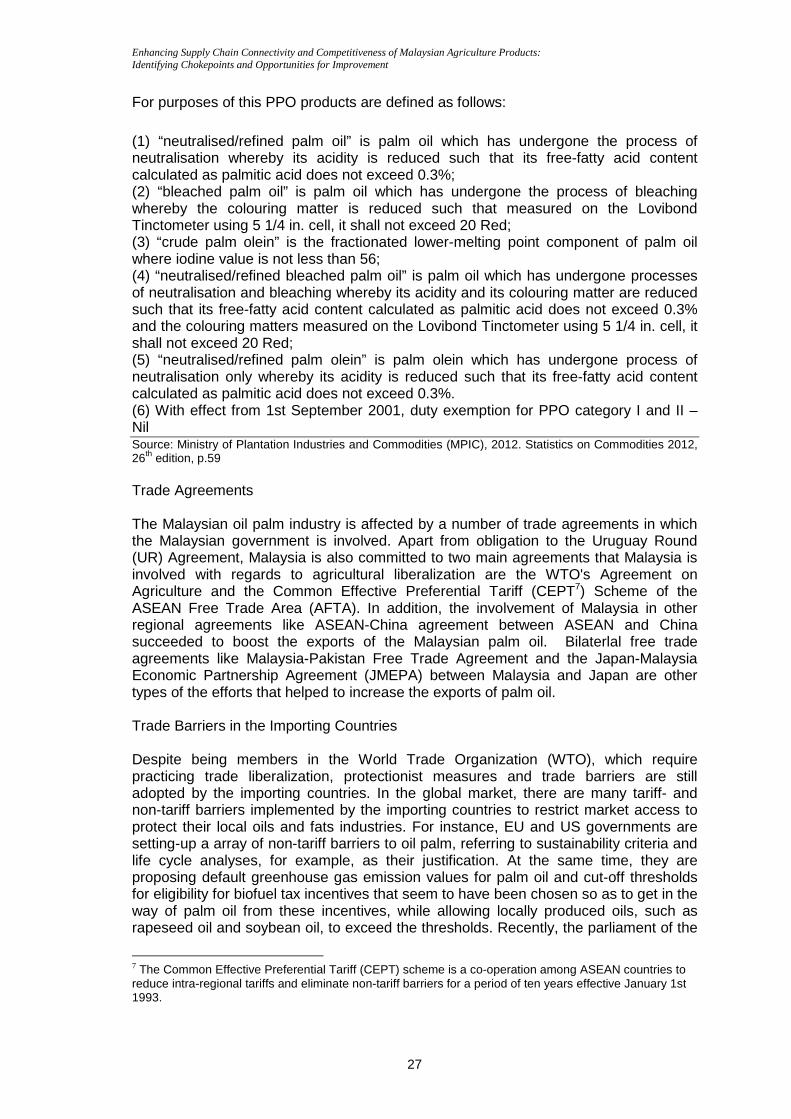
Enhancing Supply Chain Connectivity and Competitiveness of Malaysian Agriculture Products: Identifying Chokepoints and Opportunities for Improvement
27
For purposes of this PPO products are defined as follows:
(1) “neutralised/refined palm oil” is palm oil which has undergone the process of neutralisation whereby its acidity is reduced such that its free-fatty acid content calculated as palmitic acid does not exceed 0.3%; (2) “bleached palm oil” is palm oil which has undergone the process of bleaching whereby the colouring matter is reduced such that measured on the Lovibond Tinctometer using 5 1/4 in. cell, it shall not exceed 20 Red; (3) “crude palm olein” is the fractionated lower-melting point component of palm oil where iodine value is not less than 56; (4) “neutralised/refined bleached palm oil” is palm oil which has undergone processes of neutralisation and bleaching whereby its acidity and its colouring matter are reduced such that its free-fatty acid content calculated as palmitic acid does not exceed 0.3% and the colouring matters measured on the Lovibond Tinctometer using 5 1/4 in. cell, it shall not exceed 20 Red; (5) “neutralised/refined palm olein” is palm olein which has undergone process of neutralisation only whereby its acidity is reduced such that its free-fatty acid content calculated as palmitic acid does not exceed 0.3%. (6) With effect from 1st September 2001, duty exemption for PPO category I and II – Nil Source: Ministry of Plantation Industries and Commodities (MPIC), 2012. Statistics on Commodities 2012, 26th edition, p.59 Trade Agreements The Malaysian oil palm industry is affected by a number of trade agreements in which the Malaysian government is involved. Apart from obligation to the Uruguay Round (UR) Agreement, Malaysia is also committed to two main agreements that Malaysia is involved with regards to agricultural liberalization are the WTO's Agreement on Agriculture and the Common Effective Preferential Tariff (CEPT7) Scheme of the ASEAN Free Trade Area (AFTA). In addition, the involvement of Malaysia in other regional agreements like ASEAN-China agreement between ASEAN and China succeeded to boost the exports of the Malaysian palm oil. Bilaterlal free trade agreements like Malaysia-Pakistan Free Trade Agreement and the Japan-Malaysia Economic Partnership Agreement (JMEPA) between Malaysia and Japan are other types of the efforts that helped to increase the exports of palm oil. Trade Barriers in the Importing Countries Despite being members in the World Trade Organization (WTO), which require practicing trade liberalization, protectionist measures and trade barriers are still adopted by the importing countries. In the global market, there are many tariff- and non-tariff barriers implemented by the importing countries to restrict market access to protect their local oils and fats industries. For instance, EU and US governments are setting-up a array of non-tariff barriers to oil palm, referring to sustainability criteria and life cycle analyses, for example, as their justification. At the same time, they are proposing default greenhouse gas emission values for palm oil and cut-off thresholds for eligibility for biofuel tax incentives that seem to have been chosen so as to get in the way of palm oil from these incentives, while allowing locally produced oils, such as rapeseed oil and soybean oil, to exceed the thresholds. Recently, the parliament of the
7 The Common Effective Preferential Tariff (CEPT) scheme is a co-operation among ASEAN countries to reduce intra-regional tariffs and eliminate non-tariff barriers for a period of ten years effective January 1st 1993.
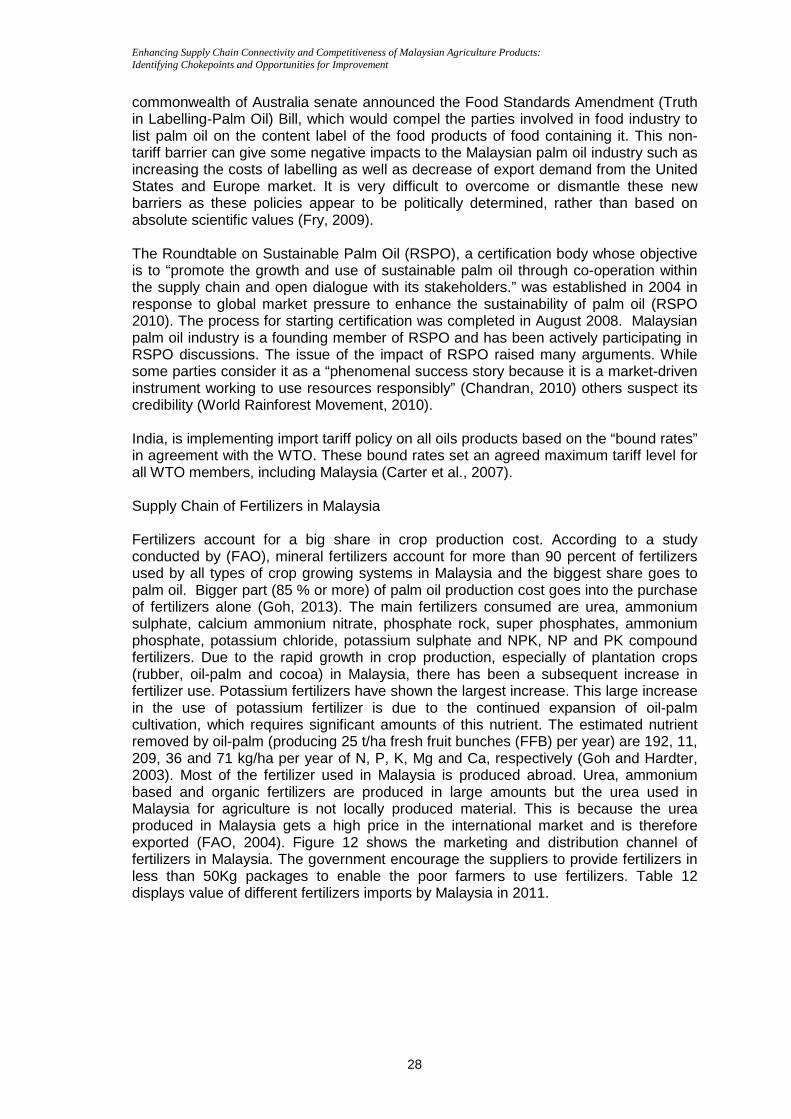
Enhancing Supply Chain Connectivity and Competitiveness of Malaysian Agriculture Products: Identifying Chokepoints and Opportunities for Improvement
28
commonwealth of Australia senate announced the Food Standards Amendment (Truth in Labelling-Palm Oil) Bill, which would compel the parties involved in food industry to list palm oil on the content label of the food products of food containing it. This non-tariff barrier can give some negative impacts to the Malaysian palm oil industry such as increasing the costs of labelling as well as decrease of export demand from the United States and Europe market. It is very difficult to overcome or dismantle these new barriers as these policies appear to be politically determined, rather than based on absolute scientific values (Fry, 2009). The Roundtable on Sustainable Palm Oil (RSPO), a certification body whose objective is to “promote the growth and use of sustainable palm oil through co-operation within the supply chain and open dialogue with its stakeholders.” was established in 2004 in response to global market pressure to enhance the sustainability of palm oil (RSPO 2010). The process for starting certification was completed in August 2008. Malaysian palm oil industry is a founding member of RSPO and has been actively participating in RSPO discussions. The issue of the impact of RSPO raised many arguments. While some parties consider it as a “phenomenal success story because it is a market-driven instrument working to use resources responsibly” (Chandran, 2010) others suspect its credibility (World Rainforest Movement, 2010). India, is implementing import tariff policy on all oils products based on the “bound rates” in agreement with the WTO. These bound rates set an agreed maximum tariff level for all WTO members, including Malaysia (Carter et al., 2007). Supply Chain of Fertilizers in Malaysia Fertilizers account for a big share in crop production cost. According to a study conducted by (FAO), mineral fertilizers account for more than 90 percent of fertilizers used by all types of crop growing systems in Malaysia and the biggest share goes to palm oil. Bigger part (85 % or more) of palm oil production cost goes into the purchase of fertilizers alone (Goh, 2013). The main fertilizers consumed are urea, ammonium sulphate, calcium ammonium nitrate, phosphate rock, super phosphates, ammonium phosphate, potassium chloride, potassium sulphate and NPK, NP and PK compound fertilizers. Due to the rapid growth in crop production, especially of plantation crops (rubber, oil-palm and cocoa) in Malaysia, there has been a subsequent increase in fertilizer use. Potassium fertilizers have shown the largest increase. This large increase in the use of potassium fertilizer is due to the continued expansion of oil-palm cultivation, which requires significant amounts of this nutrient. The estimated nutrient removed by oil-palm (producing 25 t/ha fresh fruit bunches (FFB) per year) are 192, 11, 209, 36 and 71 kg/ha per year of N, P, K, Mg and Ca, respectively (Goh and Hardter, 2003). Most of the fertilizer used in Malaysia is produced abroad. Urea, ammonium based and organic fertilizers are produced in large amounts but the urea used in Malaysia for agriculture is not locally produced material. This is because the urea produced in Malaysia gets a high price in the international market and is therefore exported (FAO, 2004). Figure 12 shows the marketing and distribution channel of fertilizers in Malaysia. The government encourage the suppliers to provide fertilizers in less than 50Kg packages to enable the poor farmers to use fertilizers. Table 12 displays value of different fertilizers imports by Malaysia in 2011.
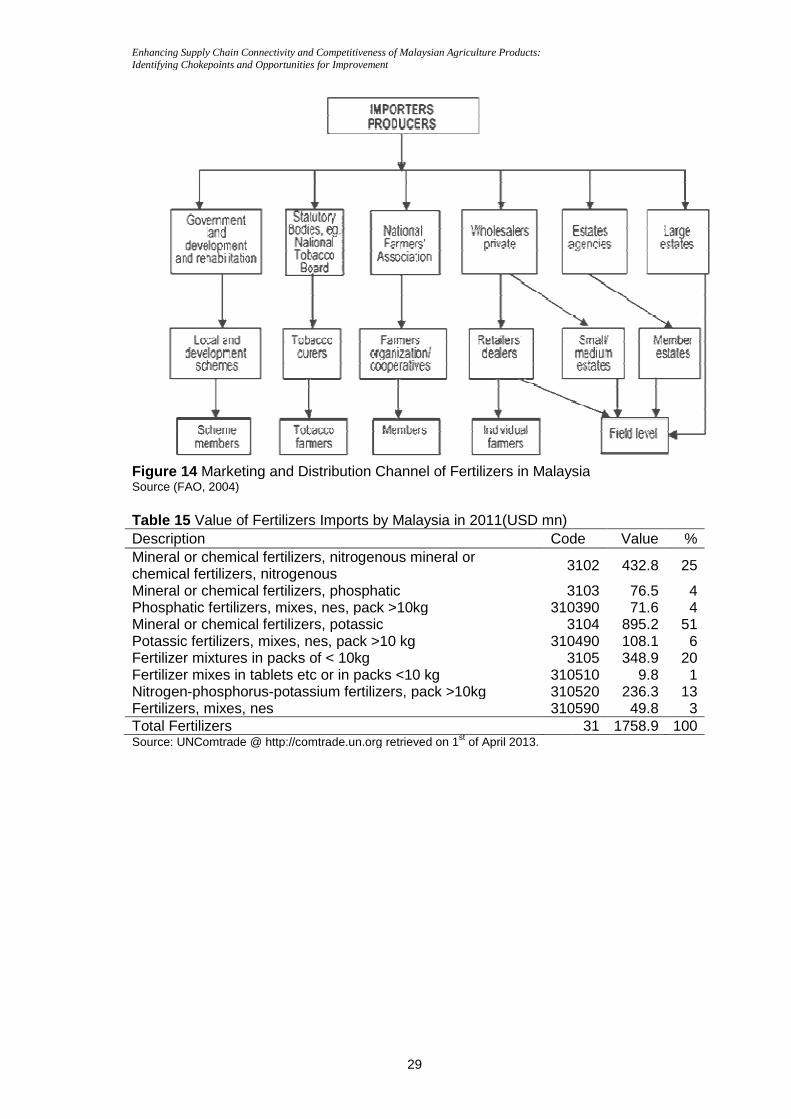
Enhancing Supply Chain Connectivity and Competitiveness of Malaysian Agriculture Products: Identifying Chokepoints and Opportunities for Improvement
Figure 14 Marketing and Distribution Source (FAO, 2004) Table 15 Value of Fertilizers Imports by Malaysia in 2011Description Mineral or chemical fertilizers, nitrogenous chemical fertilizers, nitrogenousMineral or chemical fertilizers, phosphaticPhosphatic fertilizers, mixes, nes, pack >10kgMineral or chemical fertilizers, potassicPotassic fertilizers, mixes, nes, pack >10 kgFertilizer mixtures in packs of < 10kgFertilizer mixes in tablets etc or in packs <10 kgNitrogen-phosphorus-potassium fertilizers, pack >10kgFertilizers, mixes, nes Total Fertilizers Source: UNComtrade @ http://comtrade.un.org retrieved on 1
Enhancing Supply Chain Connectivity and Competitiveness of Malaysian Agriculture Products: Identifying Chokepoints and Opportunities for Improvement
29
Marketing and Distribution Channel of Fertilizers in Malaysia
Value of Fertilizers Imports by Malaysia in 2011(USD mn) Code
Mineral or chemical fertilizers, nitrogenous mineral or nitrogenous 3102
Mineral or chemical fertilizers, phosphatic 3103Phosphatic fertilizers, mixes, nes, pack >10kg 310390Mineral or chemical fertilizers, potassic 3104Potassic fertilizers, mixes, nes, pack >10 kg 310490Fertilizer mixtures in packs of < 10kg 3105Fertilizer mixes in tablets etc or in packs <10 kg 310510
potassium fertilizers, pack >10kg 310520310590
Source: UNComtrade @ http://comtrade.un.org retrieved on 1st of April 2013.
Channel of Fertilizers in Malaysia
Code Value %
3102 432.8 25
3103 76.5 4 310390 71.6 4
3104 895.2 51 310490 108.1 6
3105 348.9 20 310510 9.8 1 310520 236.3 13 310590 49.8 3
31 1758.9 100
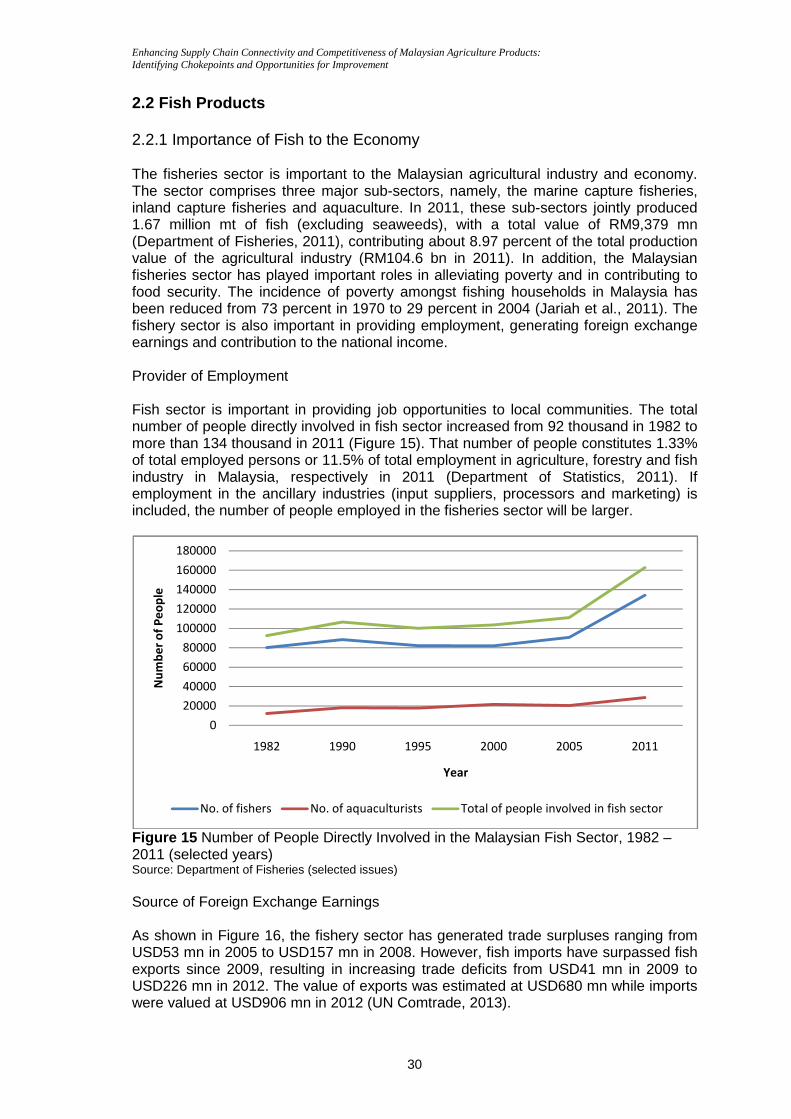
Enhancing Supply Chain Connectivity and Competitiveness of Malaysian Agriculture Products: Identifying Chokepoints and Opportunities for Improvement
30
2.2 Fish Products 2.2.1 Importance of Fish to the Economy The fisheries sector is important to the Malaysian agricultural industry and economy. The sector comprises three major sub-sectors, namely, the marine capture fisheries, inland capture fisheries and aquaculture. In 2011, these sub-sectors jointly produced 1.67 million mt of fish (excluding seaweeds), with a total value of RM9,379 mn (Department of Fisheries, 2011), contributing about 8.97 percent of the total production value of the agricultural industry (RM104.6 bn in 2011). In addition, the Malaysian fisheries sector has played important roles in alleviating poverty and in contributing to food security. The incidence of poverty amongst fishing households in Malaysia has been reduced from 73 percent in 1970 to 29 percent in 2004 (Jariah et al., 2011). The fishery sector is also important in providing employment, generating foreign exchange earnings and contribution to the national income. Provider of Employment Fish sector is important in providing job opportunities to local communities. The total number of people directly involved in fish sector increased from 92 thousand in 1982 to more than 134 thousand in 2011 (Figure 15). That number of people constitutes 1.33% of total employed persons or 11.5% of total employment in agriculture, forestry and fish industry in Malaysia, respectively in 2011 (Department of Statistics, 2011). If employment in the ancillary industries (input suppliers, processors and marketing) is included, the number of people employed in the fisheries sector will be larger.
Figure 15 Number of People Directly Involved in the Malaysian Fish Sector, 1982 – 2011 (selected years) Source: Department of Fisheries (selected issues) Source of Foreign Exchange Earnings As shown in Figure 16, the fishery sector has generated trade surpluses ranging from USD53 mn in 2005 to USD157 mn in 2008. However, fish imports have surpassed fish exports since 2009, resulting in increasing trade deficits from USD41 mn in 2009 to USD226 mn in 2012. The value of exports was estimated at USD680 mn while imports were valued at USD906 mn in 2012 (UN Comtrade, 2013).
0
20000
40000
60000
80000
100000
120000
140000
160000
180000
1982 1990 1995 2000 2005 2011
Nu
mb
er
of
Pe
op
le
Year
No. of fishers No. of aquaculturists Total of people involved in fish sector
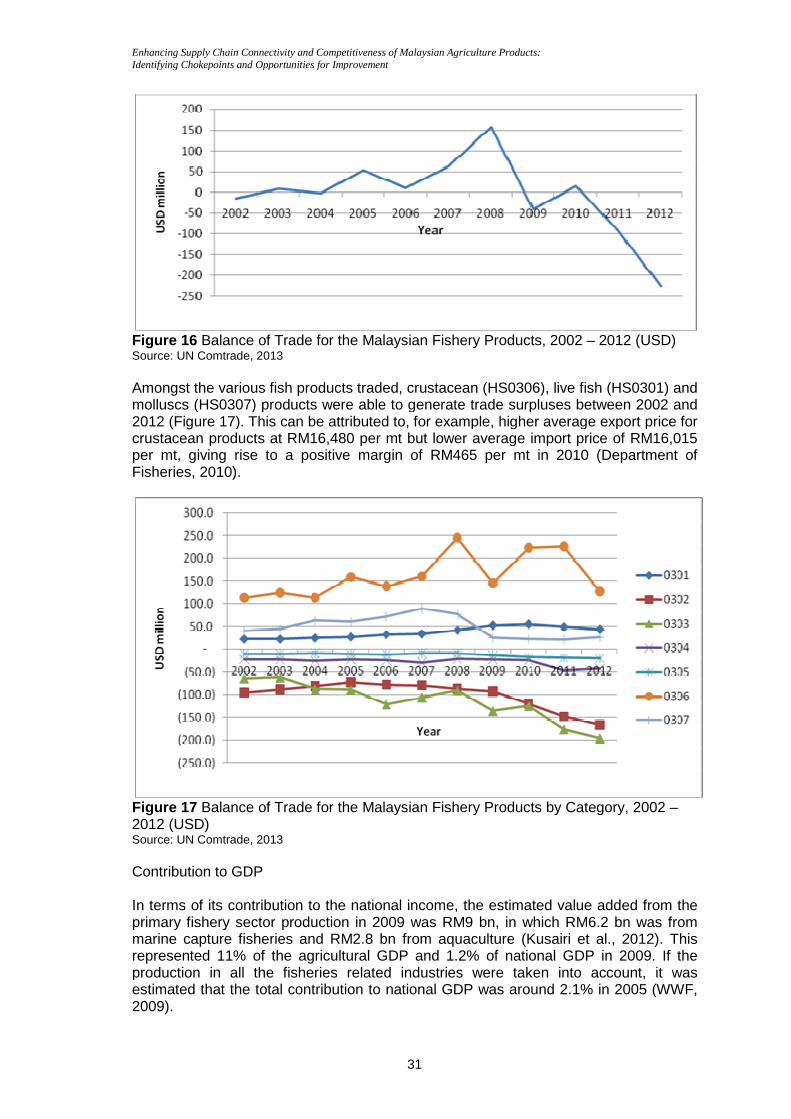
Enhancing Supply Chain Connectivity and Competitiveness of Malaysian Agriculture Products: Identifying Chokepoints and Opportunities for Improvement
Figure 16 Balance of Trade for the Malaysian Fishery Products, 2002 Source: UN Comtrade, 2013 Amongst the various fish products traded, crustacean (HS0306), live fish (HS0301) and molluscs (HS0307) products were able to generate trade surpluses between 2002 and 2012 (Figure 17). This can be attributed to, for example, higher average export price focrustacean products at RM16,480 per mt but lower average import price of RM16,015 per mt, giving rise to a positive margin of RM465 per mt in 2010 (Department of Fisheries, 2010).
Figure 17 Balance of Trade for the Malaysian F2012 (USD) Source: UN Comtrade, 2013 Contribution to GDP In terms of its contribution to the national income, the estimated value added from the primary fishery sector production in 2009 was RM9 bn, in which RM6.2 bn was from marine capture fisheries and RM2.8 bn from aquaculture (Kusairi represented 11% of the agricultural GDP and 1.2% of national GDP in 2009. If the production in all the fisheries related industries were taken into account, it was estimated that the total contribution to national GDP was around 2.1% in 2005 (WWF, 2009).
Enhancing Supply Chain Connectivity and Competitiveness of Malaysian Agriculture Products: Identifying Chokepoints and Opportunities for Improvement
31
Balance of Trade for the Malaysian Fishery Products, 2002
Amongst the various fish products traded, crustacean (HS0306), live fish (HS0301) and molluscs (HS0307) products were able to generate trade surpluses between 2002 and
). This can be attributed to, for example, higher average export price focrustacean products at RM16,480 per mt but lower average import price of RM16,015 per mt, giving rise to a positive margin of RM465 per mt in 2010 (Department of
Balance of Trade for the Malaysian Fishery Products by Category, 2002
In terms of its contribution to the national income, the estimated value added from the primary fishery sector production in 2009 was RM9 bn, in which RM6.2 bn was from marine capture fisheries and RM2.8 bn from aquaculture (Kusairi
resented 11% of the agricultural GDP and 1.2% of national GDP in 2009. If the production in all the fisheries related industries were taken into account, it was estimated that the total contribution to national GDP was around 2.1% in 2005 (WWF,
Balance of Trade for the Malaysian Fishery Products, 2002 – 2012 (USD)
Amongst the various fish products traded, crustacean (HS0306), live fish (HS0301) and molluscs (HS0307) products were able to generate trade surpluses between 2002 and
). This can be attributed to, for example, higher average export price for crustacean products at RM16,480 per mt but lower average import price of RM16,015 per mt, giving rise to a positive margin of RM465 per mt in 2010 (Department of
ishery Products by Category, 2002 –
In terms of its contribution to the national income, the estimated value added from the primary fishery sector production in 2009 was RM9 bn, in which RM6.2 bn was from marine capture fisheries and RM2.8 bn from aquaculture (Kusairi et al., 2012). This
resented 11% of the agricultural GDP and 1.2% of national GDP in 2009. If the production in all the fisheries related industries were taken into account, it was estimated that the total contribution to national GDP was around 2.1% in 2005 (WWF,
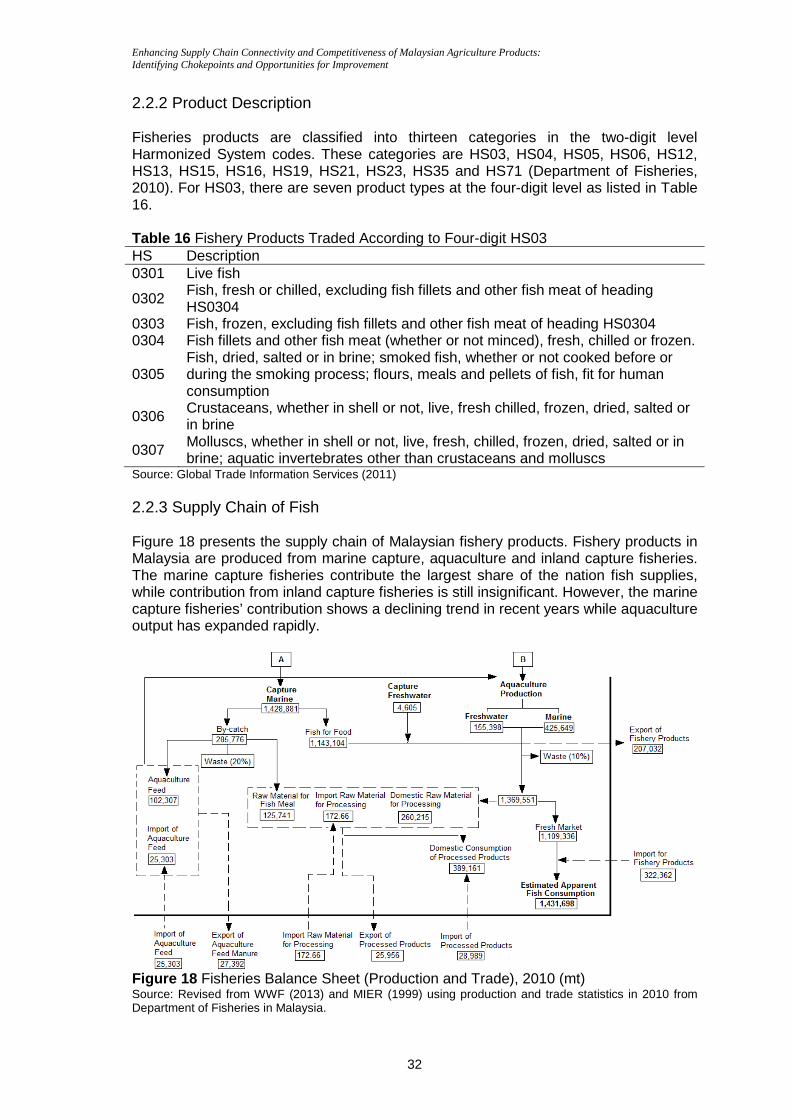
Enhancing Supply Chain Connectivity and Competitiveness of Malaysian Agriculture Products: Identifying Chokepoints and Opportunities for Improvement
32
2.2.2 Product Description Fisheries products are classified into thirteen categories in the two-digit level Harmonized System codes. These categories are HS03, HS04, HS05, HS06, HS12, HS13, HS15, HS16, HS19, HS21, HS23, HS35 and HS71 (Department of Fisheries, 2010). For HS03, there are seven product types at the four-digit level as listed in Table 16. Table 16 Fishery Products Traded According to Four-digit HS03 HS Description 0301 Live fish
0302 Fish, fresh or chilled, excluding fish fillets and other fish meat of heading HS0304
0303 Fish, frozen, excluding fish fillets and other fish meat of heading HS0304 0304 Fish fillets and other fish meat (whether or not minced), fresh, chilled or frozen.
0305 Fish, dried, salted or in brine; smoked fish, whether or not cooked before or during the smoking process; flours, meals and pellets of fish, fit for human consumption
0306 Crustaceans, whether in shell or not, live, fresh chilled, frozen, dried, salted or in brine
0307 Molluscs, whether in shell or not, live, fresh, chilled, frozen, dried, salted or in brine; aquatic invertebrates other than crustaceans and molluscs
Source: Global Trade Information Services (2011) 2.2.3 Supply Chain of Fish Figure 18 presents the supply chain of Malaysian fishery products. Fishery products in Malaysia are produced from marine capture, aquaculture and inland capture fisheries. The marine capture fisheries contribute the largest share of the nation fish supplies, while contribution from inland capture fisheries is still insignificant. However, the marine capture fisheries’ contribution shows a declining trend in recent years while aquaculture output has expanded rapidly.
Figure 18 Fisheries Balance Sheet (Production and Trade), 2010 (mt) Source: Revised from WWF (2013) and MIER (1999) using production and trade statistics in 2010 from Department of Fisheries in Malaysia.
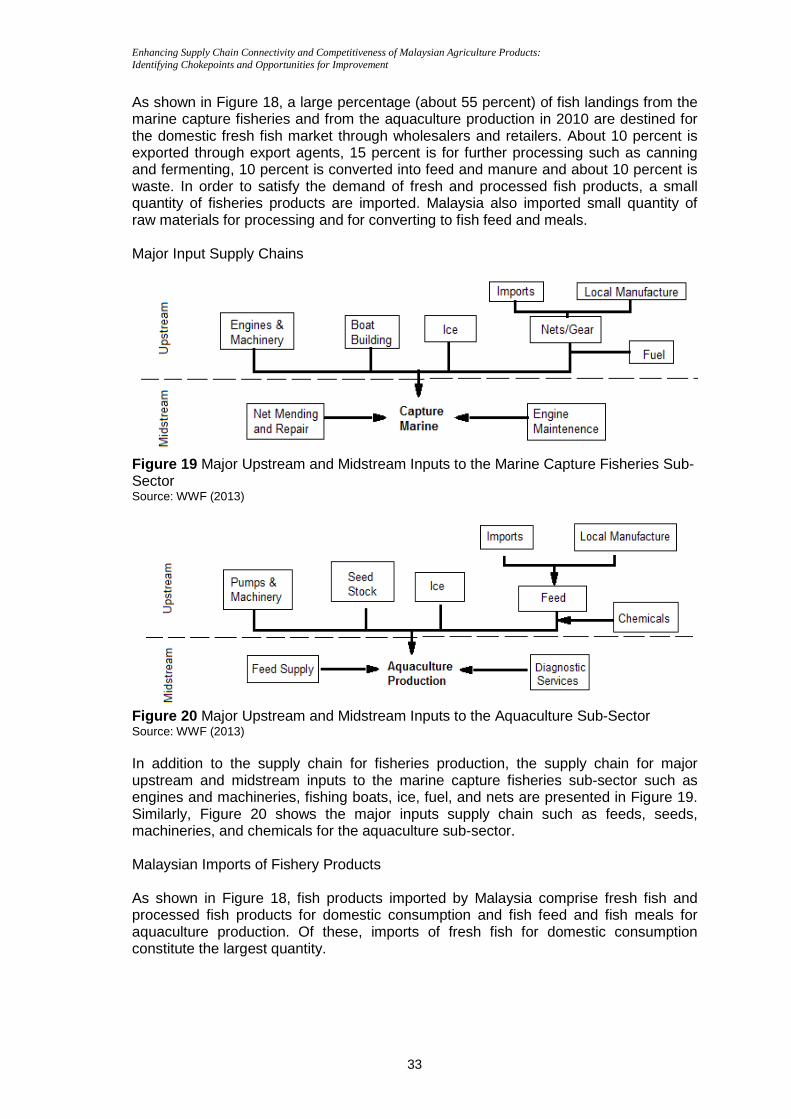
Enhancing Supply Chain Connectivity and Competitiveness of Malaysian Agriculture Products: Identifying Chokepoints and Opportunities for Improvement
33
As shown in Figure 18, a large percentage (about 55 percent) of fish landings from the marine capture fisheries and from the aquaculture production in 2010 are destined for the domestic fresh fish market through wholesalers and retailers. About 10 percent is exported through export agents, 15 percent is for further processing such as canning and fermenting, 10 percent is converted into feed and manure and about 10 percent is waste. In order to satisfy the demand of fresh and processed fish products, a small quantity of fisheries products are imported. Malaysia also imported small quantity of raw materials for processing and for converting to fish feed and meals. Major Input Supply Chains
Figure 19 Major Upstream and Midstream Inputs to the Marine Capture Fisheries Sub-Sector Source: WWF (2013)
Figure 20 Major Upstream and Midstream Inputs to the Aquaculture Sub-Sector Source: WWF (2013) In addition to the supply chain for fisheries production, the supply chain for major upstream and midstream inputs to the marine capture fisheries sub-sector such as engines and machineries, fishing boats, ice, fuel, and nets are presented in Figure 19. Similarly, Figure 20 shows the major inputs supply chain such as feeds, seeds, machineries, and chemicals for the aquaculture sub-sector. Malaysian Imports of Fishery Products As shown in Figure 18, fish products imported by Malaysia comprise fresh fish and processed fish products for domestic consumption and fish feed and fish meals for aquaculture production. Of these, imports of fresh fish for domestic consumption constitute the largest quantity.
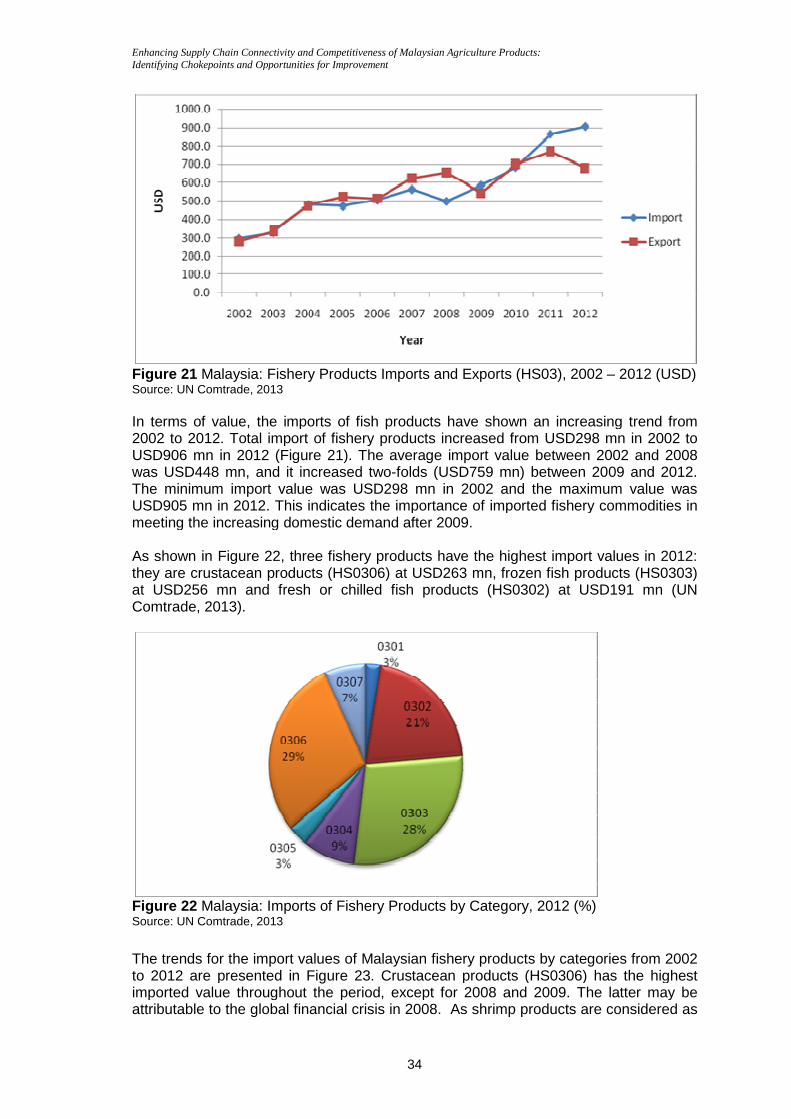
Enhancing Supply Chain Connectivity and Competitiveness of Malaysian Agriculture Products: Identifying Chokepoints and Opportunities for Improvement
Figure 21 Malaysia: Fishery Source: UN Comtrade, 2013 In terms of value, the imports of 2002 to 2012. Total import of fishery prUSD906 mn in 2012 (Figure was USD448 mn, and itThe minimum import value was USD298 mnUSD905 mn in 2012. This indicates tmeeting the increasing domestic demand after 2009. As shown in Figure 22, they are crustacean proat USD256 mn and fresh or chilled fiComtrade, 2013).
Figure 22 Malaysia: Imports of Fishery Products by Category, 2012 (%)Source: UN Comtrade, 2013
The trends for the import values of Malaysian fishery products by categories from 2002 to 2012 are presented in imported value throughout the period, except for 2008 and 2009. The latter may be attributable to the global financial crisis in 2008. As shrimp products are considered as
Enhancing Supply Chain Connectivity and Competitiveness of Malaysian Agriculture Products: Identifying Chokepoints and Opportunities for Improvement
34
Malaysia: Fishery Products Imports and Exports (HS03), 2002
, the imports of fish products have shown an increasing . Total import of fishery products increased from USD298 mn in 2002 to in 2012 (Figure 21). The average import value between 2002 and 2008
it increased two-folds (USD759 mn) between 2009 and 2012. imum import value was USD298 mn in 2002 and the max
This indicates the importance of imported fishery commodities in meeting the increasing domestic demand after 2009.
, three fishery products have the highest import valuesare crustacean products (HS0306) at USD263 mn, frozen fish
and fresh or chilled fish products (HS0302) at USD191 mn
alaysia: Imports of Fishery Products by Category, 2012 (%)
The trends for the import values of Malaysian fishery products by categories from 2002 to 2012 are presented in Figure 23. Crustacean products (HS0306) has the highest imported value throughout the period, except for 2008 and 2009. The latter may be
ibutable to the global financial crisis in 2008. As shrimp products are considered as
Products Imports and Exports (HS03), 2002 – 2012 (USD)
increasing trend from oducts increased from USD298 mn in 2002 to
ween 2002 and 2008 ) between 2009 and 2012.
in 2002 and the maximum value was he importance of imported fishery commodities in
the highest import values in 2012: sh products (HS0303)
sh products (HS0302) at USD191 mn (UN
alaysia: Imports of Fishery Products by Category, 2012 (%)
The trends for the import values of Malaysian fishery products by categories from 2002 . Crustacean products (HS0306) has the highest
imported value throughout the period, except for 2008 and 2009. The latter may be ibutable to the global financial crisis in 2008. As shrimp products are considered as
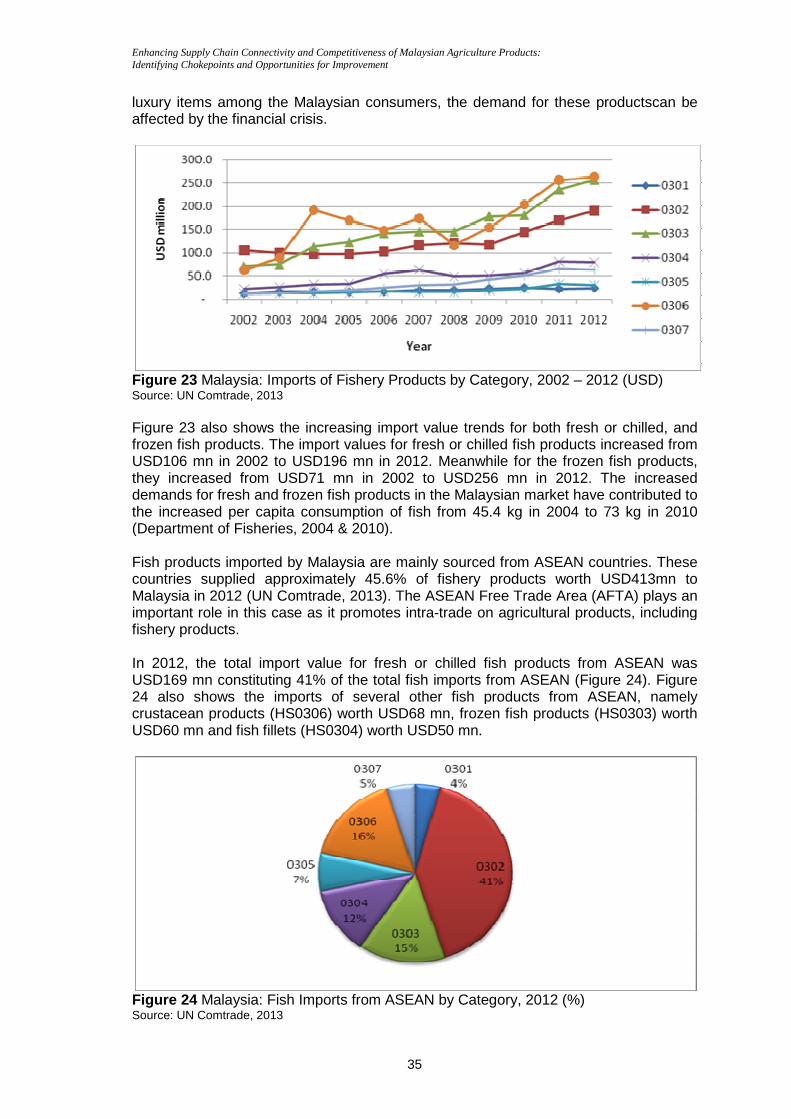
Enhancing Supply Chain Connectivity and Competitiveness of Malaysian Agriculture Products: Identifying Chokepoints and Opportunities for Improvement
luxury items among the Malaysian consumers, the demand for these productscan be affected by the financial crisis.
Figure 23 Malaysia: ImportsSource: UN Comtrade, 2013 Figure 23 also shows the frozen fish products. The import valuUSD106 mn in 2002 to USD196 mn in 2012. Meanwhile for the frozen fish products, they increased from USD71 mn in 2002 to USD256 mndemands for fresh and frozen fish products in the Malaysian market hathe increased per capita consumption of fish from 45.4 kg in 2004 to 73 kg in 2010 (Department of Fisheries, 2004 & 2010). Fish products imported by Malaysia are mainly sourced from countries supplied approximately Malaysia in 2012 (UN Comtrade, 2013). important role in this case as itfishery products. In 2012, the total import value for fresh or chilled USD169 mn constituting24 also shows the imports of crustacean products (HS0306) worth USD68 mnUSD60 mn and fish fillet
Figure 24 Malaysia: Fish Imports from ASEAN by Category, 2012 (%)Source: UN Comtrade, 2013
Enhancing Supply Chain Connectivity and Competitiveness of Malaysian Agriculture Products: Identifying Chokepoints and Opportunities for Improvement
35
luxury items among the Malaysian consumers, the demand for these productscan be affected by the financial crisis.
Imports of Fishery Products by Category, 2002
also shows the increasing import value trends for both fresh. The import values for fresh or chilled fish products increased from
USD106 mn in 2002 to USD196 mn in 2012. Meanwhile for the frozen fish products, they increased from USD71 mn in 2002 to USD256 mn in 2012
for fresh and frozen fish products in the Malaysian market har capita consumption of fish from 45.4 kg in 2004 to 73 kg in 2010
(Department of Fisheries, 2004 & 2010).
Fish products imported by Malaysia are mainly sourced from ASEAN approximately 45.6% of fishery products worth U
Malaysia in 2012 (UN Comtrade, 2013). The ASEAN Free Trade Areaimportant role in this case as it promotes intra-trade on agricultural products, including
import value for fresh or chilled fish products from ASEANconstituting 41% of the total fish imports from ASEAN
the imports of several other fish products from ASEAN, products (HS0306) worth USD68 mn, frozen fish products and fish fillets (HS0304) worth USD50 mn.
Malaysia: Fish Imports from ASEAN by Category, 2012 (%)
luxury items among the Malaysian consumers, the demand for these productscan be
of Fishery Products by Category, 2002 – 2012 (USD)
trends for both fresh or chilled, and es for fresh or chilled fish products increased from
USD106 mn in 2002 to USD196 mn in 2012. Meanwhile for the frozen fish products, in 2012. The increased
for fresh and frozen fish products in the Malaysian market have contributed to r capita consumption of fish from 45.4 kg in 2004 to 73 kg in 2010
ASEAN countries. These 45.6% of fishery products worth USD413mn to
rea (AFTA) plays an trade on agricultural products, including
fish products from ASEAN was (Figure 24). Figure
products from ASEAN, namely , frozen fish products (HS0303) worth
Malaysia: Fish Imports from ASEAN by Category, 2012 (%)
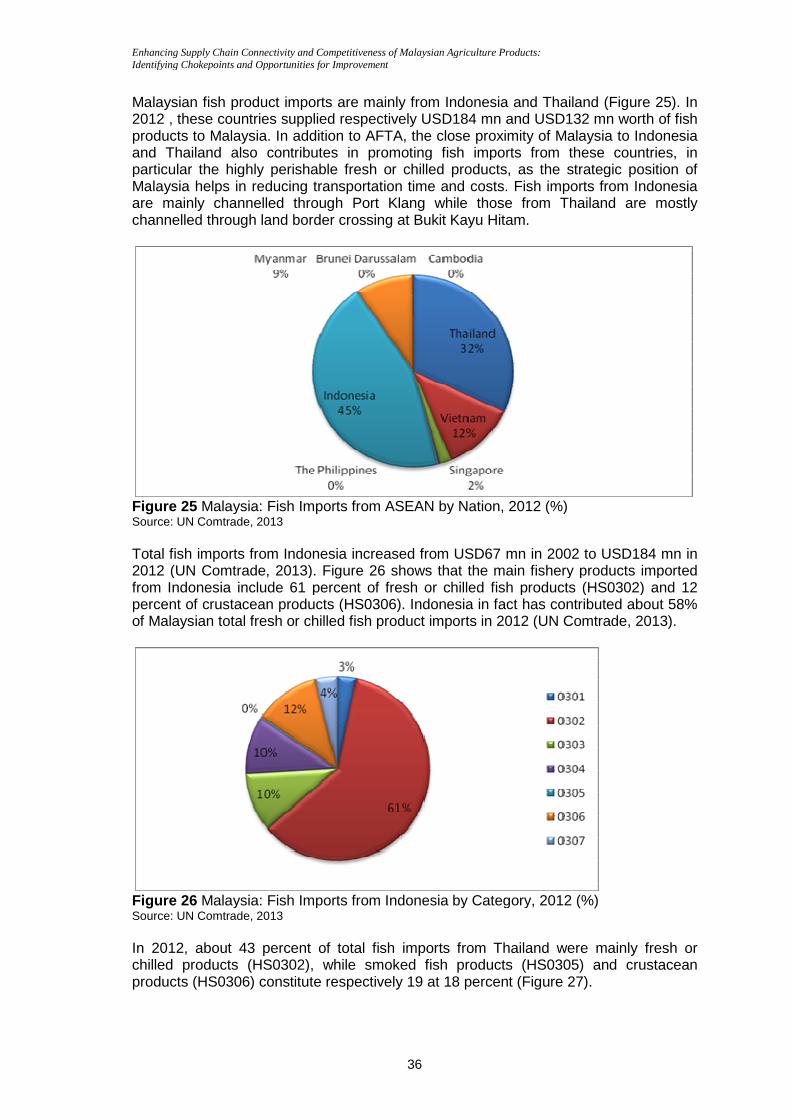
Enhancing Supply Chain Connectivity and Competitiveness of Malaysian Agriculture Products: Identifying Chokepoints and Opportunities for Improvement
Malaysian fish product imports are mainly from Indonesia and Thailand 2012 , these countries supplied respectively USD184 mn and USD132 mn worth of fish products to Malaysia. In addition to AFTAand Thailand also contributes inparticular the highly perishable Malaysia helps in reducare mainly channelled through Port Klang while those from Thailand archannelled through land border crossing at
Figure 25 Malaysia: Fish Imports from ASEAN by Nation, 2012 (%)Source: UN Comtrade, 2013 Total fish imports from Indonesia increased from USD67 mn in 2002 to USD184 mn in 2012 (UN Comtrade, 2013). from Indonesia include 61 percent of fresh or chilled fish products (HS0302) and 12 percent of crustacean products (HS0306). Indonesia in fact has contributed about 58% of Malaysian total fresh or chilled fish product imports in 2012 (UN Comtrade, 2013).
Figure 26 Malaysia: Fish Imports from Indonesia by Category, 2012Source: UN Comtrade, 2013 In 2012, about 43 percent of total fish imports chilled products (HS0302products (HS0306) constitute respectively 19
Enhancing Supply Chain Connectivity and Competitiveness of Malaysian Agriculture Products: Identifying Chokepoints and Opportunities for Improvement
36
Malaysian fish product imports are mainly from Indonesia and Thailand 2012 , these countries supplied respectively USD184 mn and USD132 mn worth of fish products to Malaysia. In addition to AFTA, the close proximity of Malaysia
also contributes in promoting fish imports from these coparticular the highly perishable fresh or chilled products, as the strategic
reducing transportation time and costs. Fish imports from Indonesia are mainly channelled through Port Klang while those from Thailand archannelled through land border crossing at Bukit Kayu Hitam.
Malaysia: Fish Imports from ASEAN by Nation, 2012 (%)
Total fish imports from Indonesia increased from USD67 mn in 2002 to USD184 mn in 2012 (UN Comtrade, 2013). Figure 26 shows that the main fishery products imported from Indonesia include 61 percent of fresh or chilled fish products (HS0302) and 12
of crustacean products (HS0306). Indonesia in fact has contributed about 58% of Malaysian total fresh or chilled fish product imports in 2012 (UN Comtrade, 2013).
Malaysia: Fish Imports from Indonesia by Category, 2012
In 2012, about 43 percent of total fish imports from Thailand were mainly fresh or HS0302), while smoked fish products (HS0305) constitute respectively 19 at 18 percent (Figure 27
Malaysian fish product imports are mainly from Indonesia and Thailand (Figure 25). In 2012 , these countries supplied respectively USD184 mn and USD132 mn worth of fish
of Malaysia to Indonesia ing fish imports from these countries, in
strategic position of mports from Indonesia
are mainly channelled through Port Klang while those from Thailand are mostly
Total fish imports from Indonesia increased from USD67 mn in 2002 to USD184 mn in shows that the main fishery products imported
from Indonesia include 61 percent of fresh or chilled fish products (HS0302) and 12 of crustacean products (HS0306). Indonesia in fact has contributed about 58%
of Malaysian total fresh or chilled fish product imports in 2012 (UN Comtrade, 2013).
(%)
from Thailand were mainly fresh or HS0305) and crustacean
percent (Figure 27).
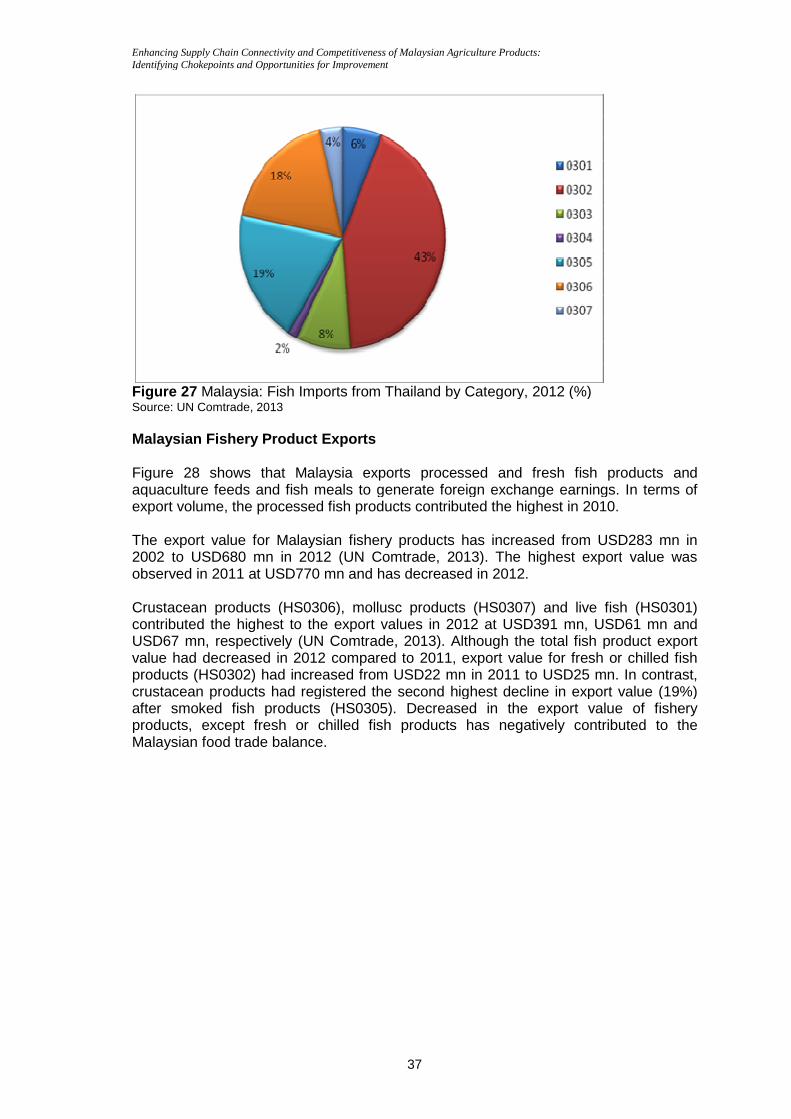
Enhancing Supply Chain Connectivity and Competitiveness of Malaysian Agriculture Products: Identifying Chokepoints and Opportunities for Improvement
Figure 27 Malaysia: Fish Imports from Thailand by Category, 2012 (%)Source: UN Comtrade, 2013 Malaysian Fishery Product Exports Figure 28 shows that Malaysia aquaculture feeds and fish mealsexport volume, the processed The export value for Malaysian fishery produc2002 to USD680 mn in 2012 (UN Comtrade, 2013). The highest exportobserved in 2011 at USD770 mn Crustacean products (HS0306), contributed the highest to the export values inUSD67 mn, respectivelyvalue had decreased in 2012products (HS0302) had crustacean products had registered the second highest decline in export value (19%) after smoked fish products (HS0305)products, except fresh or chilled fish products has negatively contriMalaysian food trade balance.
Enhancing Supply Chain Connectivity and Competitiveness of Malaysian Agriculture Products: Identifying Chokepoints and Opportunities for Improvement
37
Malaysia: Fish Imports from Thailand by Category, 2012 (%)
Malaysian Fishery Product Exports
that Malaysia exports processed and fresh fish products andaquaculture feeds and fish meals to generate foreign exchange earnings.
rocessed fish products contributed the highest in 2010.
xport value for Malaysian fishery products has increased from USD283 mn in in 2012 (UN Comtrade, 2013). The highest export
observed in 2011 at USD770 mn and has decreased in 2012.
an products (HS0306), mollusc products (HS0307) and live fcontributed the highest to the export values in 2012 at USD391 mn, USD61 mn and USD67 mn, respectively (UN Comtrade, 2013). Although the total
in 2012 compared to 2011, export value for fresh or chilled fish increased from USD22 mn in 2011 to USD25 mn
had registered the second highest decline in export value (19%) after smoked fish products (HS0305). Decreased in the export value of products, except fresh or chilled fish products has negatively contriMalaysian food trade balance.
Malaysia: Fish Imports from Thailand by Category, 2012 (%)
exports processed and fresh fish products and to generate foreign exchange earnings. In terms of
contributed the highest in 2010.
ts has increased from USD283 mn in in 2012 (UN Comtrade, 2013). The highest export value was
and live fish (HS0301) 2012 at USD391 mn, USD61 mn and
(UN Comtrade, 2013). Although the total fish product export , export value for fresh or chilled fish
o USD25 mn. In contrast, had registered the second highest decline in export value (19%)
reased in the export value of fishery products, except fresh or chilled fish products has negatively contributed to the
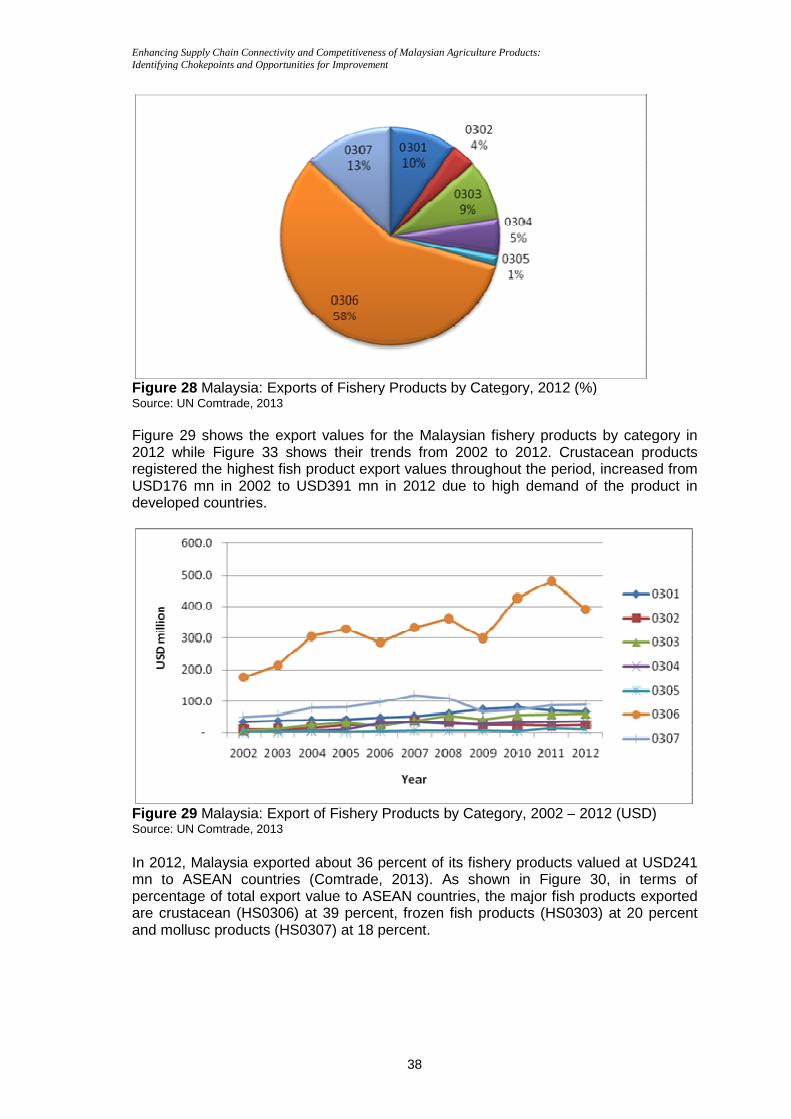
Enhancing Supply Chain Connectivity and Competitiveness of Malaysian Agriculture Products: Identifying Chokepoints and Opportunities for Improvement
Figure 28 Malaysia: Exports of Fishery Products by Category, 2012 (%)Source: UN Comtrade, 2013 Figure 29 shows the export values for the Malaysian fishery products by category2012 while Figure 33 shows their trends from 2002 to 2012registered the highest fish product USD176 mn in 2002 to USD391 mndeveloped countries.
Figure 29 Malaysia: Export of Fishery Products by Category, 2002 Source: UN Comtrade, 2013 In 2012, Malaysia exported mn to ASEAN countries (Comtrade, 2013)percentage of total export value to ASEAN countries, tare crustacean (HS0306and mollusc products (H
Enhancing Supply Chain Connectivity and Competitiveness of Malaysian Agriculture Products: Identifying Chokepoints and Opportunities for Improvement
38
Exports of Fishery Products by Category, 2012 (%)
shows the export values for the Malaysian fishery products by categoryshows their trends from 2002 to 2012. Crustacean products
highest fish product export values throughout the periodUSD176 mn in 2002 to USD391 mn in 2012 due to high demand
Malaysia: Export of Fishery Products by Category, 2002 –
Malaysia exported about 36 percent of its fishery products valued atcountries (Comtrade, 2013). As shown in Figure 3
percentage of total export value to ASEAN countries, the major fish HS0306) at 39 percent, frozen fish products (HS0303) at 20 percent
HS0307) at 18 percent.
Exports of Fishery Products by Category, 2012 (%)
shows the export values for the Malaysian fishery products by category in . Crustacean products
throughout the period, increased from due to high demand of the product in
– 2012 (USD)
products valued at USD241 As shown in Figure 30, in terms of
fish products exported oducts (HS0303) at 20 percent
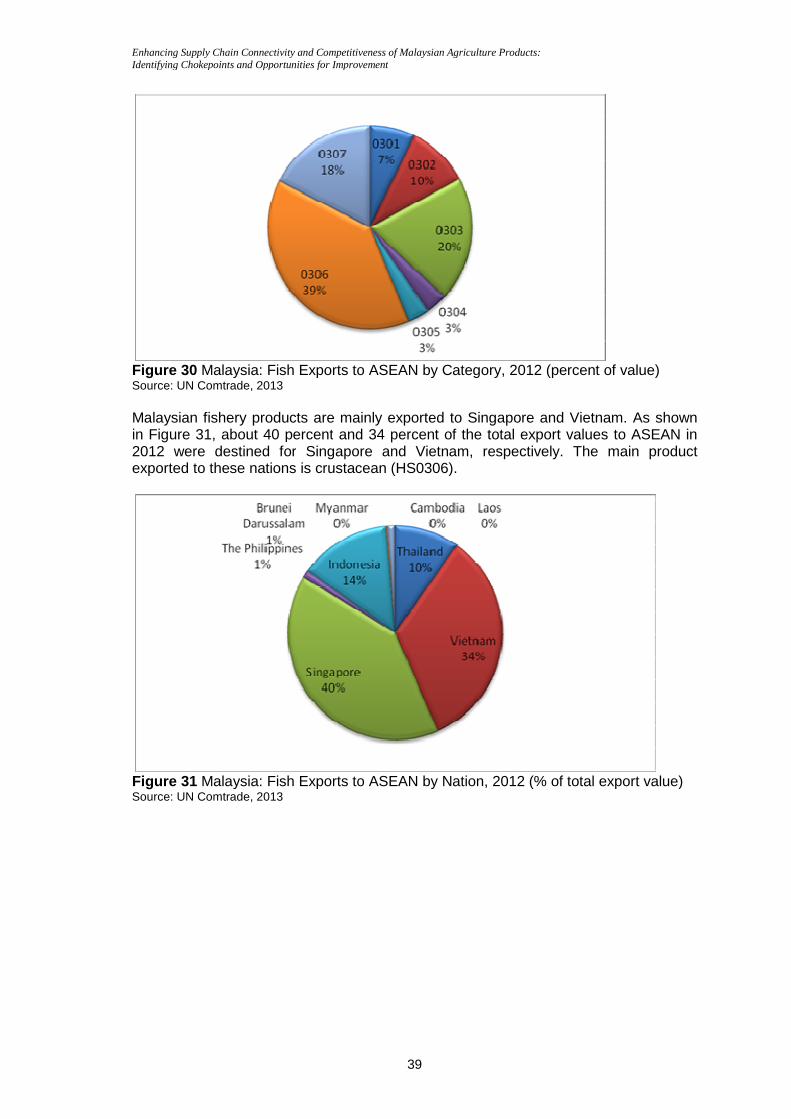
Enhancing Supply Chain Connectivity and Competitiveness of Malaysian Agriculture Products: Identifying Chokepoints and Opportunities for Improvement
Figure 30 Malaysia: Fish Exports to ASEAN by Category, 2012 (percent of value)Source: UN Comtrade, 2013 Malaysian fishery products in Figure 31, about 40 percent2012 were destined forexported to these nations is crustacean
Figure 31 Malaysia: Fish Source: UN Comtrade, 2013
Enhancing Supply Chain Connectivity and Competitiveness of Malaysian Agriculture Products: Identifying Chokepoints and Opportunities for Improvement
39
Malaysia: Fish Exports to ASEAN by Category, 2012 (percent of value)
Malaysian fishery products are mainly exported to Singapore and Vietnam. percent and 34 percent of the total export values
destined for Singapore and Vietnam, respectively. The main exported to these nations is crustacean (HS0306).
Malaysia: Fish Exports to ASEAN by Nation, 2012 (% of total export value)
Malaysia: Fish Exports to ASEAN by Category, 2012 (percent of value)
Singapore and Vietnam. As shown values to ASEAN in
. The main product
Exports to ASEAN by Nation, 2012 (% of total export value)
Enhancing Supply Chain Connectivity and Competitiveness of Malaysian Agriculture Products: Identifying Chokepoints and Opportunities for Improvement
40
3. Chokepoints in the Supply Chain This section addresses chokepoints in the supply chains of both palm oil and fish products. Basically, the chokepoints were identified based on interview sessions (using the eight questionnaires prepared by ERIA) that have been conducted with various agencies8, from February to May 2013. Since the sampling is not a probabilistic one, the study focuses on insightful information that are considered significant in contributing the chokepoints. Chokepoint is defined as a point that delays the processes along the whole supply chain of palm oil and fish products (Syslo et al., 2011). From export point of view, the chokepoints are traced and identified along the supply chain from the farm level until the products reached the importers. On the other hand, as for import processes, the chokepoints are traced from port to the consumers.
Throughout this section, the discussion on the chokepoints are drawn based on six major categories which are the quality of infrastructure and cold chain, internal transport and logistics, import or export clearance, certification and permit processes, transparency and awareness of regulations and non-tariff measures. However, only related chokepoints are discussed for each commodity. The important chokepoints in the supply chain of palm oil products are discussed in Section 3.1 while Section 3.2 elaborates the identified chokepoints in the supply chain of fish products. 3.1 Palm Oil In the case of the supply chain of palm oil in Malaysia, the movement of palm oil products from producer to the port is relatively efficient. The relevant areas of chokepoints for this commodity are; the quality of infrastructure, internal transport and logistics, import or export clearance, certification and permit processes and transparency and awareness of regulations. 3.1.1 The Quality of Infrastructure The problems of infrastructure in the palm oil industry can be summarised as follows: (i) Limited capacities of most authorized laboratories; (ii) Distant location of accredited laboratories; (iii) Limited number of refinery mills and bulking installations in some production
areas; (iv) Congestion at the ports during peak periods; (v) Lack of depth of the ports; (vi) Poor maintenance of facilities at the port; and (vii) Poor infrastructural supports. A number of importers demand health certification to ensure that the palm oil export products are safe for human consumption. Among the countries mentioned are; China, India and Vietnam. This requirement must be met through product testing at the laboratories at the Department of Chemistry, Malaysia which involve processes such as collection and testing of the specimens. Three respondents from MAQIS mention that generally there are limited certified laboratories available which is considered as the major impediment towards effective government regulation. They also cite that there is a poor understanding of the regulation among the private sector companies.
8 The list of agencies interviewed is provided in Appendix 2.
Enhancing Supply Chain Connectivity and Competitiveness of Malaysian Agriculture Products: Identifying Chokepoints and Opportunities for Improvement
41
The interview conducted with one of the importers as well as one exporter reveal that there are limited capacities in most of the accredited laboratories in terms of staffs which cause delay in the delivery of the certificates. According to the respondents interviewed, there are very limited numbers of chemists to perform this function as they are also responsible for other food products. On paper, the processes should be completed in two days but there are incidences of delay of more than two weeks. In fact, nine respondents from the custom departments identify health certification, certificate of origin, and quality standards as an important source of delay. The accredited laboratories entitled to issue health certificate are not strategically located. This problem is reported by all the ports visited including Pasir Gudang, Johor, which is the biggest port for palm oil in Peninsular Malaysia where it accounts for about 22% of the palm oil exports of Malaysia. According to the respondents at this port, the authorized laboratory is located at Johor Bahru which is about 30km in distance. A similar observation applies to the location of authorized laboratories for Port Klang, Selangor. Although most of the palm oil export activities are mainly conducted at the Port Klang, the authorized laboratories to test or examine the palm oil products are located at Petaling Jaya (about 30km from the port). The test sometimes may take a number of days to be completed and this causes delay to the exporters. Sarawak and Sabah account for about 45% of the total production of palm oil in Malaysia in 2012. Some of the estates in these states belong to the plantation companies in Peninsular Malaysia. It is reported that there are limited number of refinery mills and bulking installations in these states, which hinder timely transportation of this commodity to Peninsular Malaysia for further processing and export through the designated ports. On some occasions, the refineries are not able to cope with the huge volume of palm oil. In 2012, there were only five refinery mills and two bulking installations available in Sarawak. The limited number of refineries causes delay especially to the tankers. Tankers are unable to unload oil as there are not enough rooms to store the oil at the refiners’ level. Similarly, there is insufficient space to store the refined oil as the capacity of bulk stations at the port is limited. Three respondents comprising service and logistics service provider, and importer state that insufficient number and poor condition of ports is an important barrier to efficient logistics. Port congestion is also mentioned as a serious problem. A total of 13 respondents from the Custom Depatment mention that the important sources of delay for import cargoes are congestion at the terminal and road access. The second most important sources of delay include; availability of funds for paying duty and taxes, physical inspection time and security checks. Four respondents state that the average time for vehicle inspection is about 30 minutes. The other factors include; the time required to transfer cargo between vehicles and random testing of products. A similar view is given for export procedures. A total of 13 respondents from the Custom Department state that the most important sources of delay for export include congestion at the terminal and road access. This is followed by procedural requirement such as, certification of origin, quality standards and health, and the need for physical inspection and security checks. A serious port congestion has been reported in East-Malaysia also because of its small capacity which encourages “ship to ship” oil transfer (also called “double banking” practices) to speed up delivery. This practice however is not allowed in international waters. In other words, the chokepoint which is low capacity port induces “malpractices” among the traders. This calls for reliable certifications of the ship
Enhancing Supply Chain Connectivity and Competitiveness of Malaysian Agriculture Products: Identifying Chokepoints and Opportunities for Improvement
42
owners, exporters and importers to monitor trade flow. As for land border crossing, three custom officers indicate that the average time involved is 24 hours. The interview with two respondents who are logistic and shipping service providers reveals that sometimes even major ports such as Pasir Gudang, South Port, Klang, are unable to handle large cargoes because the ports are not deep enough. The situation in smaller ports such as Sandakan and Lahad Datu is worse. These cause congestions for cargos at ports while loading or discharging palm oil. Hence, it is not surprising that ports received complaints from customers overseas over shipment delays particularly during peak season such as Christmas. Deeper draught is needed in order to facilitate the shipment. Poor maintenance of the port facilities causes some damages such as leakages in the pipelines which cause delay and losses. The said two respondents also voiced out the problems of lack of infrastructural support that hindered efficient logistics. These include; dependence on transhipment and feeder services, small consignment and vehicle fleet size, limited hours of operation of the custom department and weak auxiliary services. 3.1.2 Internal Transport and Logistics The chokepoints of the internal transport and logistics for palm oil are summarised as follow: (i) Poor road condition (particularly surrounding the port areas); (ii) Traffic congestion at the port vicinity; (iii) High transportation cost; and (iv) Pilferage of oil during transit. Thus far, it can be concluded that the road infrastructures in Malaysia is excellent, particularly the highways connecting mills to the cities and ports. However, three respondents (an importer, logistics service provider and shipping service provider) indicated that poor road condition is a serious infrastructure impediment. Especially, roads leading to the ports are the source of a serious chokepoint for exports of the Malaysian palm oil and other products. The road condition particularly around the port areas is in a bad shape due to frequent and heavy usage by the trucks and tankers while the road maintenance and up-grading are infrequent and very minimal. The impact of lack of maintenance is very obvious as there are many potholes and road damages unattended which causes traffic congestion and hence delay in delivery as well as damages to the vehicles. The heavy usage of the roads and frequent congestion suggest that the demand for roads is outweighing the supply. As stated by the representative of the biggest road transport service provider in Malaysia, the transportation cost in Malaysia is relatively high compared to other countries such as Thailand and Indonesia. The interviewee mentioned that the major costs for transport service providers are diesel, toll, tires, and drivers’ salaries. Of these four major cost items, the only cost that can be controlled by the company is the drivers’ salaries, as other costs are determined by the market. The interviewee added that the wages paid to the drivers to transport the palm oil from the mills/refineries to the ports, are relatively low and unattractive. Hence, there is a tendency for the tanker drivers to earn extra income by selling a certain portion of the oil in transport to the black market at a lower price. According to one of the transporter,
Enhancing Supply Chain Connectivity and Competitiveness of Malaysian Agriculture Products: Identifying Chokepoints and Opportunities for Improvement
43
currently there are a total of 120 “hotspots” in Malaysia where palm oil is siphoned to black-market dealers who have their own tankers. It was also reported that there is a new method of siphoning named “mobile hotspot”, where oil is transferred from tanker to tanker in a speedy manner. In general, it was reported on average 2,500 tankers operate daily in Malaysia. It was estimated that the total loss from this pilferage activity is worth RM328 mn in 2008 and on average, one palm oil tanker is hijacked every month. We were also informed of pilferage activity carried out by small ships, which transport oil from Pasir Gudang to Singapore bypassing the documentation requirements. Pilferage also occurs at the farm level. There are a number of factors that enable this pilferage activity besides low pay to the drivers. As concluded by the respondents, these factors include; firstly, there is no secured identification of the plantation which encourages the use of fake documents in the black market. Secondly, a few respondents claimed that even though some companies commit illegal practices (such as oil siphoning), there is no monitoring from the authority. Moreover, the MPOB L3 form9 which is meant to monitor the flow of oil from production point to the mills/refiners and bulking installations by the transporters is rarely verified. This pilferage may cause a little delay in the delivery to the port. However, its long term implications are serious. The most clear negative impact is on food safety. It is reported that in order to maintain the original volume of crude palm oil in the tank, the drivers would replace the siphoned oil with sludge oil which contaminates the oil in the tank. In some cases, there are dedicated tanks to hold the stolen oil from various sources of varying quality. Consequently, the contaminated palm oil will be transferred to both local and international markets for consumption. Besides food safety implications, poor quality product may back fire the industry in the long term. In fact, some ports mentioned that they received complaints from international agencies on the poor quality some of the palm oil batches. The other problems relating to palm oil transportation that contribute to the choke points include; limitations on fleet size and hours of operation, poor cargo handling, lack of space provided for truck terminals, frequency of traffic jam, lack of urban bypass, informal checkpoint and poor road condition. The combination of these problems, magnifies the chokepoints in the system. 3.1.3 Import and Export Clearance Documentation is remarked as the most important constraint to efficient logistics by three respondent companies, namely importer, logistics service provider, and road transport service provider. In terms of land border import, according to the custom officers interviewed, the average time to clear inbound cargo (lodgement to release) is about 78 minutes which can be considered lengthy. The processes involved are; document submission which take about 4 minutes to complete, review of declaration and supporting documentation (about 30 minutes), scanning (about 4 minutes) and physical inspection (about 4 minutes). A total of 13 custom officers are in the opinion that the major sources of delay are; congestion at the terminal and access road, lack of availability of funds for paying duty and taxes, physical inspection and security checks. The other reasons include; transferring cargo between vehicles and random testing of products. 9MPOB L3 form is a compulsory document for any person to move or accept delivery of palm oil. According to Malaysian Palm Oil Board (Licensing) Regulations 2005, PART IV GENERAL 36, it is prohibited for anyone to move or accept delivery of palm oil without Form MPOB L3.This form is issued to monitor the physical flow of palm oil in the country. For further information, see http://www.mpob.gov.my/licensing-a-enforcement/law-a-legislation/511-achievements#item37.
Enhancing Supply Chain Connectivity and Competitiveness of Malaysian Agriculture Products: Identifying Chokepoints and Opportunities for Improvement
44
As for onland export, the major delaying factors in terms of importance are; firstly, congestion at the terminal and on access road. Secondly, the certification of origin, quality standards and health. Thirdly, the need for physical inspection and security check. However, one exporter reported export clearance of 45 minutes for its products through the sea port. Besides the local documentation requirement, the external factors are found to be significant in causing delays particularly different requirement of certificates demanded by importing countries. In order to be competitive, Malaysia has to address the different sets of requirements. For instance, both the United States of America (USA) and Egypt demand radioactive-free certificate, which means palm oil products should be declared free from any explosive materials and radioactive contents. In order to contain this issue, the US government has placed their officers at a specific premise called Megaport at Port Klang to scan all palm oil export destined to the US. In the case of Egypt, the port has to send the product samples to Kajang for laboratory testing which may takes 7-10 working days. As for Australia, they require fumigation to be carried out before palm oil products are uploaded into the containers. In fact, some of the importing countries (especially EU countries) also demand certificates of origin which is in line with traceability issue. Vietnam, China and India demand health certificates for palm oil products. As have been mentioned in Section 3.1.1, the limited capacity of authorized laboratories that are involved in the issuance of relevant certificates delay the processes. China for instance, requires palm oil products to be free from pesticides and insecticides. They demand that the sample to be sent to China for laboratory testing which takes 7-10 days for completion. This is certainly a costly delay or a choke that hinders export clearance process. It is also reported that different ports in China require specific set of requirements. 3.1.4 Certification and Permit Processes As for certification and permit processes, the chokepoints identified are as follows: (i) Halal certificate; (ii) Non-standardised documentation requirements; (iii) “Glitchy” information system; and (iv) Threats to palm oil credibility. Based on the interview, four custom officers mention that agricultural goods have to fulfil documents relating to IPPC, Codex, OIE and CITES. However, “halal” certification receives comments from the respondents. The need for a “Halal" certificate has been identified by some respondents, including PORAM and an importer and an exporter as a chokepoint for the Malaysian palm oil industry. A new requirement was set up by Jabatan Kemajuan Islam Malaysia (JAKIM), where Halal certification is mandatory for palm oil processes, particularly at the milling and refinery levels. Questions have been raised about the need for halal certificates as palm oil is a vegetable-based product. In fact, some of the respondents suggest that the Halal certificate is unnecessary since they have applied some other standard requirement practices such as ISO, HACCP and GMP Plus. The additional requirement for Halal certificate for palm oil industry is considered as a duplication of the current certificates required.
Enhancing Supply Chain Connectivity and Competitiveness of Malaysian Agriculture Products: Identifying Chokepoints and Opportunities for Improvement
45
The respondents also mention about the non-standardised documentation requirements by importing countries. For instance, Vietnam demands certificates of origin (COO) to be sent both through e-submission as well as hard copies which have to be approved manually. It is also reported that there are incidences where their officers used their own discretion with regards to tariff rates and procedures. These specific requirement and inconsistency are time-consuming and cause delays. At the stage of permit processes to export, the Royal Malaysian Customs Department has implemented an electronic submission system called SistemMaklumatKastam (SMK) to speed up the processes. Unfortunately, the respondents report that there are some “glitches” in the system and instances of downtime of the system. In a highly digitalised trade environment, a break down of the system may incur high costs or loss to the traders in terms of missed opportunities.With regards to e-permits, the respondent from MPOB confirmed that e-permits for import and export are provided where companies are able for file applications, pay processing fees, and print system generated permits, However, the respondent state that e-certification for export is not provided yet. The majority of customs’ officers report that electronic data exchange is being used for documentation processes including submission of ship manifest, cargo declaration, pre-arrival information as well as approvals by other agencies. Moreover, eight officers claim that electronic signatures are accepted for customs’ procedures.Three custom officers reported that between 76-99% of inbound and 0-25% of outbound declarations are submitted electronically respectively. The import clearance processes is done both on paper and electronic according to the custom officers. Most documents (with the esception of packing list) are available for processing through online which include original invoice, certificates of origin, way-bill or bill of lading, currency document, insurance form, certificate of quarantine, phytosanitarory certificate and import permit. As for export clearance, the supporting documents that are provided in both forms (hard copy and electronic) are; original invoice, way-bill, export permits and SPS certificate. Packing list is done on hard copy only. Clearly, the documentation is not fully digitalised particular for export purposes.The reasons cited include; lack of ICT facilities at the ports, resistance from some of the custom officers, insufficient skill and lack of training. One of the respondents claim that the Lynas11 project,which intends to process rare earth near to the Kuantan Port, Pahang could harm the image of palm oil products from Malaysia. This is because of the possibility of radioactive leaks from the waste of processing activites as had happened in Bukit Merah, Perak in the 1980’s. According to the respondents, the leaks may contaminate palm oil plantation and products in the vicinity. 3.1.5 Transparency and Awareness of Regulations In the case of transparency and awareness of regulations, the chokepoint identified was poor dissemination of rules and regulations. The respondent from a logistics service provider company reported poor dissemination of procedures, rules and regulations of the customs. This may lead to misinterpretation of the tariff codes, particularly by officers which create irregularities.
11 Lynas Corporation, Ltd. is an Australian rare earths mining company located in Kuantan. It’s presence received storng protest from the public due to the possibilty of radioactive leak from the toxic waste.
Enhancing Supply Chain Connectivity and Competitiveness of Malaysian Agriculture Products: Identifying Chokepoints and Opportunities for Improvement
46
3.2 Fish Products 3.2.1 The Quality of Infrastructure and Cold Chain
The problems of infrastructure in the fishery sector can be summarized as: (i) Insufficient import gates for land border crossing; (ii) Limited capacities of most accredited laboratories; and (iii) Unsatisfactory examination bays at the port. Bukit Kayu Hitam station is an important land border crossing for fish trade between Thailand and Malaysia. One of the customs officers states that they operate this station for seven days a week, two shifts per day, and nine hours per day. According to an interview with a forwarding agent at the station, he estimates that there are approximately 400 trucks per day from Thailand crossing this station to deliver fishery products to Malaysia; while there are about 200 trucks per day from Malaysia that export fishery goods to Thailand. Trucks that bring fishery products from Thailand usually will arrive at the border in the afternoon, around 4 PM. When the trucks arrive at the import gate, they have to stop for approximately 10 minutes because the drivers and crew have to pay toll and go through immigration and police checks. The customs officers state that the average time to clear a shipment is about 78 minutes. However, there is only one import and export gate in that area. Due to lack of number of import gate, it usually leads to traffic congestion and delays at the station, especially between Mondays and Thursdays. In fact, thirteen customs officers also state that congestion at the terminal is the major source of delays for imports. The customs officer at this station rated the degree of frequency for this congestion as ‘always’. These delays result in losses to the stakeholders. Since fishery products are perishable goods, delay in the delivery process may downgrade the products and adversely affect their prices. It consequently reduces the revenue of the stakeholders. At the moment, the capacity for laboratory service is still limited. According to one of the officers from Fisheries Biosecurity Division, any shipment of shrimp (for human consumption), in Peninsular Malaysia, bound for export has to be tested by the Kedah State Fisheries Biosecurity laboratory,while any sample of ornamental shrimp has to be diagnosed by the Johor State Fishery Biosecurity laboratory. Other than the public laboratories, the samples can be tested at accredited private laboratories. However, the Fishery Biosecurity officer states that the number of the private laboratories is still scarce. This is also mentioned by three officers from the Malaysian Quarantine and Inspection Services (MAQIS) also agreed that lack of accredited laboratories is a severe impediment to effectiveness of government regulations in Malaysia. They also rated lack of accredited laboratories as a ‘serious’ issue.
At this moment, the Malaysian Quarantine and Inspection Services (MAQIS) utilizes two examination bays at Northport (Malaysia) Bhd, and one examination bay at Westports Malaysia Sdn Bhd for the inspection of imported fish products. However, according to the officers the examination bays at Northport (Malaysia) Bhd are unsatisfactory compared to other ports. The lack of facilities at the examination bays frequently lead to delays in the process of releasing the goods. . 3.2.2 Internal Transport and Logistics The chokepoints of the internal transport and logistics for fishery are summarised as:
(i) Unsatisfactory road condition in Port Klang area; and (ii) Distant location of accredited laboratories.
Enhancing Supply Chain Connectivity and Competitiveness of Malaysian Agriculture Products: Identifying Chokepoints and Opportunities for Improvement
47
Port Klang is also an important entry point for fishery products into Malaysia. There are three main ports in this area which provide facilities for fish trade, namely Northport (Malaysia) Bhd, Westports Malaysia Sdn Bhd and Asa Niaga Sdn Bhd. Due to the high volume of cargo going through the ports in Port Klang area, the large presence of heavy trucks has led to uneven road, higher frequency of traffic accidents, which slow down the flow of traffic on the road. In fact, there are always some work-in-progress and road-upgrading projects in the area, which lead to traffic congestion in the short term. Thirteen customs officers state that traffic congestion at the terminal area is the major source of delays for imports. A fish importer also rates the domestic road conditions as poor in terms of the degree of improvement or deterioration at the present time compared to three years ago.
According to the rules and regulations in Malaysia, imported fishery products have to be inspected through quarantine (for live fish) or tested at accredited laboratory (for fish products). These laboratory reports are important for the MAQIS to decide on the release of imported and exported goods. Three officers from MAQIS state that the laboratories are located far from the border or the MAQIS stations. The long distances and under capacity of these laboratories may delay MAQIS from releasing the fishery products. From the verbal conversation, the MAQIS officer outlines that delays in getting the laboratory results are frequent. 3.2.3 Import and Export Clearance
The chokepoints of the import and export clearance for fishery are summarised as: (i) Documentation processes, (ii) Health certificates written in foreign languages; and (iii) Glitches in the electronic system and incidence of system downtime.
In terms of land border import, according to the custom officers interviewed, the average time to clear inbound cargo (lodgement to release) is about 78 minutes which can be considered lengthy. The processes involved were; document submission took about 4 minutes, review of declaration and supporting documentation (30 minutes), scanning (about 4 minutes) and physical inspection (about 4 minutes). According to 13 custom officers interviewed, the major sources of delay were congestion at the terminal and access road, lack of availability of funds for paying duty and taxes, physical inspection and security checks. The other reasons include; transferring cargo between vehicles and random testing of products. As for onland export, the major delaying factors in terms of importance were; firstly, congestion at the terminal and on access road. Secondly, the certification of origin, quality standards and health. Thirdly, the need for physical inspection and security check. However, one exporter reported export clearance of 45 minutes for its products through the sea port. Foreign language used on the import and export documents can be a chokepoint for trade. For instance, health certification for fishery products imported from Thailand is written in Thai language. Therefore, it takes a long time for Malaysian officers to translate the documents into Malay or English language. Beginning in 2008, the Royal Malaysian Customs Department has implemented an electronic submission system, namely Sistem Maklumat Kastam or Customs Information System. This system enables online submission of K1, K2 and K9 forms for
Enhancing Supply Chain Connectivity and Competitiveness of Malaysian Agriculture Products: Identifying Chokepoints and Opportunities for Improvement
48
customs declaration without any need for hardcopy version of the same forms. However, supporting documents like permits, invoices, packing lists etc. are still needed in the process. SMK provides a link between the MAQIS and the Royal Malaysian Customs Department. The MAQIS needs to approve imported or exported fishery products via the SMK before the customs’ declaration. According to a conversation with a forwarding agent in Bukit Kayu Hitam, he states that the SMK system may be down approximately once a month and this problem usually takes several hours to be resolved. He further highlights that this downtime may delay the customs’ declaration at the border by as much as four hours. However, a logistic service provider for fish rates hisr satisfaction with the ICT as ‘3’ or ‘satisfactory’ for adequate, cost, and quality. 3.2.4 Certification and Permit Processes
The problems of certification and permit processes in the fishery sector can be summarized as follows: (i) Preference on manual submission of documents; and (ii) Long time required for issuance of import and export licenses. Every exporter, importer and transporter of fishery products has to be registered under the Department of Fisheries through the Fishery Biosecurity Unit at the state level. Currently, the registration is done either manually or electronically. According to the officers in the Fishery Biosecurity Units in Pulau Pinang and Kedah states, applicants still prefer to register manually which will take about 13 working days to process. This is due to the documents having to go through officers at the state level before it can be submitted to the federal level. In contrast, application can be approved within 1-3 days if the application is done electronically via e-biosecurity. Besides, it is compulsory for fish importers and exporters to be registered under the Fisheries Development Authorities of Malaysia in order to obtain annual import and/or export licenses. Respondents state that the issuance of the license can take between one to two months even though the Standard Operational Procedure states a license can be issued in 7 working days. 3.2.5 Transparency and Awareness of Regulations
Based on the International Air Transport Association (IATA), all perishable cargo that travel by air need to comply with air cargo standard and regulation in terms of packaging and labeling to ensure the safety of the cargo and to promote global air cargo supply chain security standard. According to the MASkargo, certain cargo transhipments may be subjected to specific conditions. For instance, live fish cargo needs to be in specific Styrofoam density based on specific weight to prevent leakage and to comply with the IATA/OAA Packaging Standard for Wet Shipments. However, some standards are not followed by a few exporters and importers resulting in delays in delivery process. This statement is supported by a respondent under Ministry of Agricultural; he rates the variable named ‘private sector poor understanding of regulations’ as ‘serious’. Moreover, a logistic service provider for fish reports that inconsistent interpretation of the rules, allowance for discretionary behavior, and irregular enforcement are the main problems with application or implementation of regulations. The degree of seriousness for this issue is rated as ‘mildly serious’.
Enhancing Supply Chain Connectivity and Competitiveness of Malaysian Agriculture Products: Identifying Chokepoints and Opportunities for Improvement
49
3.2.6 Non-tariff Measures
Regulatory authorities in most importing countries, like the European Union, now focus on the misuse of chemicals in fish production, and public attention has shifted towards the production methods. This indicates that the industry players should be aware of the way they produce fish products as consumers are getting more cautious regarding the source of the fish that they consume. However, based on our observations, the situation at fish landing ports are far from satisfactory with respect to hygienic standards. In fact, there are plenty of room for improvement in aquaculture farms in terms of production methods. This is evidenced by lack of number of shrimp farms who successfully obtained First Quality Certification (FQC). According to the fishery biosecurity officer, there are only 21 shrimp farms in Malaysia having the FQC in 2013. The lack of qualified producers for fish products can adversely affect fish trade performance.
Enhancing Supply Chain Connectivity and Competitiveness of Malaysian Agriculture Products: Identifying Chokepoints and Opportunities for Improvement
50
4. Policy, Regulatory and Institutional Issues 4.1 Palm Oil The Malaysian oil palm industry has enjoyed considerable government support. The Malaysian government efforts have been dominant as export oriented interventions were instrumental in the deliberate shift from the lower-value-added and price-volatile CPO to the more stable PPO production, and providing the necessary management to motivate private firms to participate in new product development. Industrial policy in Malaysia’s oil palm sector was carefully coordinated with the private sector. The government formulated strategies to widen and deepen value chains vertically and by involving complementary industries. Those objectives have been achieved through more dedicated institutional and systemic coordination. 4.1.1 Acts, Regulations and Institutions Ruling the Palm Oil Industry Malaysian palm oil industry is an extremely regulated industry through applying more than 15 laws and regulations comprising the Land Acquisition Act 1960, Environmental Quality Act 1974, Environmental Quality (Clean Air Regulations) 1978, Pesticides Act 1974 Pesticides Registration Rules), Occupational Safety and Health Act (1977), and Protection of Wildlife Act 1972. The industry is also complying with Hazard & Critical Control Points (HACCP) and the Environmental Impact Assessment (EIA) requirements (MPOC, 2013). In order to achieve the required perfomance of the industry and enhace competitivenes of the industry, the government formulated some regulations and acts. The most iportant are the following: Malaysian Palm Oil Board (Compound) Regulations 2005 MPOB was incorporated by an Act of Parliament (Act 582) (Malaysian oil board Act 1998). According to this act MPOB is the leading government agency assigned to serve the country's oil palm industry. Its main role is to promote and develop national objectives, policies and priorities for the interests of the Malaysian oil palm industry. In view of the recent rapid expansion in the industry and changing global oils and fats market called for amendment in the regulations of MPOB to keep in pace with world market needs to controll the quality of palm oil products, the Malaysian Palm Oil Board (Licensing) Regulations 2005 that was put into effect on 1st January 2006 obliges that all those involved in the palm oil business get appropriate licenses from MPOB. This includes the production, sale, purchase, movement, storage, commence construction of oil palm mill, milling, commence construction of bulking facilities, survey, test, export and import of oil palm products (Table 17). The regulations state that no persons shall involve in those activities unless he is a holder of an appropriate license issued under these Regulations. In issuing the licence, MPOB imposes conditions and quality resolution s to regulate the trade and to promote quality practices to ensure the products or services rendered is of the highest quality.
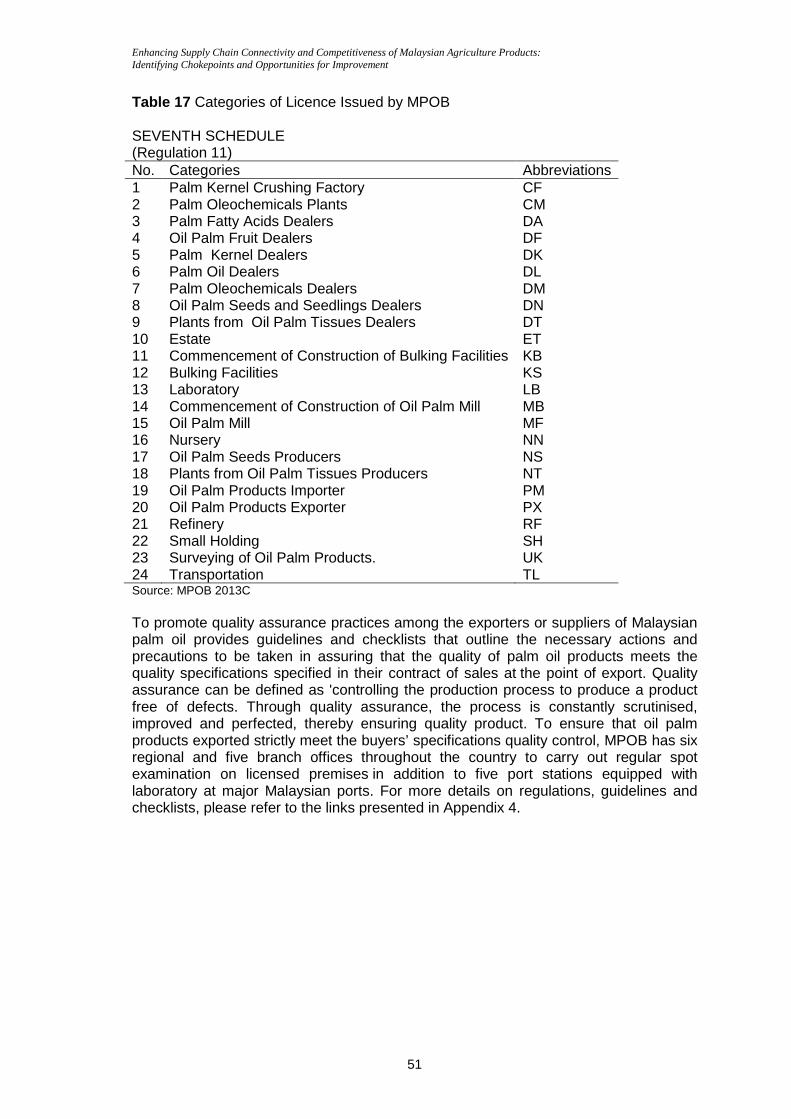
Enhancing Supply Chain Connectivity and Competitiveness of Malaysian Agriculture Products: Identifying Chokepoints and Opportunities for Improvement
51
Table 17 Categories of Licence Issued by MPOB SEVENTH SCHEDULE (Regulation 11) No. Categories Abbreviations 1 Palm Kernel Crushing Factory CF 2 Palm Oleochemicals Plants CM 3 Palm Fatty Acids Dealers DA 4 Oil Palm Fruit Dealers DF 5 Palm Kernel Dealers DK 6 Palm Oil Dealers DL 7 Palm Oleochemicals Dealers DM 8 Oil Palm Seeds and Seedlings Dealers DN 9 Plants from Oil Palm Tissues Dealers DT 10 Estate ET 11 Commencement of Construction of Bulking Facilities KB 12 Bulking Facilities KS 13 Laboratory LB 14 Commencement of Construction of Oil Palm Mill MB 15 Oil Palm Mill MF 16 Nursery NN 17 Oil Palm Seeds Producers NS 18 Plants from Oil Palm Tissues Producers NT 19 Oil Palm Products Importer PM 20 Oil Palm Products Exporter PX 21 Refinery RF 22 Small Holding SH 23 Surveying of Oil Palm Products. UK 24 Transportation TL Source: MPOB 2013C To promote quality assurance practices among the exporters or suppliers of Malaysian palm oil provides guidelines and checklists that outline the necessary actions and precautions to be taken in assuring that the quality of palm oil products meets the quality specifications specified in their contract of sales at the point of export. Quality assurance can be defined as 'controlling the production process to produce a product free of defects. Through quality assurance, the process is constantly scrutinised, improved and perfected, thereby ensuring quality product. To ensure that oil palm products exported strictly meet the buyers’ specifications quality control, MPOB has six regional and five branch offices throughout the country to carry out regular spot examination on licensed premises in addition to five port stations equipped with laboratory at major Malaysian ports. For more details on regulations, guidelines and checklists, please refer to the links presented in Appendix 4.
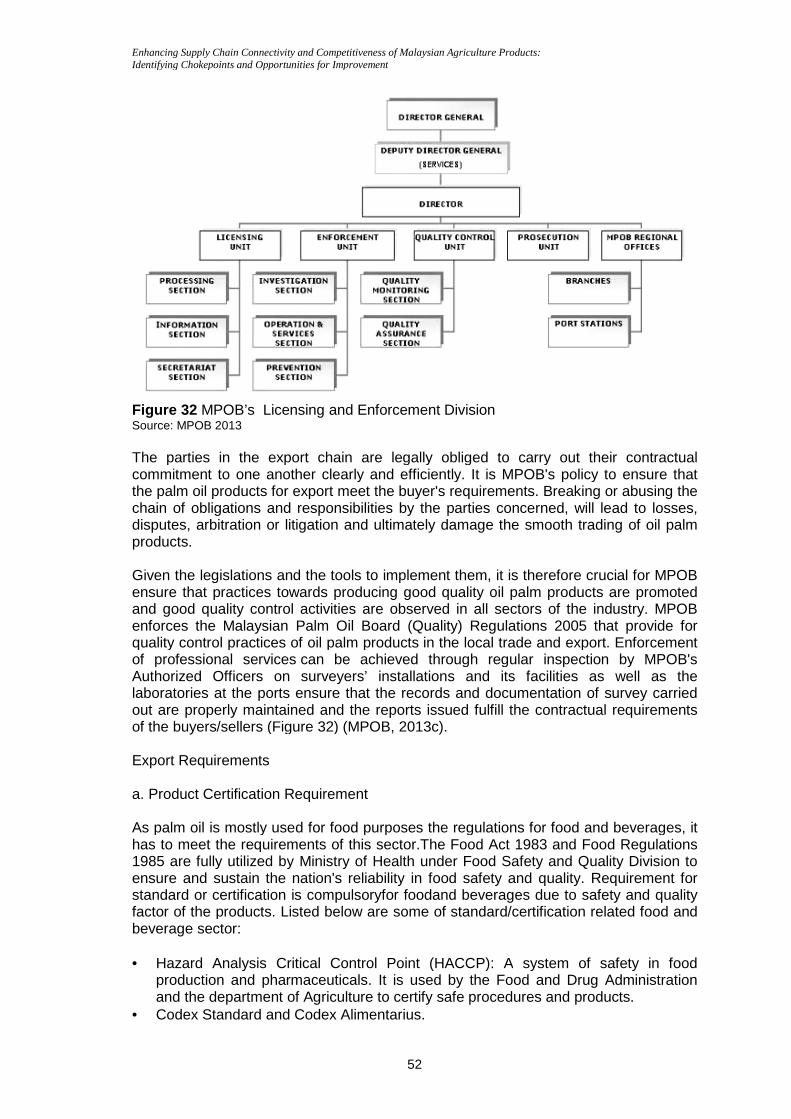
Enhancing Supply Chain Connectivity and Competitiveness of Malaysian Agriculture Products: Identifying Chokepoints and Opportunities for Improvement
Figure 32 MPOB’s Licensing and Enforcement DivisionSource: MPOB 2013 The parties in the export chain are legally obliged to carry out their contractual commitment to one another clearly and efficiently. It is MPOB's policy to ensure that the palm oil products for export meet the buyer's requirements. Breaking or abusing the chain of obligations and responsibilities by the parties concerned, will lead to losses, disputes, arbitration or litigation and ultimately damage the smooth trading of oil palm products. Given the legislations and the tools to implement them, it is therefore crucial for MPOB ensure that practices towards producing good quality oil palm products are promoted and good quality control activities are observed in all sectors of the induenforces the Malaysian Palm Oil Board (Quality) Regulations 2005 that provide for quality control practices of oil palm productsof professional servicesAuthorized Officers on surveyers’ installations and its facilitieslaboratories at the ports ensure that the records and documentation of survey carried out are properly maintained and the reports issued fulfill the contractual requirements of the buyers/sellers (Figure 32) Export Requirements a. Product Certification Requirement As palm oil is mostly used for food purposes the regulations for food and beverages, it has to meet the requirements of this sector.The 1985 are fully utilized by Ministry of Health under ensure and sustain the nation's reliability in food safety and quality. Requirement for standard or certification is compulsoryfor factor of the products. Listed below are some of standard/certification related beverage sector: • Hazard Analysis Critical Control Point (HACCP): A
production and pharmaceuticals. It is and the department of Agriculture to certify safe procedures and products.
• Codex Standard and Codex Alimentarius.
Enhancing Supply Chain Connectivity and Competitiveness of Malaysian Agriculture Products: Identifying Chokepoints and Opportunities for Improvement
52
MPOB’s Licensing and Enforcement Division
The parties in the export chain are legally obliged to carry out their contractual commitment to one another clearly and efficiently. It is MPOB's policy to ensure that
products for export meet the buyer's requirements. Breaking or abusing the chain of obligations and responsibilities by the parties concerned, will lead to losses, disputes, arbitration or litigation and ultimately damage the smooth trading of oil palm
Given the legislations and the tools to implement them, it is therefore crucial for MPOB ensure that practices towards producing good quality oil palm products are promoted and good quality control activities are observed in all sectors of the induenforces the Malaysian Palm Oil Board (Quality) Regulations 2005 that provide for quality control practices of oil palm products in the local trade and export.of professional services can be achieved through regular inspection by MPAuthorized Officers on surveyers’ installations and its facilities
at the ports ensure that the records and documentation of survey carried aintained and the reports issued fulfill the contractual requirements
(Figure 32) (MPOB, 2013c).
Product Certification Requirement
As palm oil is mostly used for food purposes the regulations for food and beverages, it has to meet the requirements of this sector.The Food Act 1983 and
are fully utilized by Ministry of Health under Food Safety and Quality Divisionensure and sustain the nation's reliability in food safety and quality. Requirement for standard or certification is compulsoryfor foodand beverages due to safety anfactor of the products. Listed below are some of standard/certification related
Hazard Analysis Critical Control Point (HACCP): A system of safety in food production and pharmaceuticals. It is used by the Food and Drug and the department of Agriculture to certify safe procedures and products.Codex Standard and Codex Alimentarius.
The parties in the export chain are legally obliged to carry out their contractual commitment to one another clearly and efficiently. It is MPOB's policy to ensure that
products for export meet the buyer's requirements. Breaking or abusing the chain of obligations and responsibilities by the parties concerned, will lead to losses, disputes, arbitration or litigation and ultimately damage the smooth trading of oil palm
Given the legislations and the tools to implement them, it is therefore crucial for MPOB ensure that practices towards producing good quality oil palm products are promoted and good quality control activities are observed in all sectors of the industry. MPOB enforces the Malaysian Palm Oil Board (Quality) Regulations 2005 that provide for
in the local trade and export. Enforcement can be achieved through regular inspection by MPOB's
Authorized Officers on surveyers’ installations and its facilities as well as the at the ports ensure that the records and documentation of survey carried
aintained and the reports issued fulfill the contractual requirements
As palm oil is mostly used for food purposes the regulations for food and beverages, it nd Food Regulations
Food Safety and Quality Division to ensure and sustain the nation's reliability in food safety and quality. Requirement for
due to safety and quality factor of the products. Listed below are some of standard/certification related food and
system of safety in food used by the Food and Drug Administration
and the department of Agriculture to certify safe procedures and products.
Enhancing Supply Chain Connectivity and Competitiveness of Malaysian Agriculture Products: Identifying Chokepoints and Opportunities for Improvement
53
• Good Manufacturing Practices (GMP). • Good Hygiene Practice (GHP). • Halal Certificate: Issued by The Jabatan Kemajuan Islam Malaysia (JAKIM) that
has full authority to check and certify if a product that is produced or manufactured by the company who meets all the criteria. It has been reported that it takes relatively long time for imported products to be endorsed with Halal certification due to financial constraint and manpower shortage among other reasons (MITI, 2013).
• Health Certificate Ministry of Health(Food Safety& Quality Division). • Sanitation Standard Operating Procedures (SSOP). • Quality Assurance Programme. • ISO 9000. b. Country Specific Requirements Import requirements vary from one country to another. Some countries have more strict constraints than others subject to their regulatory and policies. The majority of the countries require at least certification on HACCP, in Malaysia. Exporters can apply for HACCP certification and other certification through Food Safety and Quality Division. Compliance with the others’ standards will make it easier to exchange technical information with experts in other countries due to the fact that, standards are continuously modifying and exporters continuously must maintain bring up to date. For example China, India and Vietnam require Health Certificate for edible palm oil, palm olein and for general food (MATRADE, 2013) and United States of America (USA) and Egypt demand radioactive certificate. Dissimilarity of product requirements by different importers might pose chokepoints specialy for custom staff, which might delay the flow of the products through delaying custom clearance documents process. c. General Export Documentation
i. Pro Forma Invoice presented by the exporters to importers for payment of goods prior to their dispatch. It is for custom and advanced payment (partial or full payment) purposes.
ii. Commercial Invoice: A document describing the commercial transaction between the exporters and importers. The document is issued by exporter for buyer to make payment.
iii. Bill of Lading: a document of title issued by a shipper to a carrier. It functions as an acknowledgement of receipts of goods (cargo) at a name port / port of loading to a legal holder.
iv. Export Declaration is issued by freight forwarder. It is required by the government whenever the value of the shipment exceeds a certain minimum amount or, whenever a duty drawback is claimed.
v. Export Permit issued by the government granting an exporter to export specified goods to specified countries.
vi. Packing List. vii. Certification of Origin (CO) is required whenever preferential duties are claimed.
It is issued by: Ministry of International Trade and Industry (MITI) in case of Preferential. For Non-Preferential it is issued by the Federation of Malaysian Manufacturers (FMM), Trade Associations and Chambers of Commerce.
viii. Insurance Documents (MATRADE, 2013).
Enhancing Supply Chain Connectivity and Competitiveness of Malaysian Agriculture Products: Identifying Chokepoints and Opportunities for Improvement
54
Inter-agency / inter-governmental Coordination There are strong formal and informal linkages among the various governmental and non governmental agencies involved in the industry. Formal inter-relationships are reflected in the representation of the main industry organisation in the Board of MPOB and the Board of Trustees of MPOPC. Considering the increasing pressures from stakeholders on environmental concerns, the industry has recently established two national committees to address the issue s introduced. MPOA has set up the Working Committee on Environment while MPOPC has established the Palm Oil Task for on the Environment. By virtue of its organisational mandate, MPOPC’s team is expected to focus on production of communication materials to predict the positive attributes of the industry in connection with the environment and sustainable development. The MPOA committee has a wider spectrum of work, which includes the development, and promotion of best management practices. One of the terms of reference of the Working Committee is to establish and maintain linkages with public and private sector organisations as well as NGOs related to the environment (Hai, 2002).
Enhancing Supply Chain Connectivity and Competitiveness of Malaysian Agriculture Products: Identifying Chokepoints and Opportunities for Improvement
55
4.2 Fish Products 4.2.1 Public Institutions Involved in Fishery Trade Several public institutions are directly involved in the Malaysian fishery trade. They are the Ministry of Agriculture and Agro-based Industry (MoA) and its main implementation agencies, namely the Department of Fisheries (DoF), the Fisheries Development Authority of Malaysia (LKIM), and the Malaysian Quarantine Inspection Services (MAQIS). The Ministry of Health (MoH), the Ministry of Transport (MoT) and the Royal Malaysian Customs Department (JKDM) are institutions generally involved in matters related to trade in food products. The main responsibilities of the Department of Fisheries Malaysia are to develop the fisheries sector through the management of fishery resources, and through transfer of technologies and knowledge to the stakeholders, empowered by the Fisheries Act 1985 (Act 317). The Fisheries Biosecurity Division (FBD) is a division under the DoF. The major responsibilities of the FBD include: 1. To plan, coordinate, implement and evaluate programs related to sanitary and
phytosanitary (SPS) agreement and requirements of importing countries for aquaculture farms and capture fisheries through registration, inspection, surveillance, sampling, analysis, records and documentations, verification, and traceability;
2. To plan and evaluate biosecurity policies pertaining to public health and aquatic animal health, as well as pertaining to import risk assessment;
3. To manage and coordinate matters pertaining to the Convention on International Trade of Endangered Species (CITES) and pertaining to the introduction of Invasive Alien Species (IAS) into Malaysia;
4. To develop, coordinate and formulate policies and standards on aquatic animal health and for fish and fish products;
5. To coordinate and monitor analytical services for regional laboratories related to the public health aspects for aquatic resources; and
6. To issue health certificate, Skim Pensijilan Ladang Akuakultur Malaysia or Malaysian Aquaculture Farm Certification Scheme (SPLAM) certificate, Sijil Amalan Akuakultur Baik or Good Aquaculture Practices (SAAB) certificate.
The Fisheries Development Authority of Malaysia (LKIM) was established under the Malaysian Fisheries Development Board Act 1971 (Act 49). The major responsibilities of LKIM are to develop progressive fisher communities and to improve fish marketing efficiency and infrastructure. The Malaysian Quarantine Inspection Services (MAQIS) was established in 2011 under the Ministry of Agriculture and Agro-Based Industry Malaysia, incorporated pursuant to the Malaysian Quarantine and Inspection Services Act 2011 (Act 728). Its responsibilities are to provide integrated services relating to quarantine, inspection and enforcement at entry points, as well as certification of the imports and exports of fishery products. 4.2.2 Acts, Regulations and Institutions Ruling the Fish Trade The institutions directly involved in the flow of fish trade are illustrated in Figure 33.

Enhancing Supply Chain Connectivity and Competitiveness of Malaysian Agriculture Products: Identifying Chokepoints and Opportunities for Improvement
56
Figure 33 Major Institutions Involved in the Fish Imports and Exports POB’s Licensing and Enforcement Division Source: Summarized from interviews with the Fishery Bio-security Unit in Penang and Kedah, LKIM in Penang and Kedah, Royal Customs Malaysia Department in Bukit Kayu Hitam and MAQIS in Port Klang.
According to the LKIM officer, it is compulsory for imported fish products to be inspected by LKIM at the border stations. The role of LKIM is to ensure that the imported fish category is same as the category listed on the invoice and charge on the products. The LKIM officers state that fish categories are divided into live fish, chilled fish, frozen fish, and processed fish, while they charge RM0.05 per kg regardless of the type of fish. However, the importers can appeal to reduce the charge rate from RM0.05 per kg to approximately RM0.025 per kg for fishery products in transit or for re-export. Based on Biosecurity Circular No. 1 year 2010, every imported or to be exported fishery products are compulsory to be inspected or quarantined (for live fish) or laboratory test (for fish products). As shown in Figure 36, the quarantine for live fish are conducted by the Fisheries Biosecurity Division (FBD) under Section 40(2) on Control of Live Fish, Fisheries Act 1985 (Act 317), while laboratory tests for fish products are conducted by the Ministry of Health (MoH) under Food Act 1983 (Act 281). In addition, the Malaysian government is also dealing with aquatic animal disease issues by enforcing the Fisheries (Prohibition of Import, etc., of Fish) Regulations (1990). This regulation is to control the introduction of exotic species that may interrupt the aquatic ecosystem in Malaysia. Figure 33 implies that after the inspection conducted by the FBD or the MoH, the laboratory reports will be submitted to the MAQIS. The reports are important for the MAQIS to decide on the release of imported and exported goods. Based on our observations, MAQIS approves imported or exported fishery products via the Sistem Maklumat Kastam or Customs Information System (SMK) before customs’ declaration. According to the customs officers, the customs’ role in fish trade is marginal as majority of traded fish products are free from tariff, highly perishable, and categorized as low risk products by the customs. In actual practice, the customs officers will follow the action taken by the MAQIS as both of the customs and MAQIS are linked by the SMK. If the MAQIS approves the fish products in the SMK, the products are mostly released by the customs at the border stations. 4.2.3 Rules and Regulations for the Malaysian Fish Products in International Market
Fish production in Malaysia is controlled and monitored by the Department of Fisheries based on the Fisheries Act 1985 under the Fisheries Regulation 2009. This is to ensure
Enhancing Supply Chain Connectivity and Competitiveness of Malaysian Agriculture Products: Identifying Chokepoints and Opportunities for Improvement
57
the fish products are safe for human consumption and able to meet the requirements of the importing nations. There are several certificates, like Skim Pensijilan Ladang Akuakultur Malaysia or Malaysian Aquaculture Farm Certification Scheme (SPLAM), Sijil Amalan Akuakultur Baik or Good Aquaculture Practices Certificate (SAAB), First Quality Certificate (FQC), managed and issued by the Department of Fisheries. These certificates are essential for the products to be exported to certain international market(s). For instance, any fish farm having the FQC is allowed to export the fish products to most nations, including the EU market. Moreover, the European Union (EU) is one of the major markets for fish products. Based on the EU regulations, a systematic examination on fish products is required in order to certify the fish products are safe for human consumption. Therefore, the Malaysian government has taken several actions, like imposing the Fisheries (Quality Control of Fish for Export to the European Union) Regulations 2009, which will help to increase the Malaysian fish products penetration into the EU market.
Enhancing Supply Chain Connectivity and Competitiveness of Malaysian Agriculture Products: Identifying Chokepoints and Opportunities for Improvement
58
5. Conclusions and Recommendations
5.1 Conclusions This study aims to identify the chokepoints along the supply chain of palm oil and fish products in Malaysia as well as opportunities for improvement. Palm oil is categorised as “animal/vegetable fats and oils” (HS15) and fish products is categorised as “fish and crustaceans molluscs, and other aquatic invertebrates” (HS03). Both products play an important role in the country’s economy. Palm oil is considered as a cash crop or industrial crop with both edible and non-edible applications. The palm oil sector has the most developed downstream activities in the country compared to other agricultural commodities. In 2011, palm oil accounted for 49% of the agricultural GDP and being the second world’s largest exporter of palm it contributed about RM60 bn foreign earnings to the country. The industry has progressed from a merely ornamental industry to an export oriented sector producing high valued products for local and international market. Fish, on the other hand is largely a food item with minimal non-edible usage. It is a major source of protein to the population. The value added for the fishery sector (which largely refers to the primary sub-sector) was estimated at RM9 bn which represented 11% of the agricultural GDP and 1.2% of national GDP in 2009. In terms of balance of trade, the trade sector has always been in surplus in the last three decades until 2009 when fish imports began to surpass fish exports which resulted in a deficit, which continued for the next three years. At a disaggregate level, crustacean (HS0306), live fish (HS0301) and mollusc (HS0307) products are still generating trade surpluses across the observed period. Clearly the two commodities are major tradeable items to Malaysia. The two commodities exhibit a different structure in supply chain due to the nature of the production and consumption pattern of the commodities. As discussed earlier, the supply chain of palm oil is characterised by a highly organised and regulated flow of commodities from the production sub-sector, to the millers, palm kernel crushers, refineries, oleochemical manufacturers and lastly to the ports for export as well as imports. In addition to the said industry participants, the other supporting institutions include the public agencies such as MPOB, MPIC, Malaysian Royal Customs Department, Ministry of Health etc., NGOs, private middlemen/traders, transporters and trading houses. The fish supply chain is characterised by a rather traditional framework where there are many market intermediaries between the landing points and the ports. The middlemen include commission agents, various levels of wholesalers, retailers, processors, transporters, exporters and importers. The institutional supports are provided by DoF, LKIM, DoC, MoH and others. The fishery products are mainly distributed to fresh markets for domestic consumption and processing plants; while trash fish are processed as feed for aquaculture. Malaysia relies on foreign supplies on fishery products for human consumption, raw material for processing and feed. The downstream activities are not as advanced as in the case of palm oil sector. Despite being the most advanced sector in the agricultural sector, the palm oil supply chain indicates some chokepoints with somes are serious enough that warrant urgent attention for further growth and expansion. The fish supply chain too is plagued with a number of problematic areas of concern which also need major intervention for sustainable growth.
Enhancing Supply Chain Connectivity and Competitiveness of Malaysian Agriculture Products: Identifying Chokepoints and Opportunities for Improvement
59
The sources of chokepoints are mainly from internal as well as external (regional and international). Internally, the causes of chokepoints have been identified as quality of infrastructure, internal transport and logistics, import /export clearance, certification and permit processes, transparency and awareness of regulations and non-tariff measures. The external sources include; strict hygiene specifications, food safety certifications regional coordination and trade barriers. The study shows that a number of chokepoints exist in the supply chain of both commodities. In terms of the quality of infrastructure, the chokepoints identified are; limited capacities of most authorised laboratories, unstrategic location of these laboratories, limited number of refinery mills and bulking installations for palm oil in selected production areas such as in East Malaysia, congestion at the ports, lack of maintenance of port’s facilities and in the case of fish; insufficient import gates for land border crossing. In terms of internal transport and logistics, the chokepoints traced are: poor road condition (particularly around the port areas); traffic congestion at the port during peak periods; high transportation cost; and pilferage of oil during transit. Pilferage of oil may not directly cause “choke”, but it has serious implication on food safety and the need for stringent testing. As for import and export clearance, the chokepoints observed are; firstly different requirement of certificates demanded by importing countries which are strecthing the limited resources and facilities at the ports particularly the laboratories. Secondly, it was detected that some health certificates were written in foreign languanges by the importing countries. The chokepoints for certification and permit processes include; the requirement for halal certificate; non-standardised documentation requirements from importing countries; glitches in information system, threats to palm oil credibility due to Lynas rare earth processing project, preference on manual submission of documents, and lengthy period for import and export licenses issuance. There is lack of transparency and awareness of regulations. For instance, traders are not aware of International Air Transport Association (IATA) regulations on packaging and labelling requirements for transportation of fish through aircargo. Poor dissemination of rules and regulations has resulted in inconsistent intepretations among the officers at the port facilities. There are evidence to show that the industry are unable to handle strict hygienic standards require by importing countries. It is clear that the supply chain of these two commodities suffer some setbacks that “choke” the system in varying degrees. In a highly competitive trade environment, these problematic areas must be addressed to ensure growth and sustainability. The following sections provide the policy strategies required to address the chokepoints of both commodities.
Enhancing Supply Chain Connectivity and Competitiveness of Malaysian Agriculture Products: Identifying Chokepoints and Opportunities for Improvement
60
5.2 Recommendations The following sections provide policy recommendations to address the chokepoints as well as other issues for both for palm oil and fish products. The policies identified are based on the six major categories of chokepoints which are the quality of infrastructure, internal transport and logistics, import and export clearance, certification and permit processes and transparency and awareness of regulations and non-tariff measures. 5.2.1 The Quality of Infrastructure The improvements required to address the problems of infrastructure can be summarised as follows:
a. Chokepoint: Limited capacities of most authorized laboratories. Recommendations: (i) Increase number of staffs such as chemists to handle product testing at the laboratories. (ii) Reduce the number of days to test products through enhancement of efficiency. (iii) Appoint more independent/ private laboratories to test the products.
b. Chokepoint: Distant location of accredited laboratories. Recommendation: (i) Locate laboratories or their branches in close proximity to the ports.
c. Chokepoint: Unsatisfactory examination bays at the port (the case of fish). Recommendation: (i) Institute stricter quality management system. (ii( Improve facilities.
d. Chokepoint: Limited number of refinery mills and bulking installations in some production areas. Recommendation: (i) Encourage investment in the refinery sector and provision of bulking installation in major ports particularly in East Malaysia.
e. Chokepoint: Congestion at the ports during peak period Recommendations: (i) Better planning management of ports. (ii) Expand port facilities.
f. Chokepoint: Lack of depth of some the ports. Recommendation: (i) Future planning and implementation of bigger ports to accommodate higher demand for port facilities.
g. Chokepoint: Poor maintenance of facilities at the port. Recommendation: (i) Ports to follow strictly to their quality maintenance schedule.
5.2.2 Internal Transport and Logistics The improvements required to address the problems of internal transport and logistics can be summarised as follows:
Enhancing Supply Chain Connectivity and Competitiveness of Malaysian Agriculture Products: Identifying Chokepoints and Opportunities for Improvement
61
a. Chokepoint: Poor road condition and traffic congestion at the port. Recommendations: (i) To prepare a new transportation plan for ports to accommodate higher demand for heavy duty roads leading to the ports.
b. Chokepoint: High transportation cost and pilferage of oil during transit. Recommendations: (i) Improve enforcement through efficient monitoring of physical flow of palm oil on land transport. This could be done by a centralised GPS system to monitor the movements of tankers and lorries all over Malaysia13. (ii) Strict quality control at the ports. (iii) Increase number of officers to monitor the physical distribution of palm oil. (iv) Enhance food safety certification by raising common standards for the supply chain. It is recommended a body to be set up by the government to audit supply chain transporters. (v) Provision of secured identification of industry participants to avoid malpractices in particular faking documents.
5.2.3 Import and Export Clearance The improvements required to address the problems of import and export clearance can be summarised as follows:
a. Chokepoint: Different requirement of certificates demanded by importing countries. Recommendations: (i) As in 5.2.1.
b. Chokepoint: Health certificate written in foreign languanges by the importing
countries Recommendations: (i) Train multilingual officers at entry/ exit point particularly in major ASEAN languanges such as Malay/ Indonesia, Thai, Tagalog and Vietnamese besides English. (ii) Translation facilities.
5.2.4 Certification and Permit Processes The improvements required to address the problems of certification and permit processes can be summarised as follows:
a. Chokepoint: Halal certificate. Recommendations: (i) Improve Halal certification process.
b. Chokepoint: Non-standardised documentation requirements.
Recommendations: (i) Standardise documentation through G2G negotiations (using ASEAN platform).
c. Chokepoint: Preference for manually submission documents.
Recommendations: (i) Provide ICT training to industry participants.
13 MPOB is developing this application.
Enhancing Supply Chain Connectivity and Competitiveness of Malaysian Agriculture Products: Identifying Chokepoints and Opportunities for Improvement
62
(ii) Ensure smoother provision of ICT services.
d. Chokepoint: Long duration of issuance of import and export licenses. Recommendations: (i) Strictly adhere to the SOPs. (ii) Better inter-agency coordination. (iii) Adoption of “customer-friendly” motive in the service provision.
e. Chokepoint: Glitches information system.
Recommendations: (i) Efficient 24/7 monitoring of servers. (ii) Better inter-agency coordination. (iii) More frequent updates of application and ensure the downtime policy.
f. Chokepoint: Threats to palm oil credibility. Recommendations: (i) Educate the consumers on the issue.
5.2.5 Transparency and Awareness of Regulations
a. Chokepoint: Poor dissemination of rules and regulations. Recommendations: (i) Enhance communication system for better dissemination through the network technology. (ii) Frequent forum between public agencies and industry participants.
b. Chokepoint: Non-standardised fish packaging for air transport.
Recommendations: (i) Provide incentives for compliance or similarly penalties for those who don’t.
5.2.6 Non-tariff Measures
a. Chokepoint: Hygienic standards required by importing countries. Recommendations: (i) Revamp the fish supply chain to ensure hygiene in standards at all levels while maintaining efficiency and growth. (ii) Improve infrastructures and logistics of the fish supply chain. (iii) Increase the adoption of good manufacturing practices or standards in production and distribution.
The recommendations provided above may not sound new or original. However, in view of the seriousness of the “chokes” symptoms (for e.g. traffic congestion, bad roads, limited bulking installations and palm oil theft), reinforcement of the recommendations is critical. At the rate of the country’s trade growing, these symptoms indicate that the demand for these infrastructures and trade services (certifications, documentations and laboratories) is outweighing the supply.Since the investment of the infrastructure is massive, a proper long term planning is needed to create a more condusive environs and facilities to trade. Meanwhile, short terms remedials such as capacity building of staffs (total quality management of processes and procedures, monitoring of physical flow of products, effective maintenance of computer systems and effective regional collaboration and coordination) are relatively cheaper. However, its long term impact is highly beneficial to the industry in terms of efficientcy, growth and competitiveness.
Enhancing Supply Chain Connectivity and Competitiveness of Malaysian Agriculture Products: Identifying Chokepoints and Opportunities for Improvement
63
References ASEAN Secretariat. (2008). ASEAN Economic Community Blueprint. Public Affairs
Office, Indonesia. Basiron, Y. (2006). A Distortion of Facts by Palm Oil Critics. Retrieved on 2013, Feb 28
from http://www.mpoc.org.my/envo_220606_01.asp Basiron, Y. & Simeh, M. A. (2005). The Palm Oil Phenomenon. Oil Palm Industry
Economic Journal, 5(2), 1-10. Cargill Malaysia. (2013), Product and Services. Retrieved on 2013, March 15 from
http://www.cargill.com.my. Chandran, M. R. (2010). Eco-Friendly Credentials– Moving from Prattle to Practice.
Global Oils and Fats Business Magazine, 7 (4), 12-15. Claire, F., & Lan, C. (2010). China’s Policy Dilemma: Balancing Interests. Global Oils
and Fats Business Magazine, 7(4), 16-20. Carter, C., Willa, F., James, F., David, J., & Lynn, W. (2007). Palm Oil Markets and
Future Supply. European Journal of Lipid Science and Technology, 109, 307-314.
Department of Fisheries. (2011a). Biosecurity Circular No. 1 of 2010 Regarding Conditions for Import / Export / Transport Live Fish. Putrajaya, Malaysia.
Department of Fisheries. (2011b). Fisheries Regulations (Control of Fish Quality for Export to the European Union) in 2009. Putrajaya, Malaysia.
Department of Fisheries. (2011c). Information Kit- Rules and Procedures for Approved Farm to Export Fish and Fish Products to the European Union in 2009. Putrajaya, Malaysia.
Department of Statistics (2011). Labour Force Survey, Malaysia 2011. Putrajaya, Malaysia.
Department of Statistics Malaysia. Retrieved on 2013, Feb 27 from http://www.statistics.gov.my
Doing Business. (2012). The International Bank for Reconstruction and Development, The World Bank, Washington.
Felda Holdings Bhd. (2013). Retrieved on 2013, March 23 from http://www.feldaholdings.com/content.php?h=61&lang=EN
Food and Agricultural Organization. (2000). The State of World Fisheries and Aquaculture. Food and Agricultural Organization of the United Nations, Rome, pp 142.
Fry, J. (2009). The Challenges Facing Palm Oil in the 21st Century. LMC International, Oxford, UK LMC, Presentation to the SCI.
Gazi, Md. Nurul Islam, Tai Shzee Yew, Kusairi Mohd Noh, Md. Ferdous Alam & Ng Xin Khai. (2011). Technical Efficiency Analysis of Shrimp Farming in Peninsular Malaysia: An Application of Stochastic Frontier Production Function Approach. Paper presented at the International Fisheries Symposium (IFS 2011) “Towards a Sustainable Fisheries in South East Asia” Permai Hotel Kuala Terengganu, Malaysia. (2011, October 3 – 5).
Government of Malaysia. (1986). Fifth Malaysia Plan, (1986-1990). Kuala Lumpur: Government Printers.
Government of Malaysia. (1966). First Malaya Plan, Prime Minister Department, Kuala Lumpur
Government of Malaysia. (1971). Second Malaysia Plan, Prime Minister Department, Kuala Lumpur.
Government of Malaysia. (2006). Ninth Malaysia Plan, Prime Minister Department, Kuala Lumpur
Halal Industry Development Corporation. (2012). Retrieved on 2013, March 19 from http://www.hdcglobal.com/publisher/gwm_pol_and_reg
Hartley, C. W. S. (1988). The Oil Palm. 3rd ed. Longman, London.
Enhancing Supply Chain Connectivity and Competitiveness of Malaysian Agriculture Products: Identifying Chokepoints and Opportunities for Improvement
64
Hai, T. C. (2002). The Palm Oil Industry in Malaysia: From Seed to Frying Pan. Prepared for WWF, Switzerland.
Hoffman, K., & Hellström, D. (2013). Connectivity in Logistics and Supply Chain Management: A Framework. 14th Logistics Research Network (LRN) Conference http://lup.lub.lu.se/luur/download?func=downloadFile&recordOId=1058635&fileOId=1153160 [Retrieved on 2 April 2013]
Ibrahim, S. (2008). Transportation Optimization Mode of Palm oil Products for Northern Peninsular Malaysia. (Doctoral Dissertation). University Sains Malaysia.
Jalani, B. S., Yusof, B., Ariffin, D., Chan, K. W. & Rajanaidu, N. (2002). Elevating the National Oil Palm Productivity– Breeding and Agronomic R&D Aspects. Paper presented at the Seminar on Elevating National Oil Palm Productivity and Recent Progress in Management of Peat and Ganoderma. MPOB, Bangi.
Jariah, M., Ismail, A.L., Tengku Aizan, T.A.H., Mohamed, S., and Zumilah, Z. (2011). Poverty Eradication in the Fishing Communities: Gender Perspective. Institute of Gerontology, UPM.
Kajisa, K., Maredia, M. & Boughton, D. (1997). Transformation versus Stagnation in the Oil Palm Industry: A Comparison between Nigeria and Malaysia. Staff Paper 97/05, Department of Agricultural Economics, Michigan State University.
Kusairi Mohd Noh, Tai Shzee Yew, Gazi Md Nurul Islam, Aswani Farhana Mohd Noh and Ng Xin Khai (2012). Fisheries (Marine and Aquaculture) in Fatimah Mohamed Arshad, Mad Nasir Shamsudin, Kusairi Mohd Noh and Khalid Abdul Rahim (Eds.), Malaysian Agricultural Commodity Modelling. UPM Press, pp: 434-502
Lawrence. R. Z., Hanouz, M. D., & Doherty, S. (2012). The Global Enabling Trade Report; Reducing Supply Chain Barriers. World Economic Forum.
Lim, K.Y. (2010). A Call to Arms: To Defend Palm Oil. Global Oils and Fats Business Magazine, 7(4): 9-11.
Lubis, A. (1994). Malaysian Market Model for Palm Oil: Some Policy Simulations. (Doctoral Dissertation). Faculty of Economics and Management, Universiti Putra, Malaysia.
Malaysian Institute of Economic Research. (1999). Total Economic Valuation: Coastal and Marine Resources in the Stratus of Malacca. MP-EAS Technical Report, No. 24. GEF/UNDP/IMO, Philippines.
Malaysian Palm Oil Board (MPOB). (2011). Custom Codes for Palm Oil Products and Schedule of Tariff Rates, 7-14.
Malaysian Palm Oil Board (MPOB). (2012). Malaysian Oil Palm Statistics. 31st edition. Malaysian Palm Oil Board (MPOB). (2013a). About Us, Retrieved on 2013, February
28 from http://www.mpob.ov.my/en/about-us/about. Malaysian Palm Oil Board (MPOB). (2013b). The Economics and Industry
Development. Retrieved on 2013, February 28 from http://bepi.mpob.gov.my/ Malaysian Palm Oil Board (MPOB). (2013c). The Economics and Industry
Development. Retrieved on 2013, February 28 from http://bepi.mpob.gov.my/ Malaysian Palm Oil Board (MPOB). (2013b). Overview of the Malaysian Oil Palm
Industry Development. Retrieved on 2013, March 7 from http://econ.mpob.gov.my/economy/Overview_2012_final.pdf
Malaysian Palm Oil Board (MPOB). (2013c). Licensing & Enforcement. Retrieved on 2013, February 15 from http://www.mpob.gov.my/licensing-a-enforcement/general
Malaysian Palm Oil Board (MPOB). (2013d), Issues related to the Impact of Oil Palm on the Environment, Retrieved on 2013, February 15 from http://www.mpob.gov.my/index.php?option=com_content&view=article&id=519:achievements&catid=131:environment&lang=en&Itemid=0.
Enhancing Supply Chain Connectivity and Competitiveness of Malaysian Agriculture Products: Identifying Chokepoints and Opportunities for Improvement
65
Malaysia External Trade Development Corporation (MATRADE),(2013) “Understanding Export Requirement”, Retrieved on March 7,2013, from http://www.matrade.gov.my/en/malaysia-exporters-section/119-going-global-beginners-guide/636-understanding-export-requirement
Ming, K.K. and Chandramohan, D. (2002). Malaysian Palm Oil Industry at Crossroads and Its Future Direction. Oil Palm Industry Economic Journal, vol. 2(2): 10-15.
Ministry of International Trade and Industry (MITI). (2010). MITI Annual Report 2009, Kuala Lumpur.
Ministry of International Trade and Industry (MITI) (2013) “ MITI to Simplify Process for Halal Certification” MITI website, retrieved on 2013, March 7 from http://www.miti.gov.my/cms/content.jsp?id=com.tms.cms.article.Article_386bd098-c0a81573-2a652a65-c8075ea5&curpage=tt.
Ministry of Plantation Industries and Commodities (MPIC). (2011). Statistics on Commodities 2011, 25th edition. P.163.
Ministry of Plantation Industries and Commodities (MPIC). (2012). Statistics on Commodities 2012, 26th edition P51.
Mohammad Jaafar, A. (1994). The Malaysian Palm Oil in a Dynamic Industry. In Technical Committee of 1994 Palm Oil Familiarization Programme, Selected Readings on Palm Oil and its Uses, Palm Oil Research Institute Malaysia: 2.
Moll, H. A. J. (1987). Oil Palm in Malaysia; In the Economics of Oil Palm: Economics of Crops in Developing Countries No 2, 135-166. Netherlands: Pudoc Wageningen.
Oil World (2013) Oil World Statistics Updates, March2013, p.3. PECC (2009). Supply Chain Connectivity: Important to Every Component of the
Business Cycle. PECC Conference on Doing Business in the Asia Pacific Singapore. Retrieved from http://www.pecc.org/resources/doc_view/703-supply-chain-connectivity-important-to-every-component-of-the-business-cycle, on 2nd April 2013.
PEMANDU. (2009). Economic Transformation Programme: A Roadmap for Malaysia. Putrajaya, Pusat Bahasa.
Panapanaan, V., Helin, T., Kujanpaa, M., Soukka, R., Heinimo, J., and Linnanen, L. (2009). Sustainability of Palm Oil Production and Opportunities for Finnish Technology and Know-How to Transfer. Research Report 1, Faculty of Technology, LUT Energy, Lappeenranta University of Technology.
Rifin, A. (2010). The Effect of Export Tax on Indonesia's Crude Palm Oil (CPO) Export Competitiveness. ASEAN Economic Bulletin, 27(2), 173-184.
Royal Malaysian Customs Department. (2009). Custom Regulation (2002 Revision). The Commissioner of Law Revision, Malaysia.
Salmiah, A. (2000). Non-food Uses of Palm Oil and Palm Kernel Oil. MPOPC Palm Oil Information Series, Kuala Lumpur. 24 pp.
Simeh, A., Tengku. A. & T. M. A. (2001). The Case Study on the Malaysian Palm Oil. Presented at the Regional Workshop on Commodity Export Diversification and Poverty Reduction in South and South-East Asia. Bangkok, rganized by UNCTAD in cooperation with ESCAP.
Soh, A. C. & Goh, K. J. (2002). Elevating the National Oil Palm Productivity– Breeding and Agronomic R&D Aspects. Presented at the Seminar on Transfer of Technology, Elevating the National Productivity of Oil Palm and Recent Progress on Peat and Ganoderma, Equatorial Hotel, Bangi, Selangor. 2002, 6-7 May.
Shamsudin, M. N., Fatimah, M.A., & Fauziah, A. H. (1997). The Effect of Export Duty Liberalization on the Malaysain Palm Oil Industry. Malaysian Oil Science and Technology, 6(2), 79 – 82.
Shamsudin, M. N, Arshad, F. M., Mohamed, Z. A. & Lubis, A. R. (1994). A Market Model for Malaysian Palm Oil Industry. The Malaysian Journal of Agricultural Economics. 11(1), 81-102.
Enhancing Supply Chain Connectivity and Competitiveness of Malaysian Agriculture Products: Identifying Chokepoints and Opportunities for Improvement
66
Syslo, K., Chang, J., Chee A. L., Hoshino, T., Kawakami, J., Sundareshan, S., Trimble, S., Tseng, E. (2011). APEC Supply Chain: Identifying Opportunities for Improvement. USD Marshal Research Team. University of Southern.
Tai Shzee Yew, Kusairi M. N., Nik Mustapha R. A., & Ishak O. (2007). Chapter 22, Fisheries Sector Development. Fatimah M. A. et al. (Eds), 50 Years of Malaysian Agriculture: Transformational Issues, Challenges and Direction. Universiti Putra Malaysia. 510-552.
United Nations Comtrade. (2013). United Nations Commodity Trade Statistics Database. Statistics Division. Retrieved on 2013, March 7 from http://comtrade.un.org/
Wing-Keong Ng, Chik-Boon Koh, Kumar Sudesh & Abdullah Siti-Zahrah. (2009). Effects of Dietary Organic Acids on Growth, Nutrient Digestibility and Gut Microflora of Red Hybrid Tilapia, Oreochromis sp., and Subsequent Survival during a Challenge Test with Streptococcus agalactiae. Aquaculture Research, 40, 1490-1500.
World Bank’s Connecting to Compete Report 2012. Retrieved from http://siteresources.worldbank.org/TRADE/Resources/239070-1336654966193/LPI_2012_final.pdf
World Economic Forum’s Global Enabling Trade Report, 2010. Retrieved from http://www.weforum.org/reports/global-enabling-trade-report-2010.
World Economic Forum’s Global Enabling Trade Report, 2012. Retrieved from http://www.weforum.org/reports/global-enabling-trade-report-2012.
World Rainforest Movement. (2010). The “Greening” of a Shady Business – Roundtable for Sustainable Palm Oil.
WWF Malaysia. (2009). Value of the Fisheries Sector in the Malaysian Economy. Final Report submitted by PE Research.
WWF (2013). Assessment of Fisheries and Marine Ecosystems in Peninsular Malaysia. Final Report submitted by PE Research.
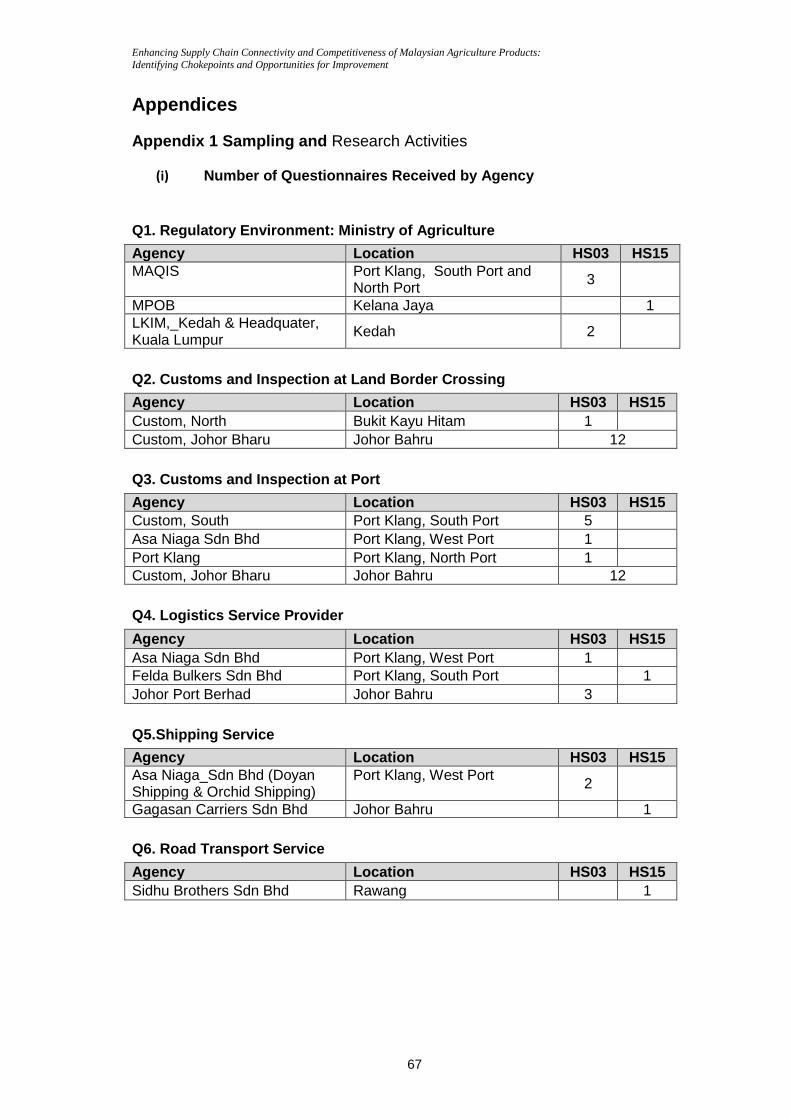
Enhancing Supply Chain Connectivity and Competitiveness of Malaysian Agriculture Products: Identifying Chokepoints and Opportunities for Improvement
67
Appendices Appendix 1 Sampling and Research Activities
(i) Number of Questionnaires Received by Agency
Q1. Regulatory Environment: Ministry of Agriculture
Agency Location HS03 HS15 MAQIS Port Klang, South Port and
North Port 3
MPOB Kelana Jaya 1 LKIM,_Kedah & Headquater, Kuala Lumpur Kedah 2
Q2. Customs and Inspection at Land Border Crossing
Agency Location HS03 HS15 Custom, North Bukit Kayu Hitam 1 Custom, Johor Bharu Johor Bahru 12
Q3. Customs and Inspection at Port
Agency Location HS03 HS15 Custom, South Port Klang, South Port 5 Asa Niaga Sdn Bhd Port Klang, West Port 1 Port Klang Port Klang, North Port 1 Custom, Johor Bharu Johor Bahru 12
Q4. Logistics Service Provider
Agency Location HS03 HS15 Asa Niaga Sdn Bhd Port Klang, West Port 1 Felda Bulkers Sdn Bhd Port Klang, South Port 1 Johor Port Berhad Johor Bahru 3
Q5.Shipping Service
Agency Location HS03 HS15 Asa Niaga_Sdn Bhd (Doyan Shipping & Orchid Shipping)
Port Klang, West Port 2
Gagasan Carriers Sdn Bhd Johor Bahru 1
Q6. Road Transport Service
Agency Location HS03 HS15 Sidhu Brothers Sdn Bhd Rawang 1
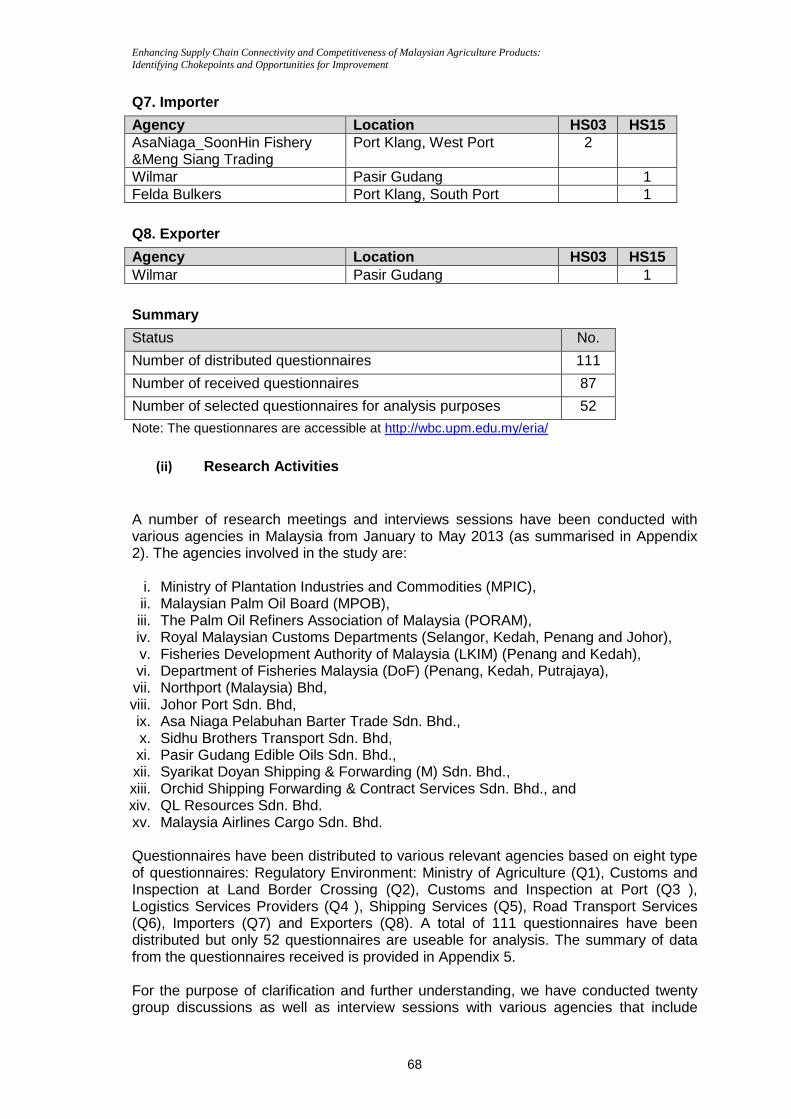
Enhancing Supply Chain Connectivity and Competitiveness of Malaysian Agriculture Products: Identifying Chokepoints and Opportunities for Improvement
68
Q7. Importer
Agency Location HS03 HS15 AsaNiaga_SoonHin Fishery &Meng Siang Trading
Port Klang, West Port 2
Wilmar Pasir Gudang 1 Felda Bulkers Port Klang, South Port 1
Q8. Exporter
Agency Location HS03 HS15 Wilmar Pasir Gudang 1
Summary
Status No.
Number of distributed questionnaires 111
Number of received questionnaires 87
Number of selected questionnaires for analysis purposes 52
Note: The questionnares are accessible at http://wbc.upm.edu.my/eria/
(ii) Research Activities
A number of research meetings and interviews sessions have been conducted with various agencies in Malaysia from January to May 2013 (as summarised in Appendix 2). The agencies involved in the study are:
i. Ministry of Plantation Industries and Commodities (MPIC), ii. Malaysian Palm Oil Board (MPOB), iii. The Palm Oil Refiners Association of Malaysia (PORAM), iv. Royal Malaysian Customs Departments (Selangor, Kedah, Penang and Johor), v. Fisheries Development Authority of Malaysia (LKIM) (Penang and Kedah), vi. Department of Fisheries Malaysia (DoF) (Penang, Kedah, Putrajaya), vii. Northport (Malaysia) Bhd, viii. Johor Port Sdn. Bhd, ix. Asa Niaga Pelabuhan Barter Trade Sdn. Bhd., x. Sidhu Brothers Transport Sdn. Bhd, xi. Pasir Gudang Edible Oils Sdn. Bhd., xii. Syarikat Doyan Shipping & Forwarding (M) Sdn. Bhd., xiii. Orchid Shipping Forwarding & Contract Services Sdn. Bhd., and xiv. QL Resources Sdn. Bhd. xv. Malaysia Airlines Cargo Sdn. Bhd. Questionnaires have been distributed to various relevant agencies based on eight type of questionnaires: Regulatory Environment: Ministry of Agriculture (Q1), Customs and Inspection at Land Border Crossing (Q2), Customs and Inspection at Port (Q3 ), Logistics Services Providers (Q4 ), Shipping Services (Q5), Road Transport Services (Q6), Importers (Q7) and Exporters (Q8). A total of 111 questionnaires have been distributed but only 52 questionnaires are useable for analysis. The summary of data from the questionnaires received is provided in Appendix 5. For the purpose of clarification and further understanding, we have conducted twenty group discussions as well as interview sessions with various agencies that include
Enhancing Supply Chain Connectivity and Competitiveness of Malaysian Agriculture Products: Identifying Chokepoints and Opportunities for Improvement
69
Malaysian Palm Oil Board, Department of Fisheries, Lembaga Kemajuan Ikan Malaysia (LKIM), Royal Malaysian Customs Departments, transportation services providers, logistics services providers, exporters and importers. The full list of research activities and list of contacts are presented in Appendix 2 and Appendix 3, respectively.
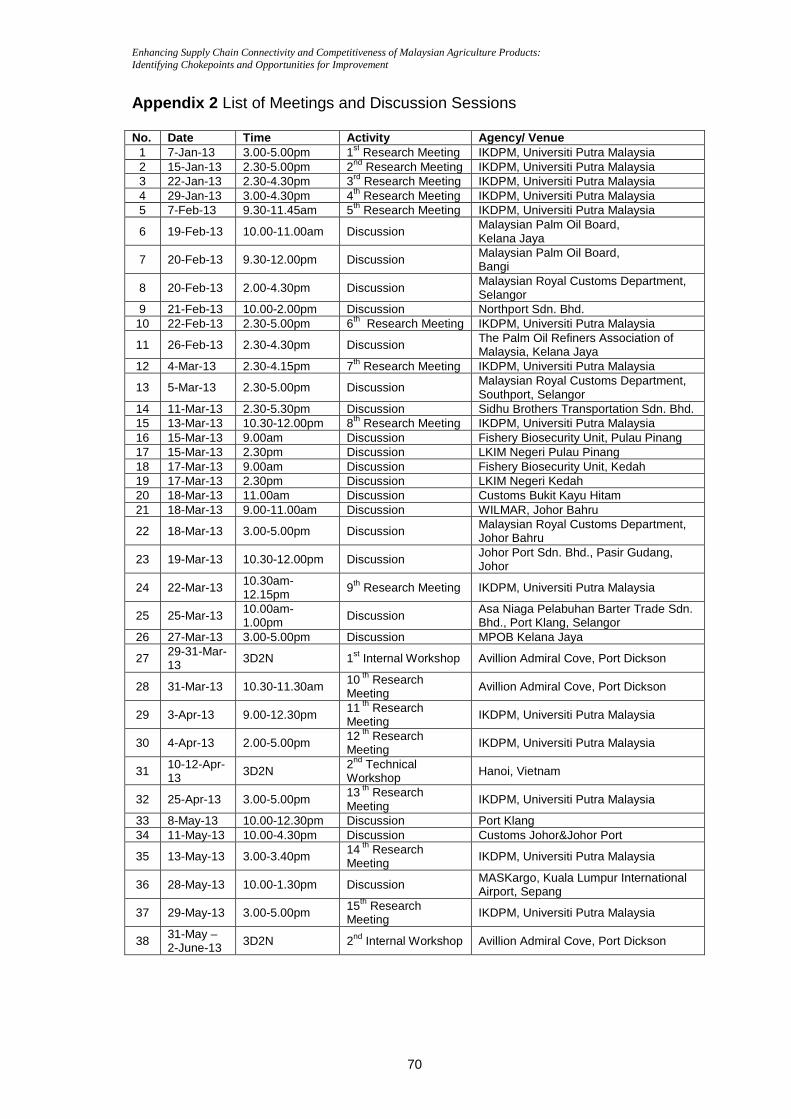
Enhancing Supply Chain Connectivity and Competitiveness of Malaysian Agriculture Products: Identifying Chokepoints and Opportunities for Improvement
70
Appendix 2 List of Meetings and Discussion Sessions No. Date Time Activity Agency/ Venue
1 7-Jan-13 3.00-5.00pm 1st Research Meeting IKDPM, Universiti Putra Malaysia 2 15-Jan-13 2.30-5.00pm 2nd Research Meeting IKDPM, Universiti Putra Malaysia 3 22-Jan-13 2.30-4.30pm 3rd Research Meeting IKDPM, Universiti Putra Malaysia 4 29-Jan-13 3.00-4.30pm 4th Research Meeting IKDPM, Universiti Putra Malaysia 5 7-Feb-13 9.30-11.45am 5th Research Meeting IKDPM, Universiti Putra Malaysia
6 19-Feb-13 10.00-11.00am Discussion Malaysian Palm Oil Board, Kelana Jaya
7 20-Feb-13 9.30-12.00pm Discussion Malaysian Palm Oil Board, Bangi
8 20-Feb-13 2.00-4.30pm Discussion Malaysian Royal Customs Department, Selangor
9 21-Feb-13 10.00-2.00pm Discussion Northport Sdn. Bhd. 10 22-Feb-13 2.30-5.00pm 6th Research Meeting IKDPM, Universiti Putra Malaysia
11 26-Feb-13 2.30-4.30pm Discussion The Palm Oil Refiners Association of Malaysia, Kelana Jaya
12 4-Mar-13 2.30-4.15pm 7th Research Meeting IKDPM, Universiti Putra Malaysia
13 5-Mar-13 2.30-5.00pm Discussion Malaysian Royal Customs Department, Southport, Selangor
14 11-Mar-13 2.30-5.30pm Discussion Sidhu Brothers Transportation Sdn. Bhd. 15 13-Mar-13 10.30-12.00pm 8th Research Meeting IKDPM, Universiti Putra Malaysia 16 15-Mar-13 9.00am Discussion Fishery Biosecurity Unit, Pulau Pinang 17 15-Mar-13 2.30pm Discussion LKIM Negeri Pulau Pinang 18 17-Mar-13 9.00am Discussion Fishery Biosecurity Unit, Kedah 19 17-Mar-13 2.30pm Discussion LKIM Negeri Kedah 20 18-Mar-13 11.00am Discussion Customs Bukit Kayu Hitam 21 18-Mar-13 9.00-11.00am Discussion WILMAR, Johor Bahru
22 18-Mar-13 3.00-5.00pm Discussion Malaysian Royal Customs Department, Johor Bahru
23 19-Mar-13 10.30-12.00pm Discussion Johor Port Sdn. Bhd., Pasir Gudang, Johor
24 22-Mar-13 10.30am-12.15pm 9th Research Meeting IKDPM, Universiti Putra Malaysia
25 25-Mar-13 10.00am-1.00pm Discussion Asa Niaga Pelabuhan Barter Trade Sdn.
Bhd., Port Klang, Selangor 26 27-Mar-13 3.00-5.00pm Discussion MPOB Kelana Jaya
27 29-31-Mar-13 3D2N 1st Internal Workshop Avillion Admiral Cove, Port Dickson
28 31-Mar-13 10.30-11.30am 10 th Research Meeting Avillion Admiral Cove, Port Dickson
29 3-Apr-13 9.00-12.30pm 11 th Research Meeting IKDPM, Universiti Putra Malaysia
30 4-Apr-13 2.00-5.00pm 12 th Research Meeting IKDPM, Universiti Putra Malaysia
31 10-12-Apr-13 3D2N 2nd Technical
Workshop Hanoi, Vietnam
32 25-Apr-13 3.00-5.00pm 13 th Research Meeting IKDPM, Universiti Putra Malaysia
33 8-May-13 10.00-12.30pm Discussion Port Klang 34 11-May-13 10.00-4.30pm Discussion Customs Johor&Johor Port
35 13-May-13 3.00-3.40pm 14 th Research Meeting IKDPM, Universiti Putra Malaysia
36 28-May-13 10.00-1.30pm Discussion MASKargo, Kuala Lumpur International Airport, Sepang
37 29-May-13 3.00-5.00pm 15th Research Meeting IKDPM, Universiti Putra Malaysia
38 31-May – 2-June-13 3D2N 2nd Internal Workshop Avillion Admiral Cove, Port Dickson
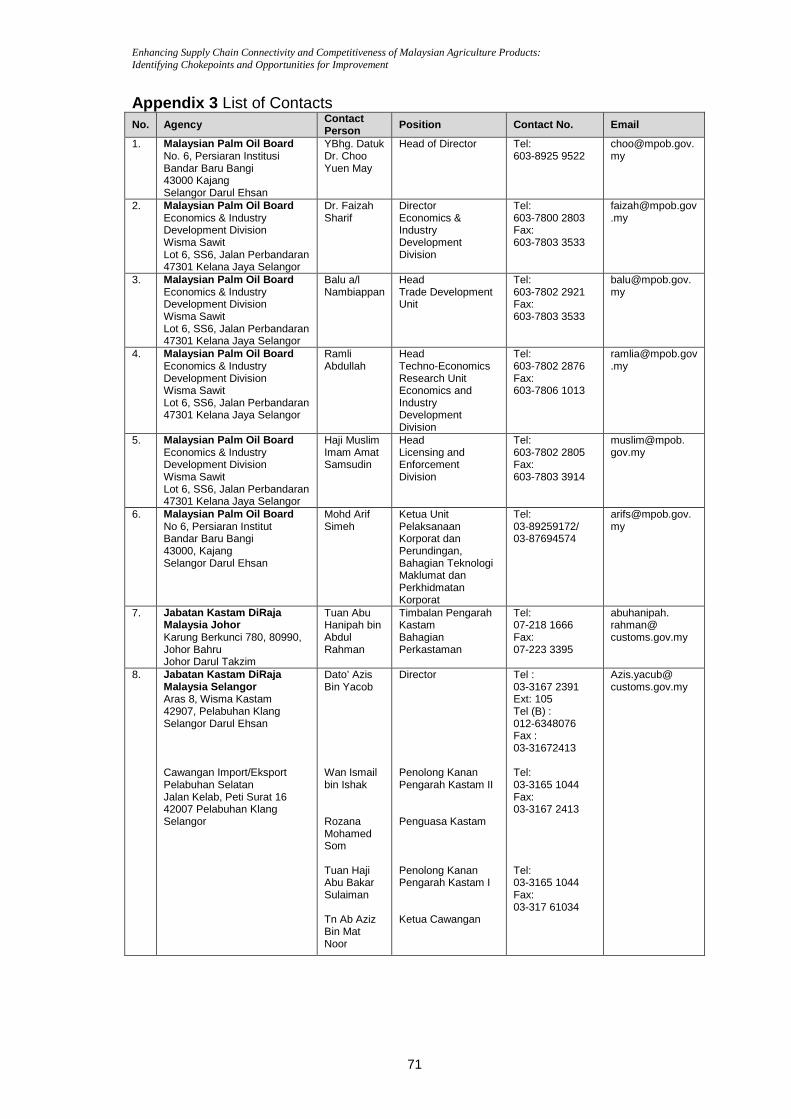
Enhancing Supply Chain Connectivity and Competitiveness of Malaysian Agriculture Products: Identifying Chokepoints and Opportunities for Improvement
71
Appendix 3 List of Contacts No. Agency Contact
Person Position Contact No. Email
1. Malaysian Palm Oil Board No. 6, Persiaran Institusi Bandar Baru Bangi 43000 Kajang Selangor Darul Ehsan
YBhg. Datuk Dr. Choo Yuen May
Head of Director Tel: 603-8925 9522
2. Malaysian Palm Oil Board Economics & Industry Development Division Wisma Sawit Lot 6, SS6, Jalan Perbandaran 47301 Kelana Jaya Selangor
Dr. Faizah Sharif
Director Economics & Industry Development Division
Tel: 603-7800 2803 Fax: 603-7803 3533
3. Malaysian Palm Oil Board Economics & Industry Development Division Wisma Sawit Lot 6, SS6, Jalan Perbandaran 47301 Kelana Jaya Selangor
Balu a/l Nambiappan
Head Trade Development Unit
Tel: 603-7802 2921 Fax: 603-7803 3533
4. Malaysian Palm Oil Board Economics & Industry Development Division Wisma Sawit Lot 6, SS6, Jalan Perbandaran 47301 Kelana Jaya Selangor
Ramli Abdullah
Head Techno-Economics Research Unit Economics and Industry Development Division
Tel: 603-7802 2876 Fax: 603-7806 1013
5. Malaysian Palm Oil Board Economics & Industry Development Division Wisma Sawit Lot 6, SS6, Jalan Perbandaran 47301 Kelana Jaya Selangor
Haji Muslim Imam Amat Samsudin
Head Licensing and Enforcement Division
Tel: 603-7802 2805 Fax: 603-7803 3914
muslim@mpob. gov.my
6. Malaysian Palm Oil Board No 6, Persiaran Institut Bandar Baru Bangi 43000, Kajang Selangor Darul Ehsan
Mohd Arif Simeh
Ketua Unit Pelaksanaan Korporat dan Perundingan, Bahagian Teknologi Maklumat dan Perkhidmatan Korporat
Tel: 03-89259172/ 03-87694574
7. Jabatan Kastam DiRaja Malaysia Johor Karung Berkunci 780, 80990, Johor Bahru Johor Darul Takzim
Tuan Abu Hanipah bin Abdul Rahman
Timbalan Pengarah Kastam Bahagian Perkastaman
Tel: 07-218 1666 Fax: 07-223 3395
abuhanipah. rahman@ customs.gov.my
8. Jabatan Kastam DiRaja Malaysia Selangor Aras 8, Wisma Kastam 42907, Pelabuhan Klang Selangor Darul Ehsan Cawangan Import/Eksport Pelabuhan Selatan Jalan Kelab, Peti Surat 16 42007 Pelabuhan Klang Selangor
Dato’ Azis Bin Yacob Wan Ismail bin Ishak Rozana Mohamed Som Tuan Haji Abu Bakar Sulaiman Tn Ab Aziz Bin Mat Noor
Director Penolong Kanan Pengarah Kastam II Penguasa Kastam Penolong Kanan Pengarah Kastam I Ketua Cawangan
Tel : 03-3167 2391 Ext: 105 Tel (B) : 012-6348076 Fax : 03-31672413 Tel: 03-3165 1044 Fax: 03-3167 2413 Tel: 03-3165 1044 Fax: 03-317 61034
Azis.yacub@ customs.gov.my
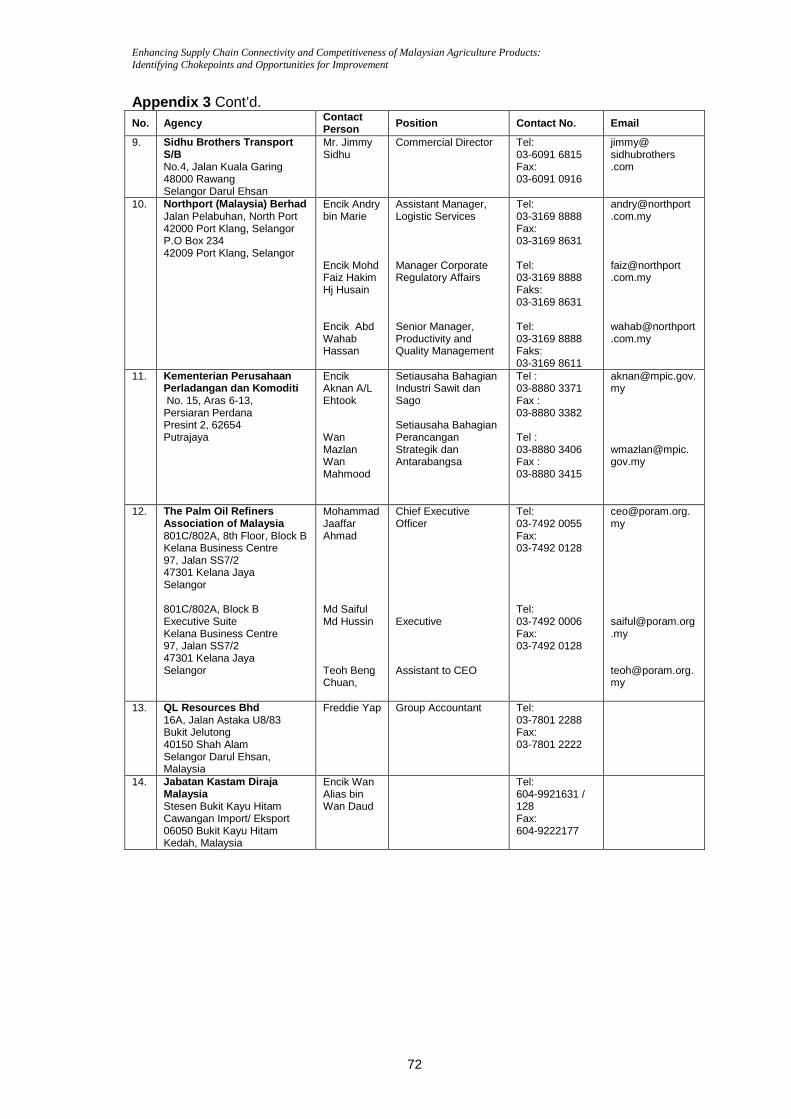
Enhancing Supply Chain Connectivity and Competitiveness of Malaysian Agriculture Products: Identifying Chokepoints and Opportunities for Improvement
72
Appendix 3 Cont’d. No. Agency Contact
Person Position Contact No. Email
9. Sidhu Brothers Transport S/B No.4, Jalan Kuala Garing 48000 Rawang Selangor Darul Ehsan
Mr. Jimmy Sidhu
Commercial Director Tel: 03-6091 6815 Fax: 03-6091 0916
jimmy@ sidhubrothers .com
10. Northport (Malaysia) Berhad Jalan Pelabuhan, North Port 42000 Port Klang, Selangor P.O Box 234 42009 Port Klang, Selangor
Encik Andry bin Marie Encik Mohd Faiz Hakim Hj Husain Encik Abd Wahab Hassan
Assistant Manager, Logistic Services Manager Corporate Regulatory Affairs Senior Manager, Productivity and Quality Management
Tel: 03-3169 8888 Fax: 03-3169 8631 Tel: 03-3169 8888 Faks: 03-3169 8631 Tel: 03-3169 8888 Faks: 03-3169 8611
andry@northport .com.my faiz@northport .com.my wahab@northport .com.my
11. Kementerian Perusahaan Perladangan dan Komoditi No. 15, Aras 6-13, Persiaran Perdana Presint 2, 62654 Putrajaya
Encik Aknan A/L Ehtook Wan Mazlan Wan Mahmood
Setiausaha Bahagian Industri Sawit dan Sago Setiausaha Bahagian Perancangan Strategik dan Antarabangsa
Tel : 03-8880 3371 Fax : 03-8880 3382 Tel : 03-8880 3406 Fax : 03-8880 3415
[email protected] wmazlan@mpic. gov.my
12. The Palm Oil Refiners Association of Malaysia 801C/802A, 8th Floor, Block B Kelana Business Centre 97, Jalan SS7/2 47301 Kelana Jaya Selangor 801C/802A, Block B Executive Suite Kelana Business Centre 97, Jalan SS7/2 47301 Kelana Jaya Selangor
Mohammad Jaaffar Ahmad Md Saiful Md Hussin Teoh Beng Chuan,
Chief Executive Officer Executive Assistant to CEO
Tel: 03-7492 0055 Fax: 03-7492 0128 Tel: 03-7492 0006 Fax: 03-7492 0128
[email protected] [email protected] [email protected]
13. QL Resources Bhd 16A, Jalan Astaka U8/83 Bukit Jelutong 40150 Shah Alam Selangor Darul Ehsan, Malaysia
Freddie Yap
Group Accountant Tel: 03-7801 2288 Fax: 03-7801 2222
14. Jabatan Kastam Diraja Malaysia Stesen Bukit Kayu Hitam Cawangan Import/ Eksport 06050 Bukit Kayu Hitam Kedah, Malaysia
Encik Wan Alias bin Wan Daud
Tel: 604-9921631 / 128 Fax: 604-9222177
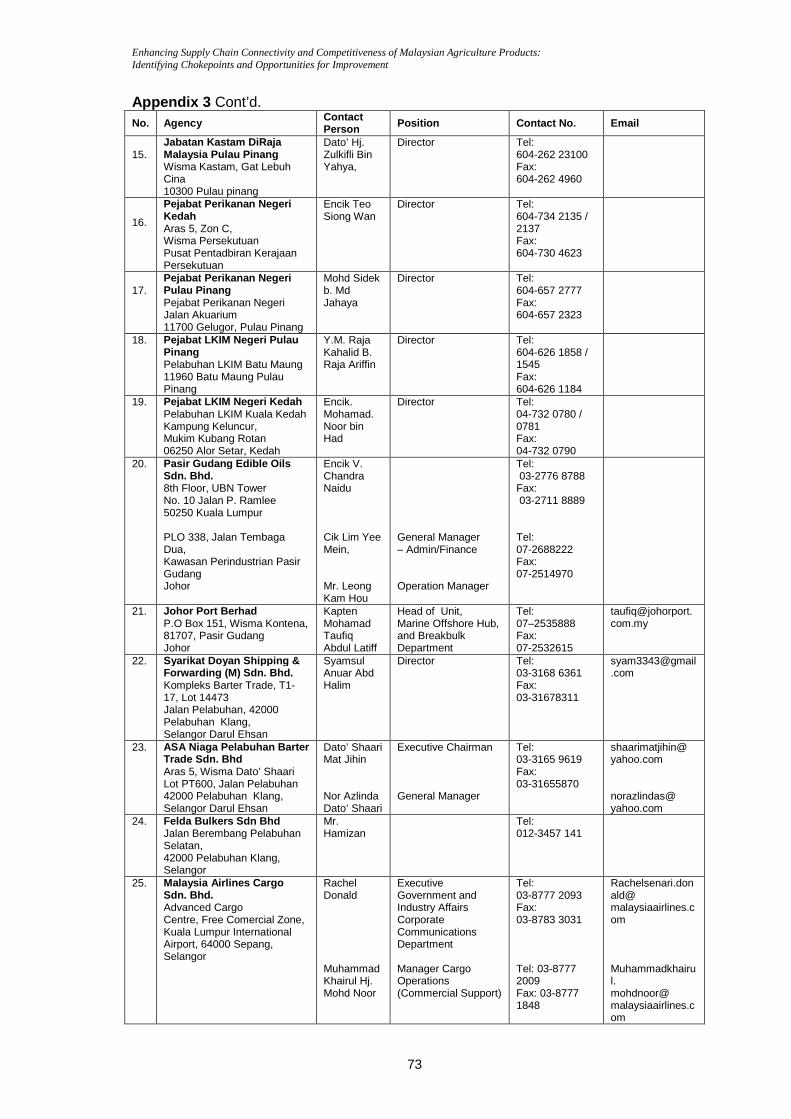
Enhancing Supply Chain Connectivity and Competitiveness of Malaysian Agriculture Products: Identifying Chokepoints and Opportunities for Improvement
73
Appendix 3 Cont’d. No. Agency Contact
Person Position Contact No. Email
15. 15.
Jabatan Kastam DiRaja Malaysia Pulau Pinang Wisma Kastam, Gat Lebuh Cina 10300 Pulau pinang
Dato’ Hj. Zulkifli Bin Yahya,
Director Tel: 604-262 23100 Fax: 604-262 4960
16. 16.
Pejabat Perikanan Negeri Kedah Aras 5, Zon C, Wisma Persekutuan Pusat Pentadbiran Kerajaan Persekutuan
Encik Teo Siong Wan
Director Tel: 604-734 2135 / 2137 Fax: 604-730 4623
17. 17.
Pejabat Perikanan Negeri Pulau Pinang Pejabat Perikanan Negeri Jalan Akuarium 11700 Gelugor, Pulau Pinang
Mohd Sidek b. Md Jahaya
Director Tel: 604-657 2777 Fax: 604-657 2323
18. 18.
Pejabat LKIM Negeri Pulau Pinang Pelabuhan LKIM Batu Maung 11960 Batu Maung Pulau Pinang
Y.M. Raja Kahalid B. Raja Ariffin
Director Tel: 604-626 1858 / 1545 Fax: 604-626 1184
19. Pejabat LKIM Negeri Kedah Pelabuhan LKIM Kuala Kedah Kampung Keluncur, Mukim Kubang Rotan 06250 Alor Setar, Kedah
Encik. Mohamad. Noor bin Had
Director Tel: 04-732 0780 / 0781 Fax: 04-732 0790
20. Pasir Gudang Edible Oils Sdn. Bhd. 8th Floor, UBN Tower No. 10 Jalan P. Ramlee 50250 Kuala Lumpur PLO 338, Jalan Tembaga Dua, Kawasan Perindustrian Pasir Gudang Johor
Encik V. Chandra Naidu Cik Lim Yee Mein, Mr. Leong Kam Hou
General Manager – Admin/Finance Operation Manager
Tel: 03-2776 8788 Fax: 03-2711 8889 Tel: 07-2688222 Fax: 07-2514970
21. Johor Port Berhad P.O Box 151, Wisma Kontena, 81707, Pasir Gudang Johor
Kapten Mohamad Taufiq Abdul Latiff
Head of Unit, Marine Offshore Hub, and Breakbulk Department
Tel: 07–2535888 Fax: 07-2532615
taufiq@johorport. com.my
22. Syarikat Doyan Shipping & Forwarding (M) Sdn. Bhd. Kompleks Barter Trade, T1-17, Lot 14473 Jalan Pelabuhan, 42000 Pelabuhan Klang, Selangor Darul Ehsan
Syamsul Anuar Abd Halim
Director Tel: 03-3168 6361 Fax: 03-31678311
23. ASA Niaga Pelabuhan Barter Trade Sdn. Bhd Aras 5, Wisma Dato’ Shaari Lot PT600, Jalan Pelabuhan 42000 Pelabuhan Klang, Selangor Darul Ehsan
Dato’ Shaari Mat Jihin Nor Azlinda Dato’ Shaari
Executive Chairman General Manager
Tel: 03-3165 9619 Fax: 03-31655870
shaarimatjihin@ yahoo.com norazlindas@ yahoo.com
24. Felda Bulkers Sdn Bhd Jalan Berembang Pelabuhan Selatan, 42000 Pelabuhan Klang, Selangor
Mr. Hamizan
Tel: 012-3457 141
25. Malaysia Airlines Cargo Sdn. Bhd. Advanced Cargo Centre, Free Comercial Zone, Kuala Lumpur International Airport, 64000 Sepang, Selangor
Rachel Donald Muhammad Khairul Hj. Mohd Noor
Executive Government and Industry Affairs Corporate Communications Department Manager Cargo Operations (Commercial Support)
Tel: 03-8777 2093 Fax: 03-8783 3031 Tel: 03-8777 2009 Fax: 03-8777 1848
Rachelsenari.donald@ malaysiaairlines.com Muhammadkhairul. mohdnoor@ malaysiaairlines.com
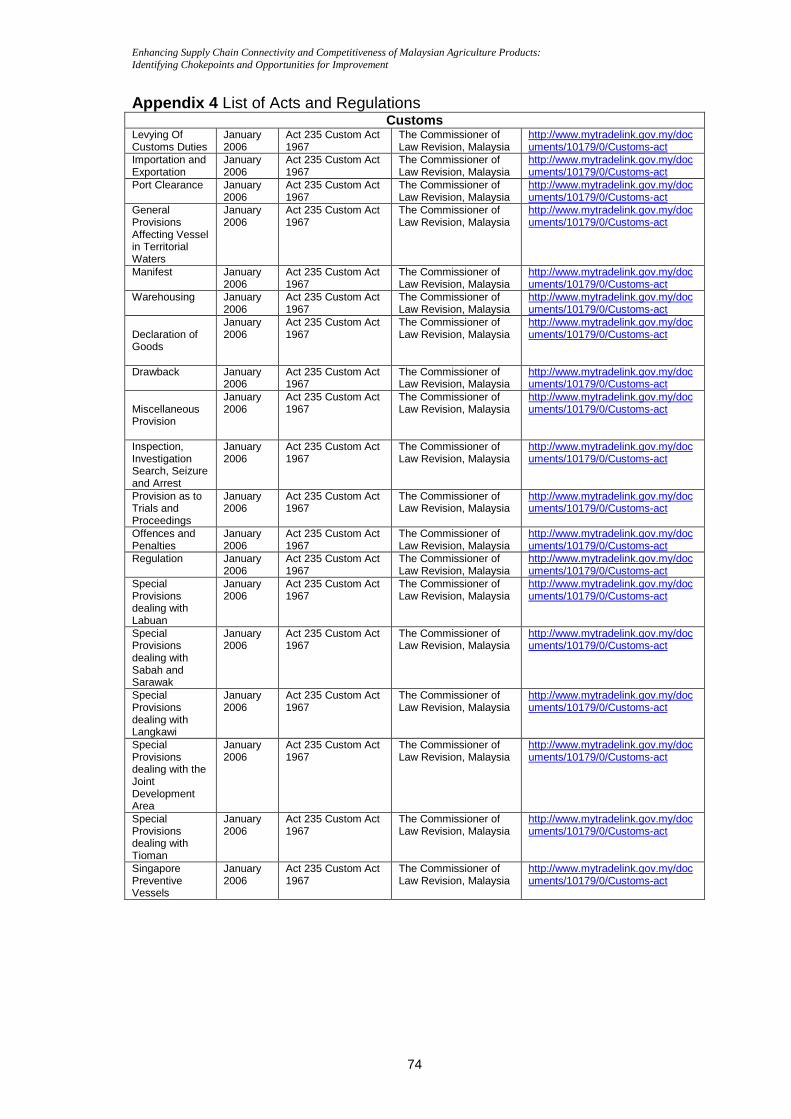
Enhancing Supply Chain Connectivity and Competitiveness of Malaysian Agriculture Products: Identifying Chokepoints and Opportunities for Improvement
74
Appendix 4 List of Acts and Regulations Customs
Levying Of Customs Duties
January 2006
Act 235 Custom Act 1967
The Commissioner of Law Revision, Malaysia
http://www.mytradelink.gov.my/documents/10179/0/Customs-act
Importation and Exportation
January 2006
Act 235 Custom Act 1967
The Commissioner of Law Revision, Malaysia
http://www.mytradelink.gov.my/documents/10179/0/Customs-act
Port Clearance January 2006
Act 235 Custom Act 1967
The Commissioner of Law Revision, Malaysia
http://www.mytradelink.gov.my/documents/10179/0/Customs-act
General Provisions Affecting Vessel in Territorial Waters
January 2006
Act 235 Custom Act 1967
The Commissioner of Law Revision, Malaysia
http://www.mytradelink.gov.my/documents/10179/0/Customs-act
Manifest January 2006
Act 235 Custom Act 1967
The Commissioner of Law Revision, Malaysia
http://www.mytradelink.gov.my/documents/10179/0/Customs-act
Warehousing January 2006
Act 235 Custom Act 1967
The Commissioner of Law Revision, Malaysia
http://www.mytradelink.gov.my/documents/10179/0/Customs-act
Declaration of Goods
January 2006
Act 235 Custom Act 1967
The Commissioner of Law Revision, Malaysia
http://www.mytradelink.gov.my/documents/10179/0/Customs-act
Drawback January 2006
Act 235 Custom Act 1967
The Commissioner of Law Revision, Malaysia
http://www.mytradelink.gov.my/documents/10179/0/Customs-act
Miscellaneous Provision
January 2006
Act 235 Custom Act 1967
The Commissioner of Law Revision, Malaysia
http://www.mytradelink.gov.my/documents/10179/0/Customs-act
Inspection, Investigation Search, Seizure and Arrest
January 2006
Act 235 Custom Act 1967
The Commissioner of Law Revision, Malaysia
http://www.mytradelink.gov.my/documents/10179/0/Customs-act
Provision as to Trials and Proceedings
January 2006
Act 235 Custom Act 1967
The Commissioner of Law Revision, Malaysia
http://www.mytradelink.gov.my/documents/10179/0/Customs-act
Offences and Penalties
January 2006
Act 235 Custom Act 1967
The Commissioner of Law Revision, Malaysia
http://www.mytradelink.gov.my/documents/10179/0/Customs-act
Regulation January 2006
Act 235 Custom Act 1967
The Commissioner of Law Revision, Malaysia
http://www.mytradelink.gov.my/documents/10179/0/Customs-act
Special Provisions dealing with Labuan
January 2006
Act 235 Custom Act 1967
The Commissioner of Law Revision, Malaysia
http://www.mytradelink.gov.my/documents/10179/0/Customs-act
Special Provisions dealing with Sabah and Sarawak
January 2006
Act 235 Custom Act 1967
The Commissioner of Law Revision, Malaysia
http://www.mytradelink.gov.my/documents/10179/0/Customs-act
Special Provisions dealing with Langkawi
January 2006
Act 235 Custom Act 1967
The Commissioner of Law Revision, Malaysia
http://www.mytradelink.gov.my/documents/10179/0/Customs-act
Special Provisions dealing with the Joint Development Area
January 2006
Act 235 Custom Act 1967
The Commissioner of Law Revision, Malaysia
http://www.mytradelink.gov.my/documents/10179/0/Customs-act
Special Provisions dealing with Tioman
January 2006
Act 235 Custom Act 1967
The Commissioner of Law Revision, Malaysia
http://www.mytradelink.gov.my/documents/10179/0/Customs-act
Singapore Preventive Vessels
January 2006
Act 235 Custom Act 1967
The Commissioner of Law Revision, Malaysia
http://www.mytradelink.gov.my/documents/10179/0/Customs-act
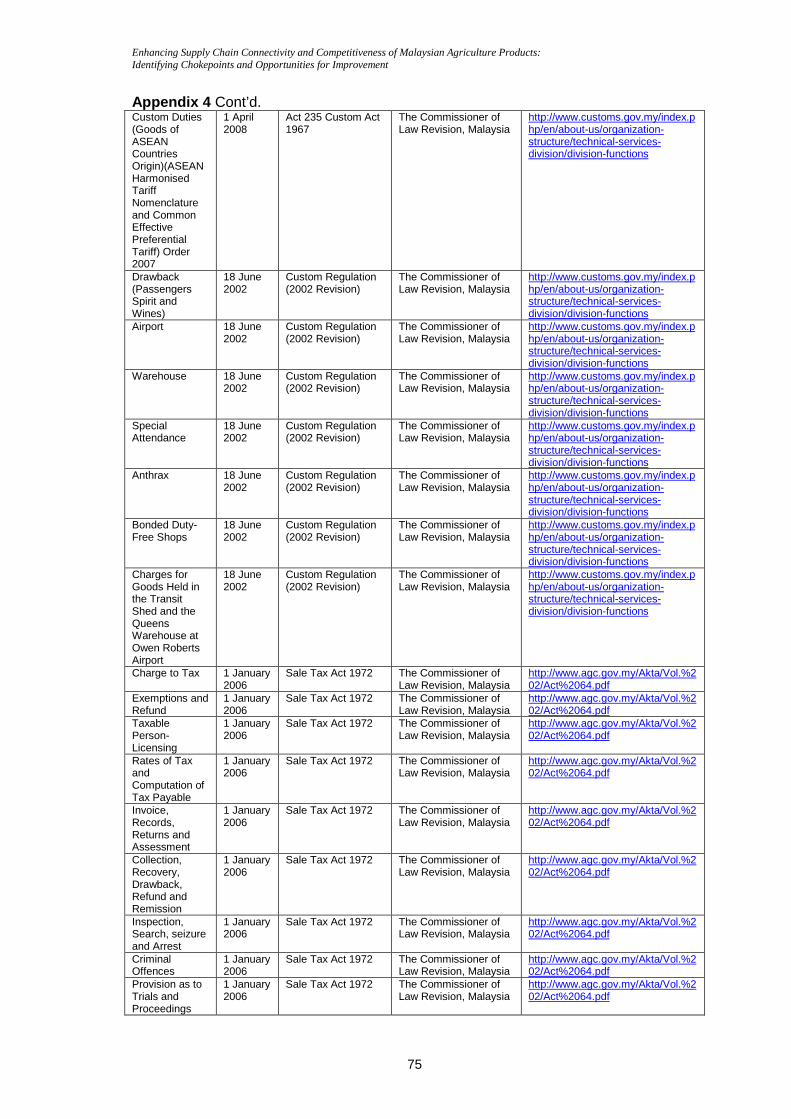
Enhancing Supply Chain Connectivity and Competitiveness of Malaysian Agriculture Products: Identifying Chokepoints and Opportunities for Improvement
75
Appendix 4 Cont’d. Custom Duties (Goods of ASEAN Countries Origin)(ASEAN Harmonised Tariff Nomenclature and Common Effective Preferential Tariff) Order 2007
1 April 2008
Act 235 Custom Act 1967
The Commissioner of Law Revision, Malaysia
http://www.customs.gov.my/index.php/en/about-us/organization-structure/technical-services-division/division-functions
Drawback (Passengers Spirit and Wines)
18 June 2002
Custom Regulation (2002 Revision)
The Commissioner of Law Revision, Malaysia
http://www.customs.gov.my/index.php/en/about-us/organization-structure/technical-services-division/division-functions
Airport 18 June 2002
Custom Regulation (2002 Revision)
The Commissioner of Law Revision, Malaysia
http://www.customs.gov.my/index.php/en/about-us/organization-structure/technical-services-division/division-functions
Warehouse 18 June 2002
Custom Regulation (2002 Revision)
The Commissioner of Law Revision, Malaysia
http://www.customs.gov.my/index.php/en/about-us/organization-structure/technical-services-division/division-functions
Special Attendance
18 June 2002
Custom Regulation (2002 Revision)
The Commissioner of Law Revision, Malaysia
http://www.customs.gov.my/index.php/en/about-us/organization-structure/technical-services-division/division-functions
Anthrax 18 June 2002
Custom Regulation (2002 Revision)
The Commissioner of Law Revision, Malaysia
http://www.customs.gov.my/index.php/en/about-us/organization-structure/technical-services-division/division-functions
Bonded Duty-Free Shops
18 June 2002
Custom Regulation (2002 Revision)
The Commissioner of Law Revision, Malaysia
http://www.customs.gov.my/index.php/en/about-us/organization-structure/technical-services-division/division-functions
Charges for Goods Held in the Transit Shed and the Queens Warehouse at Owen Roberts Airport
18 June 2002
Custom Regulation (2002 Revision)
The Commissioner of Law Revision, Malaysia
http://www.customs.gov.my/index.php/en/about-us/organization-structure/technical-services-division/division-functions
Charge to Tax 1 January 2006
Sale Tax Act 1972 The Commissioner of Law Revision, Malaysia
http://www.agc.gov.my/Akta/Vol.%202/Act%2064.pdf
Exemptions and Refund
1 January 2006
Sale Tax Act 1972 The Commissioner of Law Revision, Malaysia
http://www.agc.gov.my/Akta/Vol.%202/Act%2064.pdf
Taxable Person-Licensing
1 January 2006
Sale Tax Act 1972 The Commissioner of Law Revision, Malaysia
http://www.agc.gov.my/Akta/Vol.%202/Act%2064.pdf
Rates of Tax and Computation of Tax Payable
1 January 2006
Sale Tax Act 1972 The Commissioner of Law Revision, Malaysia
http://www.agc.gov.my/Akta/Vol.%202/Act%2064.pdf
Invoice, Records, Returns and Assessment
1 January 2006
Sale Tax Act 1972 The Commissioner of Law Revision, Malaysia
http://www.agc.gov.my/Akta/Vol.%202/Act%2064.pdf
Collection, Recovery, Drawback, Refund and Remission
1 January 2006
Sale Tax Act 1972 The Commissioner of Law Revision, Malaysia
http://www.agc.gov.my/Akta/Vol.%202/Act%2064.pdf
Inspection, Search, seizure and Arrest
1 January 2006
Sale Tax Act 1972 The Commissioner of Law Revision, Malaysia
http://www.agc.gov.my/Akta/Vol.%202/Act%2064.pdf
Criminal Offences
1 January 2006
Sale Tax Act 1972 The Commissioner of Law Revision, Malaysia
http://www.agc.gov.my/Akta/Vol.%202/Act%2064.pdf
Provision as to Trials and Proceedings
1 January 2006
Sale Tax Act 1972 The Commissioner of Law Revision, Malaysia
http://www.agc.gov.my/Akta/Vol.%202/Act%2064.pdf
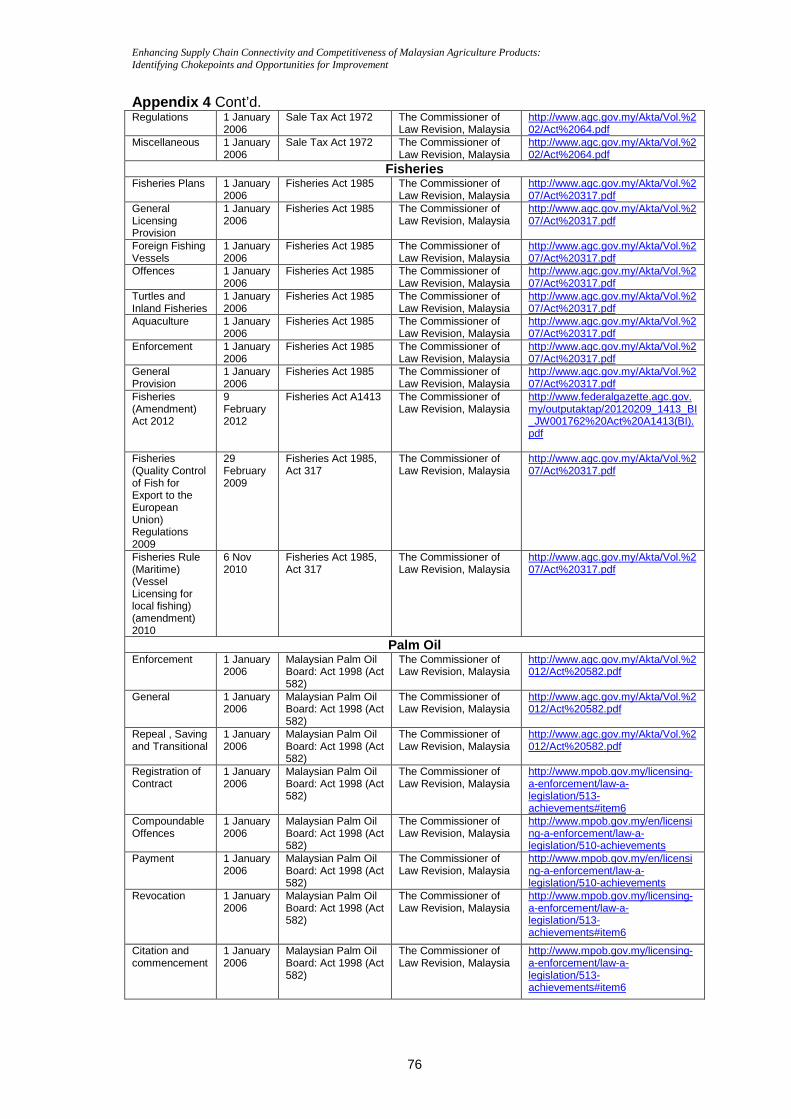
Enhancing Supply Chain Connectivity and Competitiveness of Malaysian Agriculture Products: Identifying Chokepoints and Opportunities for Improvement
76
Appendix 4 Cont’d. Regulations 1 January
2006 Sale Tax Act 1972 The Commissioner of
Law Revision, Malaysia http://www.agc.gov.my/Akta/Vol.%202/Act%2064.pdf
Miscellaneous 1 January 2006
Sale Tax Act 1972 The Commissioner of Law Revision, Malaysia
http://www.agc.gov.my/Akta/Vol.%202/Act%2064.pdf
Fisheries Fisheries Plans 1 January
2006 Fisheries Act 1985 The Commissioner of
Law Revision, Malaysia http://www.agc.gov.my/Akta/Vol.%207/Act%20317.pdf
General Licensing Provision
1 January 2006
Fisheries Act 1985 The Commissioner of Law Revision, Malaysia
http://www.agc.gov.my/Akta/Vol.%207/Act%20317.pdf
Foreign Fishing Vessels
1 January 2006
Fisheries Act 1985 The Commissioner of Law Revision, Malaysia
http://www.agc.gov.my/Akta/Vol.%207/Act%20317.pdf
Offences 1 January 2006
Fisheries Act 1985 The Commissioner of Law Revision, Malaysia
http://www.agc.gov.my/Akta/Vol.%207/Act%20317.pdf
Turtles and Inland Fisheries
1 January 2006
Fisheries Act 1985 The Commissioner of Law Revision, Malaysia
http://www.agc.gov.my/Akta/Vol.%207/Act%20317.pdf
Aquaculture 1 January 2006
Fisheries Act 1985 The Commissioner of Law Revision, Malaysia
http://www.agc.gov.my/Akta/Vol.%207/Act%20317.pdf
Enforcement
1 January 2006
Fisheries Act 1985 The Commissioner of Law Revision, Malaysia
http://www.agc.gov.my/Akta/Vol.%207/Act%20317.pdf
General Provision
1 January 2006
Fisheries Act 1985 The Commissioner of Law Revision, Malaysia
http://www.agc.gov.my/Akta/Vol.%207/Act%20317.pdf
Fisheries (Amendment) Act 2012
9 February 2012
Fisheries Act A1413 The Commissioner of Law Revision, Malaysia
http://www.federalgazette.agc.gov.my/outputaktap/20120209_1413_BI_JW001762%20Act%20A1413(BI).pdf
Fisheries (Quality Control of Fish for Export to the European Union) Regulations 2009
29 February 2009
Fisheries Act 1985, Act 317
The Commissioner of Law Revision, Malaysia
http://www.agc.gov.my/Akta/Vol.%207/Act%20317.pdf
Fisheries Rule (Maritime) (Vessel Licensing for local fishing) (amendment) 2010
6 Nov 2010
Fisheries Act 1985, Act 317
The Commissioner of Law Revision, Malaysia
http://www.agc.gov.my/Akta/Vol.%207/Act%20317.pdf
Palm Oil Enforcement 1 January
2006 Malaysian Palm Oil Board: Act 1998 (Act 582)
The Commissioner of Law Revision, Malaysia
http://www.agc.gov.my/Akta/Vol.%2012/Act%20582.pdf
General 1 January 2006
Malaysian Palm Oil Board: Act 1998 (Act 582)
The Commissioner of Law Revision, Malaysia
http://www.agc.gov.my/Akta/Vol.%2012/Act%20582.pdf
Repeal , Saving and Transitional
1 January 2006
Malaysian Palm Oil Board: Act 1998 (Act 582)
The Commissioner of Law Revision, Malaysia
http://www.agc.gov.my/Akta/Vol.%2012/Act%20582.pdf
Registration of Contract
1 January 2006
Malaysian Palm Oil Board: Act 1998 (Act 582)
The Commissioner of Law Revision, Malaysia
http://www.mpob.gov.my/licensing-a-enforcement/law-a-legislation/513-achievements#item6
Compoundable Offences
1 January 2006
Malaysian Palm Oil Board: Act 1998 (Act 582)
The Commissioner of Law Revision, Malaysia
http://www.mpob.gov.my/en/licensing-a-enforcement/law-a-legislation/510-achievements
Payment 1 January 2006
Malaysian Palm Oil Board: Act 1998 (Act 582)
The Commissioner of Law Revision, Malaysia
http://www.mpob.gov.my/en/licensing-a-enforcement/law-a-legislation/510-achievements
Revocation 1 January 2006
Malaysian Palm Oil Board: Act 1998 (Act 582)
The Commissioner of Law Revision, Malaysia
http://www.mpob.gov.my/licensing-a-enforcement/law-a-legislation/513-achievements#item6
Citation and commencement
1 January 2006
Malaysian Palm Oil Board: Act 1998 (Act 582)
The Commissioner of Law Revision, Malaysia
http://www.mpob.gov.my/licensing-a-enforcement/law-a-legislation/513-achievements#item6
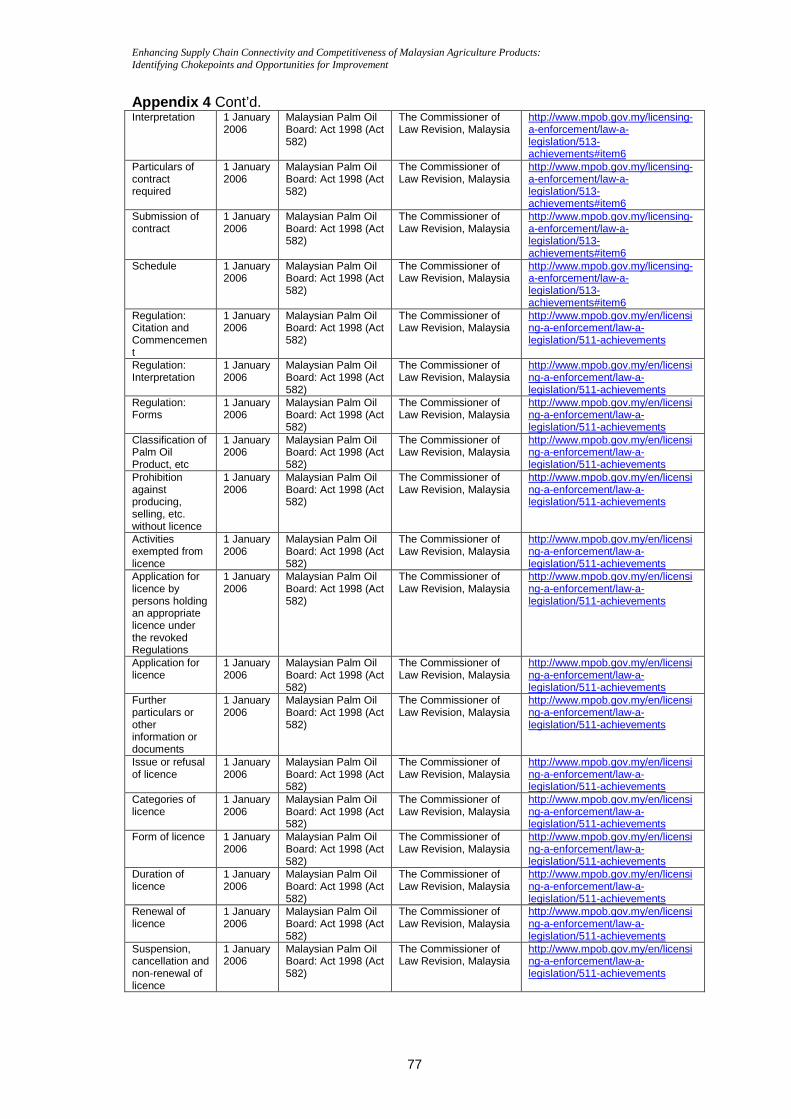
Enhancing Supply Chain Connectivity and Competitiveness of Malaysian Agriculture Products: Identifying Chokepoints and Opportunities for Improvement
77
Appendix 4 Cont’d. Interpretation 1 January
2006 Malaysian Palm Oil Board: Act 1998 (Act 582)
The Commissioner of Law Revision, Malaysia
http://www.mpob.gov.my/licensing-a-enforcement/law-a-legislation/513-achievements#item6
Particulars of contract required
1 January 2006
Malaysian Palm Oil Board: Act 1998 (Act 582)
The Commissioner of Law Revision, Malaysia
http://www.mpob.gov.my/licensing-a-enforcement/law-a-legislation/513-achievements#item6
Submission of contract
1 January 2006
Malaysian Palm Oil Board: Act 1998 (Act 582)
The Commissioner of Law Revision, Malaysia
http://www.mpob.gov.my/licensing-a-enforcement/law-a-legislation/513-achievements#item6
Schedule 1 January 2006
Malaysian Palm Oil Board: Act 1998 (Act 582)
The Commissioner of Law Revision, Malaysia
http://www.mpob.gov.my/licensing-a-enforcement/law-a-legislation/513-achievements#item6
Regulation: Citation and Commencement
1 January 2006
Malaysian Palm Oil Board: Act 1998 (Act 582)
The Commissioner of Law Revision, Malaysia
http://www.mpob.gov.my/en/licensing-a-enforcement/law-a-legislation/511-achievements
Regulation: Interpretation
1 January 2006
Malaysian Palm Oil Board: Act 1998 (Act 582)
The Commissioner of Law Revision, Malaysia
http://www.mpob.gov.my/en/licensing-a-enforcement/law-a-legislation/511-achievements
Regulation: Forms
1 January 2006
Malaysian Palm Oil Board: Act 1998 (Act 582)
The Commissioner of Law Revision, Malaysia
http://www.mpob.gov.my/en/licensing-a-enforcement/law-a-legislation/511-achievements
Classification of Palm Oil Product, etc
1 January 2006
Malaysian Palm Oil Board: Act 1998 (Act 582)
The Commissioner of Law Revision, Malaysia
http://www.mpob.gov.my/en/licensing-a-enforcement/law-a-legislation/511-achievements
Prohibition against producing, selling, etc. without licence
1 January 2006
Malaysian Palm Oil Board: Act 1998 (Act 582)
The Commissioner of Law Revision, Malaysia
http://www.mpob.gov.my/en/licensing-a-enforcement/law-a-legislation/511-achievements
Activities exempted from licence
1 January 2006
Malaysian Palm Oil Board: Act 1998 (Act 582)
The Commissioner of Law Revision, Malaysia
http://www.mpob.gov.my/en/licensing-a-enforcement/law-a-legislation/511-achievements
Application for licence by persons holding an appropriate licence under the revoked Regulations
1 January 2006
Malaysian Palm Oil Board: Act 1998 (Act 582)
The Commissioner of Law Revision, Malaysia
http://www.mpob.gov.my/en/licensing-a-enforcement/law-a-legislation/511-achievements
Application for licence
1 January 2006
Malaysian Palm Oil Board: Act 1998 (Act 582)
The Commissioner of Law Revision, Malaysia
http://www.mpob.gov.my/en/licensing-a-enforcement/law-a-legislation/511-achievements
Further particulars or other information or documents
1 January 2006
Malaysian Palm Oil Board: Act 1998 (Act 582)
The Commissioner of Law Revision, Malaysia
http://www.mpob.gov.my/en/licensing-a-enforcement/law-a-legislation/511-achievements
Issue or refusal of licence
1 January 2006
Malaysian Palm Oil Board: Act 1998 (Act 582)
The Commissioner of Law Revision, Malaysia
http://www.mpob.gov.my/en/licensing-a-enforcement/law-a-legislation/511-achievements
Categories of licence
1 January 2006
Malaysian Palm Oil Board: Act 1998 (Act 582)
The Commissioner of Law Revision, Malaysia
http://www.mpob.gov.my/en/licensing-a-enforcement/law-a-legislation/511-achievements
Form of licence 1 January 2006
Malaysian Palm Oil Board: Act 1998 (Act 582)
The Commissioner of Law Revision, Malaysia
http://www.mpob.gov.my/en/licensing-a-enforcement/law-a-legislation/511-achievements
Duration of licence
1 January 2006
Malaysian Palm Oil Board: Act 1998 (Act 582)
The Commissioner of Law Revision, Malaysia
http://www.mpob.gov.my/en/licensing-a-enforcement/law-a-legislation/511-achievements
Renewal of licence
1 January 2006
Malaysian Palm Oil Board: Act 1998 (Act 582)
The Commissioner of Law Revision, Malaysia
http://www.mpob.gov.my/en/licensing-a-enforcement/law-a-legislation/511-achievements
Suspension, cancellation and non-renewal of licence
1 January 2006
Malaysian Palm Oil Board: Act 1998 (Act 582)
The Commissioner of Law Revision, Malaysia
http://www.mpob.gov.my/en/licensing-a-enforcement/law-a-legislation/511-achievements
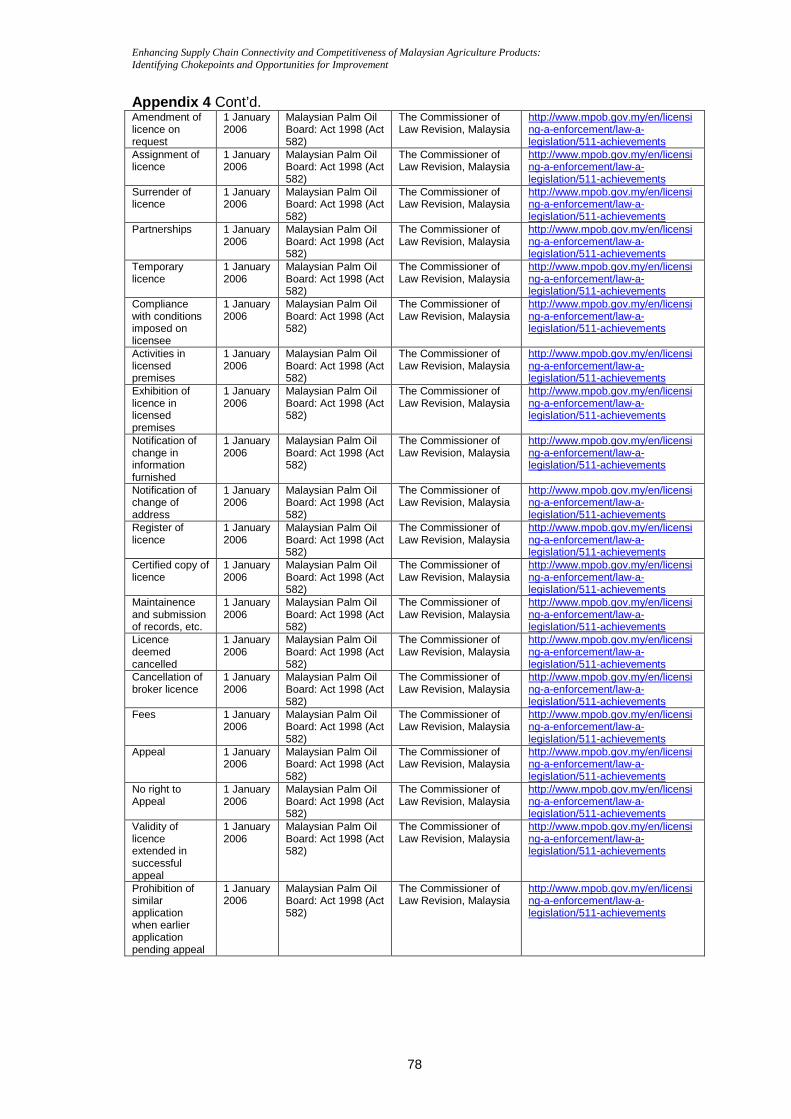
Enhancing Supply Chain Connectivity and Competitiveness of Malaysian Agriculture Products: Identifying Chokepoints and Opportunities for Improvement
78
Appendix 4 Cont’d. Amendment of licence on request
1 January 2006
Malaysian Palm Oil Board: Act 1998 (Act 582)
The Commissioner of Law Revision, Malaysia
http://www.mpob.gov.my/en/licensing-a-enforcement/law-a-legislation/511-achievements
Assignment of licence
1 January 2006
Malaysian Palm Oil Board: Act 1998 (Act 582)
The Commissioner of Law Revision, Malaysia
http://www.mpob.gov.my/en/licensing-a-enforcement/law-a-legislation/511-achievements
Surrender of licence
1 January 2006
Malaysian Palm Oil Board: Act 1998 (Act 582)
The Commissioner of Law Revision, Malaysia
http://www.mpob.gov.my/en/licensing-a-enforcement/law-a-legislation/511-achievements
Partnerships 1 January 2006
Malaysian Palm Oil Board: Act 1998 (Act 582)
The Commissioner of Law Revision, Malaysia
http://www.mpob.gov.my/en/licensing-a-enforcement/law-a-legislation/511-achievements
Temporary licence
1 January 2006
Malaysian Palm Oil Board: Act 1998 (Act 582)
The Commissioner of Law Revision, Malaysia
http://www.mpob.gov.my/en/licensing-a-enforcement/law-a-legislation/511-achievements
Compliance with conditions imposed on licensee
1 January 2006
Malaysian Palm Oil Board: Act 1998 (Act 582)
The Commissioner of Law Revision, Malaysia
http://www.mpob.gov.my/en/licensing-a-enforcement/law-a-legislation/511-achievements
Activities in licensed premises
1 January 2006
Malaysian Palm Oil Board: Act 1998 (Act 582)
The Commissioner of Law Revision, Malaysia
http://www.mpob.gov.my/en/licensing-a-enforcement/law-a-legislation/511-achievements
Exhibition of licence in licensed premises
1 January 2006
Malaysian Palm Oil Board: Act 1998 (Act 582)
The Commissioner of Law Revision, Malaysia
http://www.mpob.gov.my/en/licensing-a-enforcement/law-a-legislation/511-achievements
Notification of change in information furnished
1 January 2006
Malaysian Palm Oil Board: Act 1998 (Act 582)
The Commissioner of Law Revision, Malaysia
http://www.mpob.gov.my/en/licensing-a-enforcement/law-a-legislation/511-achievements
Notification of change of address
1 January 2006
Malaysian Palm Oil Board: Act 1998 (Act 582)
The Commissioner of Law Revision, Malaysia
http://www.mpob.gov.my/en/licensing-a-enforcement/law-a-legislation/511-achievements
Register of licence
1 January 2006
Malaysian Palm Oil Board: Act 1998 (Act 582)
The Commissioner of Law Revision, Malaysia
http://www.mpob.gov.my/en/licensing-a-enforcement/law-a-legislation/511-achievements
Certified copy of licence
1 January 2006
Malaysian Palm Oil Board: Act 1998 (Act 582)
The Commissioner of Law Revision, Malaysia
http://www.mpob.gov.my/en/licensing-a-enforcement/law-a-legislation/511-achievements
Maintainence and submission of records, etc.
1 January 2006
Malaysian Palm Oil Board: Act 1998 (Act 582)
The Commissioner of Law Revision, Malaysia
http://www.mpob.gov.my/en/licensing-a-enforcement/law-a-legislation/511-achievements
Licence deemed cancelled
1 January 2006
Malaysian Palm Oil Board: Act 1998 (Act 582)
The Commissioner of Law Revision, Malaysia
http://www.mpob.gov.my/en/licensing-a-enforcement/law-a-legislation/511-achievements
Cancellation of broker licence
1 January 2006
Malaysian Palm Oil Board: Act 1998 (Act 582)
The Commissioner of Law Revision, Malaysia
http://www.mpob.gov.my/en/licensing-a-enforcement/law-a-legislation/511-achievements
Fees 1 January 2006
Malaysian Palm Oil Board: Act 1998 (Act 582)
The Commissioner of Law Revision, Malaysia
http://www.mpob.gov.my/en/licensing-a-enforcement/law-a-legislation/511-achievements
Appeal 1 January 2006
Malaysian Palm Oil Board: Act 1998 (Act 582)
The Commissioner of Law Revision, Malaysia
http://www.mpob.gov.my/en/licensing-a-enforcement/law-a-legislation/511-achievements
No right to Appeal
1 January 2006
Malaysian Palm Oil Board: Act 1998 (Act 582)
The Commissioner of Law Revision, Malaysia
http://www.mpob.gov.my/en/licensing-a-enforcement/law-a-legislation/511-achievements
Validity of licence extended in successful appeal
1 January 2006
Malaysian Palm Oil Board: Act 1998 (Act 582)
The Commissioner of Law Revision, Malaysia
http://www.mpob.gov.my/en/licensing-a-enforcement/law-a-legislation/511-achievements
Prohibition of similar application when earlier application pending appeal
1 January 2006
Malaysian Palm Oil Board: Act 1998 (Act 582)
The Commissioner of Law Revision, Malaysia
http://www.mpob.gov.my/en/licensing-a-enforcement/law-a-legislation/511-achievements
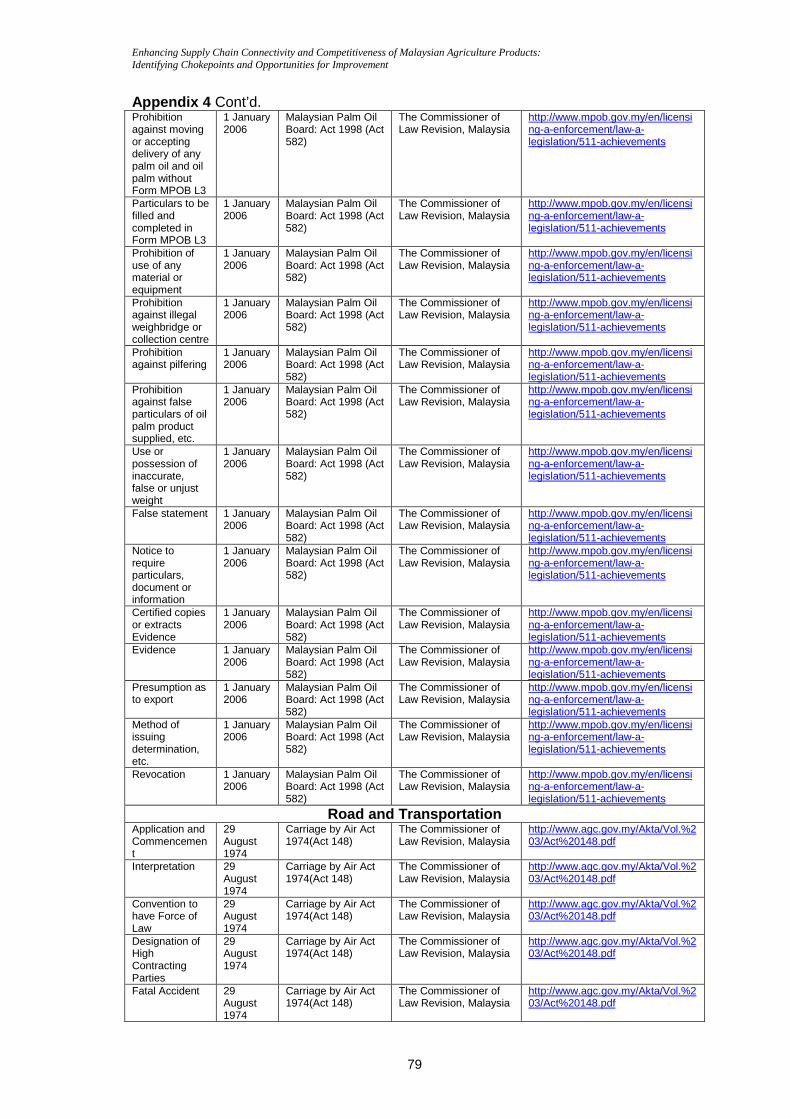
Enhancing Supply Chain Connectivity and Competitiveness of Malaysian Agriculture Products: Identifying Chokepoints and Opportunities for Improvement
79
Appendix 4 Cont’d. Prohibition against moving or accepting delivery of any palm oil and oil palm without Form MPOB L3
1 January 2006
Malaysian Palm Oil Board: Act 1998 (Act 582)
The Commissioner of Law Revision, Malaysia
http://www.mpob.gov.my/en/licensing-a-enforcement/law-a-legislation/511-achievements
Particulars to be filled and completed in Form MPOB L3
1 January 2006
Malaysian Palm Oil Board: Act 1998 (Act 582)
The Commissioner of Law Revision, Malaysia
http://www.mpob.gov.my/en/licensing-a-enforcement/law-a-legislation/511-achievements
Prohibition of use of any material or equipment
1 January 2006
Malaysian Palm Oil Board: Act 1998 (Act 582)
The Commissioner of Law Revision, Malaysia
http://www.mpob.gov.my/en/licensing-a-enforcement/law-a-legislation/511-achievements
Prohibition against illegal weighbridge or collection centre
1 January 2006
Malaysian Palm Oil Board: Act 1998 (Act 582)
The Commissioner of Law Revision, Malaysia
http://www.mpob.gov.my/en/licensing-a-enforcement/law-a-legislation/511-achievements
Prohibition against pilfering
1 January 2006
Malaysian Palm Oil Board: Act 1998 (Act 582)
The Commissioner of Law Revision, Malaysia
http://www.mpob.gov.my/en/licensing-a-enforcement/law-a-legislation/511-achievements
Prohibition against false particulars of oil palm product supplied, etc.
1 January 2006
Malaysian Palm Oil Board: Act 1998 (Act 582)
The Commissioner of Law Revision, Malaysia
http://www.mpob.gov.my/en/licensing-a-enforcement/law-a-legislation/511-achievements
Use or possession of inaccurate, false or unjust weight
1 January 2006
Malaysian Palm Oil Board: Act 1998 (Act 582)
The Commissioner of Law Revision, Malaysia
http://www.mpob.gov.my/en/licensing-a-enforcement/law-a-legislation/511-achievements
False statement 1 January 2006
Malaysian Palm Oil Board: Act 1998 (Act 582)
The Commissioner of Law Revision, Malaysia
http://www.mpob.gov.my/en/licensing-a-enforcement/law-a-legislation/511-achievements
Notice to require particulars, document or information
1 January 2006
Malaysian Palm Oil Board: Act 1998 (Act 582)
The Commissioner of Law Revision, Malaysia
http://www.mpob.gov.my/en/licensing-a-enforcement/law-a-legislation/511-achievements
Certified copies or extracts Evidence
1 January 2006
Malaysian Palm Oil Board: Act 1998 (Act 582)
The Commissioner of Law Revision, Malaysia
http://www.mpob.gov.my/en/licensing-a-enforcement/law-a-legislation/511-achievements
Evidence 1 January 2006
Malaysian Palm Oil Board: Act 1998 (Act 582)
The Commissioner of Law Revision, Malaysia
http://www.mpob.gov.my/en/licensing-a-enforcement/law-a-legislation/511-achievements
Presumption as to export
1 January 2006
Malaysian Palm Oil Board: Act 1998 (Act 582)
The Commissioner of Law Revision, Malaysia
http://www.mpob.gov.my/en/licensing-a-enforcement/law-a-legislation/511-achievements
Method of issuing determination, etc.
1 January 2006
Malaysian Palm Oil Board: Act 1998 (Act 582)
The Commissioner of Law Revision, Malaysia
http://www.mpob.gov.my/en/licensing-a-enforcement/law-a-legislation/511-achievements
Revocation 1 January 2006
Malaysian Palm Oil Board: Act 1998 (Act 582)
The Commissioner of Law Revision, Malaysia
http://www.mpob.gov.my/en/licensing-a-enforcement/law-a-legislation/511-achievements
Road and Transportation Application and Commencement
29 August 1974
Carriage by Air Act 1974(Act 148)
The Commissioner of Law Revision, Malaysia
http://www.agc.gov.my/Akta/Vol.%203/Act%20148.pdf
Interpretation 29 August 1974
Carriage by Air Act 1974(Act 148)
The Commissioner of Law Revision, Malaysia
http://www.agc.gov.my/Akta/Vol.%203/Act%20148.pdf
Convention to have Force of Law
29 August 1974
Carriage by Air Act 1974(Act 148)
The Commissioner of Law Revision, Malaysia
http://www.agc.gov.my/Akta/Vol.%203/Act%20148.pdf
Designation of High Contracting Parties
29 August 1974
Carriage by Air Act 1974(Act 148)
The Commissioner of Law Revision, Malaysia
http://www.agc.gov.my/Akta/Vol.%203/Act%20148.pdf
Fatal Accident 29 August 1974
Carriage by Air Act 1974(Act 148)
The Commissioner of Law Revision, Malaysia
http://www.agc.gov.my/Akta/Vol.%203/Act%20148.pdf
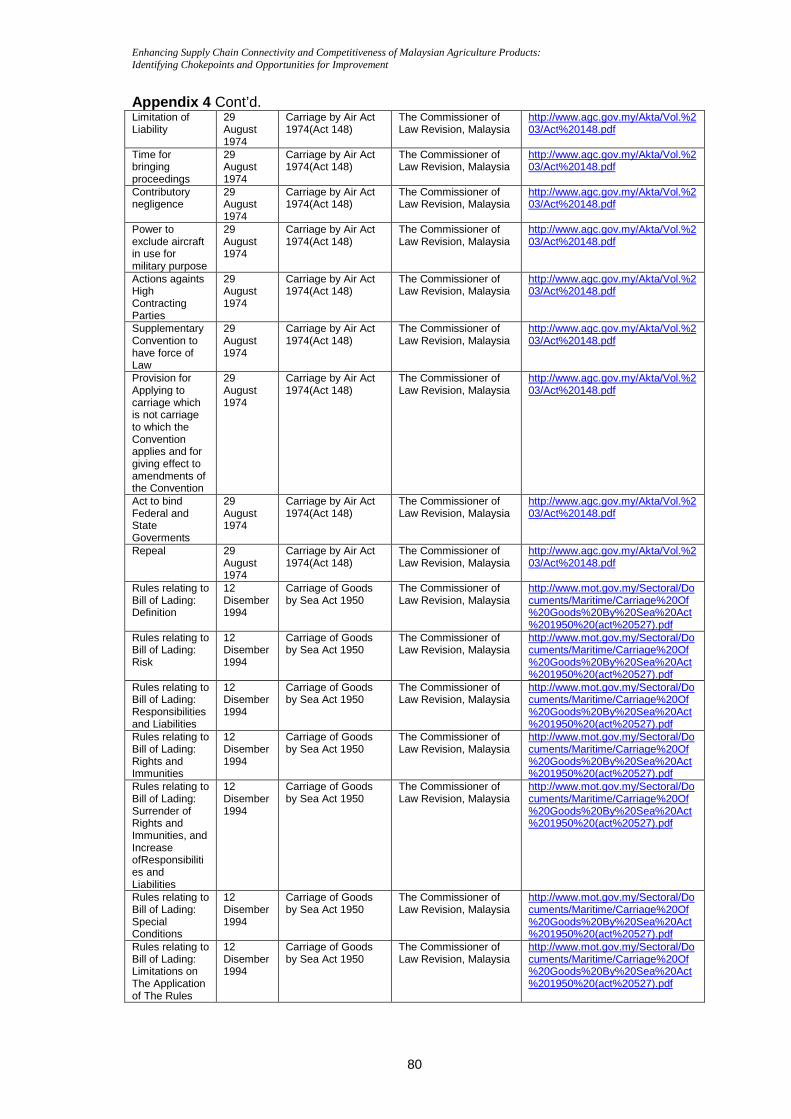
Enhancing Supply Chain Connectivity and Competitiveness of Malaysian Agriculture Products: Identifying Chokepoints and Opportunities for Improvement
80
Appendix 4 Cont’d. Limitation of Liability
29 August 1974
Carriage by Air Act 1974(Act 148)
The Commissioner of Law Revision, Malaysia
http://www.agc.gov.my/Akta/Vol.%203/Act%20148.pdf
Time for bringing proceedings
29 August 1974
Carriage by Air Act 1974(Act 148)
The Commissioner of Law Revision, Malaysia
http://www.agc.gov.my/Akta/Vol.%203/Act%20148.pdf
Contributory negligence
29 August 1974
Carriage by Air Act 1974(Act 148)
The Commissioner of Law Revision, Malaysia
http://www.agc.gov.my/Akta/Vol.%203/Act%20148.pdf
Power to exclude aircraft in use for military purpose
29 August 1974
Carriage by Air Act 1974(Act 148)
The Commissioner of Law Revision, Malaysia
http://www.agc.gov.my/Akta/Vol.%203/Act%20148.pdf
Actions againts High Contracting Parties
29 August 1974
Carriage by Air Act 1974(Act 148)
The Commissioner of Law Revision, Malaysia
http://www.agc.gov.my/Akta/Vol.%203/Act%20148.pdf
Supplementary Convention to have force of Law
29 August 1974
Carriage by Air Act 1974(Act 148)
The Commissioner of Law Revision, Malaysia
http://www.agc.gov.my/Akta/Vol.%203/Act%20148.pdf
Provision for Applying to carriage which is not carriage to which the Convention applies and for giving effect to amendments of the Convention
29 August 1974
Carriage by Air Act 1974(Act 148)
The Commissioner of Law Revision, Malaysia
http://www.agc.gov.my/Akta/Vol.%203/Act%20148.pdf
Act to bind Federal and State Goverments
29 August 1974
Carriage by Air Act 1974(Act 148)
The Commissioner of Law Revision, Malaysia
http://www.agc.gov.my/Akta/Vol.%203/Act%20148.pdf
Repeal 29 August 1974
Carriage by Air Act 1974(Act 148)
The Commissioner of Law Revision, Malaysia
http://www.agc.gov.my/Akta/Vol.%203/Act%20148.pdf
Rules relating to Bill of Lading: Definition
12 Disember 1994
Carriage of Goods by Sea Act 1950
The Commissioner of Law Revision, Malaysia
http://www.mot.gov.my/Sectoral/Documents/Maritime/Carriage%20Of%20Goods%20By%20Sea%20Act%201950%20(act%20527).pdf
Rules relating to Bill of Lading: Risk
12 Disember 1994
Carriage of Goods by Sea Act 1950
The Commissioner of Law Revision, Malaysia
http://www.mot.gov.my/Sectoral/Documents/Maritime/Carriage%20Of%20Goods%20By%20Sea%20Act%201950%20(act%20527).pdf
Rules relating to Bill of Lading: Responsibilities and Liabilities
12 Disember 1994
Carriage of Goods by Sea Act 1950
The Commissioner of Law Revision, Malaysia
http://www.mot.gov.my/Sectoral/Documents/Maritime/Carriage%20Of%20Goods%20By%20Sea%20Act%201950%20(act%20527).pdf
Rules relating to Bill of Lading: Rights and Immunities
12 Disember 1994
Carriage of Goods by Sea Act 1950
The Commissioner of Law Revision, Malaysia
http://www.mot.gov.my/Sectoral/Documents/Maritime/Carriage%20Of%20Goods%20By%20Sea%20Act%201950%20(act%20527).pdf
Rules relating to Bill of Lading: Surrender of Rights and Immunities, and Increase ofResponsibilities and Liabilities
12 Disember 1994
Carriage of Goods by Sea Act 1950
The Commissioner of Law Revision, Malaysia
http://www.mot.gov.my/Sectoral/Documents/Maritime/Carriage%20Of%20Goods%20By%20Sea%20Act%201950%20(act%20527).pdf
Rules relating to Bill of Lading: Special Conditions
12 Disember 1994
Carriage of Goods by Sea Act 1950
The Commissioner of Law Revision, Malaysia
http://www.mot.gov.my/Sectoral/Documents/Maritime/Carriage%20Of%20Goods%20By%20Sea%20Act%201950%20(act%20527).pdf
Rules relating to Bill of Lading: Limitations on The Application of The Rules
12 Disember 1994
Carriage of Goods by Sea Act 1950
The Commissioner of Law Revision, Malaysia
http://www.mot.gov.my/Sectoral/Documents/Maritime/Carriage%20Of%20Goods%20By%20Sea%20Act%201950%20(act%20527).pdf
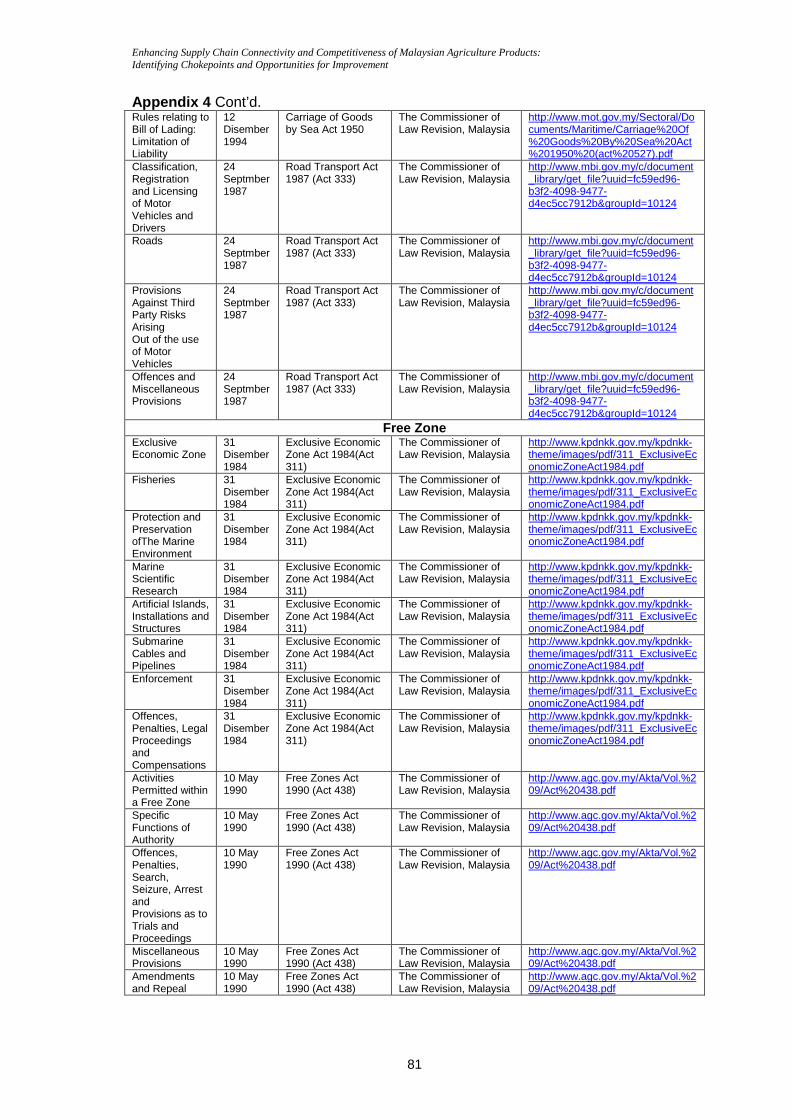
Enhancing Supply Chain Connectivity and Competitiveness of Malaysian Agriculture Products: Identifying Chokepoints and Opportunities for Improvement
81
Appendix 4 Cont’d. Rules relating to Bill of Lading: Limitation of Liability
12 Disember 1994
Carriage of Goods by Sea Act 1950
The Commissioner of Law Revision, Malaysia
http://www.mot.gov.my/Sectoral/Documents/Maritime/Carriage%20Of%20Goods%20By%20Sea%20Act%201950%20(act%20527).pdf
Classification, Registration and Licensing of Motor Vehicles and Drivers
24 Septmber 1987
Road Transport Act 1987 (Act 333)
The Commissioner of Law Revision, Malaysia
http://www.mbi.gov.my/c/document_library/get_file?uuid=fc59ed96-b3f2-4098-9477-d4ec5cc7912b&groupId=10124
Roads 24 Septmber 1987
Road Transport Act 1987 (Act 333)
The Commissioner of Law Revision, Malaysia
http://www.mbi.gov.my/c/document_library/get_file?uuid=fc59ed96-b3f2-4098-9477-d4ec5cc7912b&groupId=10124
Provisions Against Third Party Risks Arising Out of the use of Motor Vehicles
24 Septmber 1987
Road Transport Act 1987 (Act 333)
The Commissioner of Law Revision, Malaysia
http://www.mbi.gov.my/c/document_library/get_file?uuid=fc59ed96-b3f2-4098-9477-d4ec5cc7912b&groupId=10124
Offences and Miscellaneous Provisions
24 Septmber 1987
Road Transport Act 1987 (Act 333)
The Commissioner of Law Revision, Malaysia
http://www.mbi.gov.my/c/document_library/get_file?uuid=fc59ed96-b3f2-4098-9477-d4ec5cc7912b&groupId=10124
Free Zone Exclusive Economic Zone
31 Disember 1984
Exclusive Economic Zone Act 1984(Act 311)
The Commissioner of Law Revision, Malaysia
http://www.kpdnkk.gov.my/kpdnkk-theme/images/pdf/311_ExclusiveEconomicZoneAct1984.pdf
Fisheries 31 Disember 1984
Exclusive Economic Zone Act 1984(Act 311)
The Commissioner of Law Revision, Malaysia
http://www.kpdnkk.gov.my/kpdnkk-theme/images/pdf/311_ExclusiveEconomicZoneAct1984.pdf
Protection and Preservation ofThe Marine Environment
31 Disember 1984
Exclusive Economic Zone Act 1984(Act 311)
The Commissioner of Law Revision, Malaysia
http://www.kpdnkk.gov.my/kpdnkk-theme/images/pdf/311_ExclusiveEconomicZoneAct1984.pdf
Marine Scientific Research
31 Disember 1984
Exclusive Economic Zone Act 1984(Act 311)
The Commissioner of Law Revision, Malaysia
http://www.kpdnkk.gov.my/kpdnkk-theme/images/pdf/311_ExclusiveEconomicZoneAct1984.pdf
Artificial Islands, Installations and Structures
31 Disember 1984
Exclusive Economic Zone Act 1984(Act 311)
The Commissioner of Law Revision, Malaysia
http://www.kpdnkk.gov.my/kpdnkk-theme/images/pdf/311_ExclusiveEconomicZoneAct1984.pdf
Submarine Cables and Pipelines
31 Disember 1984
Exclusive Economic Zone Act 1984(Act 311)
The Commissioner of Law Revision, Malaysia
http://www.kpdnkk.gov.my/kpdnkk-theme/images/pdf/311_ExclusiveEconomicZoneAct1984.pdf
Enforcement 31 Disember 1984
Exclusive Economic Zone Act 1984(Act 311)
The Commissioner of Law Revision, Malaysia
http://www.kpdnkk.gov.my/kpdnkk-theme/images/pdf/311_ExclusiveEconomicZoneAct1984.pdf
Offences, Penalties, Legal Proceedings and Compensations
31 Disember 1984
Exclusive Economic Zone Act 1984(Act 311)
The Commissioner of Law Revision, Malaysia
http://www.kpdnkk.gov.my/kpdnkk-theme/images/pdf/311_ExclusiveEconomicZoneAct1984.pdf
Activities Permitted within a Free Zone
10 May 1990
Free Zones Act 1990 (Act 438)
The Commissioner of Law Revision, Malaysia
http://www.agc.gov.my/Akta/Vol.%209/Act%20438.pdf
Specific Functions of Authority
10 May 1990
Free Zones Act 1990 (Act 438)
The Commissioner of Law Revision, Malaysia
http://www.agc.gov.my/Akta/Vol.%209/Act%20438.pdf
Offences, Penalties, Search, Seizure, Arrest and Provisions as to Trials and Proceedings
10 May 1990
Free Zones Act 1990 (Act 438)
The Commissioner of Law Revision, Malaysia
http://www.agc.gov.my/Akta/Vol.%209/Act%20438.pdf
Miscellaneous Provisions
10 May 1990
Free Zones Act 1990 (Act 438)
The Commissioner of Law Revision, Malaysia
http://www.agc.gov.my/Akta/Vol.%209/Act%20438.pdf
Amendments and Repeal
10 May 1990
Free Zones Act 1990 (Act 438)
The Commissioner of Law Revision, Malaysia
http://www.agc.gov.my/Akta/Vol.%209/Act%20438.pdf
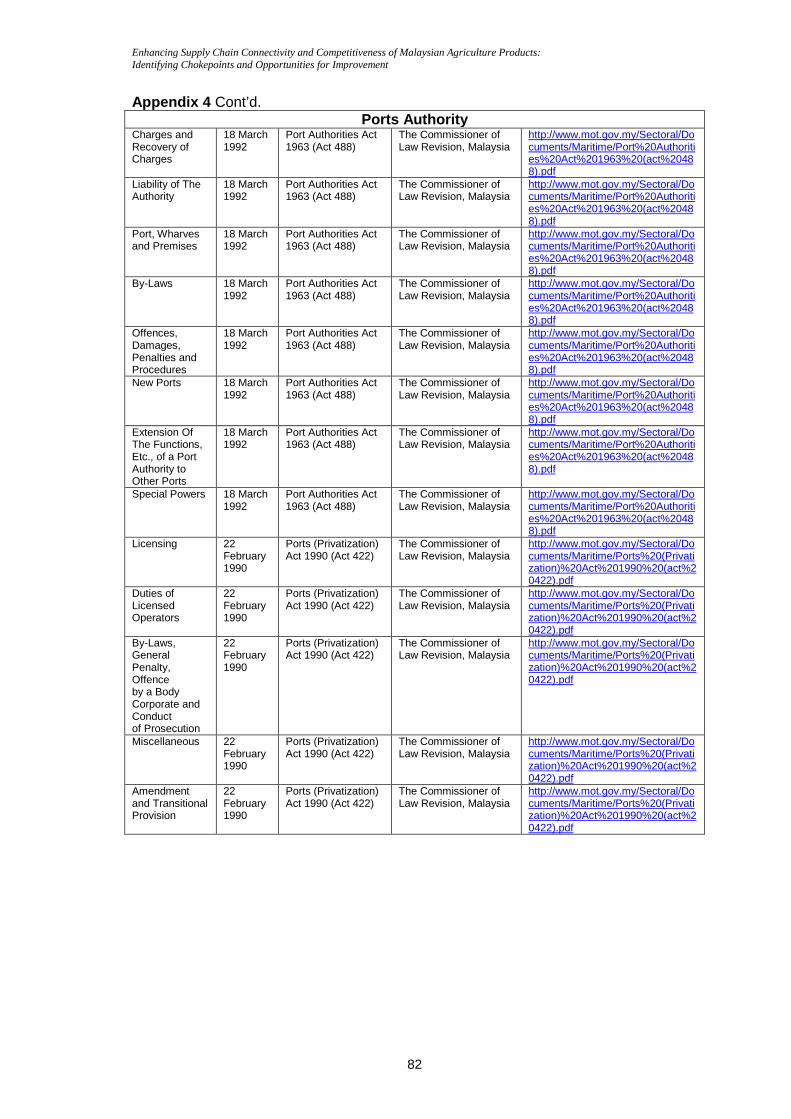
Enhancing Supply Chain Connectivity and Competitiveness of Malaysian Agriculture Products: Identifying Chokepoints and Opportunities for Improvement
82
Appendix 4 Cont’d. Ports Authority
Charges and Recovery of Charges
18 March 1992
Port Authorities Act 1963 (Act 488)
The Commissioner of Law Revision, Malaysia
http://www.mot.gov.my/Sectoral/Documents/Maritime/Port%20Authorities%20Act%201963%20(act%20488).pdf
Liability of The Authority
18 March 1992
Port Authorities Act 1963 (Act 488)
The Commissioner of Law Revision, Malaysia
http://www.mot.gov.my/Sectoral/Documents/Maritime/Port%20Authorities%20Act%201963%20(act%20488).pdf
Port, Wharves and Premises
18 March 1992
Port Authorities Act 1963 (Act 488)
The Commissioner of Law Revision, Malaysia
http://www.mot.gov.my/Sectoral/Documents/Maritime/Port%20Authorities%20Act%201963%20(act%20488).pdf
By-Laws 18 March 1992
Port Authorities Act 1963 (Act 488)
The Commissioner of Law Revision, Malaysia
http://www.mot.gov.my/Sectoral/Documents/Maritime/Port%20Authorities%20Act%201963%20(act%20488).pdf
Offences, Damages, Penalties and Procedures
18 March 1992
Port Authorities Act 1963 (Act 488)
The Commissioner of Law Revision, Malaysia
http://www.mot.gov.my/Sectoral/Documents/Maritime/Port%20Authorities%20Act%201963%20(act%20488).pdf
New Ports 18 March 1992
Port Authorities Act 1963 (Act 488)
The Commissioner of Law Revision, Malaysia
http://www.mot.gov.my/Sectoral/Documents/Maritime/Port%20Authorities%20Act%201963%20(act%20488).pdf
Extension Of The Functions, Etc., of a Port Authority to Other Ports
18 March 1992
Port Authorities Act 1963 (Act 488)
The Commissioner of Law Revision, Malaysia
http://www.mot.gov.my/Sectoral/Documents/Maritime/Port%20Authorities%20Act%201963%20(act%20488).pdf
Special Powers 18 March 1992
Port Authorities Act 1963 (Act 488)
The Commissioner of Law Revision, Malaysia
http://www.mot.gov.my/Sectoral/Documents/Maritime/Port%20Authorities%20Act%201963%20(act%20488).pdf
Licensing 22 February 1990
Ports (Privatization) Act 1990 (Act 422)
The Commissioner of Law Revision, Malaysia
http://www.mot.gov.my/Sectoral/Documents/Maritime/Ports%20(Privatization)%20Act%201990%20(act%20422).pdf
Duties of Licensed Operators
22 February 1990
Ports (Privatization) Act 1990 (Act 422)
The Commissioner of Law Revision, Malaysia
http://www.mot.gov.my/Sectoral/Documents/Maritime/Ports%20(Privatization)%20Act%201990%20(act%20422).pdf
By-Laws, General Penalty, Offence by a Body Corporate and Conduct of Prosecution
22 February 1990
Ports (Privatization) Act 1990 (Act 422)
The Commissioner of Law Revision, Malaysia
http://www.mot.gov.my/Sectoral/Documents/Maritime/Ports%20(Privatization)%20Act%201990%20(act%20422).pdf
Miscellaneous 22 February 1990
Ports (Privatization) Act 1990 (Act 422)
The Commissioner of Law Revision, Malaysia
http://www.mot.gov.my/Sectoral/Documents/Maritime/Ports%20(Privatization)%20Act%201990%20(act%20422).pdf
Amendment and Transitional Provision
22 February 1990
Ports (Privatization) Act 1990 (Act 422)
The Commissioner of Law Revision, Malaysia
http://www.mot.gov.my/Sectoral/Documents/Maritime/Ports%20(Privatization)%20Act%201990%20(act%20422).pdf
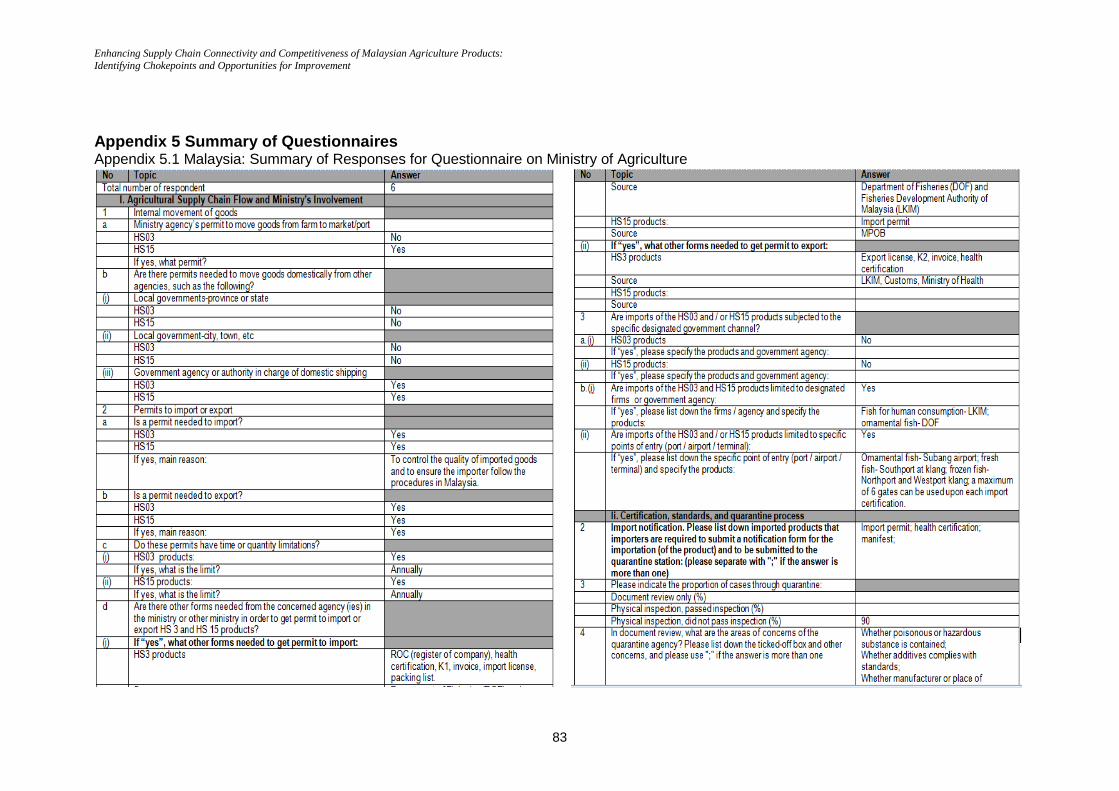
Enhancing Supply Chain Connectivity and Competitiveness of Malaysian Agriculture Products: Identifying Chokepoints and Opportunities for Improvement
83
Appendix 5 Summary of Questionnaires Appendix 5.1 Malaysia: Summary of Responses for Questionnaire on Ministry of Agriculture
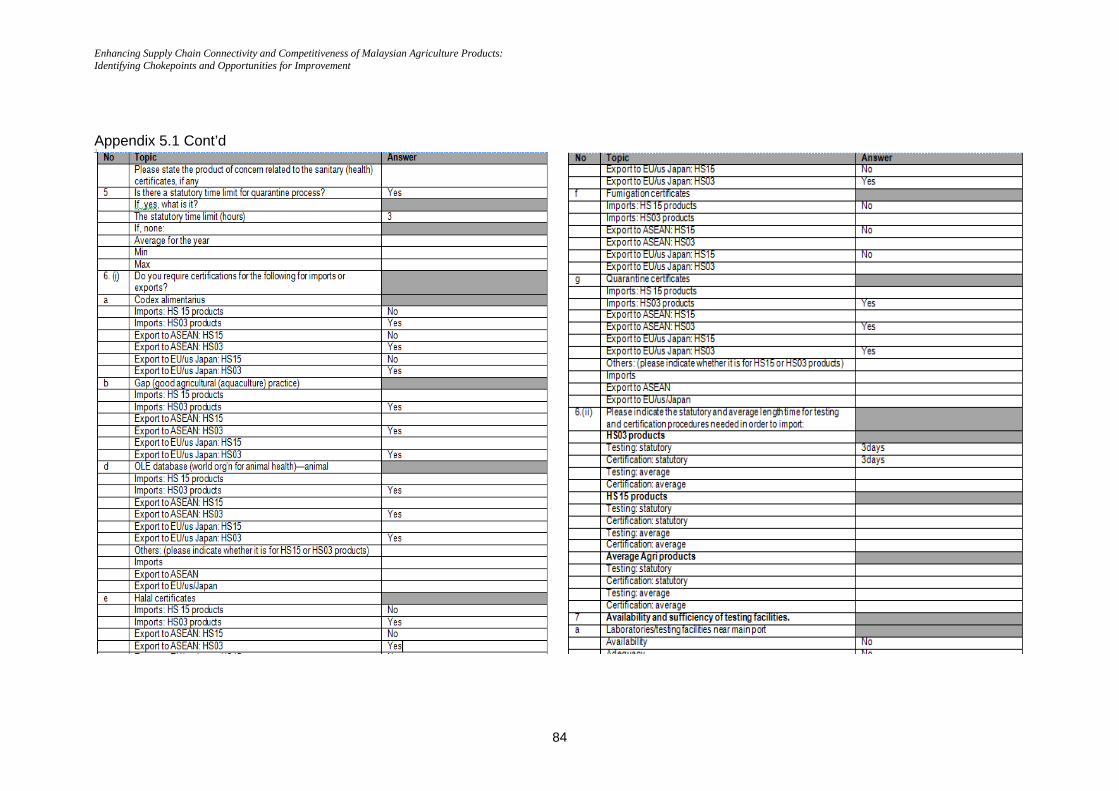
Enhancing Supply Chain Connectivity and Competitiveness of Malaysian Agriculture Products: Identifying Chokepoints and Opportunities for Improvement
84
Appendix 5.1 Cont’d
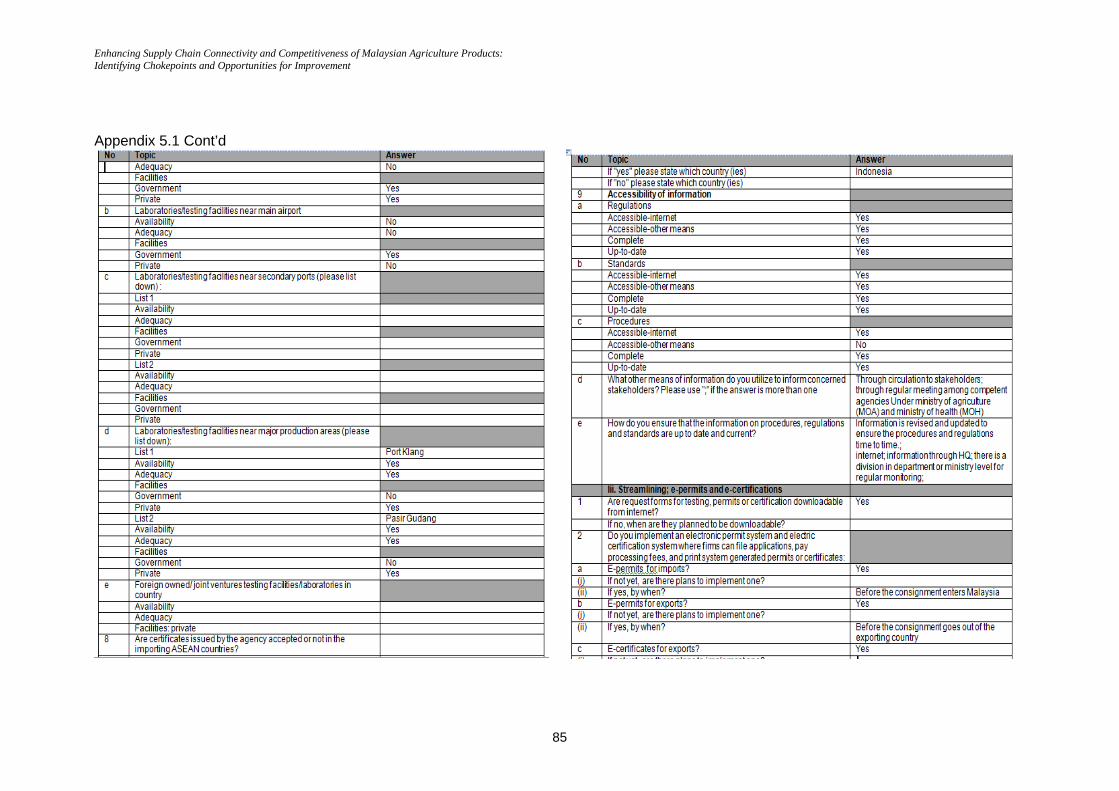
Enhancing Supply Chain Connectivity and Competitiveness of Malaysian Agriculture Products: Identifying Chokepoints and Opportunities for Improvement
85
Appendix 5.1 Cont’d
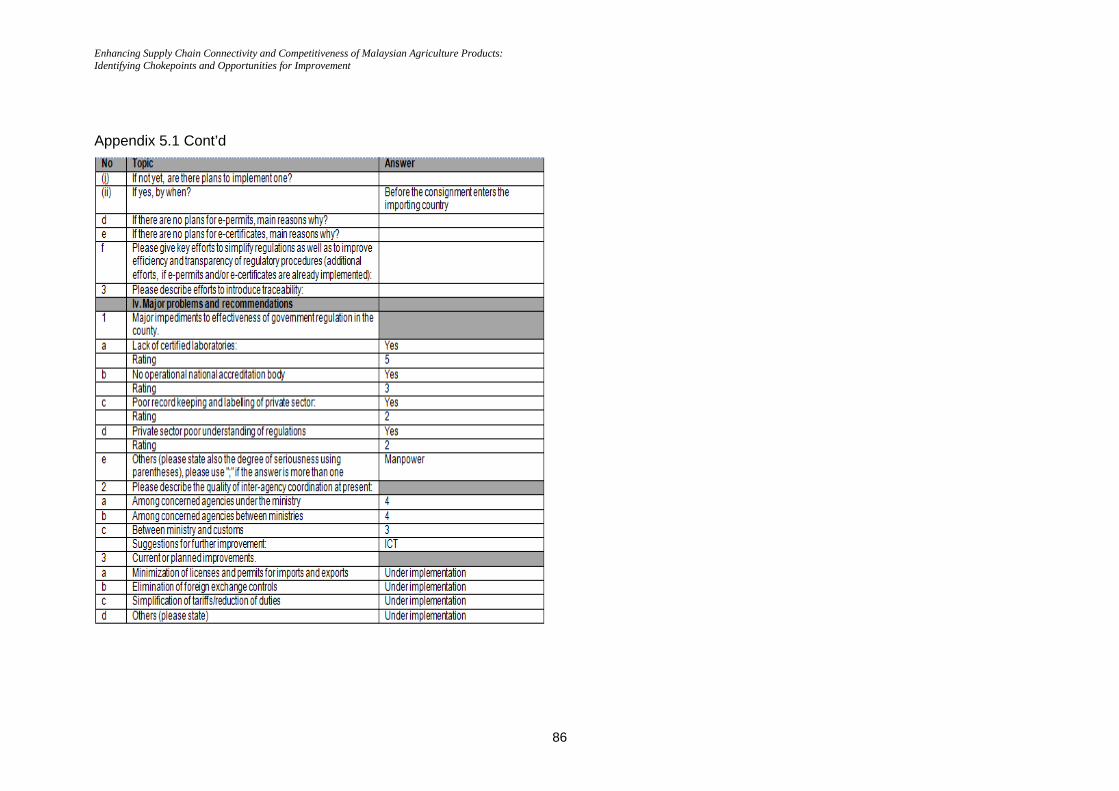
Enhancing Supply Chain Connectivity and Competitiveness of Malaysian Agriculture Products: Identifying Chokepoints and Opportunities for Improvement
86
Appendix 5.1 Cont’d
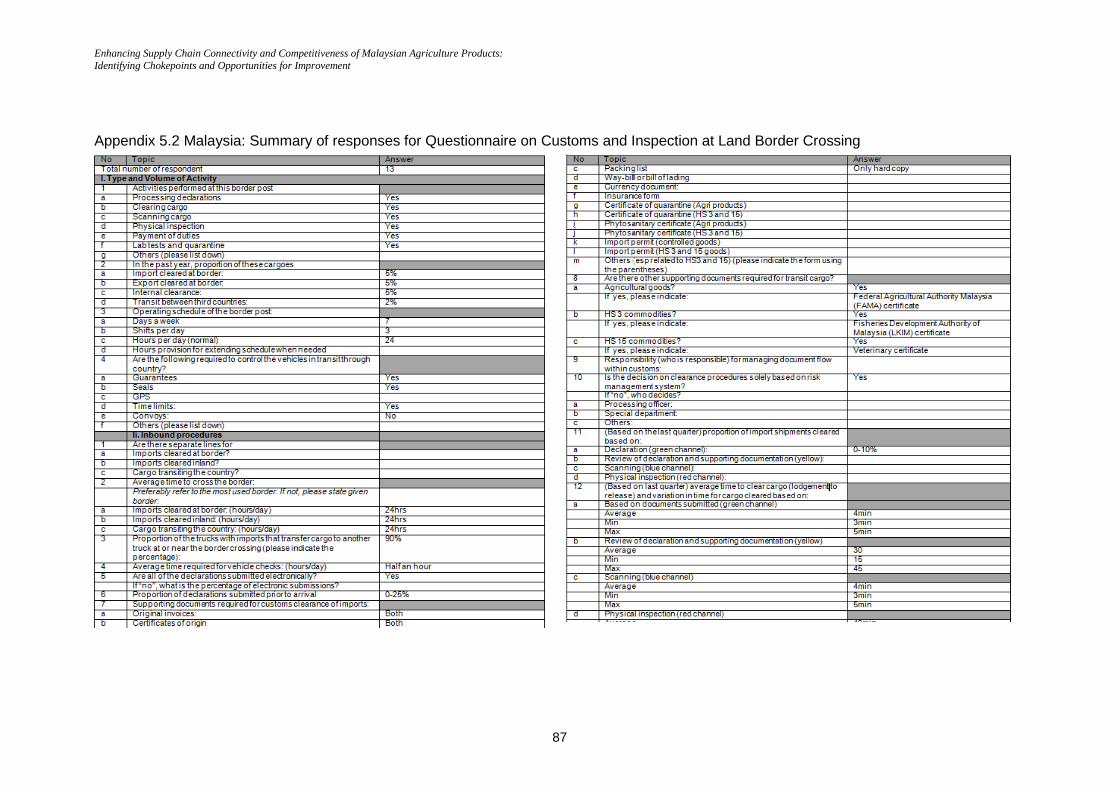
Enhancing Supply Chain Connectivity and Competitiveness of Malaysian Agriculture Products: Identifying Chokepoints and Opportunities for Improvement
87
Appendix 5.2 Malaysia: Summary of responses for Questionnaire on Customs and Inspection at Land Border Crossing
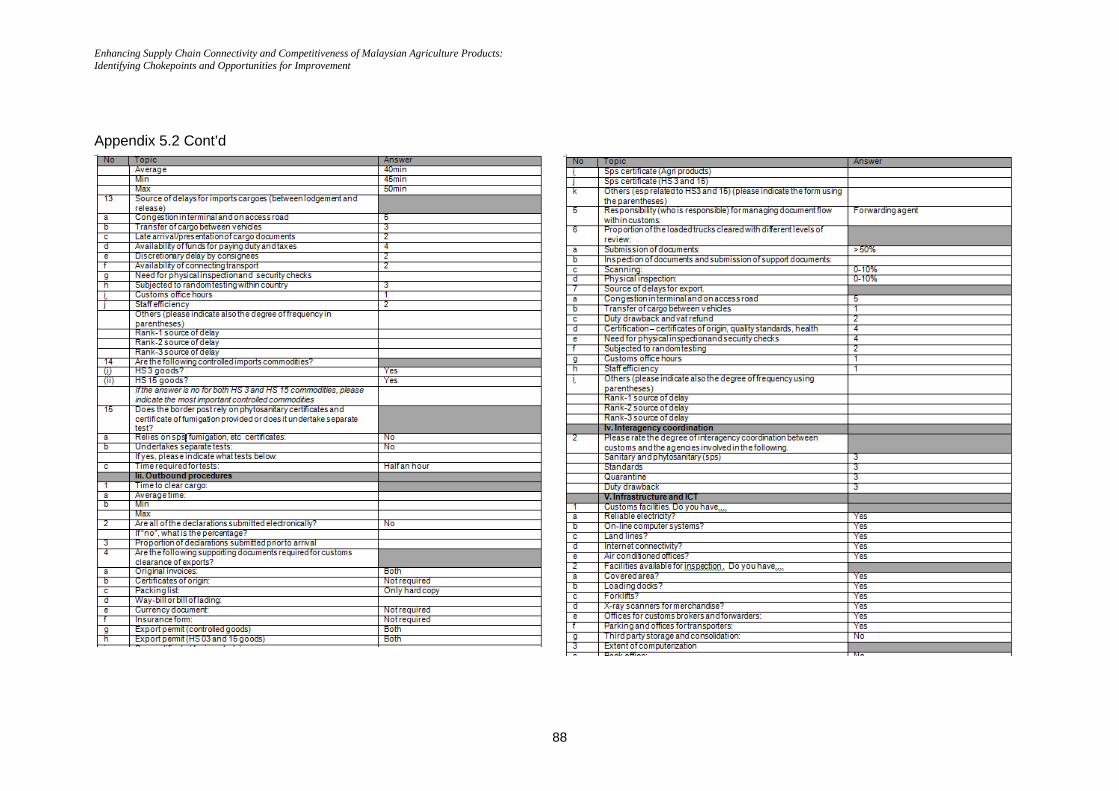
Enhancing Supply Chain Connectivity and Competitiveness of Malaysian Agriculture Products: Identifying Chokepoints and Opportunities for Improvement
88
Appendix 5.2 Cont’d
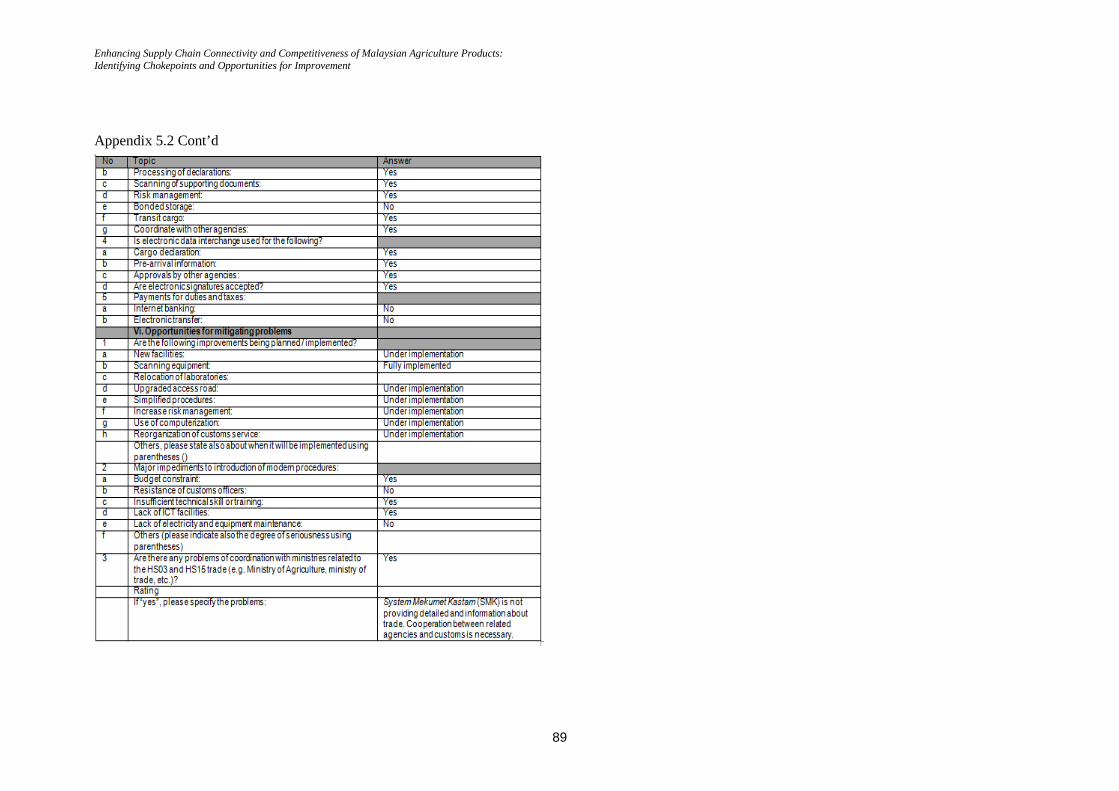
Enhancing Supply Chain Connectivity and Competitiveness of Malaysian Agriculture Products: Identifying Chokepoints and Opportunities for Improvement
89
Appendix 5.2 Cont’d
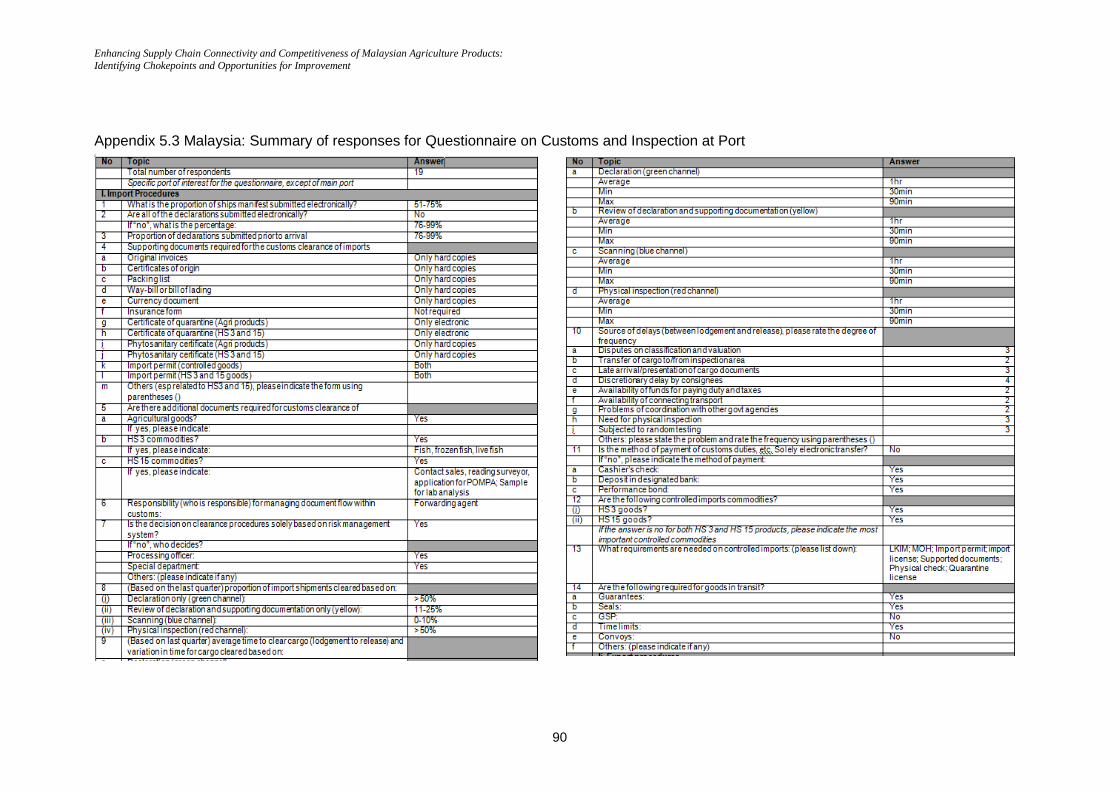
Enhancing Supply Chain Connectivity and Competitiveness of Malaysian Agriculture Products: Identifying Chokepoints and Opportunities for Improvement
90
Appendix 5.3 Malaysia: Summary of responses for Questionnaire on Customs and Inspection at Port
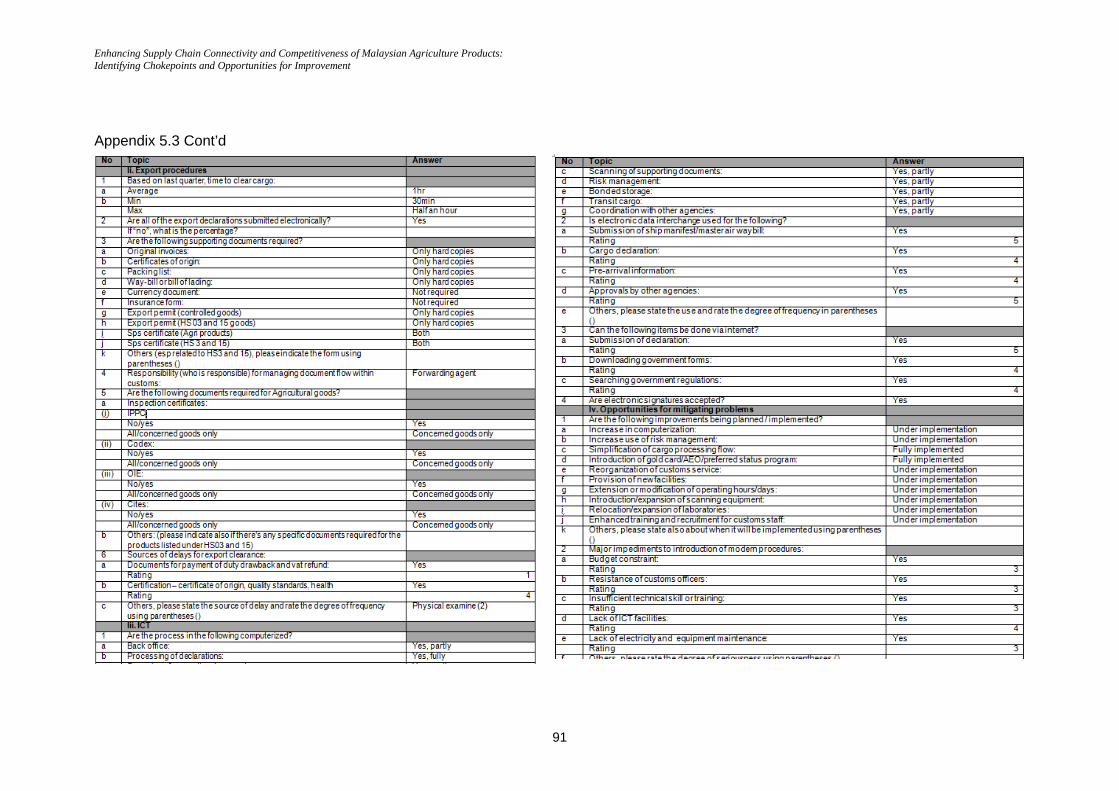
Enhancing Supply Chain Connectivity and Competitiveness of Malaysian Agriculture Products: Identifying Chokepoints and Opportunities for Improvement
91
Appendix 5.3 Cont’d
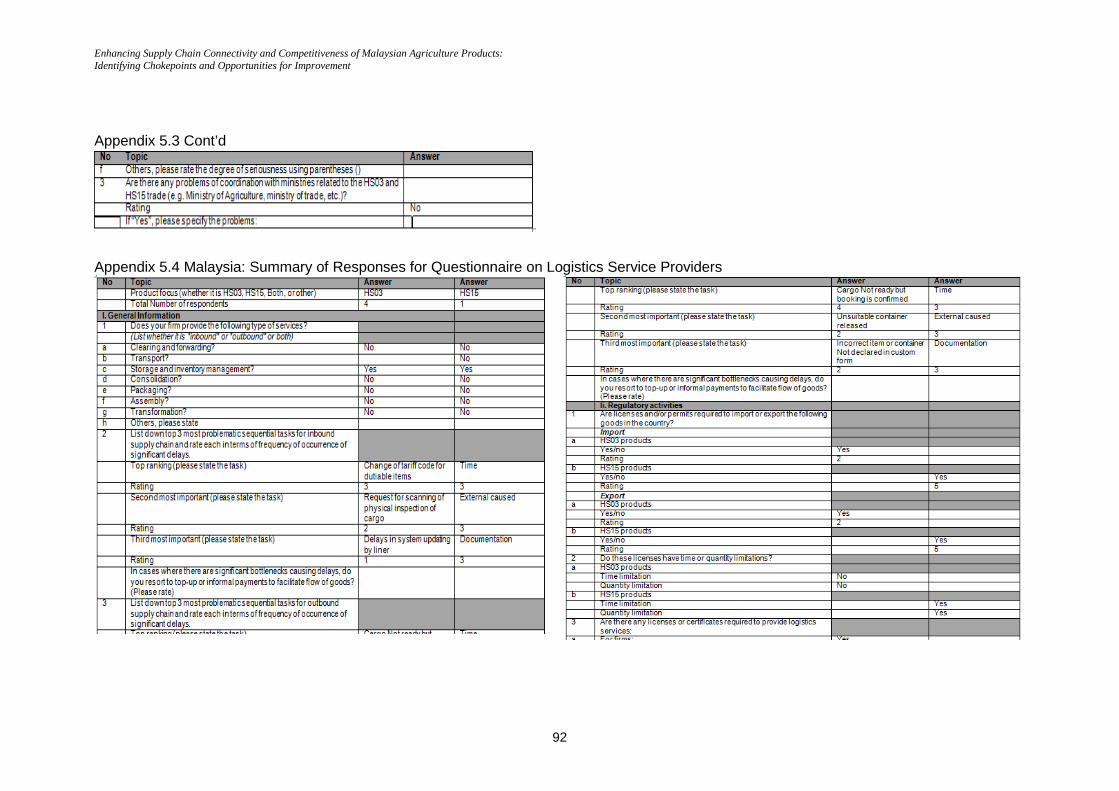
Enhancing Supply Chain Connectivity and Competitiveness of Malaysian Agriculture Products: Identifying Chokepoints and Opportunities for Improvement
92
Appendix 5.3 Cont’d
Appendix 5.4 Malaysia: Summary of Responses for Questionnaire on Logistics Service Providers
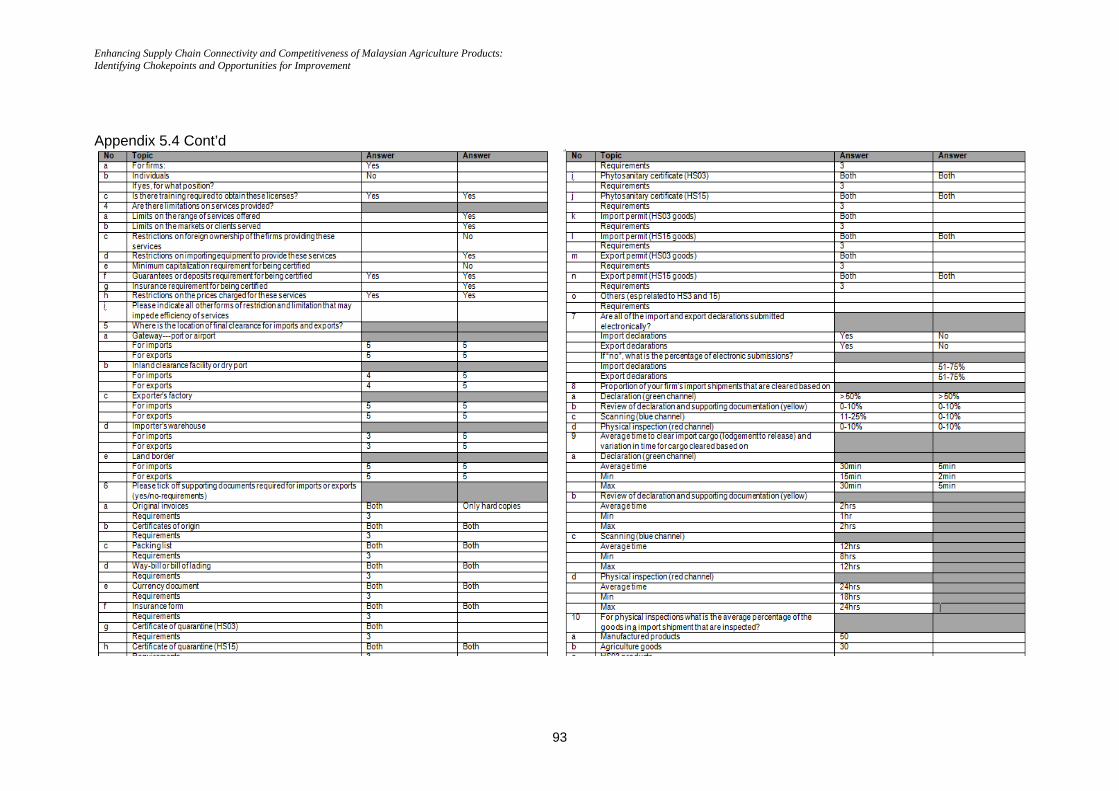
Enhancing Supply Chain Connectivity and Competitiveness of Malaysian Agriculture Products: Identifying Chokepoints and Opportunities for Improvement
93
Appendix 5.4 Cont’d
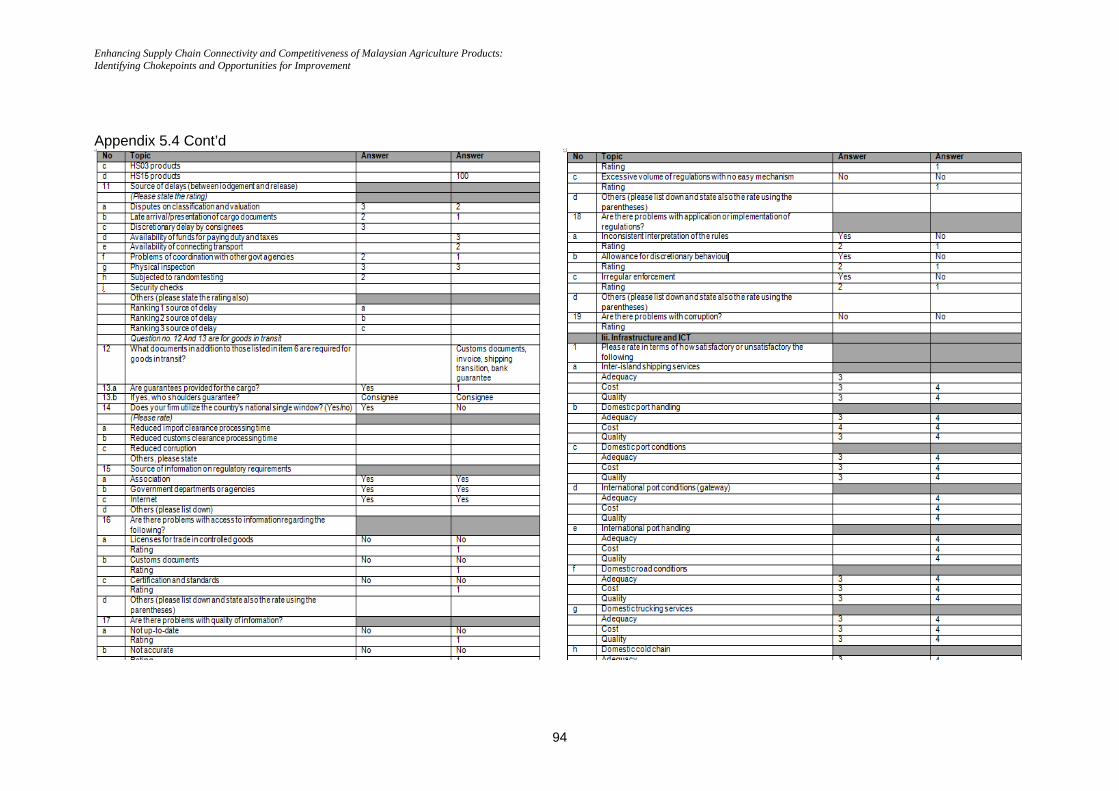
Enhancing Supply Chain Connectivity and Competitiveness of Malaysian Agriculture Products: Identifying Chokepoints and Opportunities for Improvement
94
Appendix 5.4 Cont’d
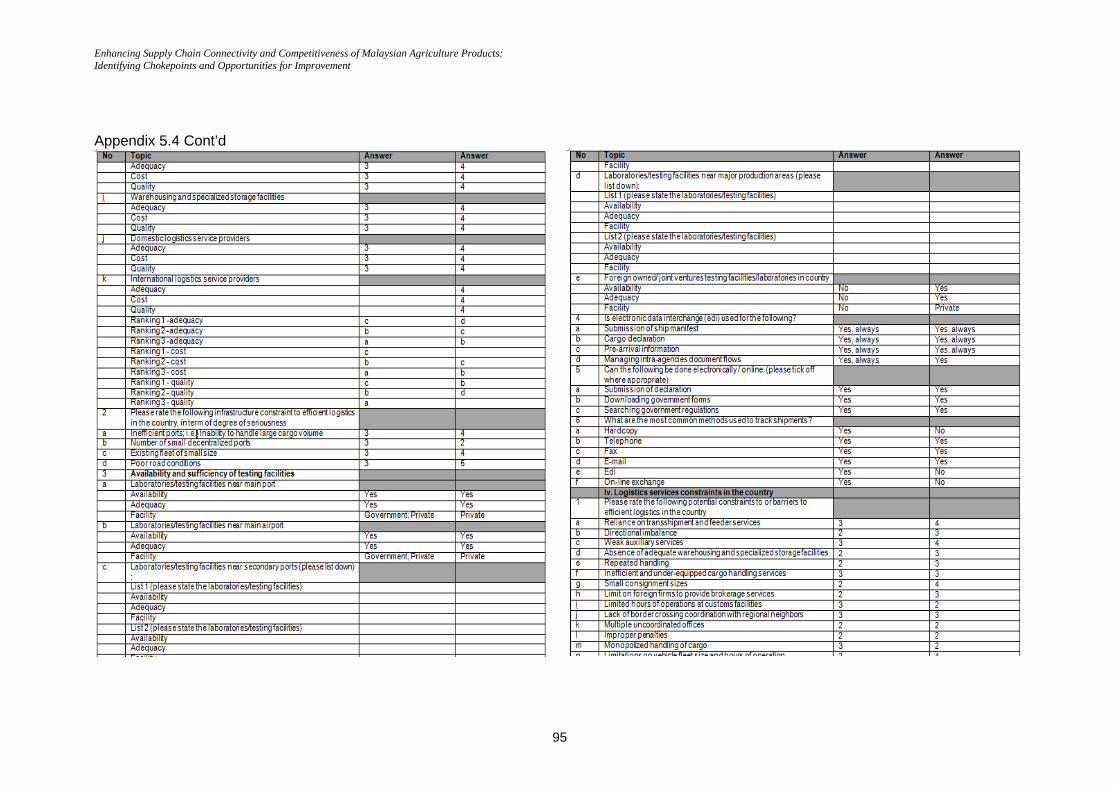
Enhancing Supply Chain Connectivity and Competitiveness of Malaysian Agriculture Products: Identifying Chokepoints and Opportunities for Improvement
95
Appendix 5.4 Cont’d
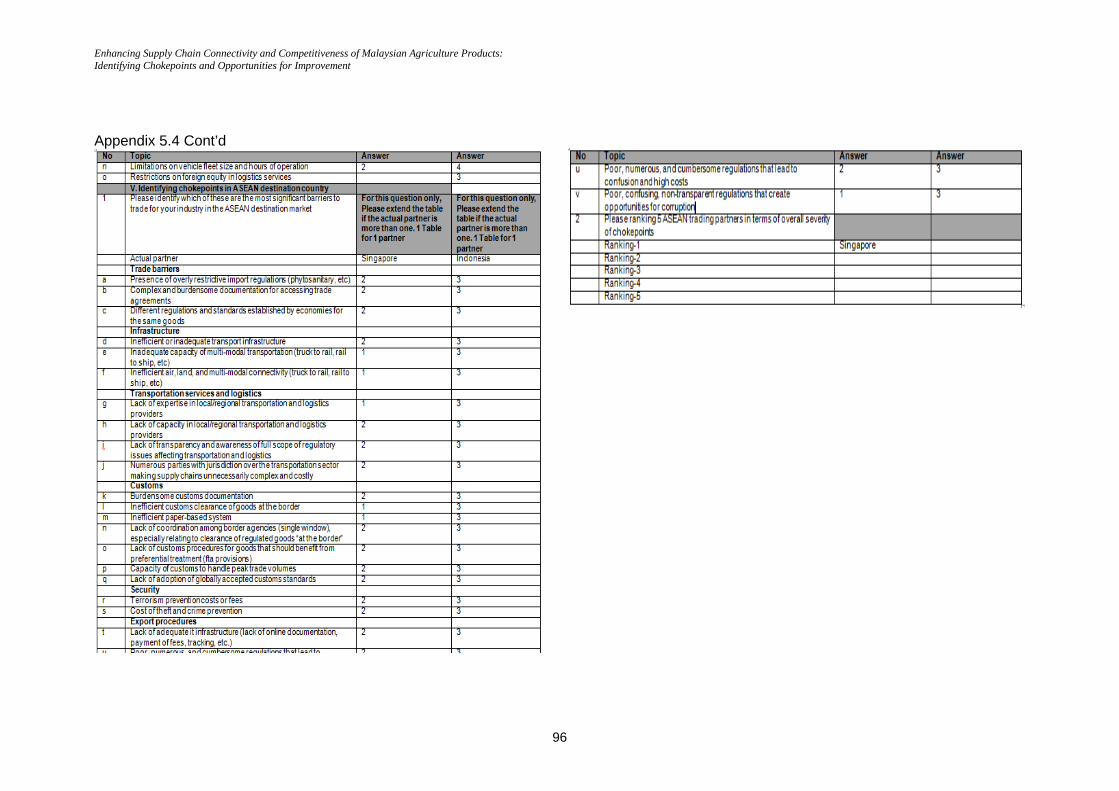
Enhancing Supply Chain Connectivity and Competitiveness of Malaysian Agriculture Products: Identifying Chokepoints and Opportunities for Improvement
96
Appendix 5.4 Cont’d
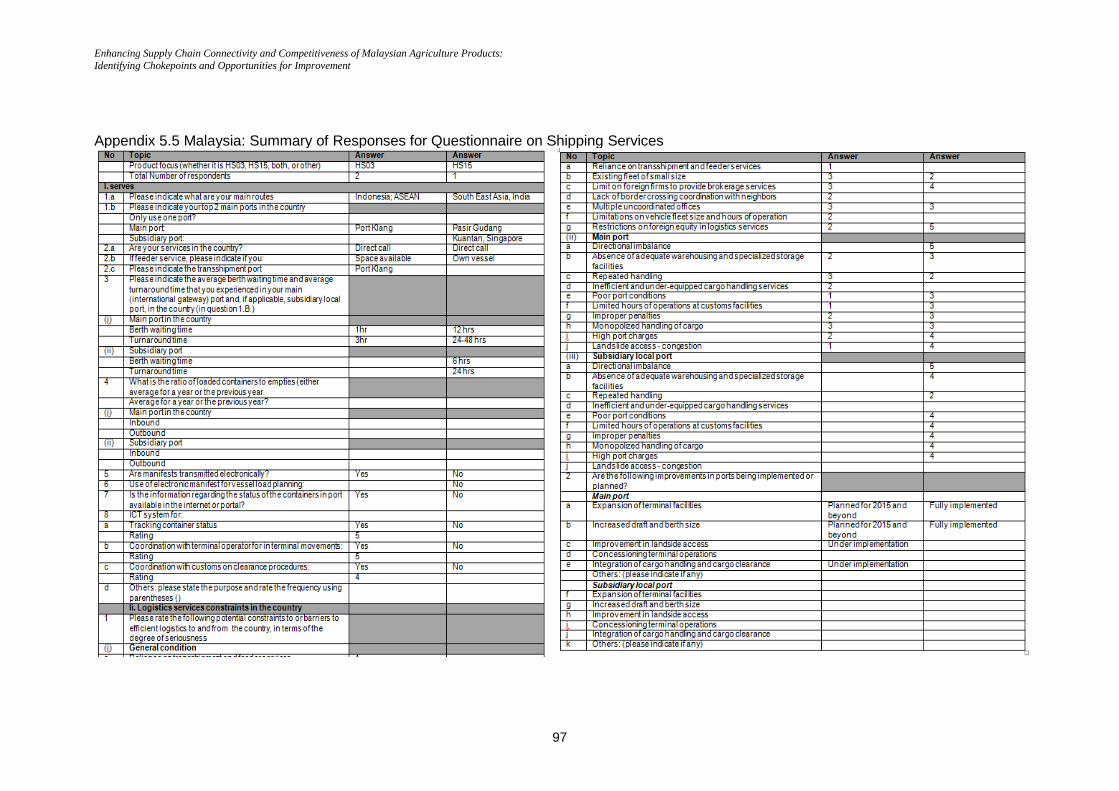
Enhancing Supply Chain Connectivity and Competitiveness of Malaysian Agriculture Products: Identifying Chokepoints and Opportunities for Improvement
97
Appendix 5.5 Malaysia: Summary of Responses for Questionnaire on Shipping Services
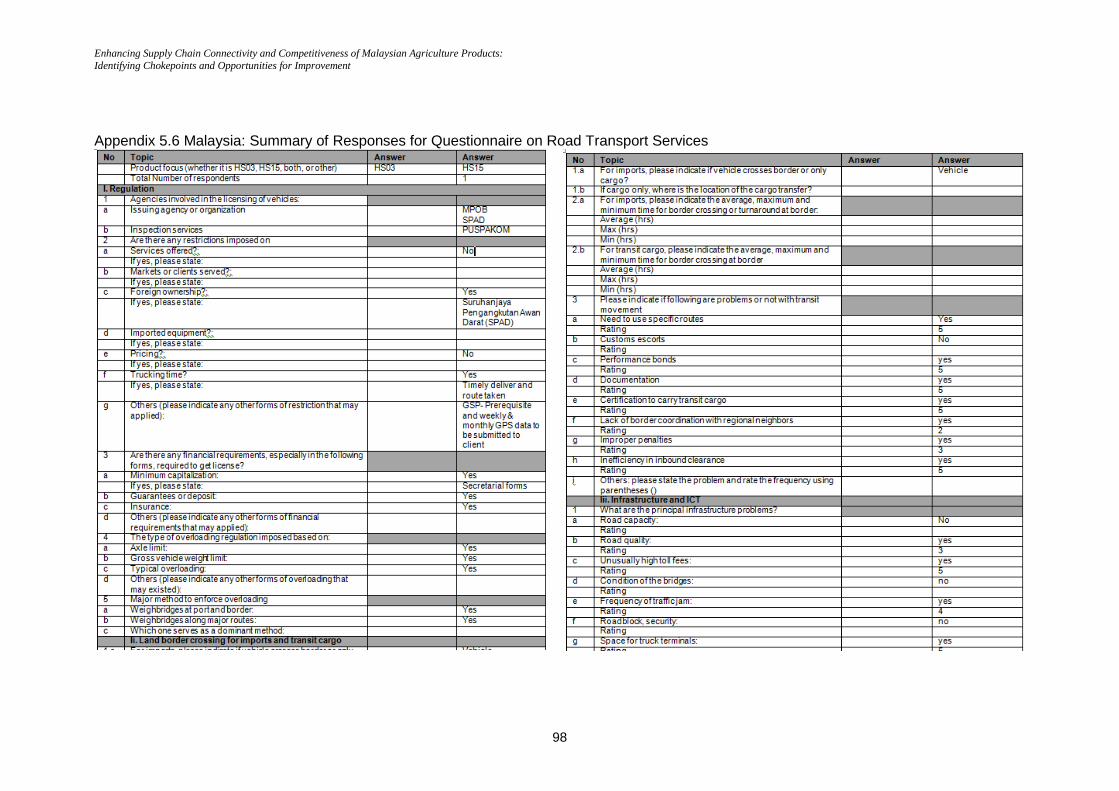
Enhancing Supply Chain Connectivity and Competitiveness of Malaysian Agriculture Products: Identifying Chokepoints and Opportunities for Improvement
98
Appendix 5.6 Malaysia: Summary of Responses for Questionnaire on Road Transport Services
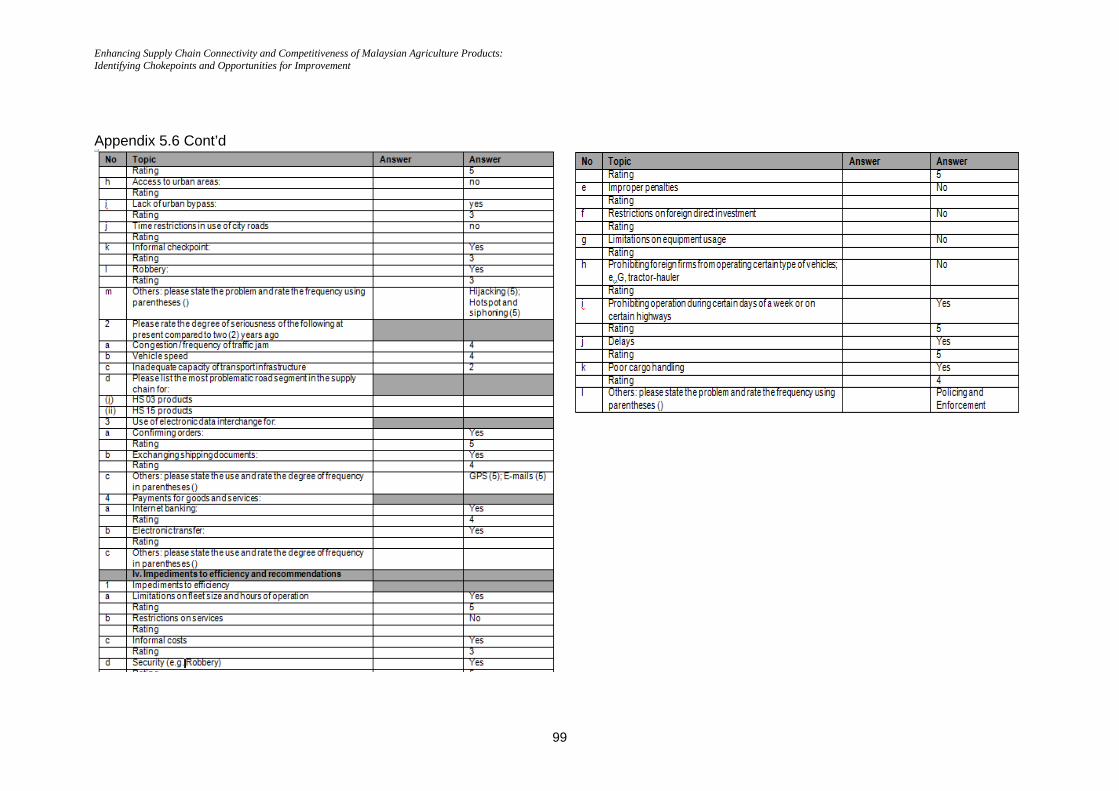
Enhancing Supply Chain Connectivity and Competitiveness of Malaysian Agriculture Products: Identifying Chokepoints and Opportunities for Improvement
99
Appendix 5.6 Cont’d
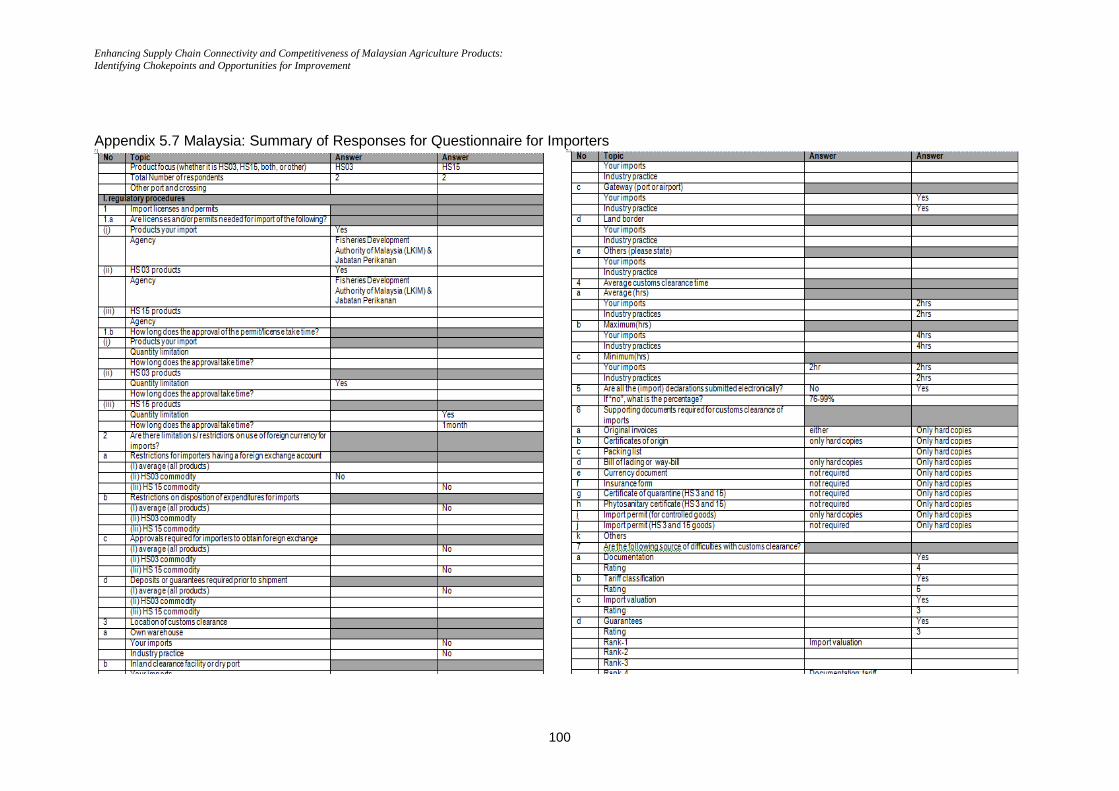
Enhancing Supply Chain Connectivity and Competitiveness of Malaysian Agriculture Products: Identifying Chokepoints and Opportunities for Improvement
100
Appendix 5.7 Malaysia: Summary of Responses for Questionnaire for Importers
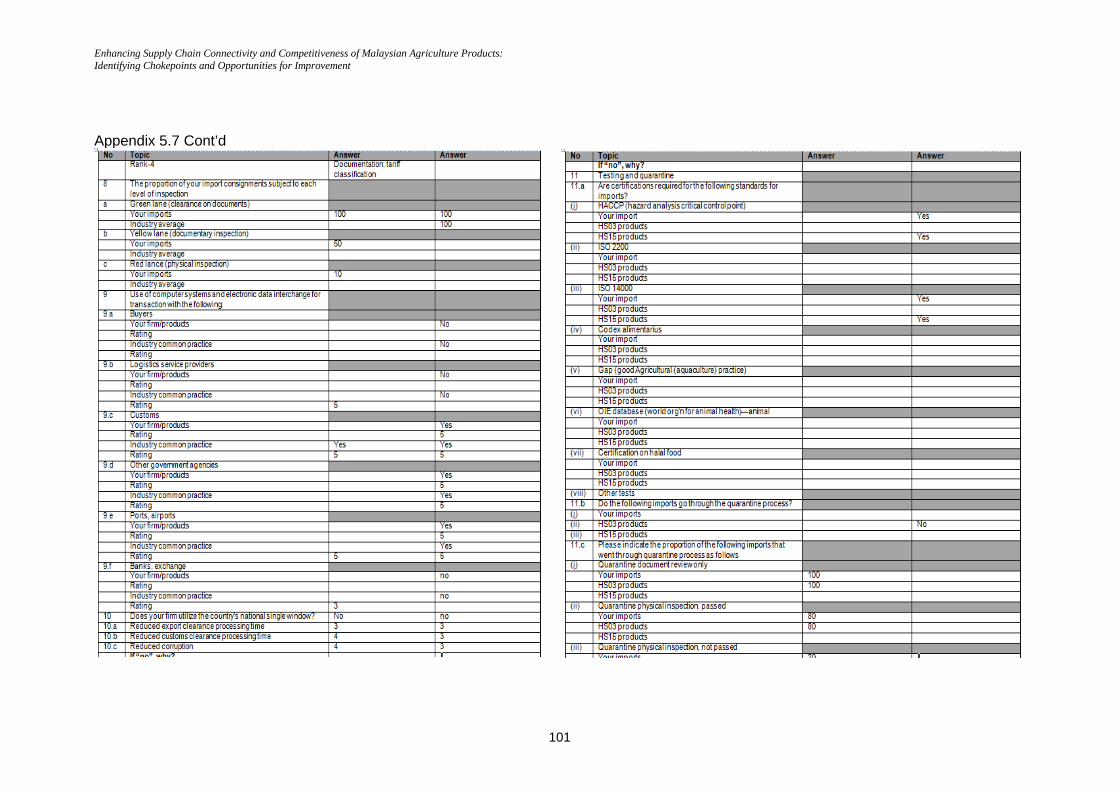
Enhancing Supply Chain Connectivity and Competitiveness of Malaysian Agriculture Products: Identifying Chokepoints and Opportunities for Improvement
101
Appendix 5.7 Cont’d
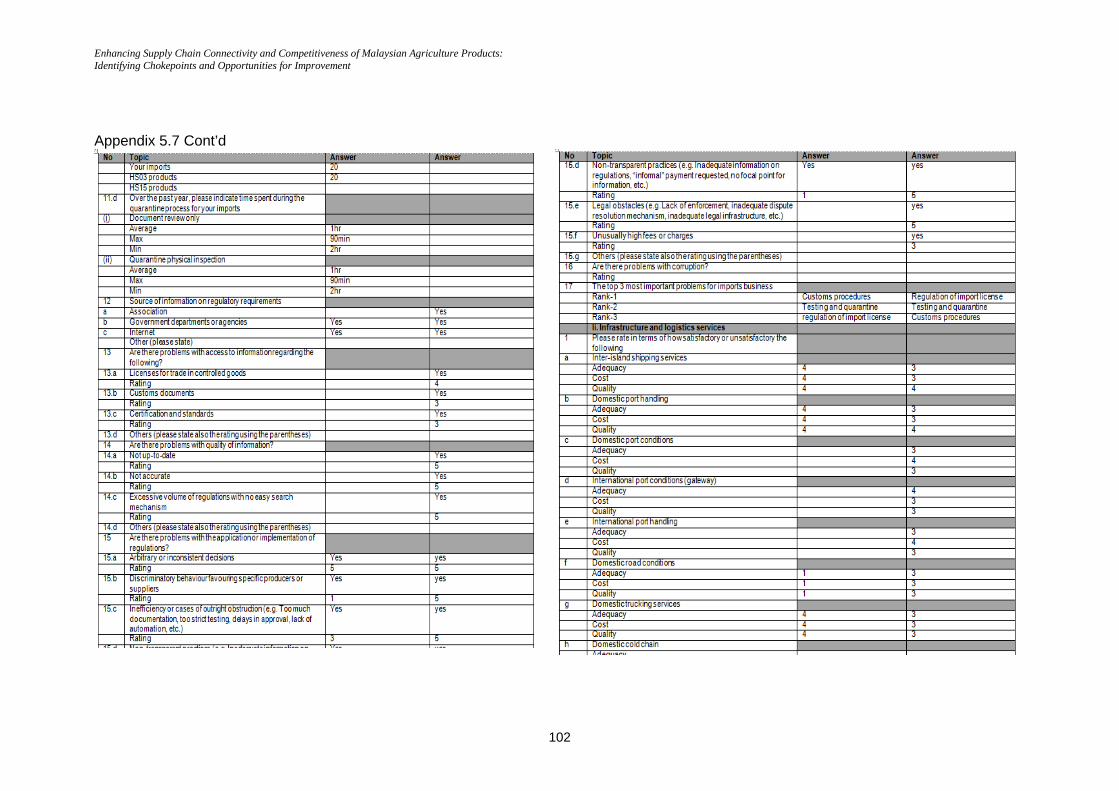
Enhancing Supply Chain Connectivity and Competitiveness of Malaysian Agriculture Products: Identifying Chokepoints and Opportunities for Improvement
102
Appendix 5.7 Cont’d
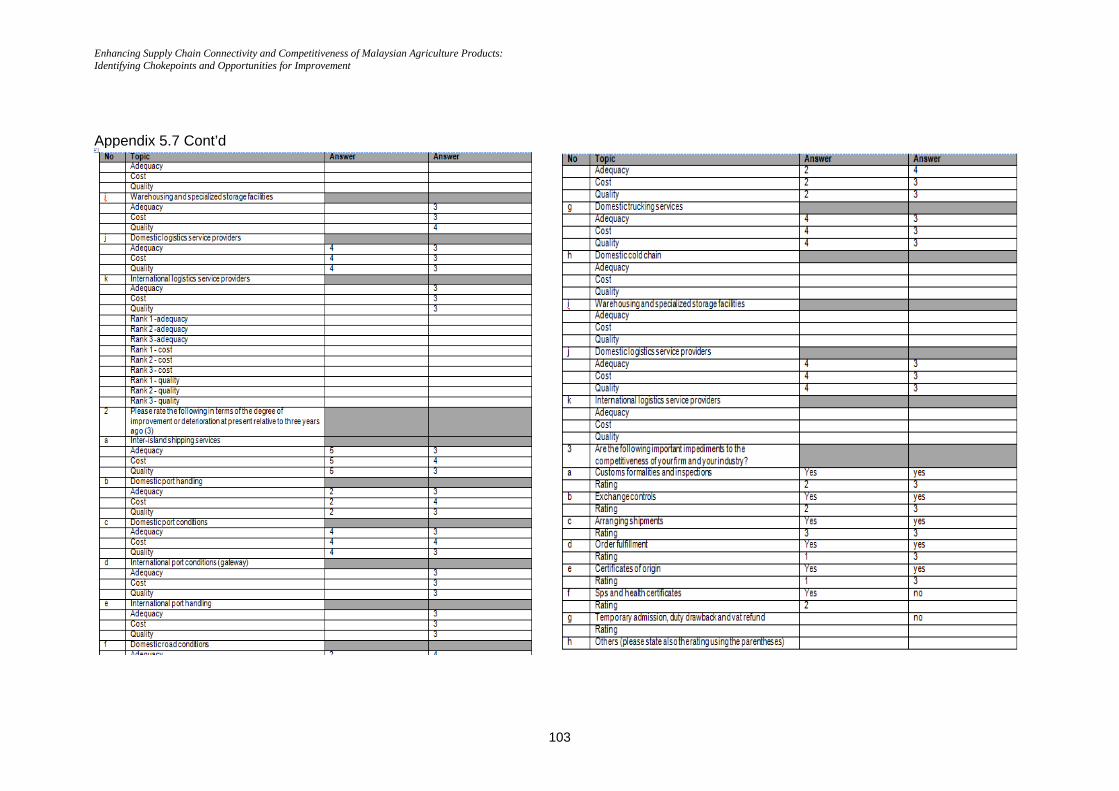
Enhancing Supply Chain Connectivity and Competitiveness of Malaysian Agriculture Products: Identifying Chokepoints and Opportunities for Improvement
103
Appendix 5.7 Cont’d
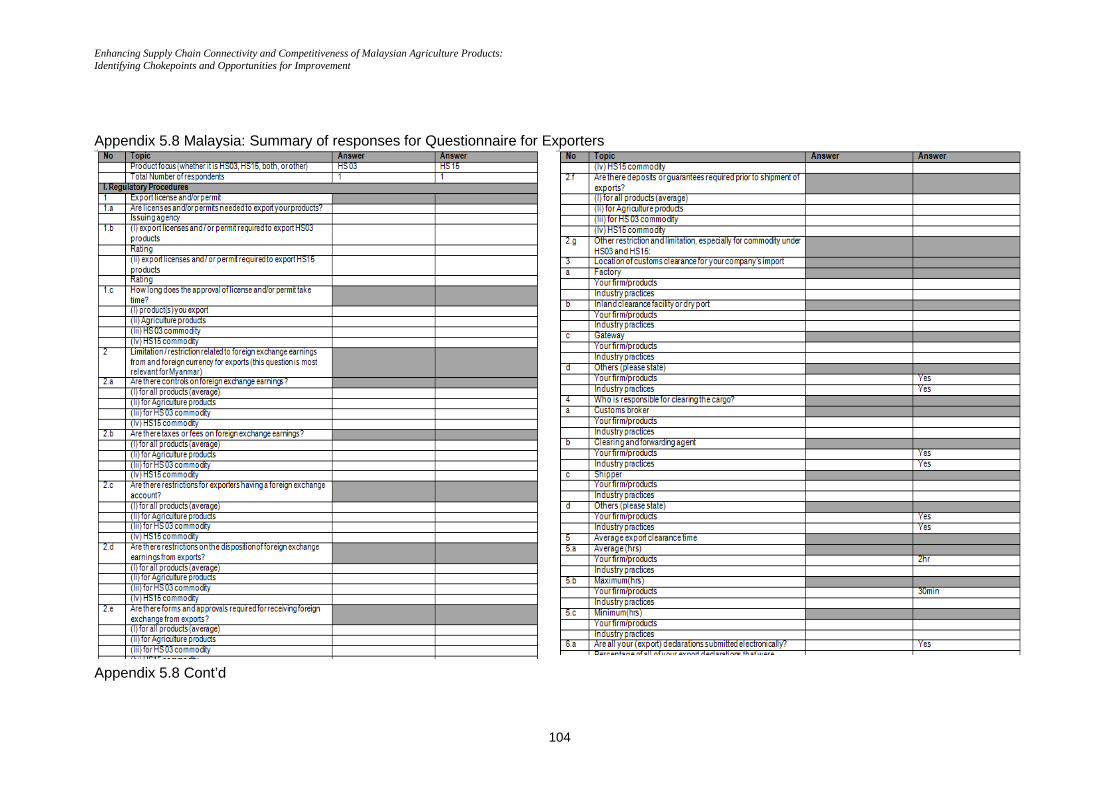
Enhancing Supply Chain Connectivity and Competitiveness of Malaysian Agriculture Products: Identifying Chokepoints and Opportunities for Improvement
104
Appendix 5.8 Malaysia: Summary of responses for Questionnaire for Exporters
Appendix 5.8 Cont’d
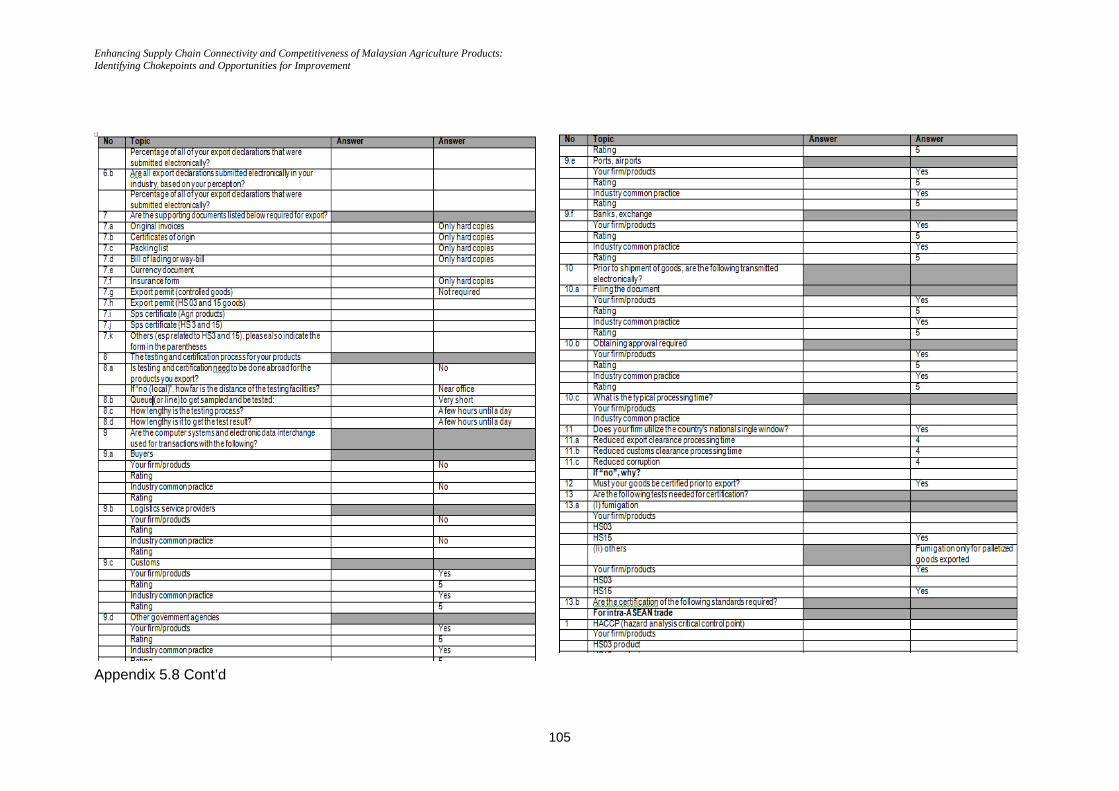
Enhancing Supply Chain Connectivity and Competitiveness of Malaysian Agriculture Products: Identifying Chokepoints and Opportunities for Improvement
105
Appendix 5.8 Cont’d
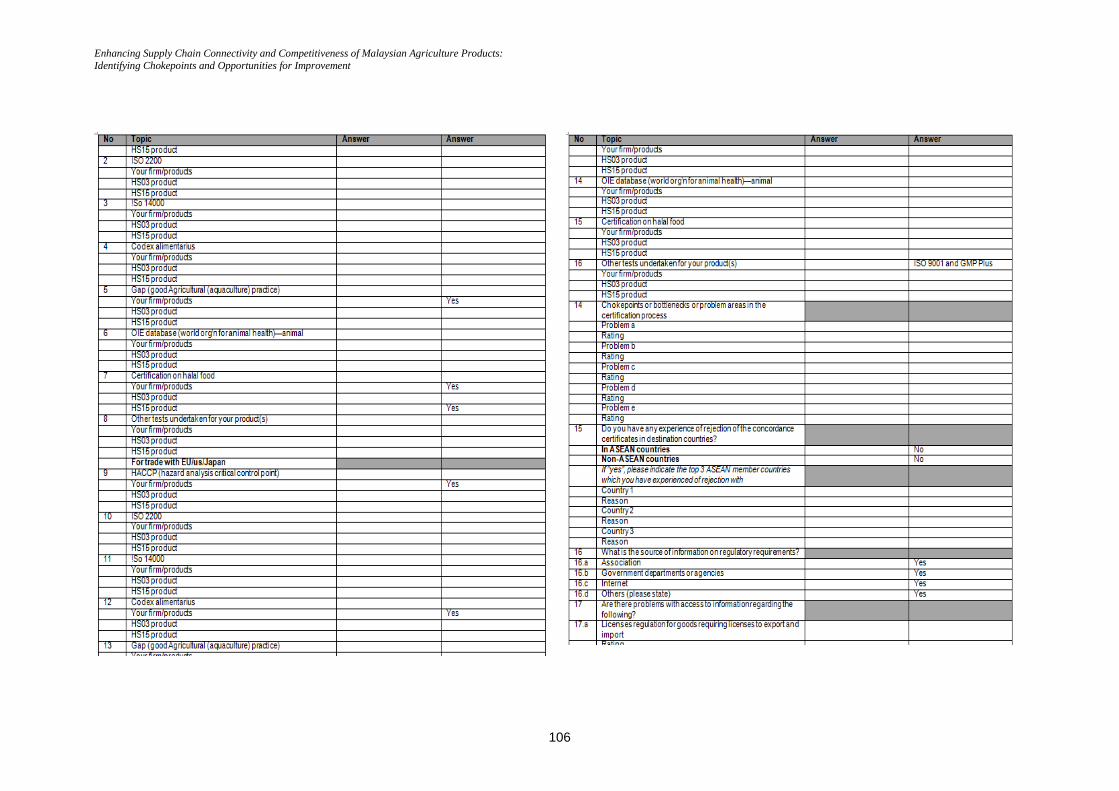
Enhancing Supply Chain Connectivity and Competitiveness of Malaysian Agriculture Products: Identifying Chokepoints and Opportunities for Improvement
106
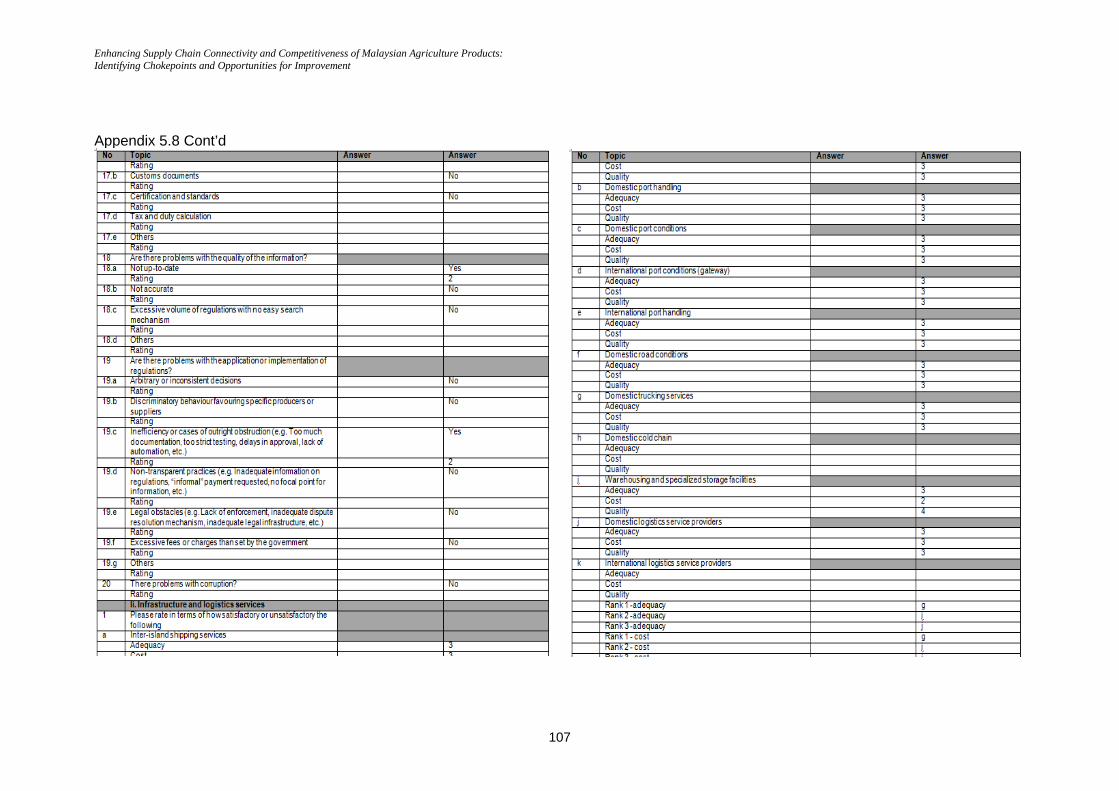
Enhancing Supply Chain Connectivity and Competitiveness of Malaysian Agriculture Products: Identifying Chokepoints and Opportunities for Improvement
107
Appendix 5.8 Cont’d
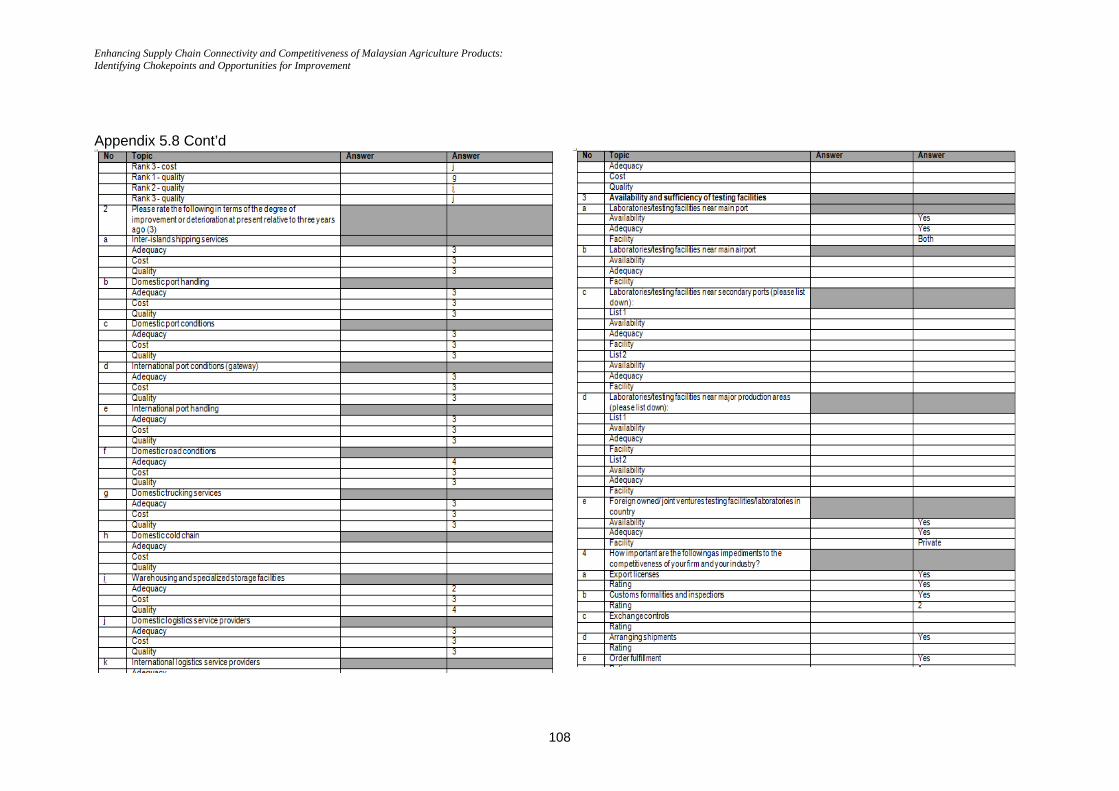
Enhancing Supply Chain Connectivity and Competitiveness of Malaysian Agriculture Products: Identifying Chokepoints and Opportunities for Improvement
108
Appendix 5.8 Cont’d
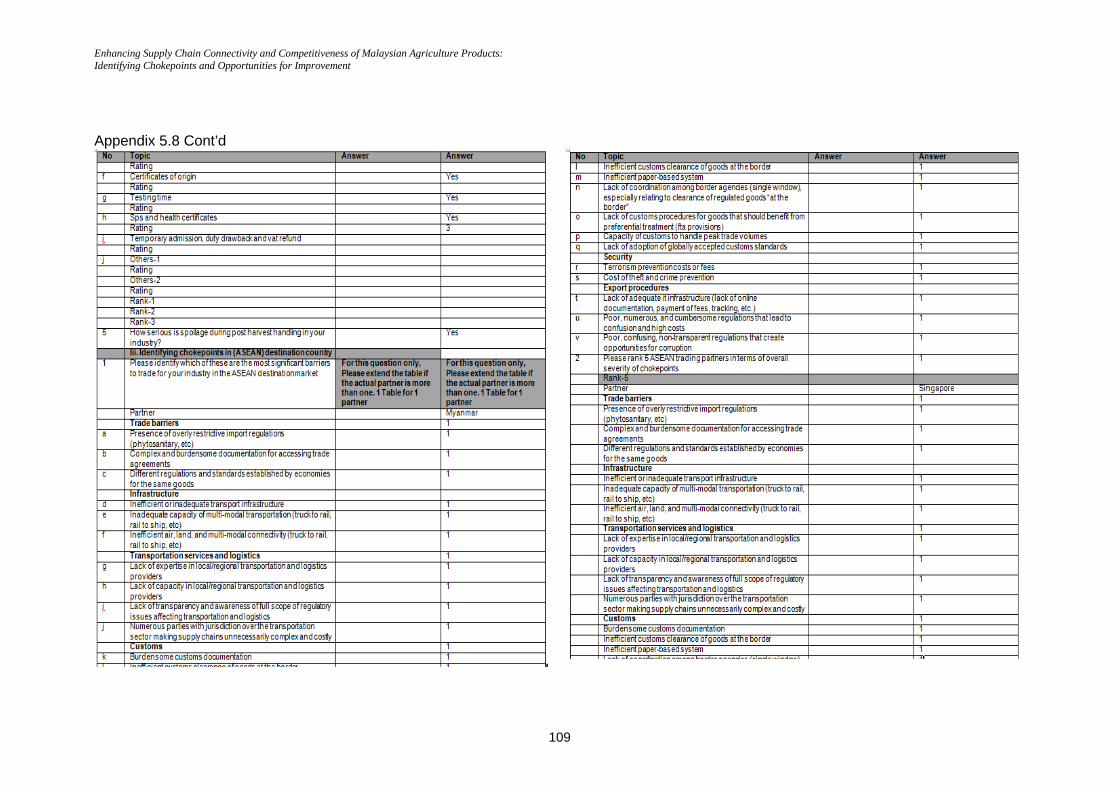
Enhancing Supply Chain Connectivity and Competitiveness of Malaysian Agriculture Products: Identifying Chokepoints and Opportunities for Improvement
109
Appendix 5.8 Cont’d
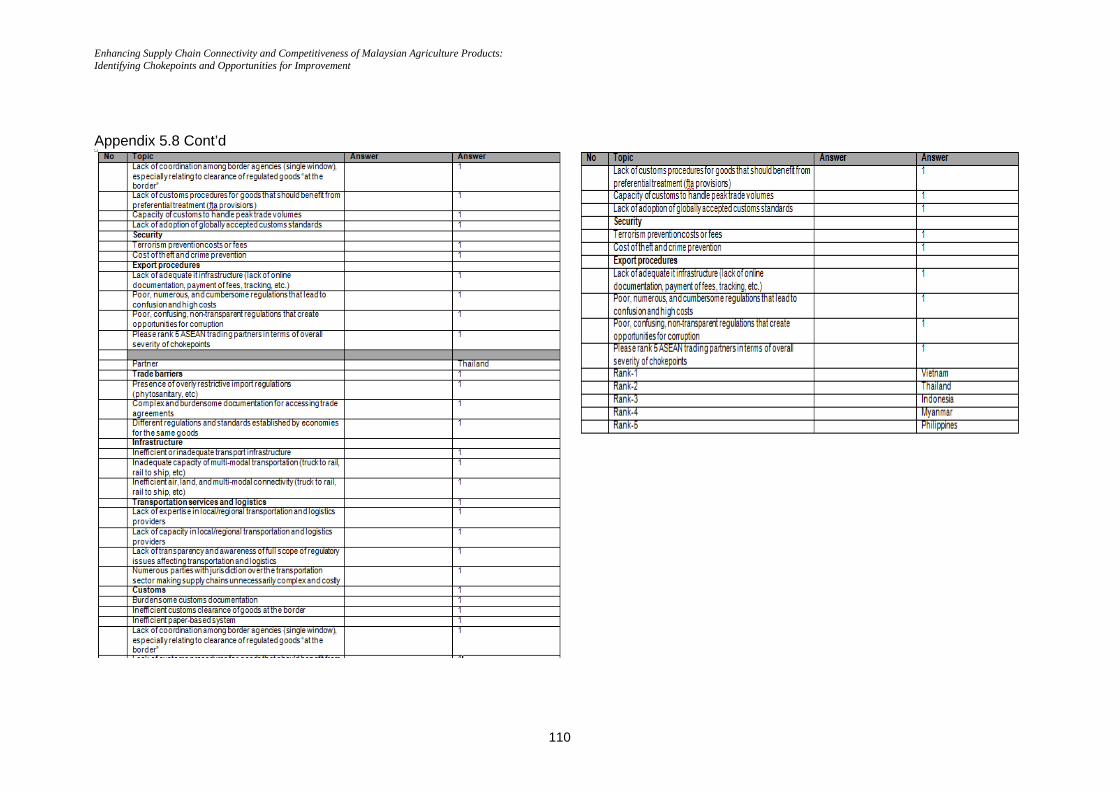
Enhancing Supply Chain Connectivity and Competitiveness of Malaysian Agriculture Products: Identifying Chokepoints and Opportunities for Improvement
110
Appendix 5.8 Cont’d