Embed Size (px)
Citation preview
Unclassified ECO/WKP(2013)5 Organisation de Coopération et de Développement Économiques Organisation for Economic Co-operation and Development 14-Jan-2013 ___________________________________________________________________________________________
English - Or. English ECONOMICS DEPARTMENT
THE EQUITY IMPLICATIONS OF FISCAL CONSOLIDATION ECONOMICS DEPARTMENT WORKING PAPER No. 1013
By Lukasz Rawdanowicz, Eckhard Wurzel and Ane Kathrine Christensen
All Economics Department Working Papers are available through OECD's Internet website at http://www.oecd.org/eco/Workingpapers
JT03333267
Complete document available on OLIS in its original format This document and any map included herein are without prejudice to the status of or sovereignty over any territory, to the delimitation of international frontiers and boundaries and to the name of any territory, city or area.
ECO
/WK
P(2013)5 U
nclassified
English - O
r. English
ECO/WKP(2013)5
2
ABSTRACT/RÉSUMÉ
The equity implications of fiscal consolidation In several OECD countries, ongoing fiscal consolidation might have a negative impact on the static income
distribution. However, this conclusion should be treated only as an approximate first step in the analysis. A full assessment of distributional effects of consolidation packages would need to consider dynamic measures, such as life-time income distribution and the equality of opportunity, along with behavioural responses and interactions with other policies. In any case, there is scope to balance current consolidation efforts in favour of more equity with only limited adverse impact on potential growth. In particular, relatively little weight has been given to reducing tax expenditures and raising taxes on immovable property. A number of consolidation instruments are consistent with equity goals while doing little or no harm to potential growth: increases in the effective retirement age, raising efficiency in the education and health care systems, cutting certain tax expenditures, hiking taxes on immovable property and broadly-based consumption taxes. Increases in capital income taxes would also be equitable but need to be well designed to avoid being distortive. Calculations based on simplifying assumptions indicate that increasing household direct taxes would reduce income inequality, while cutting transfers by the same amount would have a larger and opposite effect on inequality. However, raising progressive labour income taxes could have adverse effects on long-run growth. Cuts in government wages and employment can yield fast consolidation gains but need to be accompanied by increases in efficiency of service delivery to avoid that reductions in public services mainly hit the poor. Cuts in unemployment-related and disability benefits will likely hit poorer people in the first place but may have less adverse effects on inequality in the long run once employment increases in response to a better incentive structure.
JEL classification codes: H2; H23 ; H3 ; H53 ; I3 ; I38
Keywords: Fiscal consolidation; income inequality; taxes; transfers; welfare systems; redistribution
*********
Assainissement budgétaire et l’équité Dans plusieurs pays de l’OCDE, l’assainissement actuel des finances publiques aurait un impact negatif sur la
distribution statique des revenus. Cette conclusion doite être pourtant considérée uniquement comme une première étape approximative de l'analyse. Une évaluation complète des effets de distribution de consolidation fiscale nécessiterait de prendre en compte des mesures dynamiques, comme la distribution du revenu tout au long de la vie et l'égalité des chances ainsi que les réactions comportementales et les interactions avec d'autres politiques. En tout cas, il existe une marge pour équilibrer les efforts d'assainissement dans le sens d'une plus grande équité avec une incidence négative limitée sur la croissance potentielle. En particulier, les plans actuels font une place relativement peu importante à la réduction des dépenses fiscales et à l’alourdissement de la fiscalité sur la propriété immobilière. Un certain nombre d'instruments de redressement sont conformes aux objectifs d'équité, tout en étant peu ou pas du tout préjudiciables à la croissance potentielle: relèvement de l'âge effectif de la retraite, amélioration de l'efficience des systèmes d'éducation et de santé, baisse de certaines dépenses fiscales, alourdissement de la fiscalité sur le patrimoine immobilier et impôts à large assise sur la consommation. L'augmentation des impôts sur les revenus du capital serait également équitable, mais elle doit être bien conçue pour ne pas entraîner de distorsions. Les calculs, basés sur des suppositions simplifiées, montrent qu'un relèvement des impôts directs sur les ménages atténuerait les inégalités de revenus alors qu'une réduction des transferts de même montant aurait un effet plus important et de sens opposé sur les inégalités. Toutefois, une hausse des impôts progressifs sur les revenus du travail pourrait nuire à la croissance à long terme.Des coupes dans les rémunérations des fonctionnaires et dans leurs effectifs peuvent entraîner rapidement des gains budgétaires, mais elles doivent être accompagnées de gains d’efficience dans la prestation de services afin éviter qu'une contraction des services publics ne pénalise surtout les pauvres. Une baisse des allocations de chômage et d'invalidité touchera probablement en premier lieu les personnes les plus défavorisées mais elle pourrait avoir moins d’effets défavorables en termes d’inégalité sur le long terme, une fois que l’emploi augmentera du fait de l’amélioration de la structure incitative.
Classification JEL: H2 ; H23 ; H3; H53 ; I3 ; I38 Mots clés : Assainissement des finances publiques ; Inégalités de revenues ; impôts ; transferts, systèmes de protection sociale ; redistribution © OECD 2013
You can copy, download or print OECD content for your own use, and you can include excerpts from OECD publications, databases and multimedia products in your own documents, presentations, blogs, websites and teaching materials, provided that suitable acknowledgment of OECD as source and copyright owner is given. All requests for public or commercial use and translation rights should be submitted to [email protected]. Requests for permission to photocopy portions of this material for public or commercial use shall be addressed directly to the Copyright Clearance Centre (CCC) at [email protected] or the Centre français d’exploitation du droit de copie (CFC) at [email protected].
ECO/WKP(2013)5
3
TABLE OF CONTENTS
ABSTRACT/RÉSUMÉ .................................................................................................................................. 2
THE EQUITY IMPLICATIONS OF FISCAL CONSOLIDATION ............................................................. 5
1. Introduction .......................................................................................................................................... 5 2. Concepts of equity ............................................................................................................................... 5 3. Consolidation policy instruments and their impact on equity and growth ........................................... 7
3.1 Impacts of individual spending instruments ............................................................................. 13 3.2 Impacts of individual revenue instruments ............................................................................... 17 3.3 Consolidation instruments: ranking by equity and long-term growth implications .................. 21
4. Implications of current consolidation packages for equity and growth ............................................. 22
BIBLIOGRAPHY ......................................................................................................................................... 32
Tables
1. Consolidation effects on the budget, equity and long-term growth by instrument ........................ 10 Figures
1. Inequality trends .............................................................................................................................. 6 2. The structure of general government expenditure ........................................................................... 8 3. Level and composition of tax revenues ........................................................................................... 9 4. Redistributive impact of cash transfers and taxes ......................................................................... 10 5. Progressivity index of the mandatory pension system .................................................................. 13 6. Disability benefits .......................................................................................................................... 14 7. Public spending on in-kind transfers ............................................................................................. 16 8. Value added tax performance-the VAT revenue ratio ................................................................... 18 9. Progressivity of statutory personal income tax and employee social security contribution schedules ................................................................................................................... 20 10. Environmentally-related tax revenues in OECD countries ........................................................... 21 11. Consolidation via household transfers, taxes and in total.............................................................. 23 12. Distribution of expenditure versus revenue based consolidation plans ......................................... 24 13. Spending programmes targeted for fiscal consolidation ............................................................... 25 14. Planned revenue measures for fiscal consolidation ....................................................................... 25 15. Planned consumption tax increases ............................................................................................... 26
Boxes
1. Illustration of the redistributive impact of direct tax and transfer-based consolidation ................ 12 2. Empirical evidence on the impact of consolidation on equity ....................................................... 27 3. The distributional impact of expansionary monetary policy ......................................................... 29
The statistical data for Israel are supplied by and under the responsibility of the relevant Israeli authorities. The use of such data by the OECD is without prejudice to the status of the Golan Heights, East Jerusalem and Israeli settlements in the West Bank under the terms of international law.

ECO/WKP(2013)5
4
ECO/WKP(2013)5
5
THE EQUITY IMPLICATIONS OF FISCAL CONSOLIDATION
By
Lukasz Rawdanowicz, Eckhard Wurzel and Ane Kathrine Christensen1
1. Introduction
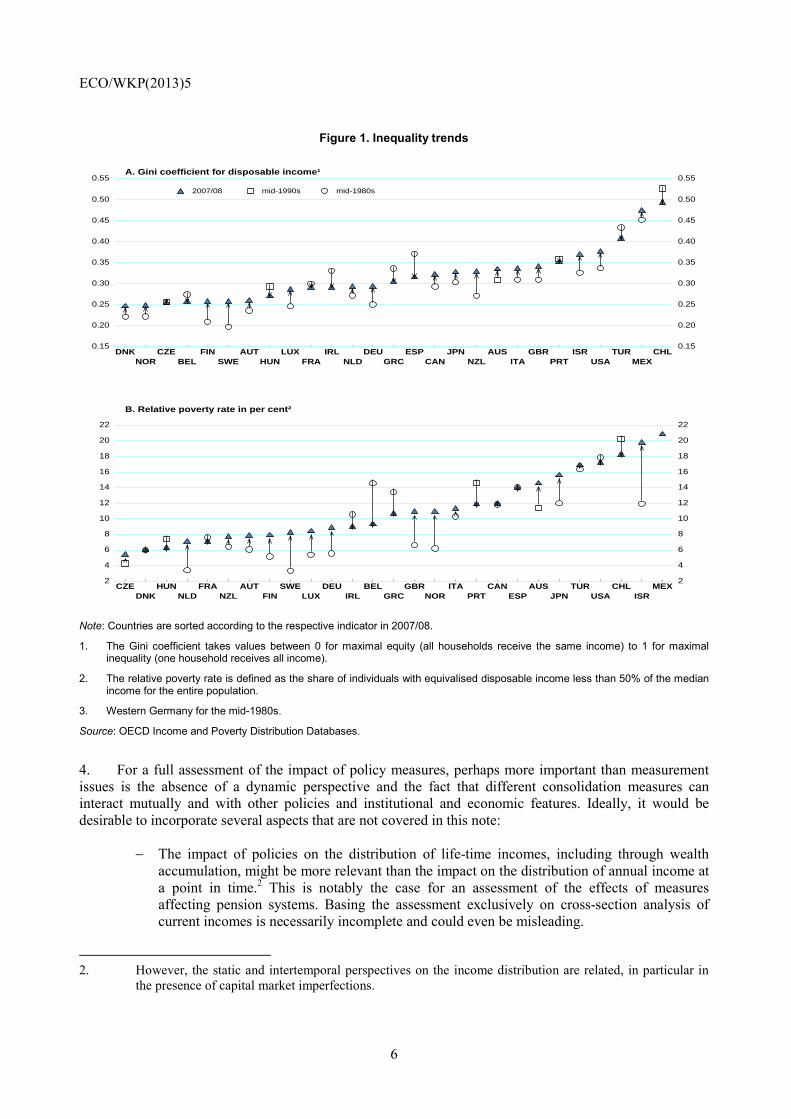
1. Fiscal consolidation in many OECD countries in coming years may accentuate the trend increase in income inequality and relative poverty observed over the past decades (Figure 1). Indeed, the historical backdrop puts a premium on equitable design of fiscal retrenchment so as to sustain public support for deep and possibly long-lasting consolidation efforts in a context of high unemployment. However, such designs might differ from those required to boost long-term growth and possibly also those to minimise demand retrenchment at times of economic slack.
2. These issues are discussed in this note under three headings. Section 2 briefly considers concepts of equity and their drawbacks in assessing the implications of consolidation. Section 3 examines potential consolidation instruments, how they may influence equity as well as their impact on long-term growth to draw out potential trade-offs. Finally, section 4 reviews main features of consolidation that is underway in the OECD countries and assesses its equity implications.
2. Concepts of equity
3. For reasons of data availability and analytical constraints, the present note focuses on the direct impact effects of fiscal consolidation on static income distribution. Even then, views may differ as to the relevant concepts of income distribution. For example, impacts of policy on incomes at the upper end of the income distribution may be of lesser concern than effects for people with very low incomes. Furthermore, the Gini coefficient and the relative poverty rate are often employed as measures of inequality and low-income incidence at a given point in time, but both measures have serious shortcomings. For example, they exclude the flow of in-kind public services, such as health care, to particular income groups.
1. The authors are members of the OECD Economics Department. The paper was originally produced for the OECD Economic Policy Committee in November 2012 under the authority of the Economics Department of the OECD. The authors would like to thank Sven Blondal, Jorgen Elmeskov and Jean-Luc Schneider for helpful comments. Special thanks go to Isabelle Fakih for technical preparation.
ECO/WKP(2013)5
6
Figure 1. Inequality trends
Note: Countries are sorted according to the respective indicator in 2007/08.
1. The Gini coefficient takes values between 0 for maximal equity (all households receive the same income) to 1 for maximal inequality (one household receives all income).
2. The relative poverty rate is defined as the share of individuals with equivalised disposable income less than 50% of the median income for the entire population.
3. Western Germany for the mid-1980s.
Source: OECD Income and Poverty Distribution Databases.
4. For a full assessment of the impact of policy measures, perhaps more important than measurement issues is the absence of a dynamic perspective and the fact that different consolidation measures can interact mutually and with other policies and institutional and economic features. Ideally, it would be desirable to incorporate several aspects that are not covered in this note:
− The impact of policies on the distribution of life-time incomes, including through wealth accumulation, might be more relevant than the impact on the distribution of annual income at a point in time.2 This is notably the case for an assessment of the effects of measures affecting pension systems. Basing the assessment exclusively on cross-section analysis of current incomes is necessarily incomplete and could even be misleading.
2. However, the static and intertemporal perspectives on the income distribution are related, in particular in
the presence of capital market imperfections.
DNK CZE FIN AUT LUX IRL DEU ESP JPN AUS GBR ISR TUR CHLNOR BEL SWE HUN FRA NLD GRC CAN NZL ITA PRT USA MEX
0.15
0.20
0.25
0.30
0.35
0.40
0.45
0.50
0.55
0.15
0.20
0.25
0.30
0.35
0.40
0.45
0.50
0.55
A. Gini coefficient for disposable income¹
2007/08 mid-1990s mid-1980s
CZE HUN FRA AUT SWE DEU BEL GBR ITA CAN AUS TUR CHL MEXDNK NLD NZL FIN LUX IRL GRC NOR PRT ESP JPN USA ISR
2
4
6
8
10
12
14
16
18
20
22
2
4
6
8
10
12
14
16
18
20
22
B. Relative poverty rate in per cent²
ECO/WKP(2013)5
7
− Inter-generational equity impacts may also be relevant, especially when assessing the impact of policy measures that may constrain the social mobility across generations, for example by limiting educational opportunity and choice.
− More generally, the effect on equality of opportunity is also of importance.3
− Changes in policy settings might prompt responses by households and enterprises that can have a significant impact on the income distribution. A full assessment of the final incidence of policy measures would require modelling behavioural responses, which is not done here.
− The interactions of consolidation measures with the macro-economic environment and structural policy settings will influence the equity effects. For example, employment gains and their impact on the income distribution on account of measures that increase labour force participation might be very limited if economic activity is very weak. Similarly, adverse effects of fiscal retrenchment on the income distribution will be more persistent if it contributes to an increase in long-term unemployment that can turn structural, in particular if not addressed by appropriate training and activation measures.
− The relevant benchmark for considering equity impacts is also uncertain. Postponing fiscal adjustment can become costly in terms of growth and distributional consequences in the future, especially if this results in a collapse of confidence in sound public finances and economic stability. Indeed, if fiscal adjustment is forced by abrupt market reactions, only limited scope might remain to decide on the pace and composition of adjustment programmes, including measures to cushion equity.
Thus, the conclusions in this note should be treated at most as an approximate first step in the analysis.
3. Consolidation policy instruments and their impact on equity and growth
5. Earlier work by the OECD on the sharing of macroeconomic risk in society has found evidence that strong fiscal consolidations have reduced the income share of the two lowest quintiles of the income distribution, increasing income inequality.4 Insofar as social transfers were cut during past fiscal consolidations, low-income households may have been particularly affected. Similarly, public programmes aimed at helping the poor may be easier to fund during times of fiscal expansions. Thus, how large fiscal consolidations affect different income groups raises concerns regarding the allocation of associated gains and losses.
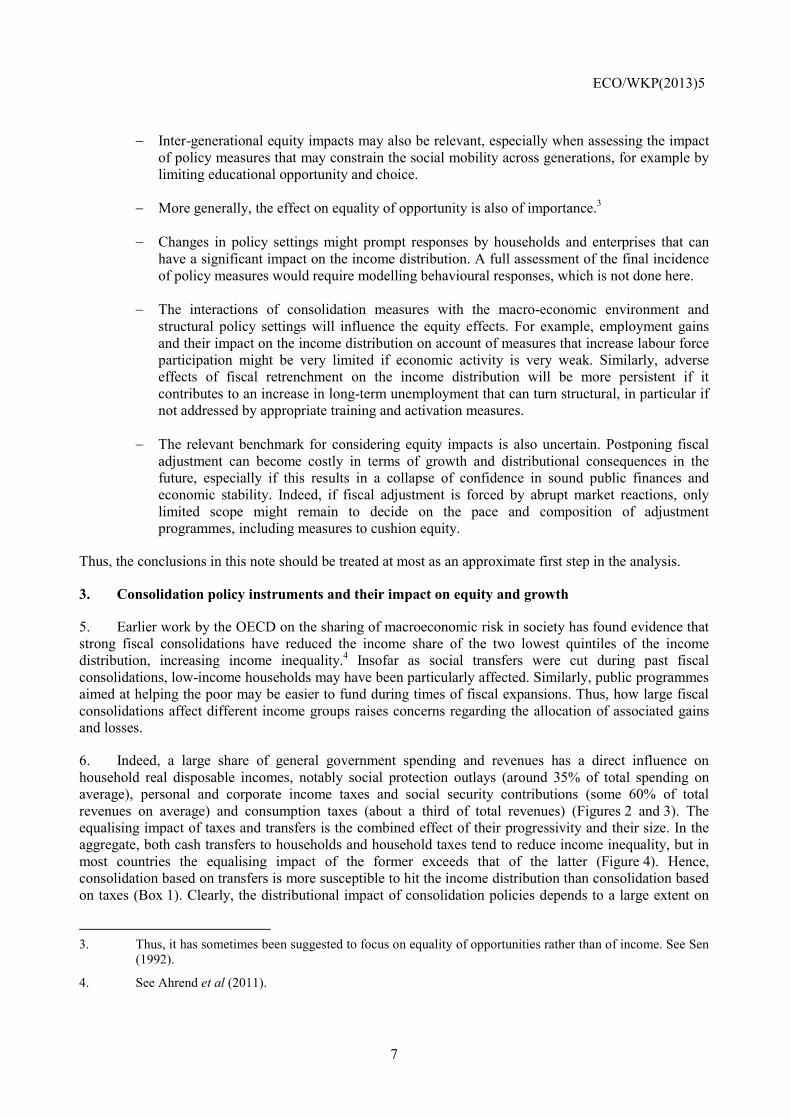
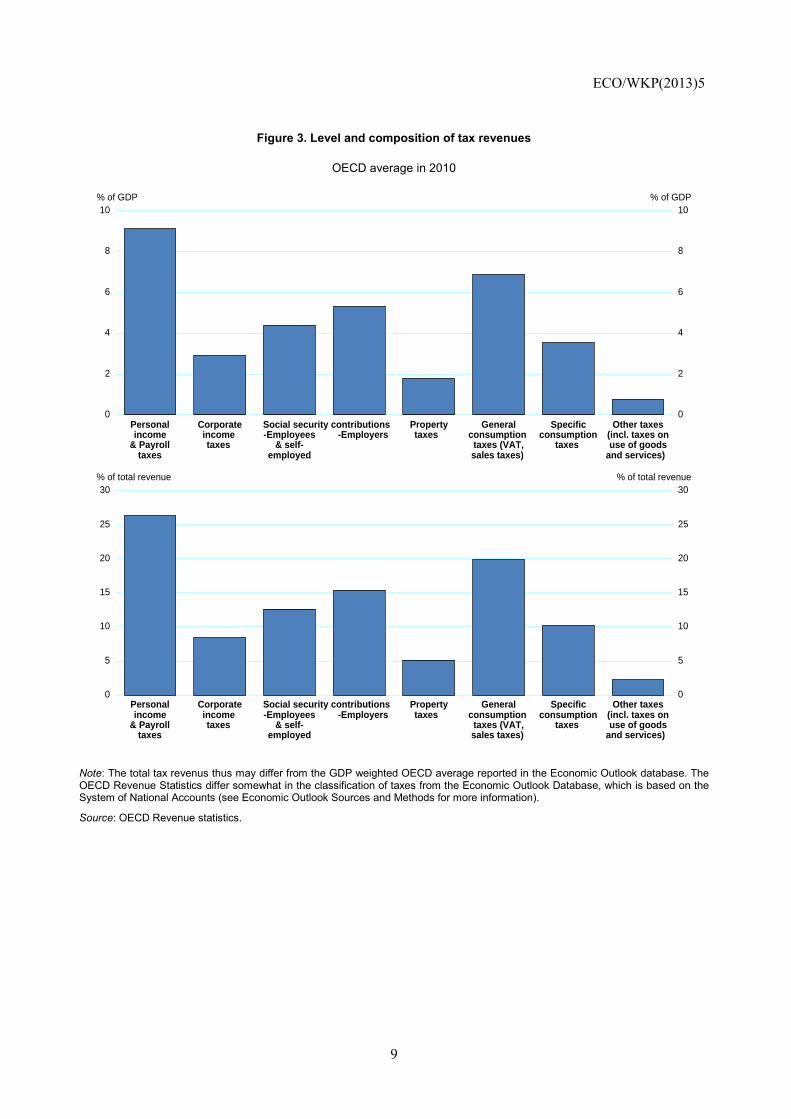
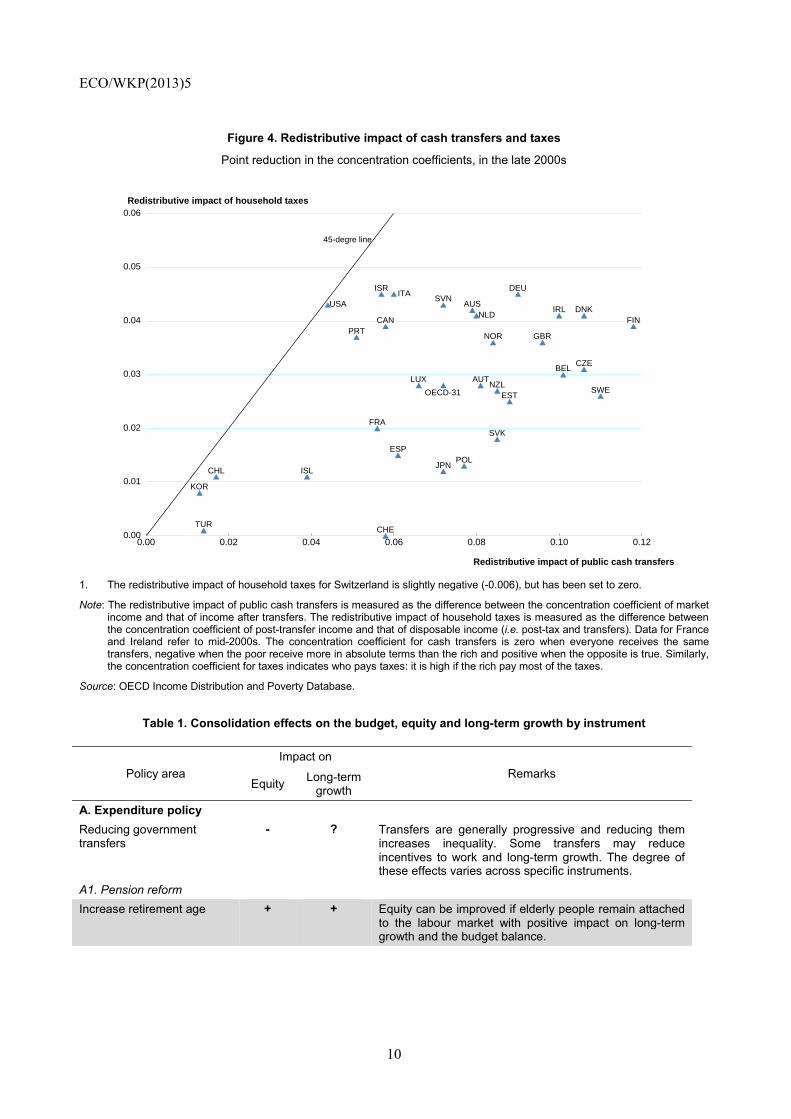
6. Indeed, a large share of general government spending and revenues has a direct influence on household real disposable incomes, notably social protection outlays (around 35% of total spending on average), personal and corporate income taxes and social security contributions (some 60% of total revenues on average) and consumption taxes (about a third of total revenues) (Figures 2 and 3). The equalising impact of taxes and transfers is the combined effect of their progressivity and their size. In the aggregate, both cash transfers to households and household taxes tend to reduce income inequality, but in most countries the equalising impact of the former exceeds that of the latter (Figure 4). Hence, consolidation based on transfers is more susceptible to hit the income distribution than consolidation based on taxes (Box 1). Clearly, the distributional impact of consolidation policies depends to a large extent on
3. Thus, it has sometimes been suggested to focus on equality of opportunities rather than of income. See Sen
(1992).
4. See Ahrend et al (2011).
ECO/WKP(2013)5
8
the specific instruments chosen, and this is highlighted in this section, drawing on earlier OECD work.5 However, what ultimately matters is the distributional effect of entire consolidation packages and to what extent consolidation policies are linked to structural reform. Table 1 presents a tentative summary of the effects of the main consolidation instruments on equity and long-term growth, subject to the reservations made above.
Figure 2. The structure of general government expenditure
OECD average in 2010
Note: The OECD average of available data is an unweighted average of countries’ expenditure shares for each category (for total expenditures it thus differs from the GDP weighted OECD average reported in the Economic Outlook database). It excludes Australia, Canada, Chile, Mexico, New Zealand and Switzerland where 2010 data are not available. Data on environment protection for the United States are not available.
Source: OECD National Accounts Statistics.
5. This work is summarised in the OECD Economics Department’s Policy Note of January 2012, see OECD
(2012a). See also OECD (2012b), Joumard et al. (2012) and Sutherland et al. (2012).
0
2
4
6
8
10
12
14
16
18% of GDP
0
2
4
6
8
10
12
14
16
18% of GDP
General public services (incl. interest)
Defence, public order and safety
Economic affairs
Environment protection
Housing and recreation
Health Education Social protection
0
5
10
15
20
25
30
35
40% of total expenditure
0
5
10
15
20
25
30
35
40% of total expenditure
General public services (incl. interest)
Defence, public order and safety
Economic affairs
Environment protection
Housing and recreation
Health Education Social protection
ECO/WKP(2013)5
9
Figure 3. Level and composition of tax revenues
OECD average in 2010
Note: The total tax revenus thus may differ from the GDP weighted OECD average reported in the Economic Outlook database. The OECD Revenue Statistics differ somewhat in the classification of taxes from the Economic Outlook Database, which is based on the System of National Accounts (see Economic Outlook Sources and Methods for more information).
Source: OECD Revenue statistics.
0
2
4
6
8
10% of GDP
0
2
4
6
8
10% of GDP
Personalincome
& Payrolltaxes
Corporateincome taxes
Social security contributions-Employees
& self-employed
-Employers Propertytaxes
Generalconsumption taxes (VAT,sales taxes)
Specificconsumption
taxes
Other taxes(incl. taxes onuse of goods
and services)
0
5
10
15
20
25
30% of total revenue
0
5
10
15
20
25
30% of total revenue
Personalincome
& Payrolltaxes
Corporateincome taxes
Social security contributions-Employees
& self-employed
-Employers Propertytaxes
Generalconsumption taxes (VAT,sales taxes)
Specificconsumption
taxes
Other taxes(incl. taxes onuse of goods
and services)
ECO/WKP(2013)5
10
Figure 4. Redistributive impact of cash transfers and taxes
Point reduction in the concentration coefficients, in the late 2000s
1. The redistributive impact of household taxes for Switzerland is slightly negative (-0.006), but has been set to zero.
Note: The redistributive impact of public cash transfers is measured as the difference between the concentration coefficient of market income and that of income after transfers. The redistributive impact of household taxes is measured as the difference between the concentration coefficient of post-transfer income and that of disposable income (i.e. post-tax and transfers). Data for France and Ireland refer to mid-2000s. The concentration coefficient for cash transfers is zero when everyone receives the same transfers, negative when the poor receive more in absolute terms than the rich and positive when the opposite is true. Similarly, the concentration coefficient for taxes indicates who pays taxes: it is high if the rich pay most of the taxes.
Source: OECD Income Distribution and Poverty Database.
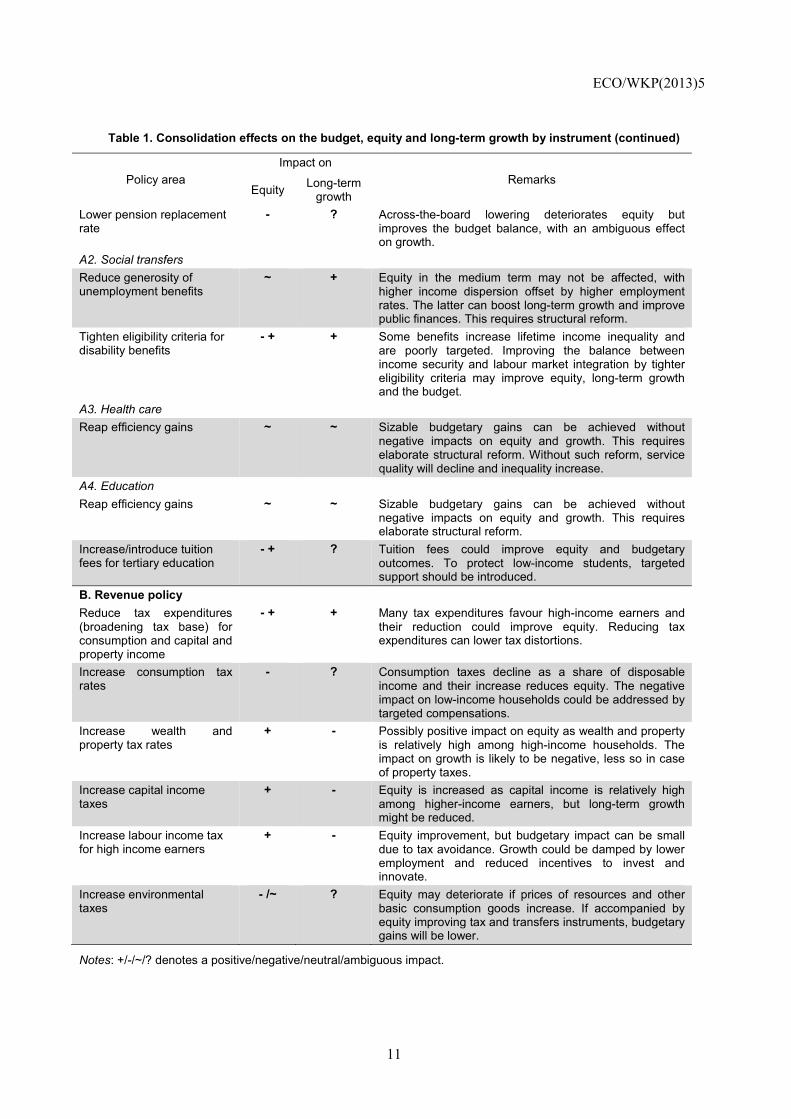
Table 1. Consolidation effects on the budget, equity and long-term growth by instrument
Policy area Impact on
Remarks Equity Long-term
growth A. Expenditure policy Reducing government transfers
- ? Transfers are generally progressive and reducing them increases inequality. Some transfers may reduce incentives to work and long-term growth. The degree of these effects varies across specific instruments.
A1. Pension reform Increase retirement age + + Equity can be improved if elderly people remain attached
to the labour market with positive impact on long-term growth and the budget balance.
0.00 0.02 0.04 0.06 0.08 0.10 0.120.00
0.01
0.02
0.03
0.04
0.05
0.06Redistributive impact of household taxes
Redistributive impact of public cash transfers
45-degre line
AUS
AUTBEL
CAN
CHE
CHL
CZE
DEU
DNK
ESP
EST
FIN
FRA
GBR
IRL
ISL
ISRITA
JPN
KOR
LUX
NLD
NOR
NZL
POL
PRT
SVK
SVN
SWE
TUR
USA
OECD-31
ECO/WKP(2013)5
11
Table 1. Consolidation effects on the budget, equity and long-term growth by instrument (continued)
Policy area Impact on
Remarks Equity Long-term
growth Lower pension replacement rate
- ? Across-the-board lowering deteriorates equity but improves the budget balance, with an ambiguous effect on growth.
A2. Social transfers Reduce generosity of unemployment benefits
~ + Equity in the medium term may not be affected, with higher income dispersion offset by higher employment rates. The latter can boost long-term growth and improve public finances. This requires structural reform.
Tighten eligibility criteria for disability benefits
- + + Some benefits increase lifetime income inequality and are poorly targeted. Improving the balance between income security and labour market integration by tighter eligibility criteria may improve equity, long-term growth and the budget.
A3. Health care Reap efficiency gains ~ ~ Sizable budgetary gains can be achieved without
negative impacts on equity and growth. This requires elaborate structural reform. Without such reform, service quality will decline and inequality increase.
A4. Education Reap efficiency gains ~ ~ Sizable budgetary gains can be achieved without
negative impacts on equity and growth. This requires elaborate structural reform.
Increase/introduce tuition fees for tertiary education
- + ? Tuition fees could improve equity and budgetary outcomes. To protect low-income students, targeted support should be introduced.
B. Revenue policy Reduce tax expenditures (broadening tax base) for consumption and capital and property income
- + + Many tax expenditures favour high-income earners and their reduction could improve equity. Reducing tax expenditures can lower tax distortions.
Increase consumption tax rates
- ? Consumption taxes decline as a share of disposable income and their increase reduces equity. The negative impact on low-income households could be addressed by targeted compensations.
Increase wealth and property tax rates
+ - Possibly positive impact on equity as wealth and property is relatively high among high-income households. The impact on growth is likely to be negative, less so in case of property taxes.
Increase capital income taxes
+ - Equity is increased as capital income is relatively high among higher-income earners, but long-term growth might be reduced.
Increase labour income tax for high income earners
+ - Equity improvement, but budgetary impact can be small due to tax avoidance. Growth could be damped by lower employment and reduced incentives to invest and innovate.
Increase environmental taxes
- /~ ? Equity may deteriorate if prices of resources and other basic consumption goods increase. If accompanied by equity improving tax and transfers instruments, budgetary gains will be lower.
Notes: +/-/~/? denotes a positive/negative/neutral/ambiguous impact.
ECO/WKP(2013)5
12
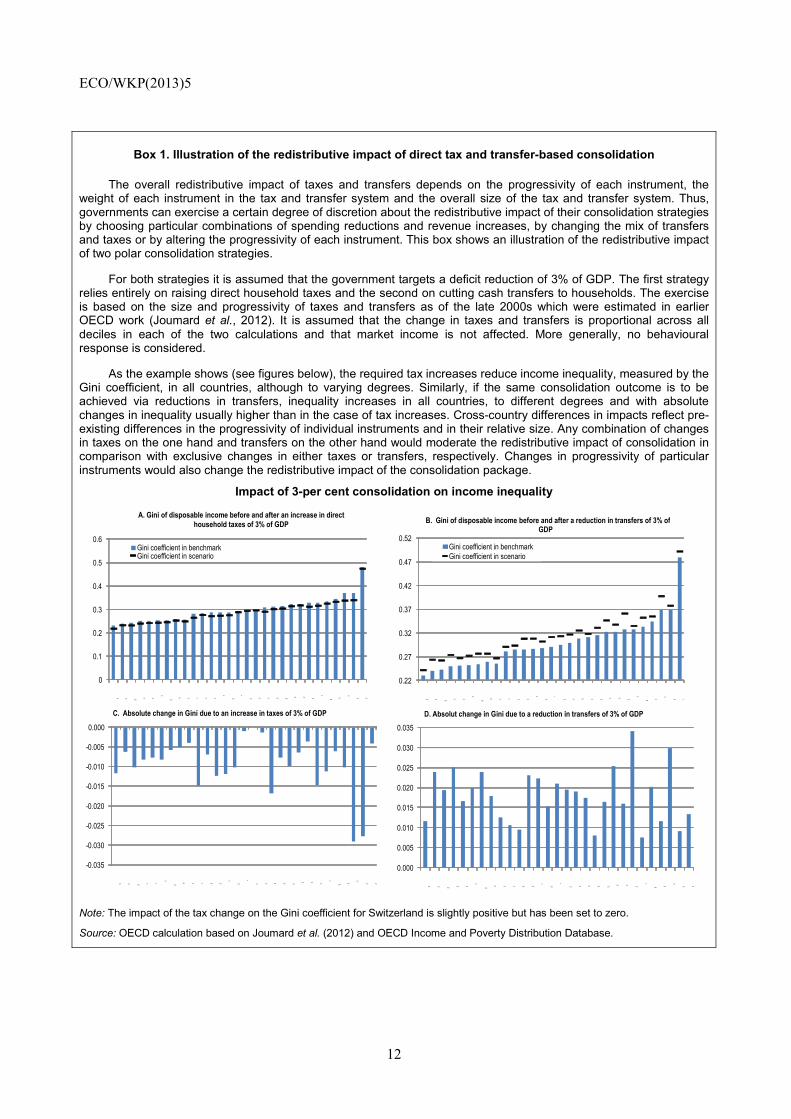
Box 1. Illustration of the redistributive impact of direct tax and transfer-based consolidation
The overall redistributive impact of taxes and transfers depends on the progressivity of each instrument, the weight of each instrument in the tax and transfer system and the overall size of the tax and transfer system. Thus, governments can exercise a certain degree of discretion about the redistributive impact of their consolidation strategies by choosing particular combinations of spending reductions and revenue increases, by changing the mix of transfers and taxes or by altering the progressivity of each instrument. This box shows an illustration of the redistributive impact of two polar consolidation strategies.
For both strategies it is assumed that the government targets a deficit reduction of 3% of GDP. The first strategy relies entirely on raising direct household taxes and the second on cutting cash transfers to households. The exercise is based on the size and progressivity of taxes and transfers as of the late 2000s which were estimated in earlier OECD work (Joumard et al., 2012). It is assumed that the change in taxes and transfers is proportional across all deciles in each of the two calculations and that market income is not affected. More generally, no behavioural response is considered.
As the example shows (see figures below), the required tax increases reduce income inequality, measured by the Gini coefficient, in all countries, although to varying degrees. Similarly, if the same consolidation outcome is to be achieved via reductions in transfers, inequality increases in all countries, to different degrees and with absolute changes in inequality usually higher than in the case of tax increases. Cross-country differences in impacts reflect pre-existing differences in the progressivity of individual instruments and in their relative size. Any combination of changes in taxes on the one hand and transfers on the other hand would moderate the redistributive impact of consolidation in comparison with exclusive changes in either taxes or transfers, respectively. Changes in progressivity of particular instruments would also change the redistributive impact of the consolidation package.
Impact of 3-per cent consolidation on income inequality
Note: The impact of the tax change on the Gini coefficient for Switzerland is slightly positive but has been set to zero.
Source: OECD calculation based on Joumard et al. (2012) and OECD Income and Poverty Distribution Database.
0.22
0.27
0.32
0.37
0.42
0.47
0.52
SVN DNKNOR
CZE SVK
FIN
SWEBEL AUT LUX FRA NLD
IRL
DEU
IS
CHE POL EST ESP CAN NZL JPNAUS ITA
GBRPRT
ISR USA CHL
B. Gini of disposable income before and after a reduction in transfers of 3% of GDP
Gini coefficient in benchmarkGini coefficient in scenario
0.000
0.005
0.010
0.015
0.020
0.025
0.030
0.035
SVN DNKNOR
CZE SVK
FIN
SWEBEL AUT LUX FRA NLD
IRL
DEU
IS
CHE POL EST ESP CANNZL JPN
AUS
ITA
GBRPRT
ISR
USA CHL
D. Absolut change in Gini due to a reduction in transfers of 3% of GDP
0
0.1
0.2
0.3
0.4
0.5
0.6
SVN DNK NOR CZE SVK
FIN SWE
BEL AUT LUX FRA NLD
IRL
DEU
IS
CHE POL EST ESP CAN NZL JPNAUS
ITA
GBRPRT
ISR
USA CHL
A. Gini of disposable income before and after an increase in direct household taxes of 3% of GDP
Gini coefficient in benchmarkGini coefficient in scenario
-0.035
-0.030
-0.025
-0.020
-0.015
-0.010
-0.005
0.000
SVN DNK NOR
CZE SVK
FIN
SWEBEL AUT LUX FRA NLD
IRL
DEU
IS
CHE POL EST ESP CAN NZL JPNAUS
ITA
GBRPRT
ISR
USA CHL
C. Absolute change in Gini due to an increase in taxes of 3% of GDP
ECO/WKP(2013)5
13
3.1 Impacts of individual spending instruments
Pensions
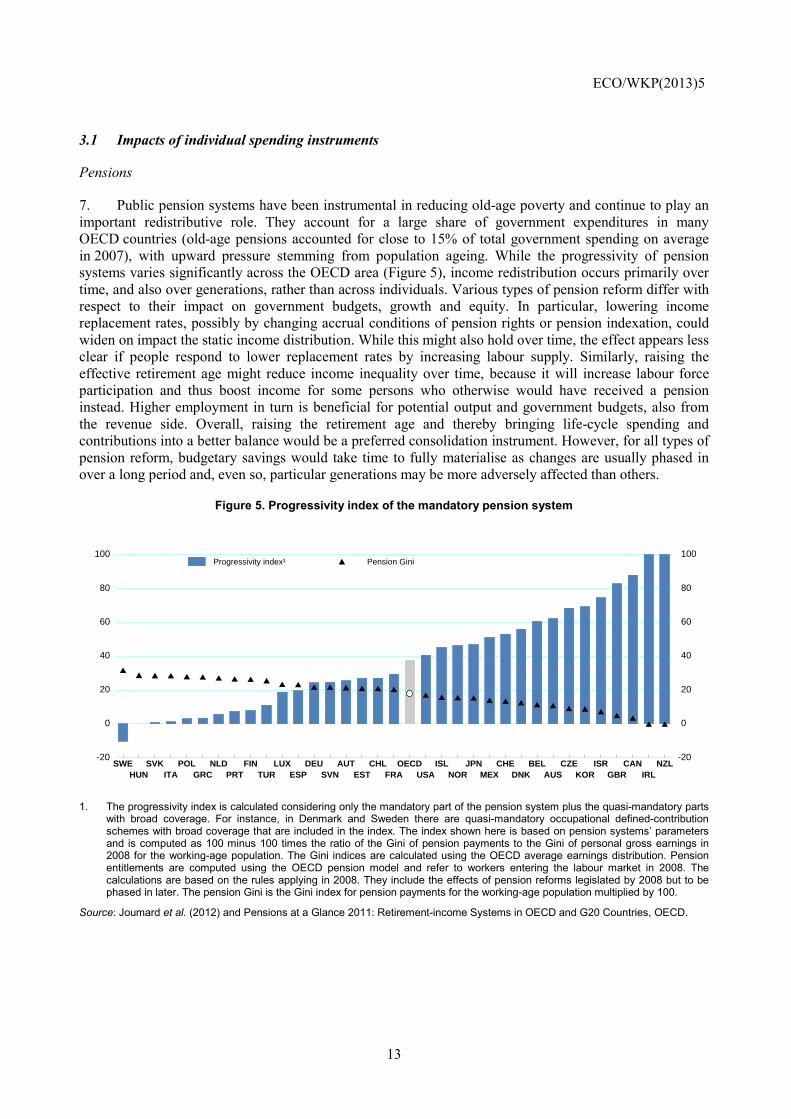
7. Public pension systems have been instrumental in reducing old-age poverty and continue to play an important redistributive role. They account for a large share of government expenditures in many OECD countries (old-age pensions accounted for close to 15% of total government spending on average in 2007), with upward pressure stemming from population ageing. While the progressivity of pension systems varies significantly across the OECD area (Figure 5), income redistribution occurs primarily over time, and also over generations, rather than across individuals. Various types of pension reform differ with respect to their impact on government budgets, growth and equity. In particular, lowering income replacement rates, possibly by changing accrual conditions of pension rights or pension indexation, could widen on impact the static income distribution. While this might also hold over time, the effect appears less clear if people respond to lower replacement rates by increasing labour supply. Similarly, raising the effective retirement age might reduce income inequality over time, because it will increase labour force participation and thus boost income for some persons who otherwise would have received a pension instead. Higher employment in turn is beneficial for potential output and government budgets, also from the revenue side. Overall, raising the retirement age and thereby bringing life-cycle spending and contributions into a better balance would be a preferred consolidation instrument. However, for all types of pension reform, budgetary savings would take time to fully materialise as changes are usually phased in over a long period and, even so, particular generations may be more adversely affected than others.
Figure 5. Progressivity index of the mandatory pension system
1. The progressivity index is calculated considering only the mandatory part of the pension system plus the quasi-mandatory parts with broad coverage. For instance, in Denmark and Sweden there are quasi-mandatory occupational defined-contribution schemes with broad coverage that are included in the index. The index shown here is based on pension systems’ parameters and is computed as 100 minus 100 times the ratio of the Gini of pension payments to the Gini of personal gross earnings in 2008 for the working-age population. The Gini indices are calculated using the OECD average earnings distribution. Pension entitlements are computed using the OECD pension model and refer to workers entering the labour market in 2008. The calculations are based on the rules applying in 2008. They include the effects of pension reforms legislated by 2008 but to be phased in later. The pension Gini is the Gini index for pension payments for the working-age population multiplied by 100.
Source: Joumard et al. (2012) and Pensions at a Glance 2011: Retirement-income Systems in OECD and G20 Countries, OECD.
SWE SVK POL NLD FIN LUX DEU AUT CHL OECD ISL JPN CHE BEL CZE ISR CAN NZLHUN ITA GRC PRT TUR ESP SVN EST FRA USA NOR MEX DNK AUS KOR GBR IRL
-20
0
20
40
60
80
100
-20
0
20
40
60
80
100
Progressivity index¹ Pension Gini
ECO/WKP(2013)5
14
Unemployment benefits
8. The redistributive effect of unemployment benefits depends on the parameters of the system and the distribution of unemployment. Although unemployment benefits are in most countries insurance-based and related to earnings, some progressivity stems from the fact that low-wage earners are more likely to become unemployed, and benefits in some cases being subject to minima and maxima (that are not fully reflected in contribution rates). However, reducing the generosity of unemployment benefits is often found to change little the overall steady-state inequality of the working-age population, as the widening impact on income dispersion is offset by higher employment rates in the medium term – which also boost long-term output potential.6 Nonetheless, cutting unemployment benefit duration or income replacement rates during periods of high unemployment and when social assistance is weak can have a negative effect on income distribution and poverty that is not compensated for by rising employment. Hence, reducing replacement rates or benefit duration may not be desirable during deep and protracted downturns.
Disability benefits
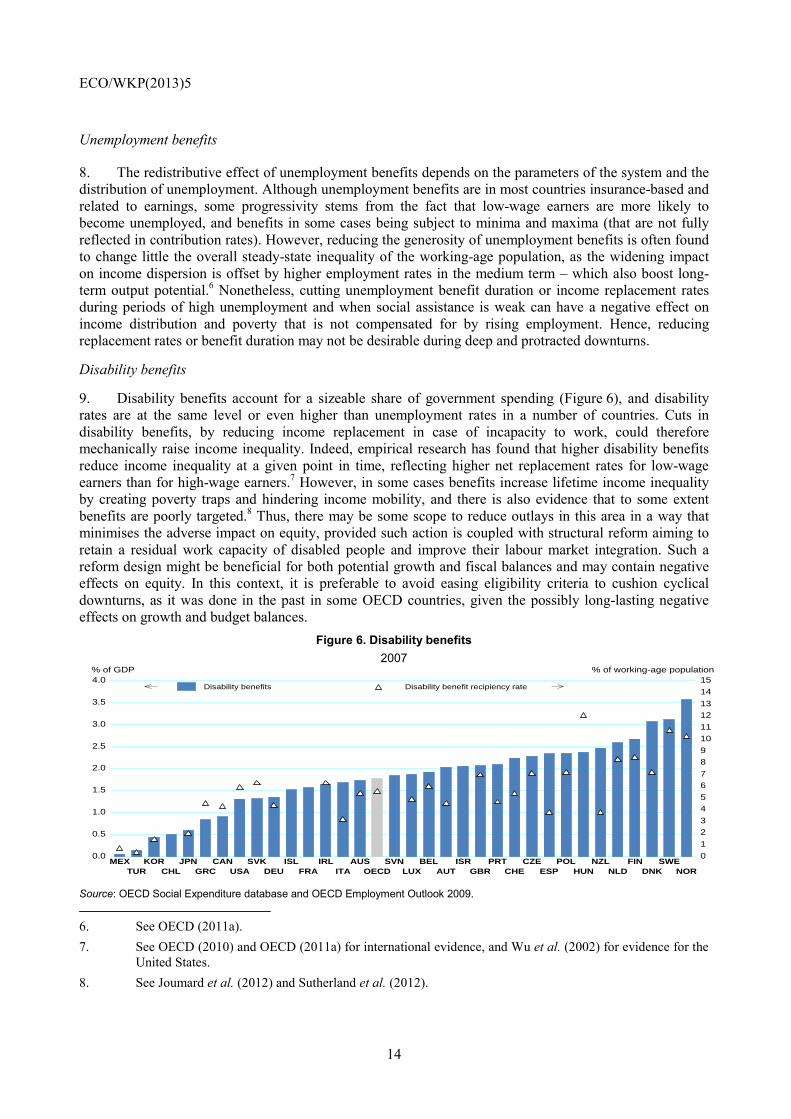
9. Disability benefits account for a sizeable share of government spending (Figure 6), and disability rates are at the same level or even higher than unemployment rates in a number of countries. Cuts in disability benefits, by reducing income replacement in case of incapacity to work, could therefore mechanically raise income inequality. Indeed, empirical research has found that higher disability benefits reduce income inequality at a given point in time, reflecting higher net replacement rates for low-wage earners than for high-wage earners.7 However, in some cases benefits increase lifetime income inequality by creating poverty traps and hindering income mobility, and there is also evidence that to some extent benefits are poorly targeted.8 Thus, there may be some scope to reduce outlays in this area in a way that minimises the adverse impact on equity, provided such action is coupled with structural reform aiming to retain a residual work capacity of disabled people and improve their labour market integration. Such a reform design might be beneficial for both potential growth and fiscal balances and may contain negative effects on equity. In this context, it is preferable to avoid easing eligibility criteria to cushion cyclical downturns, as it was done in the past in some OECD countries, given the possibly long-lasting negative effects on growth and budget balances.
Figure 6. Disability benefits 2007
Source: OECD Social Expenditure database and OECD Employment Outlook 2009. 6. See OECD (2011a). 7. See OECD (2010) and OECD (2011a) for international evidence, and Wu et al. (2002) for evidence for the
United States. 8. See Joumard et al. (2012) and Sutherland et al. (2012).
MEX KOR JPN CAN SVK ISL IRL AUS SVN BEL ISR PRT CZE POL NZL FIN SWETUR CHL GRC USA DEU FRA ITA OECD LUX AUT GBR CHE ESP HUN NLD DNK NOR
0.0
0.5
1.0
1.5
2.0
2.5
3.0
3.5
4.0% of GDP
0
1
2
3
4
5
6
7
8
9
10
11
12
13
14
15% of working-age population
Disability benefits Disability benefit recipiency rate
ECO/WKP(2013)5
15
Health care spending
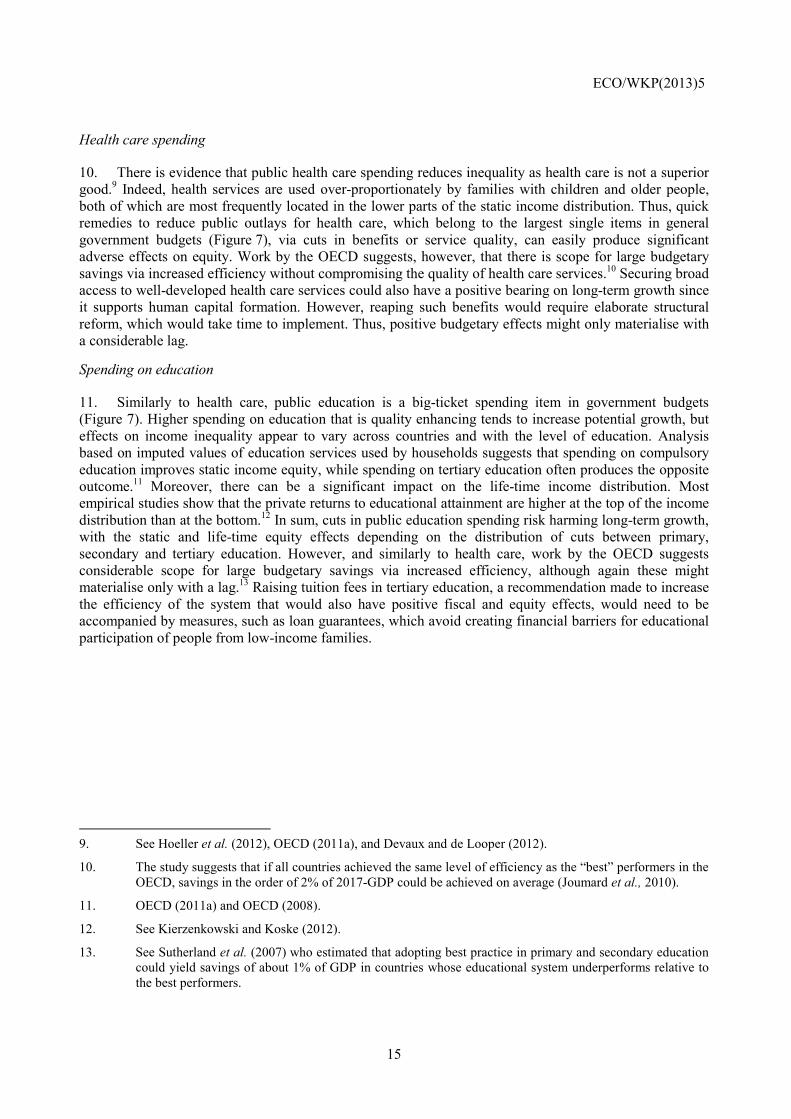
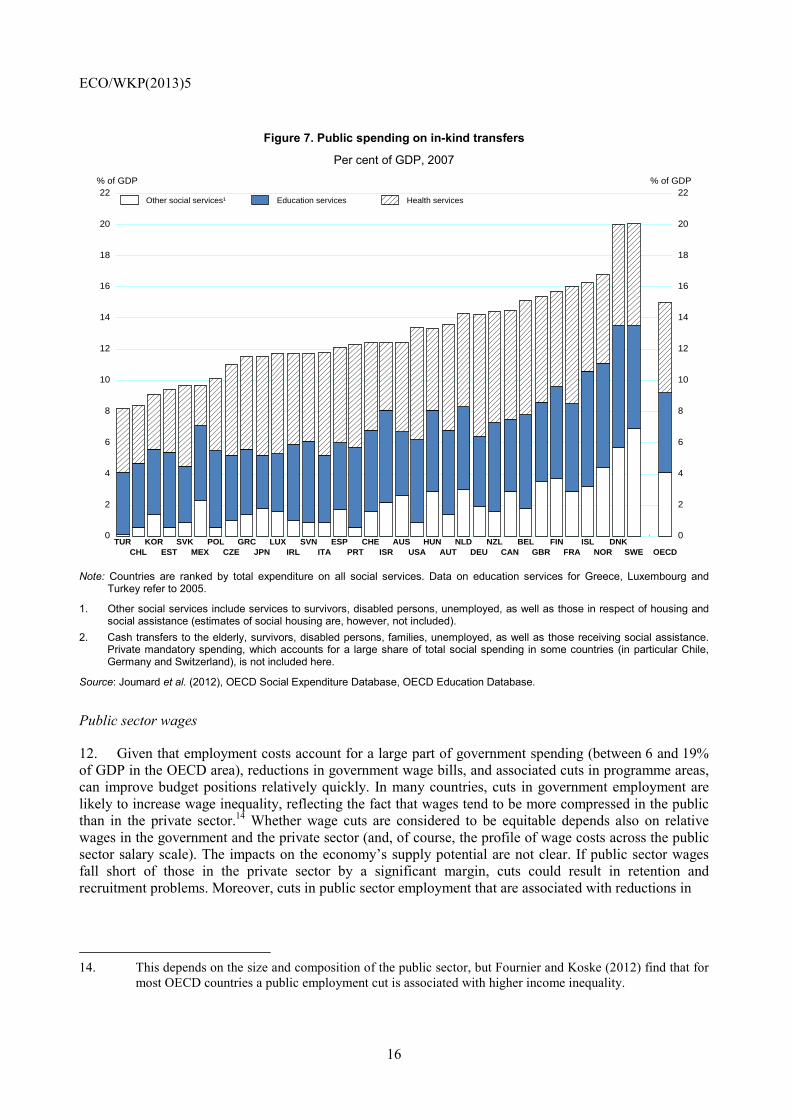
10. There is evidence that public health care spending reduces inequality as health care is not a superior good.9 Indeed, health services are used over-proportionately by families with children and older people, both of which are most frequently located in the lower parts of the static income distribution. Thus, quick remedies to reduce public outlays for health care, which belong to the largest single items in general government budgets (Figure 7), via cuts in benefits or service quality, can easily produce significant adverse effects on equity. Work by the OECD suggests, however, that there is scope for large budgetary savings via increased efficiency without compromising the quality of health care services.10 Securing broad access to well-developed health care services could also have a positive bearing on long-term growth since it supports human capital formation. However, reaping such benefits would require elaborate structural reform, which would take time to implement. Thus, positive budgetary effects might only materialise with a considerable lag.
Spending on education
11. Similarly to health care, public education is a big-ticket spending item in government budgets (Figure 7). Higher spending on education that is quality enhancing tends to increase potential growth, but effects on income inequality appear to vary across countries and with the level of education. Analysis based on imputed values of education services used by households suggests that spending on compulsory education improves static income equity, while spending on tertiary education often produces the opposite outcome.11 Moreover, there can be a significant impact on the life-time income distribution. Most empirical studies show that the private returns to educational attainment are higher at the top of the income distribution than at the bottom.12 In sum, cuts in public education spending risk harming long-term growth, with the static and life-time equity effects depending on the distribution of cuts between primary, secondary and tertiary education. However, and similarly to health care, work by the OECD suggests considerable scope for large budgetary savings via increased efficiency, although again these might materialise only with a lag.13 Raising tuition fees in tertiary education, a recommendation made to increase the efficiency of the system that would also have positive fiscal and equity effects, would need to be accompanied by measures, such as loan guarantees, which avoid creating financial barriers for educational participation of people from low-income families.
9. See Hoeller et al. (2012), OECD (2011a), and Devaux and de Looper (2012).
10. The study suggests that if all countries achieved the same level of efficiency as the “best” performers in the OECD, savings in the order of 2% of 2017-GDP could be achieved on average (Joumard et al., 2010).
11. OECD (2011a) and OECD (2008).
12. See Kierzenkowski and Koske (2012).
13. See Sutherland et al. (2007) who estimated that adopting best practice in primary and secondary education could yield savings of about 1% of GDP in countries whose educational system underperforms relative to the best performers.
ECO/WKP(2013)5
16
Figure 7. Public spending on in-kind transfers
Per cent of GDP, 2007
Note: Countries are ranked by total expenditure on all social services. Data on education services for Greece, Luxembourg and
Turkey refer to 2005.
1. Other social services include services to survivors, disabled persons, unemployed, as well as those in respect of housing and social assistance (estimates of social housing are, however, not included).
2. Cash transfers to the elderly, survivors, disabled persons, families, unemployed, as well as those receiving social assistance. Private mandatory spending, which accounts for a large share of total social spending in some countries (in particular Chile, Germany and Switzerland), is not included here.
Source: Joumard et al. (2012), OECD Social Expenditure Database, OECD Education Database.
Public sector wages
12. Given that employment costs account for a large part of government spending (between 6 and 19% of GDP in the OECD area), reductions in government wage bills, and associated cuts in programme areas, can improve budget positions relatively quickly. In many countries, cuts in government employment are likely to increase wage inequality, reflecting the fact that wages tend to be more compressed in the public than in the private sector.14 Whether wage cuts are considered to be equitable depends also on relative wages in the government and the private sector (and, of course, the profile of wage costs across the public sector salary scale). The impacts on the economy’s supply potential are not clear. If public sector wages fall short of those in the private sector by a significant margin, cuts could result in retention and recruitment problems. Moreover, cuts in public sector employment that are associated with reductions in
14. This depends on the size and composition of the public sector, but Fournier and Koske (2012) find that for
most OECD countries a public employment cut is associated with higher income inequality.
TUR KOR SVK POL GRC LUX SVN ESP CHE AUS HUN NLD NZL BEL FIN ISL DNK CHL EST MEX CZE JPN IRL ITA PRT ISR USA AUT DEU CAN GBR FRA NOR SWE OECD
0
2
4
6
8
10
12
14
16
18
20
22% of GDP
0
2
4
6
8
10
12
14
16
18
20
22% of GDP
Other social services¹ Education services Health services
ECO/WKP(2013)5
17
public sector services could be detrimental to equity, health care and education being major examples. On the other hand, seen in a medium-term perspective, reductions in government wages might lead to wage moderation in the private sector as well, which in turn could have a positive impact on employment.
3.2 Impacts of individual revenue instruments
Tax expenditures
13. Assessing the overall volume of tax expenditures (TEs) raises issues of definition and methodology, but it is clear that their use has been growing in many OECD countries, and in some countries tax preferences are substantial.15 For example, in the United States, 247 TEs affecting personal and corporate taxes were identified in 2008, with an estimated value roughly equal to total personal income taxes collected in that year.16
14. A large number of TEs have been introduced without serious welfare considerations, although there are exceptions. In particular, income tax credits and payroll tax rebates for low-wage workers are often assessed as being effective in achieving their objectives, equalising incomes while strengthening work incentives at the low end, though they are often associated with adverse incentives in phase-out ranges and their financing may further impair incentives. The value of many other tax reliefs often increases for higher tax brackets, which can produce highly unequal outcomes and might be costly in achieving certain policy targets. Tax breaks for health and child care, education, owner-occupied housing and retirement savings often fall into this category, especially if they are granted as reduction in the tax base rather than as reduction in the tax payable or in terms of tax credits. For example, deductions in the taxable income of parents for their children’s education disproportionately benefit families in high-income segments as a higher tax bracket increases the value of the tax deduction. Overall, many TEs can significantly reduce the progressivity of the personal income tax while often being distortionary for growth. Cutting TEs unless there is compelling evidence that they improve social outcomes can thus benefit budgets, equity and long-term growth, although policy implementation can be politically difficult.
Consumption taxes
15. Consumption taxes account for a large share of general government revenues in all OECD countries (Figure 3) and tend to decline as a share of disposable income with higher incomes, since lower-income households tend to use a larger share of their incomes for consumption. For example, in the United Kingdom, in 2008 indirect taxes amounted to over 25% of household gross income for the lowest quintile and less than 10% for the top quintile.17 To mitigate this regressiveness, many OECD countries apply reduced rates and exemptions for goods and services deemed important for lower-income families. Indeed, a substantial portion of potential revenue is foregone in most OECD countries due to a combination of reduced VAT rates, a narrow base and low compliance (Figure 8). Tax concessions often benefit more in absolute terms people at higher income levels since they consume more. Thus, other means, such as targeted transfers, may be more effective to achieve social objectives than preferential tax rates and less likely to lead to rent-seeking activity. Also, consumption taxes might be little regressive in a lifetime perspective: consumption patterns change over the life cycle so that over their lifetime people spend more
15. See OECD (2011b).
16. See Congressional Research Service (2008).
17. See Office for National Staitistcs (2010).
ECO/WKP(2013)5
18
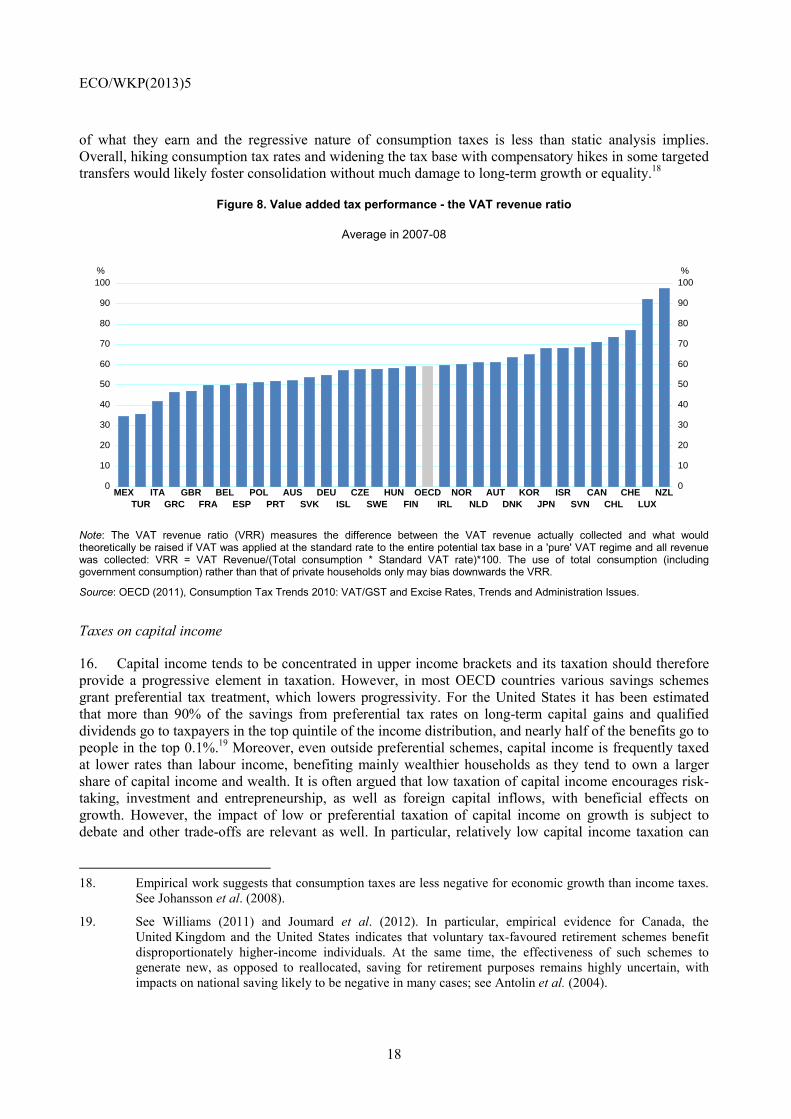
of what they earn and the regressive nature of consumption taxes is less than static analysis implies. Overall, hiking consumption tax rates and widening the tax base with compensatory hikes in some targeted transfers would likely foster consolidation without much damage to long-term growth or equality.18
Figure 8. Value added tax performance - the VAT revenue ratio
Average in 2007-08
Note: The VAT revenue ratio (VRR) measures the difference between the VAT revenue actually collected and what would theoretically be raised if VAT was applied at the standard rate to the entire potential tax base in a 'pure' VAT regime and all revenue was collected: VRR = VAT Revenue/(Total consumption * Standard VAT rate)*100. The use of total consumption (including government consumption) rather than that of private households only may bias downwards the VRR.
Source: OECD (2011), Consumption Tax Trends 2010: VAT/GST and Excise Rates, Trends and Administration Issues.
Taxes on capital income
16. Capital income tends to be concentrated in upper income brackets and its taxation should therefore provide a progressive element in taxation. However, in most OECD countries various savings schemes grant preferential tax treatment, which lowers progressivity. For the United States it has been estimated that more than 90% of the savings from preferential tax rates on long-term capital gains and qualified dividends go to taxpayers in the top quintile of the income distribution, and nearly half of the benefits go to people in the top 0.1%.19 Moreover, even outside preferential schemes, capital income is frequently taxed at lower rates than labour income, benefiting mainly wealthier households as they tend to own a larger share of capital income and wealth. It is often argued that low taxation of capital income encourages risk-taking, investment and entrepreneurship, as well as foreign capital inflows, with beneficial effects on growth. However, the impact of low or preferential taxation of capital income on growth is subject to debate and other trade-offs are relevant as well. In particular, relatively low capital income taxation can
18. Empirical work suggests that consumption taxes are less negative for economic growth than income taxes.
See Johansson et al. (2008).
19. See Williams (2011) and Joumard et al. (2012). In particular, empirical evidence for Canada, the United Kingdom and the United States indicates that voluntary tax-favoured retirement schemes benefit disproportionately higher-income individuals. At the same time, the effectiveness of such schemes to generate new, as opposed to reallocated, saving for retirement purposes remains highly uncertain, with impacts on national saving likely to be negative in many cases; see Antolin et al. (2004).
MEX ITA GBR BEL POL AUS DEU CZE HUN OECD NOR AUT KOR ISR CAN CHE NZLTUR GRC FRA ESP PRT SVK ISL SWE FIN IRL NLD DNK JPN SVN CHL LUX
0
10
20
30
40
50
60
70
80
90
100%
0
10
20
30
40
50
60
70
80
90
100%
ECO/WKP(2013)5
19
create opportunities for tax arbitrage between labour and capital income, which are often difficult to distinguish.20
17. Overall, there is scope in several countries to generate additional revenues and increase the progressivity of the tax system by cutting preferential treatment of various saving schemes without unduly harming growth. Desirable objectives (such as raising retirement savings) could be targeted with alternative policy instruments.21 More general hikes in capital income taxation may be considered where there is a large gap between capital and labour income taxation and hence strong incentives for tax arbitrage, subject to constraints arising from capital mobility across borders. Implications for equity of tax hikes will be limited by the share of capital income in total household market income being relatively modest (around 9% on average in the OECD area).
Taxes on property
18. In some countries, real estate taxes appear to be regressive in that they absorb a larger share of the income of poorer households, likely reflecting higher property holding by pensioners.22 However, this finding refers to the static distribution of incomes, and might not hold if lifetime income is considered instead. Many OECD countries have also favourable tax treatment of property (exemption of imputed income from owner-occupied dwellings,23 lower taxation of capital gains from the sale of principal residence than other capital income, deductibility of mortgage interest payments), and some have introduced real estate tax preferences for low-income groups, which can make real estate taxation progressive in the static income distribution.24 Evidence suggests that recurrent taxes on immovable property are the tax category that has the least negative impact on long-term growth, followed by other property taxes.25 At the same time, the share of property taxes in GDP is relatively small for some countries, suggesting considerable scope for tax increases (Figure 3). Overall, raising property taxes, particularly for immovable property, does not have to have negative distributional impacts while at the same time being less harmful to long-term growth than other taxes. Property taxes can be made more progressive, which would often involve updating real estate values used to calculate these taxes as they often do not reflect market values. This might involve additional administrative costs that would lower consolidation gains in the short term.
Labour income taxes
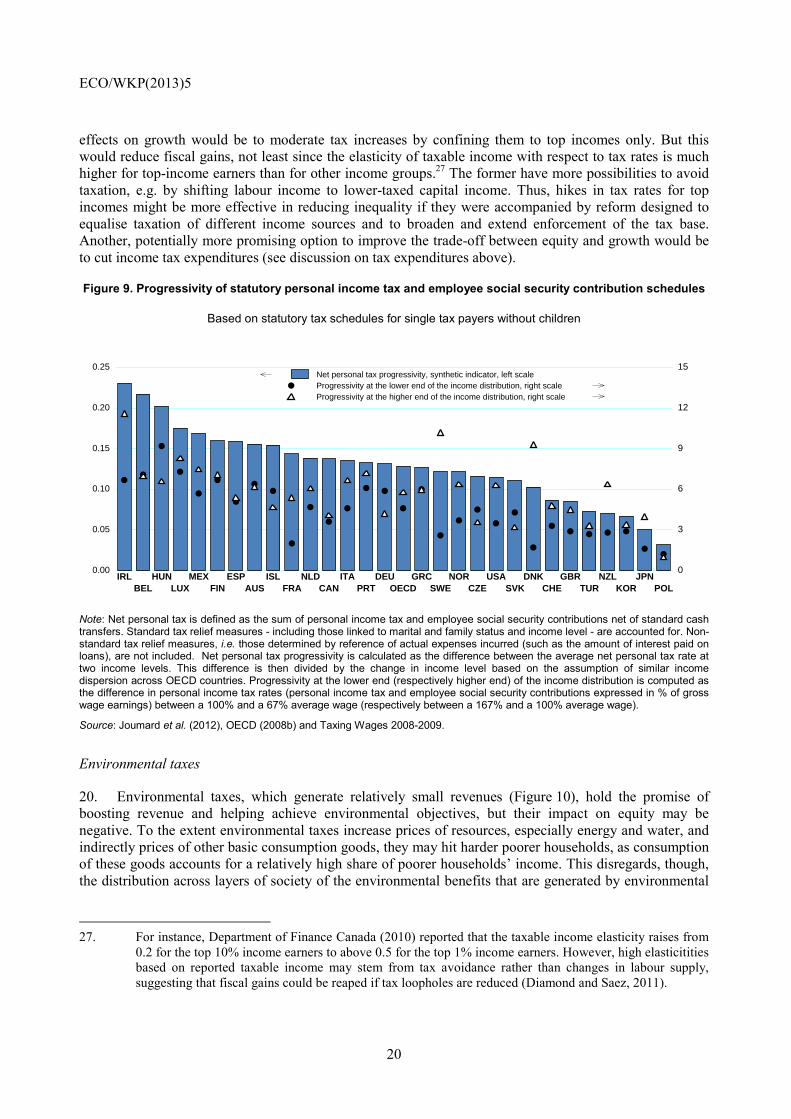
19. While the progressivity of labour income taxes varies significantly across the OECD area, income tax hikes would be a major consolidation instrument that enhances equity in the short run (Figure 9). However, it would likely reduce growth in the long run, as empirical work indicates that it is among the more distortionary tax instruments.26 This seriously reduces the attractiveness of hikes in labour income tax rates as a consolidation instrument, despite its progressivity. One option to reduce adverse 20. See Diamond and Saez (2011) and OECD (2011b).
21. Such action would not necessarily weaken government balances. For instance, promoting retirement savings could be supported by mandatory savings or, less directly, by “nudging” the choice of individuals.
22. See Chawla and Wannel (2003), Office of National Statistics (2010) and Davies et al. (2009) for Canada, the United Kingdom and the United States, respectively.
23. Implicit rental income of the owner-occupied home is exempted in most OECD countries, with the exception of the Netherlands, Sweden and Switzerland.
24. See Joumard et al. (2012).
25. See Johansson et al. (2008).
26. See Johansson et al. (2008).
ECO/WKP(2013)5
20
effects on growth would be to moderate tax increases by confining them to top incomes only. But this would reduce fiscal gains, not least since the elasticity of taxable income with respect to tax rates is much higher for top-income earners than for other income groups.27 The former have more possibilities to avoid taxation, e.g. by shifting labour income to lower-taxed capital income. Thus, hikes in tax rates for top incomes might be more effective in reducing inequality if they were accompanied by reform designed to equalise taxation of different income sources and to broaden and extend enforcement of the tax base. Another, potentially more promising option to improve the trade-off between equity and growth would be to cut income tax expenditures (see discussion on tax expenditures above).
Figure 9. Progressivity of statutory personal income tax and employee social security contribution schedules
Based on statutory tax schedules for single tax payers without children
Note: Net personal tax is defined as the sum of personal income tax and employee social security contributions net of standard cash transfers. Standard tax relief measures - including those linked to marital and family status and income level - are accounted for. Non-standard tax relief measures, i.e. those determined by reference of actual expenses incurred (such as the amount of interest paid on loans), are not included. Net personal tax progressivity is calculated as the difference between the average net personal tax rate at two income levels. This difference is then divided by the change in income level based on the assumption of similar income dispersion across OECD countries. Progressivity at the lower end (respectively higher end) of the income distribution is computed as the difference in personal income tax rates (personal income tax and employee social security contributions expressed in % of gross wage earnings) between a 100% and a 67% average wage (respectively between a 167% and a 100% average wage).
Source: Joumard et al. (2012), OECD (2008b) and Taxing Wages 2008-2009.
Environmental taxes
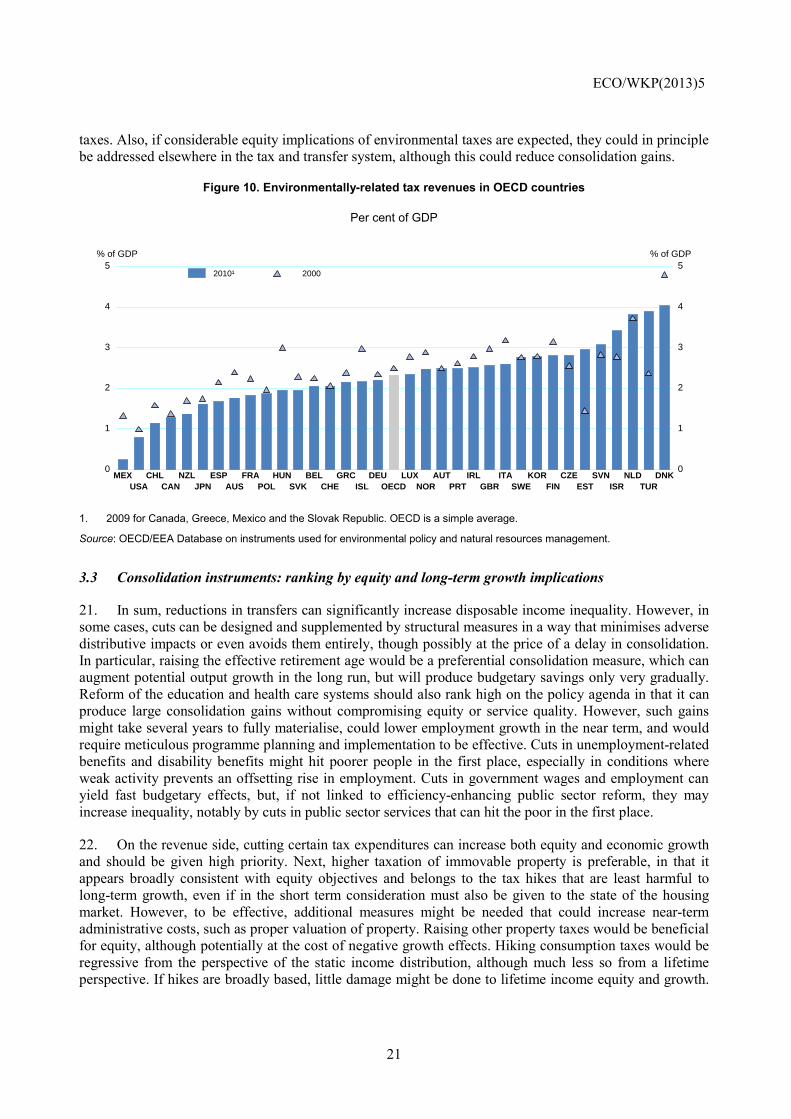
20. Environmental taxes, which generate relatively small revenues (Figure 10), hold the promise of boosting revenue and helping achieve environmental objectives, but their impact on equity may be negative. To the extent environmental taxes increase prices of resources, especially energy and water, and indirectly prices of other basic consumption goods, they may hit harder poorer households, as consumption of these goods accounts for a relatively high share of poorer households’ income. This disregards, though, the distribution across layers of society of the environmental benefits that are generated by environmental
27. For instance, Department of Finance Canada (2010) reported that the taxable income elasticity raises from
0.2 for the top 10% income earners to above 0.5 for the top 1% income earners. However, high elasticitities based on reported taxable income may stem from tax avoidance rather than changes in labour supply, suggesting that fiscal gains could be reaped if tax loopholes are reduced (Diamond and Saez, 2011).
IRL HUN MEX ESP ISL NLD ITA DEU GRC NOR USA DNK GBR NZL JPNBEL LUX FIN AUS FRA CAN PRT OECD SWE CZE SVK CHE TUR KOR POL
0.00
0.05
0.10
0.15
0.20
0.25
0
3
6
9
12
15
Net personal tax progressivity, synthetic indicator, left scaleProgressivity at the lower end of the income distribution, right scaleProgressivity at the higher end of the income distribution, right scale
ECO/WKP(2013)5
21
taxes. Also, if considerable equity implications of environmental taxes are expected, they could in principle be addressed elsewhere in the tax and transfer system, although this could reduce consolidation gains.
Figure 10. Environmentally-related tax revenues in OECD countries
Per cent of GDP
1. 2009 for Canada, Greece, Mexico and the Slovak Republic. OECD is a simple average.
Source: OECD/EEA Database on instruments used for environmental policy and natural resources management.
3.3 Consolidation instruments: ranking by equity and long-term growth implications
21. In sum, reductions in transfers can significantly increase disposable income inequality. However, in some cases, cuts can be designed and supplemented by structural measures in a way that minimises adverse distributive impacts or even avoids them entirely, though possibly at the price of a delay in consolidation. In particular, raising the effective retirement age would be a preferential consolidation measure, which can augment potential output growth in the long run, but will produce budgetary savings only very gradually. Reform of the education and health care systems should also rank high on the policy agenda in that it can produce large consolidation gains without compromising equity or service quality. However, such gains might take several years to fully materialise, could lower employment growth in the near term, and would require meticulous programme planning and implementation to be effective. Cuts in unemployment-related benefits and disability benefits might hit poorer people in the first place, especially in conditions where weak activity prevents an offsetting rise in employment. Cuts in government wages and employment can yield fast budgetary effects, but, if not linked to efficiency-enhancing public sector reform, they may increase inequality, notably by cuts in public sector services that can hit the poor in the first place.
22. On the revenue side, cutting certain tax expenditures can increase both equity and economic growth and should be given high priority. Next, higher taxation of immovable property is preferable, in that it appears broadly consistent with equity objectives and belongs to the tax hikes that are least harmful to long-term growth, even if in the short term consideration must also be given to the state of the housing market. However, to be effective, additional measures might be needed that could increase near-term administrative costs, such as proper valuation of property. Raising other property taxes would be beneficial for equity, although potentially at the cost of negative growth effects. Hiking consumption taxes would be regressive from the perspective of the static income distribution, although much less so from a lifetime perspective. If hikes are broadly based, little damage might be done to lifetime income equity and growth.
MEX CHL NZL ESP FRA HUN BEL GRC DEU LUX AUT IRL ITA KOR CZE SVN NLD DNKUSA CAN JPN AUS POL SVK CHE ISL OECD NOR PRT GBR SWE FIN EST ISR TUR
0
1
2
3
4
5% of GDP
0
1
2
3
4
5% of GDP
2010¹ 2000
ECO/WKP(2013)5
22
Hikes in capital income taxes would be positive for equity. They can be distortive with respect to growth, but are more worth considering the lower capital income taxes are relative to labour income taxes (with large gaps between the two being distortive as well). Raising labour income taxes can enhance equity in the short run, but would likely reduce growth in the long run, which makes it less suitable as a consolidation instrument.
4. Implications of current consolidation packages for equity and growth
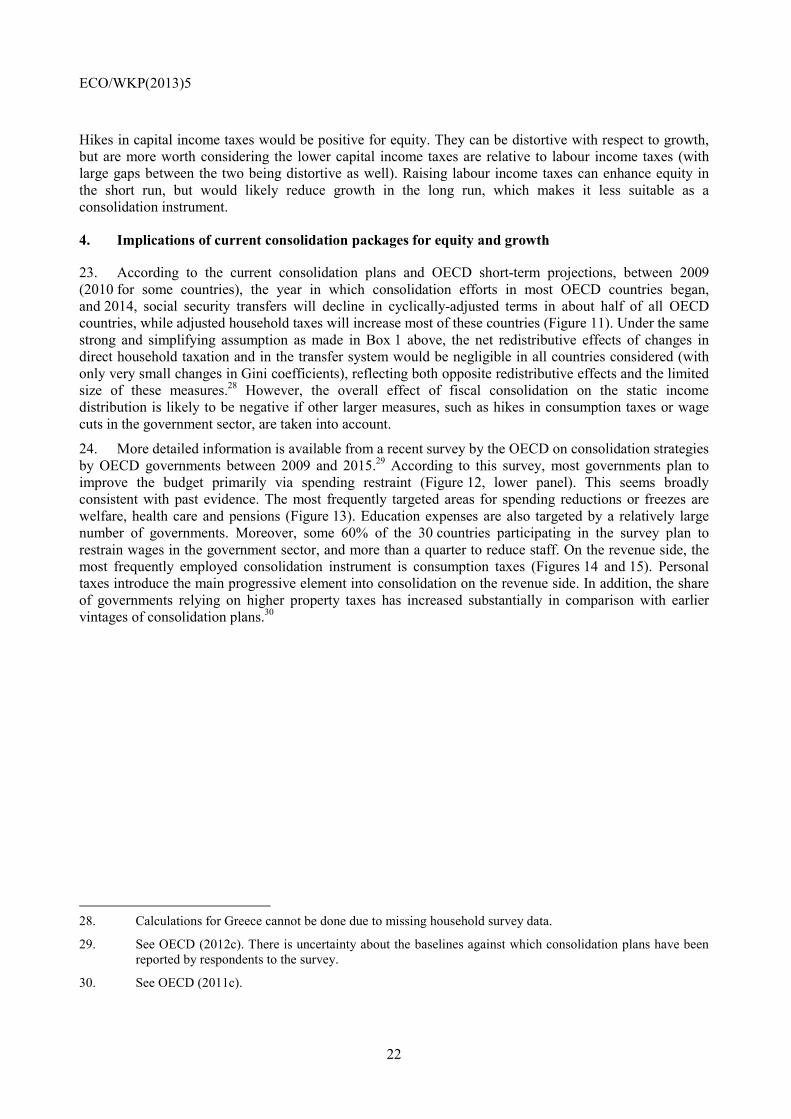
23. According to the current consolidation plans and OECD short-term projections, between 2009 (2010 for some countries), the year in which consolidation efforts in most OECD countries began, and 2014, social security transfers will decline in cyclically-adjusted terms in about half of all OECD countries, while adjusted household taxes will increase most of these countries (Figure 11). Under the same strong and simplifying assumption as made in Box 1 above, the net redistributive effects of changes in direct household taxation and in the transfer system would be negligible in all countries considered (with only very small changes in Gini coefficients), reflecting both opposite redistributive effects and the limited size of these measures.28 However, the overall effect of fiscal consolidation on the static income distribution is likely to be negative if other larger measures, such as hikes in consumption taxes or wage cuts in the government sector, are taken into account.
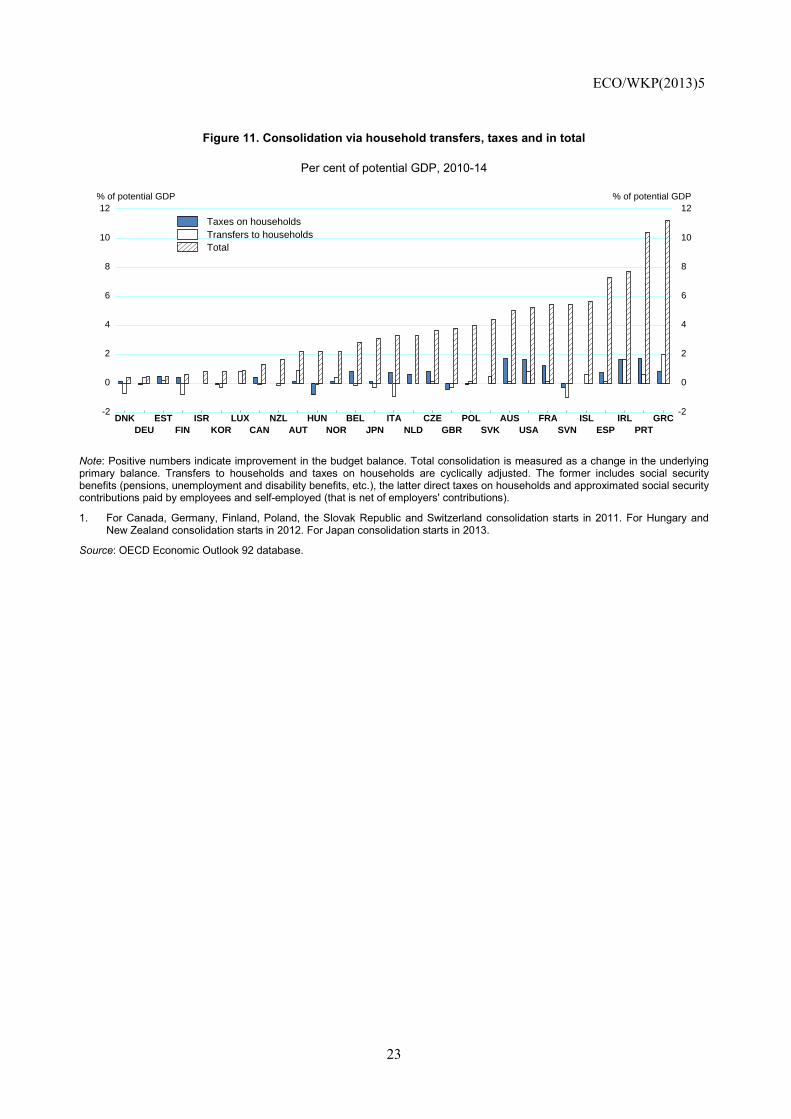
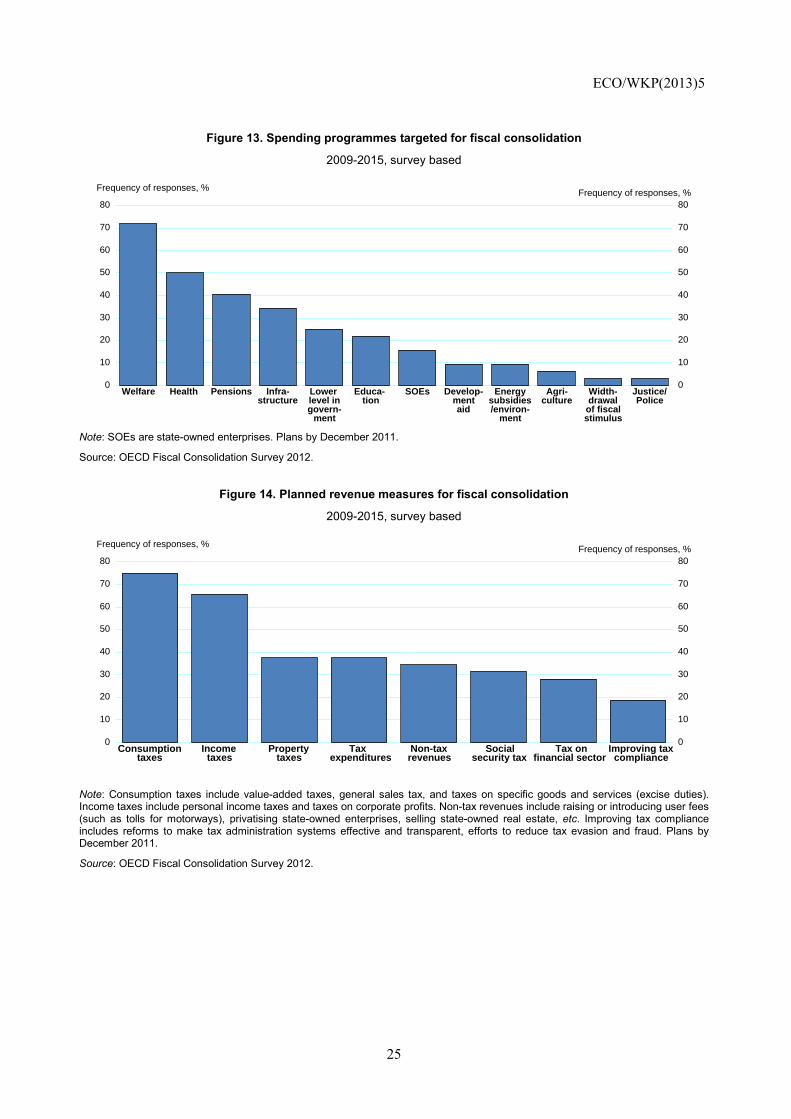
24. More detailed information is available from a recent survey by the OECD on consolidation strategies by OECD governments between 2009 and 2015.29 According to this survey, most governments plan to improve the budget primarily via spending restraint (Figure 12, lower panel). This seems broadly consistent with past evidence. The most frequently targeted areas for spending reductions or freezes are welfare, health care and pensions (Figure 13). Education expenses are also targeted by a relatively large number of governments. Moreover, some 60% of the 30 countries participating in the survey plan to restrain wages in the government sector, and more than a quarter to reduce staff. On the revenue side, the most frequently employed consolidation instrument is consumption taxes (Figures 14 and 15). Personal taxes introduce the main progressive element into consolidation on the revenue side. In addition, the share of governments relying on higher property taxes has increased substantially in comparison with earlier vintages of consolidation plans.30
28. Calculations for Greece cannot be done due to missing household survey data.
29. See OECD (2012c). There is uncertainty about the baselines against which consolidation plans have been reported by respondents to the survey.
30. See OECD (2011c).
ECO/WKP(2013)5
23
Figure 11. Consolidation via household transfers, taxes and in total
Per cent of potential GDP, 2010-14
Note: Positive numbers indicate improvement in the budget balance. Total consolidation is measured as a change in the underlying primary balance. Transfers to households and taxes on households are cyclically adjusted. The former includes social security benefits (pensions, unemployment and disability benefits, etc.), the latter direct taxes on households and approximated social security contributions paid by employees and self-employed (that is net of employers' contributions).
1. For Canada, Germany, Finland, Poland, the Slovak Republic and Switzerland consolidation starts in 2011. For Hungary and New Zealand consolidation starts in 2012. For Japan consolidation starts in 2013.
Source: OECD Economic Outlook 92 database.
DNK EST ISR LUX NZL HUN BEL ITA CZE POL AUS FRA ISL IRL GRCDEU FIN KOR CAN AUT NOR JPN NLD GBR SVK USA SVN ESP PRT
-2
0
2
4
6
8
10
12% of potential GDP
-2
0
2
4
6
8
10
12% of potential GDP
Taxes on householdsTransfers to householdsTotal
ECO/WKP(2013)5
24
Figure 12. Distribution of expenditure versus revenue based consolidation plans
1. Total consolidation is the projected difference in the underlying primary balance; revenue side is the projected increase in the underlying receipts excluding interest earned on financial assets; and spending side is the projected decline in the underlying primary spending excluding interest payments on debt.
2. Cumulative contribution to consolidation from expenditure and revenue measures according to the OECD Fiscal Consolidation Survey of member governments (plans by December 2011).
Source: OECD Economic Outlook 92 database and OECD Fiscal Consolidation Survey 2012.
GRC ISL ESP SVK USA SVN CZE ITA NOR AUT JPN ISR NZL FIN DEU SWEPRT IRL FRA POL AUS GBR NLD BEL HUN KOR DNK EST LUX CAN CHE
-5
0
5
10
15
20
% of potential GDP
-5
0
5
10
15
20
% of potential GDP
A. Change in 2009-14, national accounts and OECD projections ¹
Spending side Revenue side Total consolidation
NZL SWE NLD CAN GBR DEU LUX IRL PRT GRC POL DNK FIN ESTSVN CHE HUN ISL SVK AUT ESP FRA MEX ITA BEL CZE TUR
0
10
20
30
40
50
60
70
80
90
100
%
0
10
20
30
40
50
60
70
80
90
100
%
B. Contribution to consolidation, 2009-15, survey based ²
Expenditure reductions Revenue enhancements
ECO/WKP(2013)5
25
Figure 13. Spending programmes targeted for fiscal consolidation
2009-2015, survey based
Note: SOEs are state-owned enterprises. Plans by December 2011.
Source: OECD Fiscal Consolidation Survey 2012.
Figure 14. Planned revenue measures for fiscal consolidation
2009-2015, survey based
Note: Consumption taxes include value-added taxes, general sales tax, and taxes on specific goods and services (excise duties). Income taxes include personal income taxes and taxes on corporate profits. Non-tax revenues include raising or introducing user fees (such as tolls for motorways), privatising state-owned enterprises, selling state-owned real estate, etc. Improving tax compliance includes reforms to make tax administration systems effective and transparent, efforts to reduce tax evasion and fraud. Plans by December 2011.
Source: OECD Fiscal Consolidation Survey 2012.
0
10
20
30
40
50
60
70
80
Frequency of responses, %
0
10
20
30
40
50
60
70
80Frequency of responses, %
Welfare Health Pensions Infra-structure
Lower level ingovern-
ment
Educa- tion
SOEs Develop-mentaid
Energysubsidies/environ-
ment
Agri-culture
Width-drawalof fiscalstimulus
Justice/Police
0
10
20
30
40
50
60
70
80
Frequency of responses, %
0
10
20
30
40
50
60
70
80Frequency of responses, %
Consumption taxes
Income taxes
Property taxes
Tax expenditures
Non-tax revenues
Social security tax
Tax onfinancial sector
Improving tax compliance
ECO/WKP(2013)5
26
Figure 15. Planned consumption tax increases
2009-2015, survey based
Note: Plans by December 2011.
1. Included are only the countries that reported a change in the VAT. Plans by December 2011.
Source: OECD Fiscal Consolidation Survey 2012.
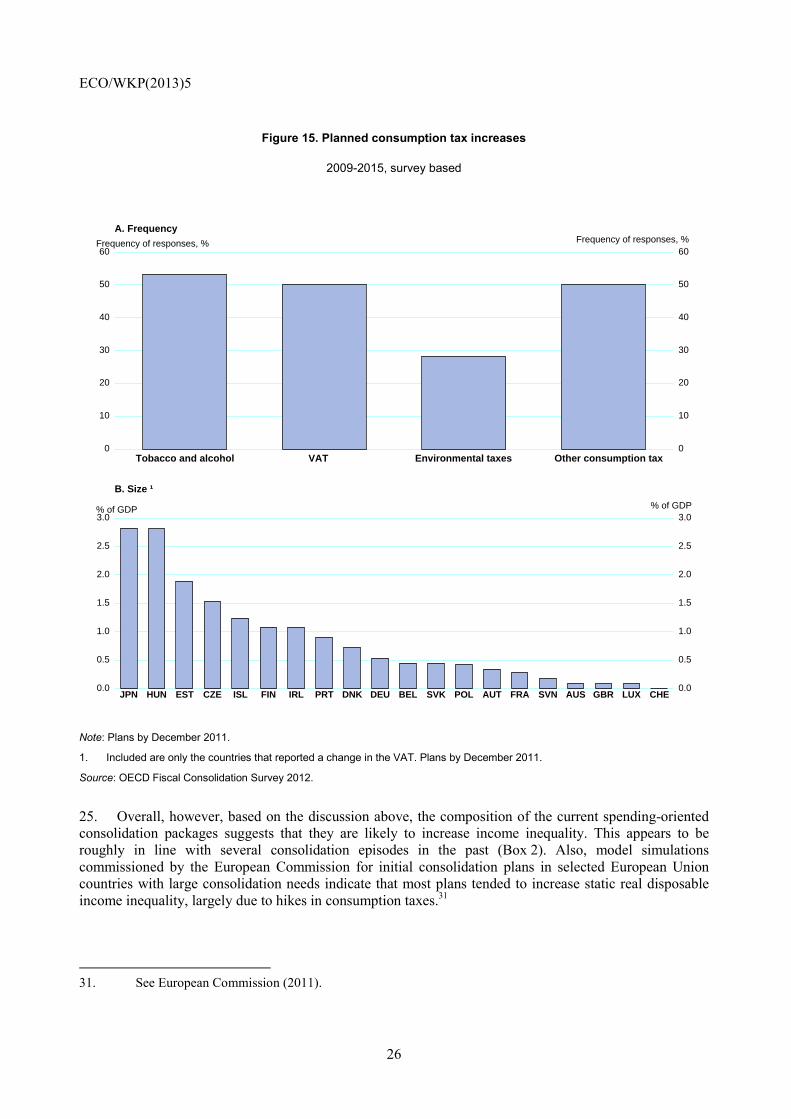
25. Overall, however, based on the discussion above, the composition of the current spending-oriented consolidation packages suggests that they are likely to increase income inequality. This appears to be roughly in line with several consolidation episodes in the past (Box 2). Also, model simulations commissioned by the European Commission for initial consolidation plans in selected European Union countries with large consolidation needs indicate that most plans tended to increase static real disposable income inequality, largely due to hikes in consumption taxes.31
31. See European Commission (2011).
0
10
20
30
40
50
60Frequency of responses, %
0
10
20
30
40
50
60Frequency of responses, %
Tobacco and alcohol VAT Environmental taxes Other consumption tax
A. Frequency
JPN HUN EST CZE ISL FIN IRL PRT DNK DEU BEL SVK POL AUT FRA SVN AUS GBR LUX CHE0.0
0.5
1.0
1.5
2.0
2.5
3.0% of GDP
0.0
0.5
1.0
1.5
2.0
2.5
3.0% of GDP
B. Size ¹
ECO/WKP(2013)5
27
26. Based on the previous discussion, there is scope to rebalance current consolidation efforts in favour of more equity. In particular, relatively little weight has been given to reducing tax expenditures and raising taxes on immovable property, which could be consistent with equity goals without doing harm to long-term growth. At the same time, there is a need for linking consolidation with growth-enhancing structural reform.32
27. Moreover, it is worth noting that in most countries in the OECD area monetary policy continues to be highly accommodative with the need for this stance partly caused by the adverse short-term effects of ambitious fiscal consolidation programmes on aggregate demand. Expansionary monetary policy also has an impact on the distribution of income and wealth through various macroeconomic channels, both indirectly by affecting economic activity and directly via reducing interest rates and raising asset prices, although most of the effects are likely to fade away when policy normalises (Box 3).
Box 2. Empirical evidence on the impact of consolidation on equity
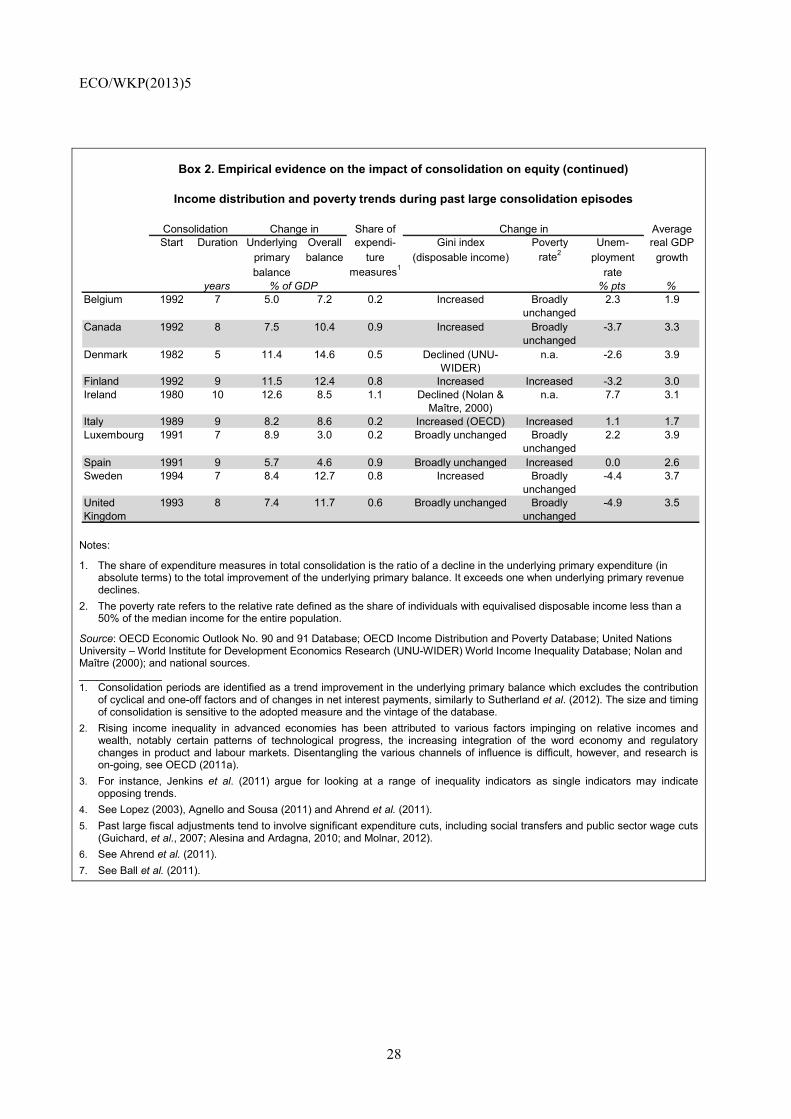
A simple comparison of income inequality and poverty trends during the largest and more protracted past consolidation episodes in the OECD countries, subject to data availability, demonstrates that the link between consolidation and equity can vary (see table below).1 Inferring about causality from consolidation to equity during the selected episodes is difficult. Time series of income inequality measures corresponding to fiscal adjustment episodes are scarce; in many cases consolidation was introduced after a deep recession and financial crisis, which themselves affected distribution; and prolonged consolidation periods could coincide with structural changes which contributed to a general increase in income inequality in the OECD.2 The correlations can also be sensitive to the definition of consolidation and the measure of inequality.3 With those caveats, in about half of the analysed cases the Gini index for disposable income increased, potentially reflecting both increasing dispersion of market income and less redistribution of taxes and transfers. By contrast, in the other half of the countries considered, the Gini index was unchanged or even declined and the poverty rate in most cases was fairly stable.
Empirical studies, including by the OECD, investigating earlier consolidation episodes, indicate that significant fiscal consolidation tended to increase income inequality and relative poverty rates on impact, although estimates are surrounded by high uncertainty.4 This result reflects a significant share of cuts in social transfers and government wages in past consolidation episodes,5 against the background that reductions in transfers tend to have negative redistributional impacts (see Box 1). The OECD work also indicates that more developed welfare systems and employment protection legislation tend to mitigate the adverse impact of fiscal consolidation on low-income earners and that a more comprehensive minimum wage system has similar effects for the second-lowest income quintile.6 Moreover, there is some evidence that fiscal consolidation raises short and long-term unemployment.7
32. The high weight given to household benefit reductions in current consolidation plans points to the potential
role of structural reform. For example, there is still considerable scope to better gear employment or unemployment-related benefit schemes, in combination with activation measures, to encourage work and labour force participation, thereby fostering potential output and equity, and in several countries, regulatory reform can help raise employment security for the low paid. The OECD Employment Outlook 2012 points to beneficial medium-term effects on equity and growth of preserving spending on active labour market measures in the present phase of low growth and high unemployment (OECD 2012d).
ECO/WKP(2013)5
28
Box 2. Empirical evidence on the impact of consolidation on equity (continued)
Income distribution and poverty trends during past large consolidation episodes
Notes:
1. The share of expenditure measures in total consolidation is the ratio of a decline in the underlying primary expenditure (in absolute terms) to the total improvement of the underlying primary balance. It exceeds one when underlying primary revenue declines.
2. The poverty rate refers to the relative rate defined as the share of individuals with equivalised disposable income less than a 50% of the median income for the entire population.
Source: OECD Economic Outlook No. 90 and 91 Database; OECD Income Distribution and Poverty Database; United Nations University – World Institute for Development Economics Research (UNU-WIDER) World Income Inequality Database; Nolan and Maître (2000); and national sources. ______________ 1. Consolidation periods are identified as a trend improvement in the underlying primary balance which excludes the contribution
of cyclical and one-off factors and of changes in net interest payments, similarly to Sutherland et al. (2012). The size and timing of consolidation is sensitive to the adopted measure and the vintage of the database.
2. Rising income inequality in advanced economies has been attributed to various factors impinging on relative incomes and wealth, notably certain patterns of technological progress, the increasing integration of the word economy and regulatory changes in product and labour markets. Disentangling the various channels of influence is difficult, however, and research is on-going, see OECD (2011a).
3. For instance, Jenkins et al. (2011) argue for looking at a range of inequality indicators as single indicators may indicate opposing trends.
4. See Lopez (2003), Agnello and Sousa (2011) and Ahrend et al. (2011). 5. Past large fiscal adjustments tend to involve significant expenditure cuts, including social transfers and public sector wage cuts
(Guichard, et al., 2007; Alesina and Ardagna, 2010; and Molnar, 2012). 6. See Ahrend et al. (2011). 7. See Ball et al. (2011).
Share of AverageStart Duration Underlying Overall expendi- Gini index Poverty Unem- real GDP
primary balance ture (disposable income) rate2 ployment growthbalance measures1 rate
years % pts %Belgium 1992 7 5.0 7.2 0.2 Increased Broadly
unchanged2.3 1.9
Canada 1992 8 7.5 10.4 0.9 Increased Broadly unchanged
-3.7 3.3
Denmark 1982 5 11.4 14.6 0.5 Declined (UNU-WIDER)
n.a. -2.6 3.9
Finland 1992 9 11.5 12.4 0.8 Increased Increased -3.2 3.0Ireland 1980 10 12.6 8.5 1.1 Declined (Nolan &
Maître, 2000)n.a. 7.7 3.1
Italy 1989 9 8.2 8.6 0.2 Increased (OECD) Increased 1.1 1.7Luxembourg 1991 7 8.9 3.0 0.2 Broadly unchanged Broadly
unchanged2.2 3.9
Spain 1991 9 5.7 4.6 0.9 Broadly unchanged Increased 0.0 2.6Sweden 1994 7 8.4 12.7 0.8 Increased Broadly
unchanged-4.4 3.7
United Kingdom
1993 8 7.4 11.7 0.6 Broadly unchanged Broadly unchanged
-4.9 3.5
Change in
% of GDP
Consolidation Change in
ECO/WKP(2013)5
29
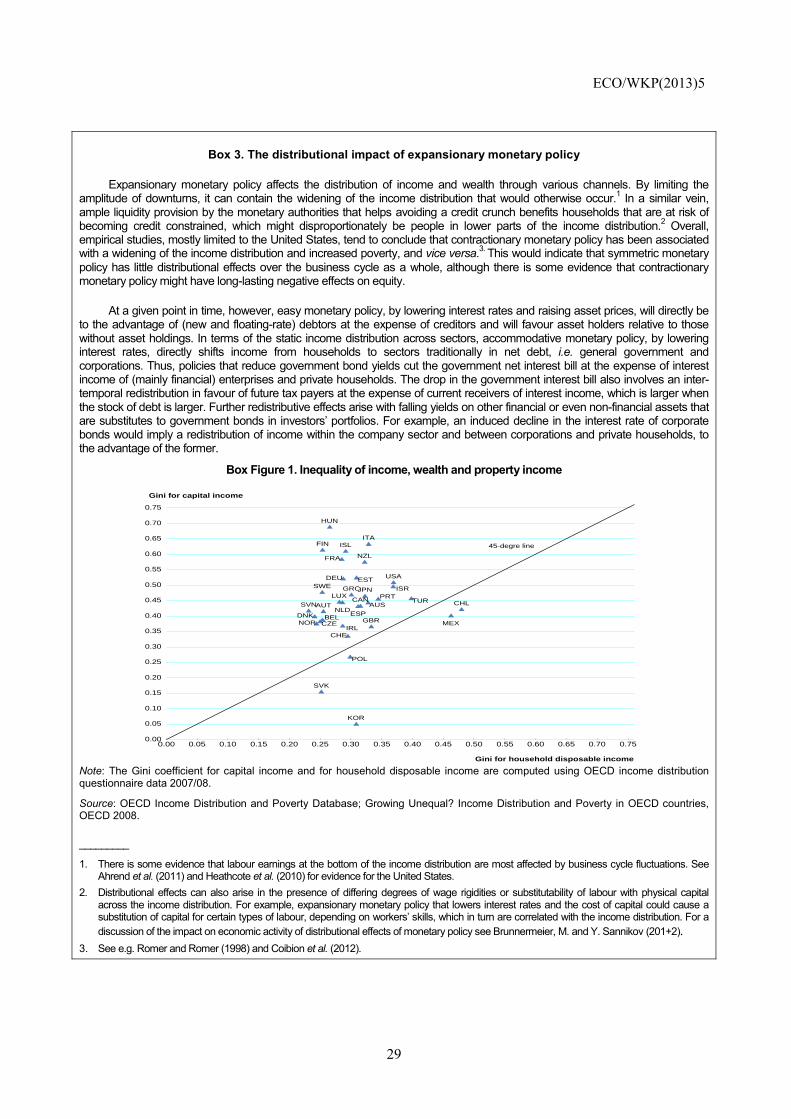
Box 3. The distributional impact of expansionary monetary policy
Expansionary monetary policy affects the distribution of income and wealth through various channels. By limiting the amplitude of downturns, it can contain the widening of the income distribution that would otherwise occur.1 In a similar vein, ample liquidity provision by the monetary authorities that helps avoiding a credit crunch benefits households that are at risk of becoming credit constrained, which might disproportionately be people in lower parts of the income distribution.2 Overall, empirical studies, mostly limited to the United States, tend to conclude that contractionary monetary policy has been associated with a widening of the income distribution and increased poverty, and vice versa.3. This would indicate that symmetric monetary policy has little distributional effects over the business cycle as a whole, although there is some evidence that contractionary monetary policy might have long-lasting negative effects on equity.
At a given point in time, however, easy monetary policy, by lowering interest rates and raising asset prices, will directly be to the advantage of (new and floating-rate) debtors at the expense of creditors and will favour asset holders relative to those without asset holdings. In terms of the static income distribution across sectors, accommodative monetary policy, by lowering interest rates, directly shifts income from households to sectors traditionally in net debt, i.e. general government and corporations. Thus, policies that reduce government bond yields cut the government net interest bill at the expense of interest income of (mainly financial) enterprises and private households. The drop in the government interest bill also involves an inter-temporal redistribution in favour of future tax payers at the expense of current receivers of interest income, which is larger when the stock of debt is larger. Further redistributive effects arise with falling yields on other financial or even non-financial assets that are substitutes to government bonds in investors’ portfolios. For example, an induced decline in the interest rate of corporate bonds would imply a redistribution of income within the company sector and between corporations and private households, to the advantage of the former.
Box Figure 1. Inequality of income, wealth and property income
Note: The Gini coefficient for capital income and for household disposable income are computed using OECD income distribution questionnaire data 2007/08.
Source: OECD Income Distribution and Poverty Database; Growing Unequal? Income Distribution and Poverty in OECD countries, OECD 2008.
_________
1. There is some evidence that labour earnings at the bottom of the income distribution are most affected by business cycle fluctuations. See Ahrend et al. (2011) and Heathcote et al. (2010) for evidence for the United States.
2. Distributional effects can also arise in the presence of differing degrees of wage rigidities or substitutability of labour with physical capital across the income distribution. For example, expansionary monetary policy that lowers interest rates and the cost of capital could cause a substitution of capital for certain types of labour, depending on workers’ skills, which in turn are correlated with the income distribution. For a discussion of the impact on economic activity of distributional effects of monetary policy see Brunnermeier, M. and Y. Sannikov (201+2).
3. See e.g. Romer and Romer (1998) and Coibion et al. (2012).
0.00 0.05 0.10 0.15 0.20 0.25 0.30 0.35 0.40 0.45 0.50 0.55 0.60 0.65 0.70 0.750.00
0.05
0.10
0.15
0.20
0.25
0.30
0.35
0.40
0.45
0.50
0.55
0.60
0.65
0.70
0.75
Gini for capital income
Gini for household disposable income
45-degre line
AUSAUT
BEL
CAN
CHE
CHL
CZE
DEU
DNK ESP
EST
FIN
FRA
GBR
GRC
HUN
IRL
ISL
ISR
ITA
JPN
KOR
LUX
MEX
NLD
NOR
NZL
POL
PRT
SVK
SVN
SWE
TUR
USA
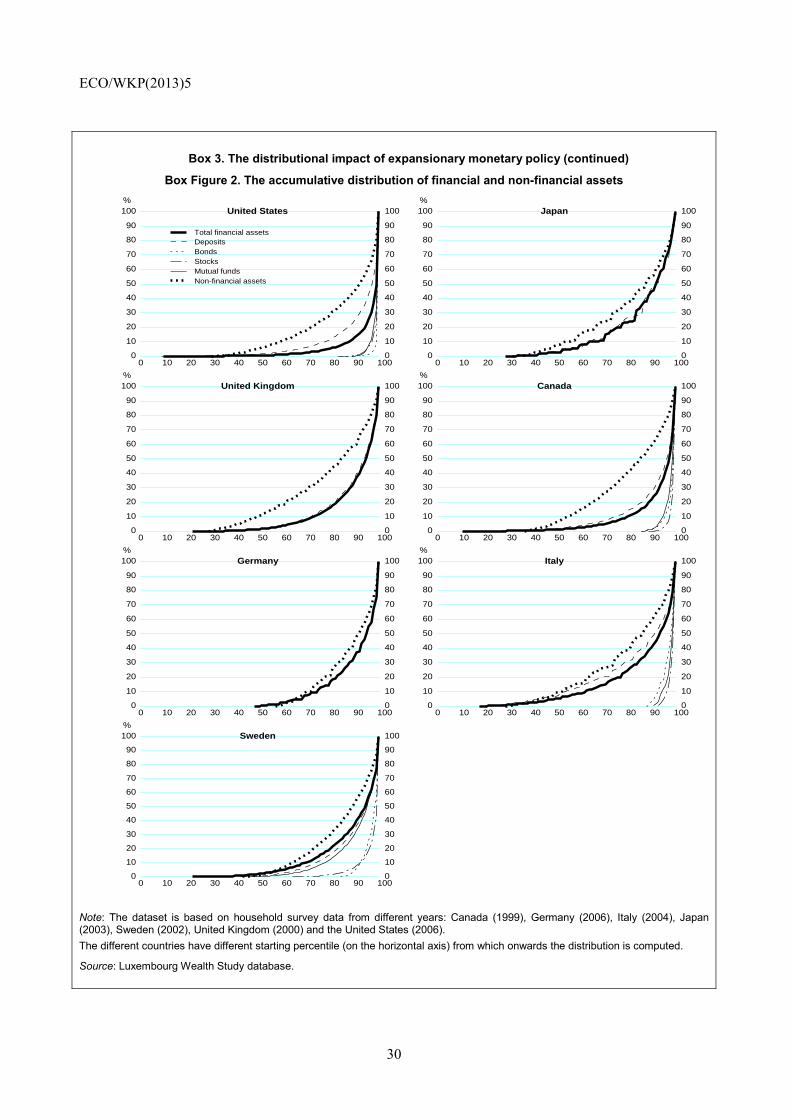
ECO/WKP(2013)5
30
Box 3. The distributional impact of expansionary monetary policy (continued)
Box Figure 2. The accumulative distribution of financial and non-financial assets
Note: The dataset is based on household survey data from different years: Canada (1999), Germany (2006), Italy (2004), Japan (2003), Sweden (2002), United Kingdom (2000) and the United States (2006). The different countries have different starting percentile (on the horizontal axis) from which onwards the distribution is computed.
Source: Luxembourg Wealth Study database.
0
10
20
30
40
50
60
70
80
90
100%
0
10
20
30
40
50
60
70
80
90
100 United States
0 10 20 30 40 50 60 70 80 90 100
Total financial assetsDepositsBondsStocksMutual fundsNon-financial assets
0
10
20
30
40
50
60
70
80
90
100%
0
10
20
30
40
50
60
70
80
90
100 Japan
0 10 20 30 40 50 60 70 80 90 100
0
10
20
30
40
50
60
70
80
90
100%
0
10
20
30
40
50
60
70
80
90
100 United Kingdom
0 10 20 30 40 50 60 70 80 90 1000
10
20
30
40
50
60
70
80
90
100%
0
10
20
30
40
50
60
70
80
90
100 Canada
0 10 20 30 40 50 60 70 80 90 100
0
10
20
30
40
50
60
70
80
90
100%
0
10
20
30
40
50
60
70
80
90
100 Germany
0 10 20 30 40 50 60 70 80 90 1000
10
20
30
40
50
60
70
80
90
100%
0
10
20
30
40
50
60
70
80
90
100 Italy
0 10 20 30 40 50 60 70 80 90 100
0
10
20
30
40
50
60
70
80
90
100%
0
10
20
30
40
50
60
70
80
90
100 Sweden
0 10 20 30 40 50 60 70 80 90 100
ECO/WKP(2013)5
31
Box 3. The distributional impact of expansionary monetary policy (continued)
The distribution of households’ capital income is highly askew, significantly more so than of disposable income overall, although there are notable differences across countries, which might partly relate to the organisation of social security systems (Box Figure 1). Inequality of capital income reflects the very uneven distribution of wealth, with the available evidence suggesting that bonds, stocks and mutual funds are highly concentrated in the top decile of the wealth distribution while deposits and housing wealth are spread more widely (Box Figure 2).4 Moreover, people with higher financial wealth also tend to have higher debt.
Thus, regarding the direct static redistributive impact of lower interest rates, wealthy people are subject to both a negative income effect stemming from lower asset yields and a positive wealth effect on account of higher asset prices. Both effects can be sizeable, depending on whether returns are contractually fixed or variable, the maturity of assets and the impact of monetary policy on asset yield other than government bonds. By contrast, households in the middle or lower part of the wealth distribution, with very few financial assets which are mostly in the form of deposits, do not enjoy capital gains on financial assets, but also suffer from lower interest receipts.
At the same time, there is an important dynamic dimension of redistribution, in that the propensity to save as well as net asset positions and portfolio compositions differ markedly over the life-cycle. Consequently, expansionary monetary policy can directly influence the distribution of annual and life-time income across age groups. For example, young or middle-aged households which are investing in a pension fund might be negatively hit. Cuts in long-term interest rates increase obligations of pension funds and life insurers in present value terms. They also reduce the returns of portfolio investments. This could lead to pressure to adjust pension promises or guarantees downwards, or to adjust contributions and premiums upwards in order to pay for the pension and insurance promises that become more expensive. Twisting the yield curve to reduce long-term interest rates thus disadvantages pension savers. However, significant effects are only likely to arise over longer periods of low interest rates, as pension promises are typically hedged by financial instruments of long duration.
_________
4. See Bonesmo Fredriksen, K. (2012).
ECO/WKP(2013)5
32
BIBLIOGRAPHY
Agnello, L. and R.M. Sousa (2011), “Fiscal Consolidation and Income Inequality”, NIPE Working Papers, No. 34/2011, Universidade do Minho.
Ahrend, R., J. Arnold and C. Moeser (2011), “The Sharing of Macroeconomic Risk”, OECD Economics Department Working Paper, No. 877, OECD Publishing.
Alesina, A. and S. Ardagna (2010), “Large Changes in Fiscal Policy: Taxes versus Spending”, in Tax Policy and the Economy, Editor: R. Brown, Vol. 24, NBER.
Antolin, P., A. de Serres and C. de la Maisonneuve (2004), “Long-Term Budgetary Implications of Tax-Favoured Retirement Plans”, OECD Economics Department Working Papers, No. 393, OECD Publishing.
Ball, L., D. Leigh and P. Loungani (2011) “Painful Medicine”, Finance and Development, Vol. 49, International Monetary Fund.
Brunnermeier, M. and Y. Sannikov (2012), “Redistributive Monetary Policy”, Paper presented at the 2012 Policy Forum of the Federal Reserve Bank of Kansas City in Jackson Hole.
Bonesmo Fredriksen, K. (2012), “Less Income Inequality and More Growth – Are they Compatible? Part 6. The Distribution of Wealth”, OECD Economics Department Working Papers, No. 929, OECD Publishing.
Chawla, R.K. and T. Wannell (2003), “Property Taxes”, in Perspectives, Statistics Canada, July, Vol. 4, No. 7, http://www.statcan.gc.ca/pub/75-001-x/75-001-x2003007-eng.pdf.
Coibion, O., Y. Gorodnichenko and L. Kueng (2012), “Innocent Bystanders? Monetary Policy and Inequality in the U.S.”, NBER Working Papers, No. 18170.
Congressional Research Service (2008), “Tax Expenditures: Compendium of Background Material on Individual Provisions”, 110th Cong., 2d Session, Print #667, December, http://taxprof.typepad.com/taxprof_blog/2009/02/tax-expenditures-compendium-of-backgroundmaterial-on-individual-provisions.html
Davies, J.B., S. Sandström, A. Shorrocks and E. Wolff (2009), “The Level and Distribution of Global Household Wealth”, Economic Journal, Vol. 121.
Department of Finance Canada (2010), “The Response of Individuals to Changes in Marginal Income Tax Rates”, in: Tax Expenditures and Evaluations.
Devaux, M. and M. de Looper (2012), “Income-related inequalities in health service utilisation in 19 OECD countries, 2008-09”, OECD Health Working Papers, OECD Publishing, forthcoming.
Diamond P. and E. Saez (2011), “The Case for a Progressive Tax: From Basic Research to Policy Recommendations”, Journal of Economic Perspectives, Vol. 25.
European Commission (2011), “The distributional Effects of Austerity measures: a Comparison of Six EU Countries”, Research Note 2/2011.
ECO/WKP(2013)5
33
Fournier, J. and I. Koske (2012), “Less Income Inequality and More Growth – Are they Compatible? Part 7. The Drivers of Labour Earnings Inequality – An Analysis Based on Conditional and Unconditional Quantile Regressions”, OECD Economics Department Working Papers, No. 930, OECD Publishing.
Guichard, S., M. Kennedy, E. Wurzel, and C. André (2007), “What Promotes Fiscal Consolidation: OECD Country Experiences”, OECD Economics Department Working Papers, No. 553, OECD Publishing.
Heathcote, J., F. Perri and G. Violante (2010), “Unequal We Stand: An Empirical Analysis of Economic Inequality in the U.S., 1967-2006”, Review of Economic Dynamics, Vol. 13.
Hoeller, P., I. Joumard, M. Pisu and D. Bloch (2012), “Less Income Inequality and More Growth – Are They Compatible? Part 1. Mapping Income Inequality across the OECD”, OECD Economics Department Working Papers, No. 924, OECD Publishing.
Jenkins, S. P., A. Brandolini, J. Micklewright and B. Nolan (eds) (2011), The Great Recession and the Distribution of Household Income, Oxford University Press, Oxford, forthcoming. Revised version of a report to the Fondazione Ronaldo Debenedetti, Milan.
Johansson, A, C. Heady, J. Arnold, B. Brys and L. Vartia (2008), “Taxation and Economic Growth”, OECD Economics Department Working Papers, No. 620, OECD Publishing.
Joumard, I., P. Hoeller, C. André and C. Nicq (2010), Health Care Systems: Efficiency and Policy Settings, OECD Publishing.
Joumard, I., M. Pisu and D. Bloch (2012), “Less Income Inequality and More Growth – Are They Compatible? Part 3. Income Redistribution via Taxes and Transfers Across OECD Countries”, OECD Economics Department Working Papers, No. 926, OECD Publishing.
Kierzenkowski, R. and I. Koske (2012), “Less Income Inequality and More Growth – Are they Compatible? Part 8. The Drivers of Labour Income Inequality – A Literature Review”, OECD Economics Department Working Papers, No. 931, OECD Publishing.
Lopez, H. (2003), “Macroeconomics and Inequality”. IMF Research Workshop Working Paper.
Molnar, M. (2012), “Fiscal Consolidation: Part 5. What Factors Determine the Success of Consolidation Efforts?”, OECD Economics Department Working Papers, No. 936, OECD Publishing.
Nolan, B. and B. Maître (2000), “A Comparative Perspective on Trends in Income Inequality in Ireland,” The Economic and Social Review, Economic and Social Studies, Vol. 31.
OECD (2008), Growing Unequal? Income Distribution and Poverty in OECD Countries, OECD Publishing.
OECD (2010), Sickness, Disability and Work: Breaking the Barriers, OECD Publishing.
OECD (2011a), Divided We Stand: Why Inequality Keeps Rising, OECD Publishing.
OECD (2011b), Tax Expenditures in OECD Countries, OECD Publishing.
OECD (2011c), “Restoring Public Finances”, OECD Journal on Budgeting, Vol. 2011/2, OECD Publishing.\
ECO/WKP(2013)5
34
OECD (2012a), “Income Inequality and Growth: The Role of Taxes and Transfers”, OECD Economics Department Policy Notes, No. 9, January 2012.
OECD (2012b), “What are the Best Policy Instruments for Fiscal Consolidation?”, OECD Economics Department Policy Notes, No. 912, April 2012.
OECD (2012c), Restoring Public Finances, OECD Public Governance Committee, GOV-PGC-SBO(2012)7.
OECD (2012d), OECD Employment Outlook 2012, OECD Publishing.
Office for National Statistics (2010), “The Effects of Taxes and Benefits on Household income, 2008/09”, in: Staistical Bulletin 10 June 2010.
Romer, C. and D. Romer, (1998), “Monetary Policy and the Well-Being of the Poor”, in: Income Inequality: Issues and Policy Options, Federal Reserve Bank of Kansas City.
Sen, A. (1992), Inequality Re-examined, Harvard University Press.
Sutherland, D., P. Hoeller and R. Merola (2012), “Fiscal Consolidation: Part 1. How Much is Needed and How to Reduce Debt to a Prudent Level?”, OECD Economics Department Working Papers, No. 932, OECD Publishing.
Sutherland, D., R. Price, I. Joumard and C. Nicq (2007), “Performance Indicators for Public Spending Efficiency in Primary and Secondary Education”, OECD Economics Department Working Papers, No. 546, OECD Publishing.
Williams, R. (2011), “Who Benefits From Tax Expenditures?” Tax Notes, Tax Policy Center, Urban and Brookings Institution, 2 May 2011.
Wu, X., J.M. Perloff, and A. Golan (2002), “Effects of government policies on income distribution and welfare,” CUDARE Working Paper Series, No. 950, University of California at Berkeley, Department of Agricultural and Resource Economics and Policy.
ECO/WKP(2013)5
35
WORKING PAPERS
The full series of Economics Department Working Papers can be consulted at www.oecd.org/eco/workingpapers/
1012. The Dutch labour market: preparing for the future (January 2013) by Mathijs Gerritsen and Jens Høj 1011. Reforming policies for the business sector to harvest the benefits of globalisation in the Netherlands (January 2013) by Mathijs Gerritsen and Jens Høj 1010. Health care reform and long-term care in the Netherlands (January 2013) by Erik Schut, Stéphane Sorbe and Jens Høj 1009. Enhancing the inclusiveness of the labour market in Belgium (January 2013) by Jens Høj 1008. Reducing poverty in Estonia through activation and better targeting (December 2012) by Sarah Flèche and Artur Radziwill 1007. Matching skills and jobs in Estonia (December 2012) by Lilas Demmou 1006. Debt and macroeconomic stability: An overview of the literature and some empirics (December 2012) by Douglas Sutherland and Peter Hoeller 1005. Debt and macroeconomic stability: Debt and the business cycle (December 2012) by Volker Ziemann 1004. Debt and macroeconomic stability: Case studies (December 2012) by Rossana Merola 1003. Debt and macroeconomic stability (December 2012) by Douglas Sutherland, Peter Hoeller, Rossana Merola and Volker Ziemann 1002. Reducing greenhouse gas emissions in a cost effective way in Switzerland. (December 2012) by Anita Wölfl and Patrizio Sicari 1001. Strengthening innovation in the United States (November 2012) by David Carey, Christopher Hill and Brian Kahin 1000. Long-term growth scenarios (forthcoming) by Åsa Johansson, Yvan Guillemette, Fabrice Murtin, David Turner,
Giuseppe Nicoletti, Christine de la Maisonneuve, Philip Bagnoli, Guillaume Bousquet and Francesca Spinelli
999. Selected aspects of household savings in Germany – evidence from micro-data (November 2012) by Christina Kolerus, Isabell Koske and Felix Hüfner 998. Improving the tax system in Indonesia (November 2012) by Jens Arnold
ECO/WKP(2013)5
36
997. Unleashing business innovation in Canada (November 2012) by Alexandra Bibbee 996. Public policy and resource allocation: evidence from firms in OECD countries (October 2012) by Dan Andrews and Federico Cingano 995. Promoting SME development in Indonesia (October 2012) by Annabelle Mourougane 994. Portugal: Rebalancing the economy and returning to growth through job creation and better capital allocation. (October 2012) by Álvaro Pina and Ildeberta Abreu 993. Public debt, economic growth and nonlinear effects: Myth or reality?
(October 2012) by Balázs Égert
992. Choosing the pace of fiscal consolidation (September 2012) by Lukasz Rawdanowicz
991. Tertiary education developing skills for innovation and long-term growth in Canada (September 2012) by Calista Cheung, Yvan Guillemette and Shahrzad Mobasher-Fard 990. Trade and product market policies in upstream sectors and productivity in downstream sectors:
firm-level evidence from China (September 2012) by Maria Bas and Orsetta Causa 989. Intangible assets, resource allocation and growth: a framework for analysis (September 2012) by Dan Andrews and Alain de Serres 988. Current account benchmarks for Turkey (September 2012) by Oliver Röhn 987. Structural reforms to boost Turkey's long-term growth (September 2012) by Rauf Gönenç, Oliver Röhn, Vincent Koen and Şeref Saygili 986. Tackling Turkey's external and domestic macroeconomic imbalances (September 2012) by Oliver Röhn, Rauf Gönenç, Vincent Koen and Ramazan Karaşahin 985. Portugal: Solid foundations for a sustainable fiscal consolidation (September 2012) by David Haugh and Stéphane Sorbe 984. Portugal: Assessing the risks around the speed of fiscal consolidation in an uncertain environment (September 2012) by Stéphane Sorbe 983. The German labour market: preparing for the future (September 2012) by Felix Hüfner and Caroline Klein 982. Climate change policies in Germany: make ambition pay (September 2012) by Caroline Klein


![4/36//4./] SX,glbb / 0./7-.1-01 78./ · \ƨ ÅÒ¿« µ µ }t ?cM ykpxz¯ÛáÇ ³ãïw, pb{v E©ßï͵z ñ aú ²©ßï͵q t® ì»q¶ \wkp¯® Rlq¶ \wkp¯®¶ \ wkp¯ æb](https://img.pdfslide.tips/doc/110x75/5e5fa09857ae8964936048f5/4364-sxglbb-07-1-01-78-t-cm-ykpxz.jpg)