Embed Size (px)
Citation preview
EDWARD P. ST. JOHNALGO D. HENDERSON COLLEGIATE
PROFESSORUNIVERSITY OF MICHIGAN
Partnerships Supporting College Preparation and
Success
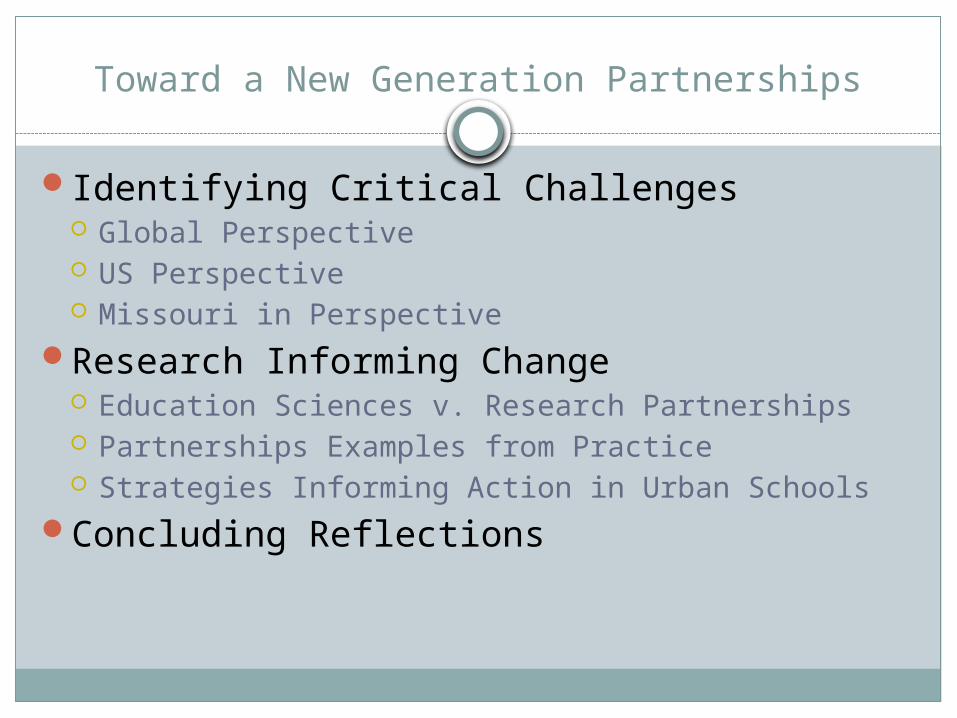
Toward a New Generation Partnerships
Identifying Critical Challenges Global Perspective US Perspective Missouri in Perspective
Research Informing Change Education Sciences v. Research Partnerships Partnerships Examples from Practice Strategies Informing Action in Urban Schools
Concluding Reflections
Global Perspectives
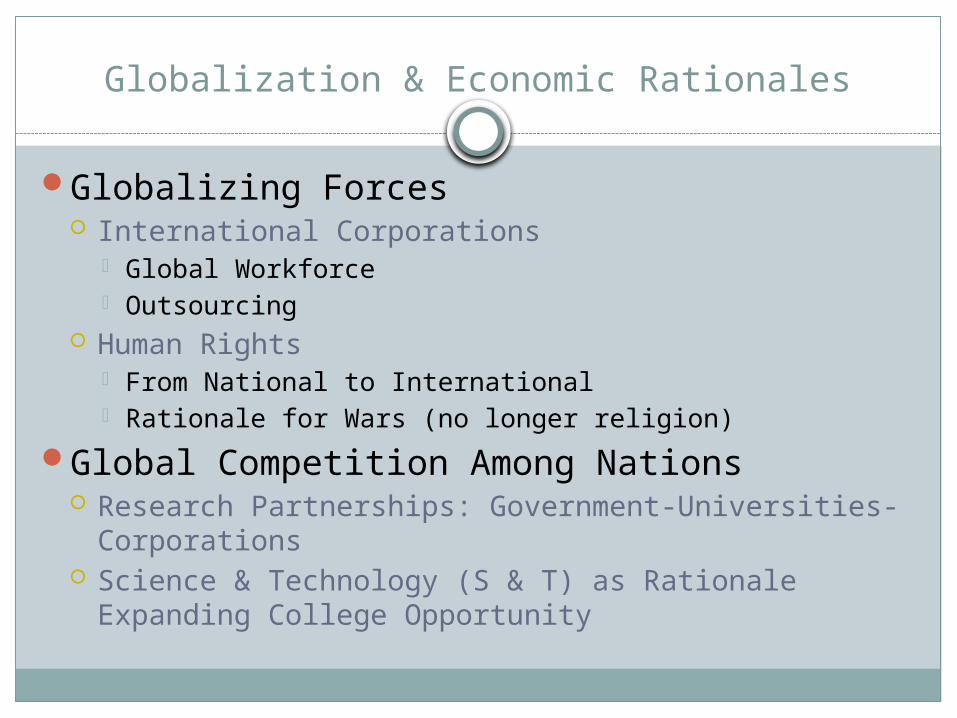
Globalization & Economic Rationales
Globalizing Forces International Corporations
Global Workforce Outsourcing
Human Rights From National to International Rationale for Wars (no longer religion)
Global Competition Among Nations Research Partnerships: Government-Universities-
Corporations Science & Technology (S & T) as Rationale Expanding
College Opportunity
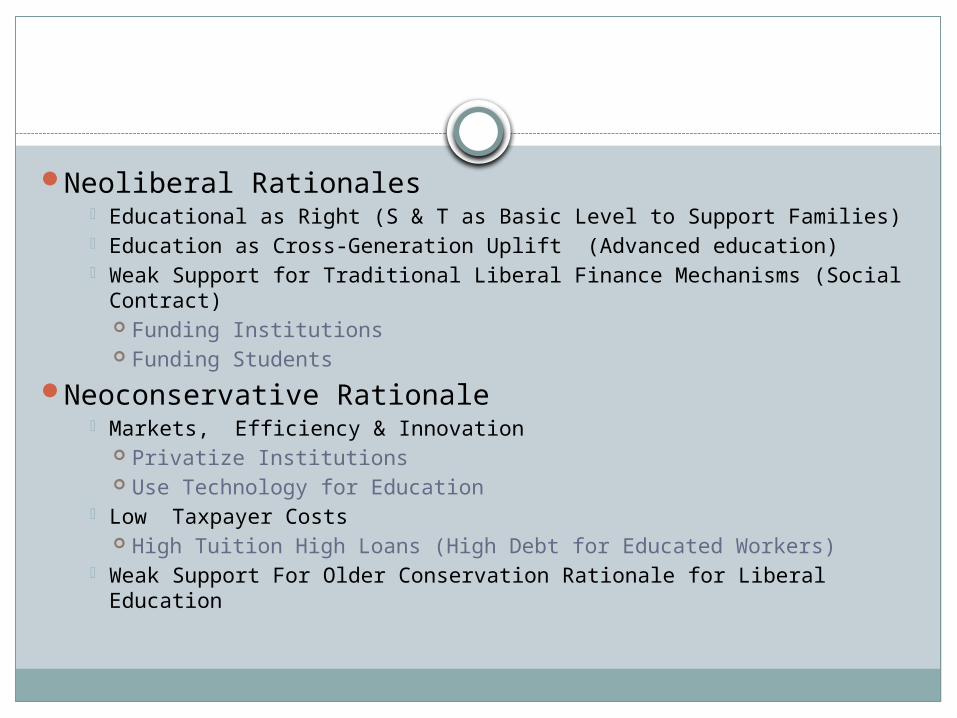
Neoliberal Rationales Educational as Right (S & T as Basic Level to Support Families) Education as Cross-Generation Uplift (Advanced education) Weak Support for Traditional Liberal Finance Mechanisms (Social
Contract) Funding Institutions Funding Students
Neoconservative Rationale Markets, Efficiency & Innovation
Privatize Institutions Use Technology for Education
Low Taxpayer Costs High Tuition High Loans (High Debt for Educated Workers)
Weak Support For Older Conservation Rationale for Liberal Education
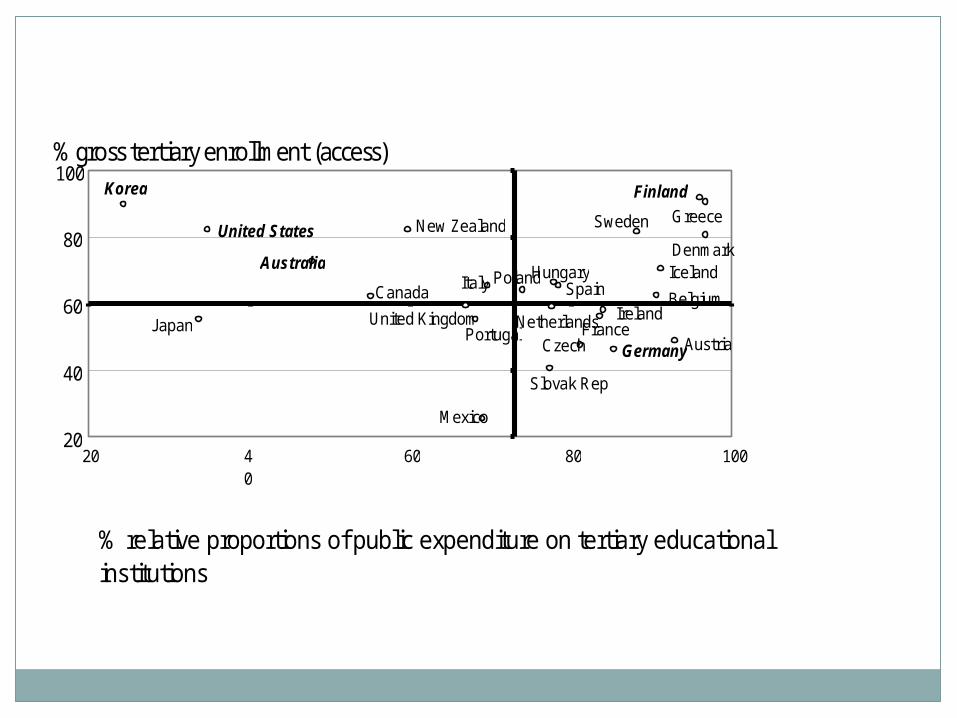
Canada Spain Portugal
Slovak Rep.
New Zealand
Poland United Kingdom
Italy
Finland
Denmark
Austria
Australia United States Sweden
20
40
60
80
100
20 40
60 80 100
% gross tertiary enrollment (access)
% relative proportions of public expenditure on tertiary educational institutions
Mexico
Source: adapted from St. John, Kim, & Yang, in press, intro chapter
.
Hungary
France Czech
Belgium
Korea
Germany
Greece
Ireland Iceland
Netherlands Japan
Globalization & Educational Outcomes
Patterns of Expansion Expansion of Programs for S & T
New Basic Education Standard Includes Some Postsecondary Needed to Support Families in Globally Engaged Nation
Unequal Access to Universities (Advanced Education) Advanced Education Needed for Middle Class Profession Constraints on Fair Access Include Debt, Culture & Class Debt Varies Based on Extent of Privatization
Challenges Within Nations Stratification of Opportunity
Concentration of Low-Income in S & T Troublesome High Debt in Pacific Region Access to Middle Class Professions
Arguments for Fairness (& Refining Social Contract) Basic Right to Some College Fairness in Access to Universities
University Engagement
Corporate Partnerships (Highly Visible) Global Universities
Quality Ranking Using Publications and Other Indications
Engagement in the Private Sector Corporate Funded Research & Development Creation of New Corporations
Critical Social Issues Should Also Be Addressed Through Research Partnerships (Generally Not Evident) Inequality in Opportunity to Prepare (and Attain a Basic Education Partnerships in Equalizing Opportunity for Advanced Education
Through Realignment of Both K-12 and Higher Education Research Partnerships Support Reforms Promoting Equity

US Context: K-12 Reform & Higher Education Markets
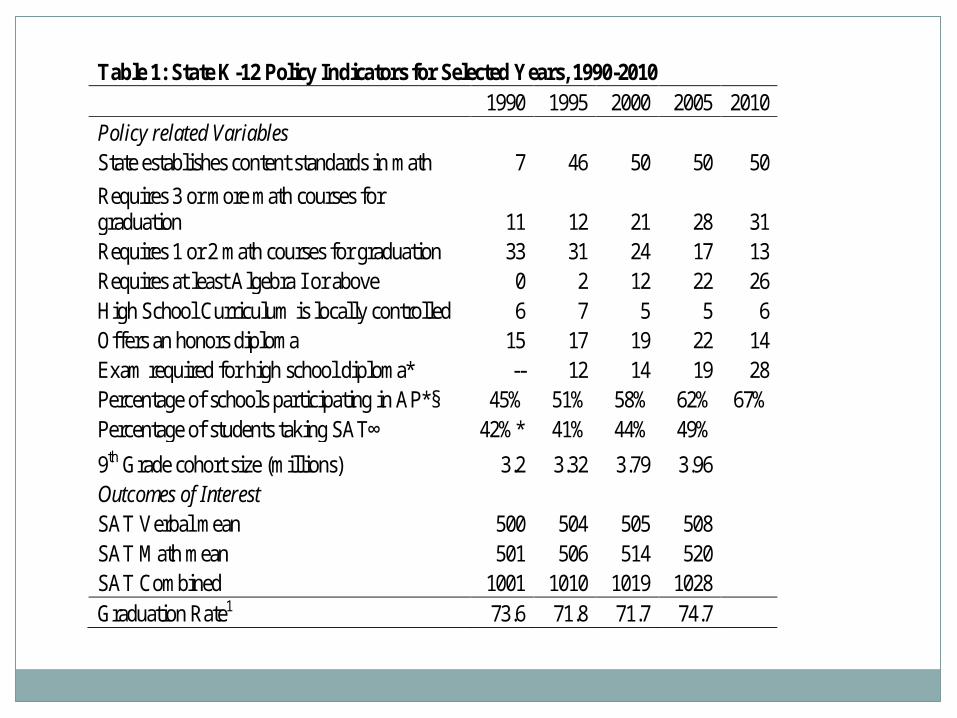
Table 1: State K-12 Policy Indicators for Selected Years, 1990-2010 1990 1995 2000 2005 2010 Policy related Variables State establishes content standards in math 7 46 50 50 50
Requires 3 or more math courses for graduation 11 12 21 28 31 Requires 1 or 2 math courses for graduation 33 31 24 17 13 Requires at least Algebra I or above 0 2 12 22 26 High School Curriculum is locally controlled 6 7 5 5 6 Offers an honors diploma 15 17 19 22 14 Exam required for high school diploma* -- 12 14 19 28 Percentage of schools participating in AP*§ 45% 51% 58% 62% 67% Percentage of students taking SAT∞ 42%* 41% 44% 49%
9th Grade cohort size (millions) 3.2 3.32 3.79 3.96 Outcomes of Interest SAT Verbal mean 500 504 505 508 SAT Math mean 501 506 514 520 SAT Combined 1001 1010 1019 1028 Graduation Rate1 73.6 71.8 71.7 74.7
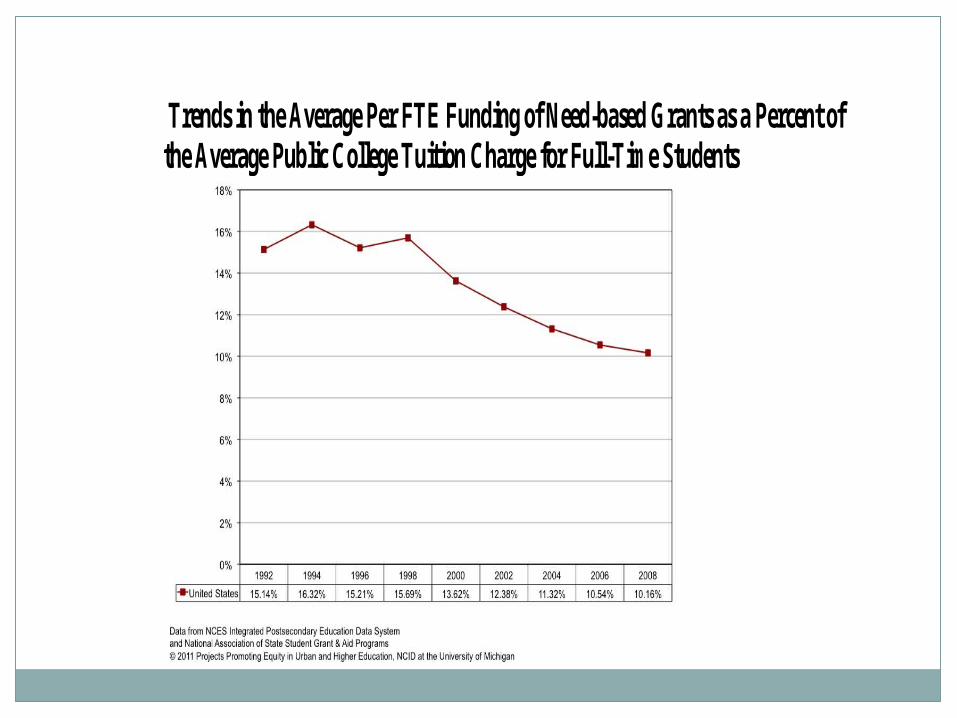
Trends in the Average Per FTE Funding of Need-based Grants as a Percent of the Average Public College Tuition Charge for Full-Time Students
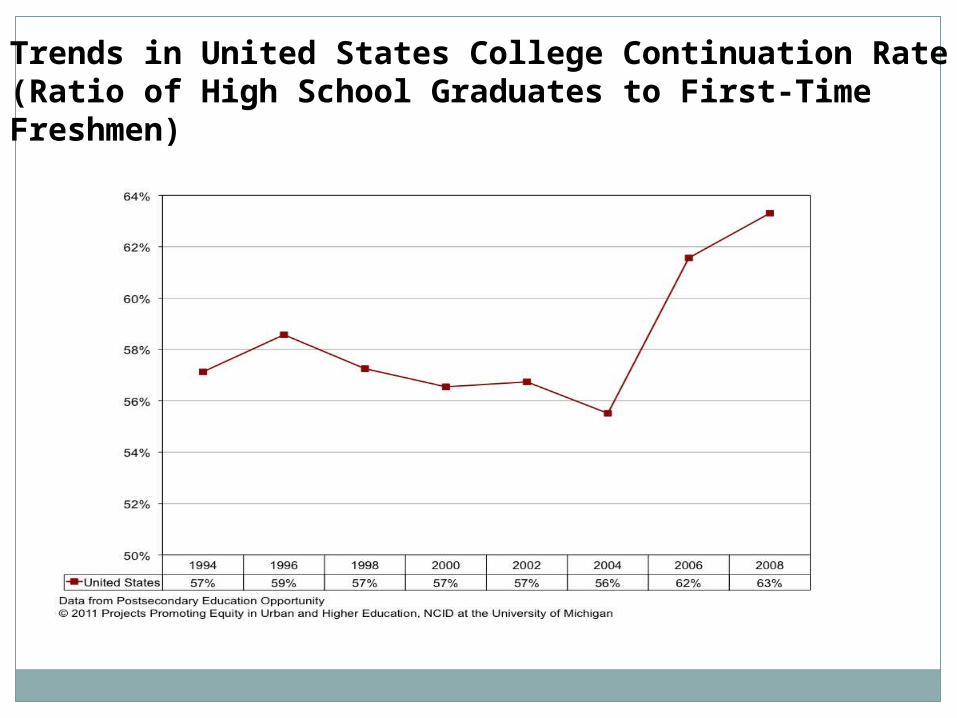
Trends in United States College Continuation Rate (Ratio of High School Graduates to First-Time Freshmen)
1992 1994 1996 1998 2000 2002 2004 2006 2008
Asian
1.51986656423588
1.60215396581489
1.54539300485575
1.6176211851513
1.5952310518394
1.538943876293
1.41633089842354
1.40127166761389
1.39757643832002
Black
0.88119124800659
2
0.92127899720020
8
0.92879413646609
6
0.94170207761863
3
1.00450160111925
1.03649112436022
1.07512641423509
1.08105737593434
1.11174706239965
Latina/o
1.06771785909807
1.15752909071624
1.17901462548913
1.17715041972418
0.98464457062617
5
0.96694600472325
2
0.93458433800754
4
0.93245549725747
0.99399735081453
5
Native American
1.44276095510872
1.54513428530859
1.53706589769497
1.55166109888424
1.6168408720575
1.67589147754895
1.67812035758448
1.63958789244246
1.53477256178994
White
0.95758605037650
5
0.92654408389099
0.91401690104188
0.89476459912245
4
0.90001510117268
0.88773084323702
0.89199038235556
3
0.88482282436052
4
0.84872775971096
1
0.10
0.30
0.50
0.70
0.90
1.10
1.30
1.50
1.70
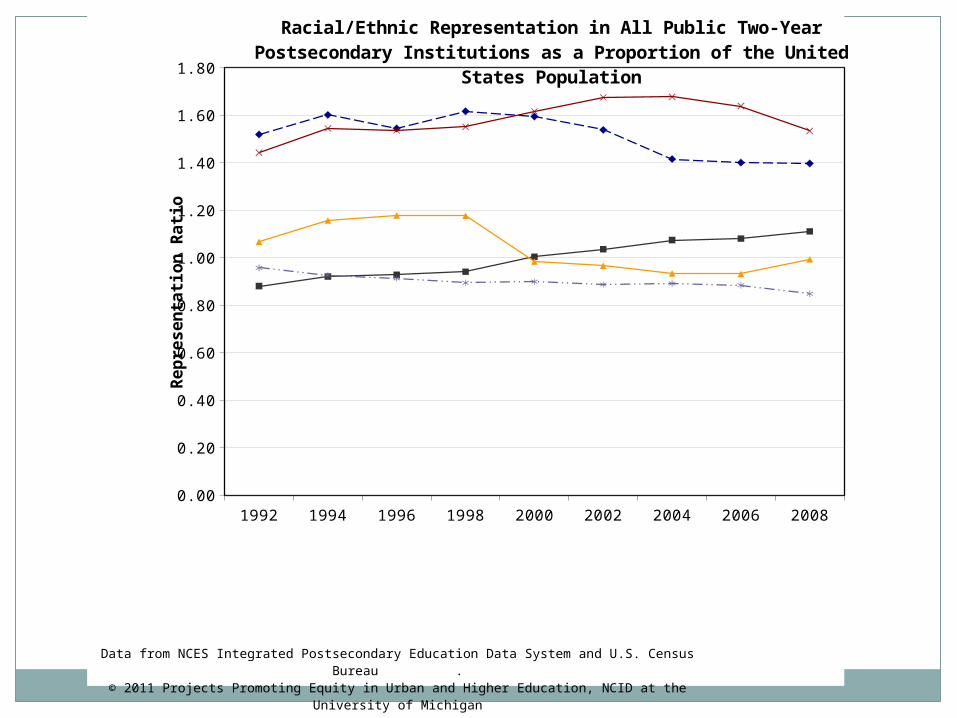
Racial/Ethnic Representation in All Public Two-Year Postsecondary Institutions as a Proportion of the United States Population
Data from NCES Integrated Postsecondary Education Data System and U.S. Census Bureau .© 2011 Projects Promoting Equity in Urban and Higher Education, NCID at the University of Michigan
Rep
resen
tatio
n R
atio
2002 2003 2004 2005 2006 2007 2008
Asian
0.252328115712305
0.271114615157189
0.271158235070369
0.252247357502716
0.251643835616438
0.25706380771226
0.261088061707474
Black
0.178010693371807
0.206298599189232
0.166772106955186
0.165941181435617
0.152786258222832
0.141487230572189
0.141471768915263
Latina/o
0.183513778542697
0.204378200211447
0.193067894306314
0.187338123892427
0.179485822172816
0.162686975913199
0.163678360700727
Native American
0.208979233694063
0.248241206030151
0.232573637211782
0.218579234972678
0.208692485128081
0.204370027312671
0.203757393018671
White
0.267165205191161
0.271866583389621
0.263350298809569
0.265552761130137
0.257801757408155
0.245508294586993
0.243477114439213
5%
15%
25%
35%
45%
55%
65%
75%
85%
95%
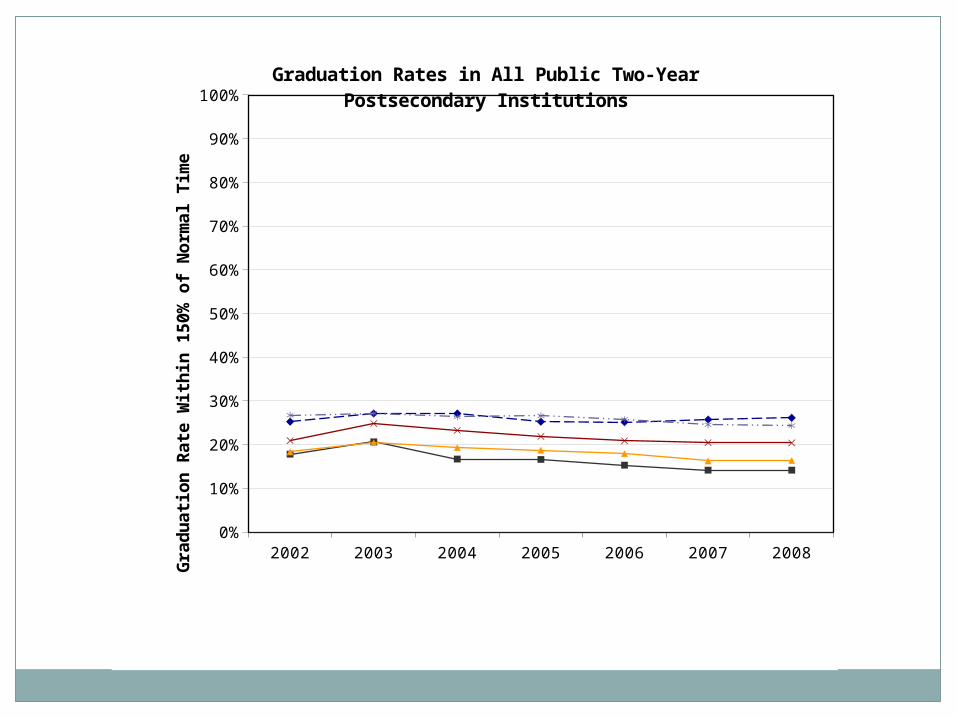
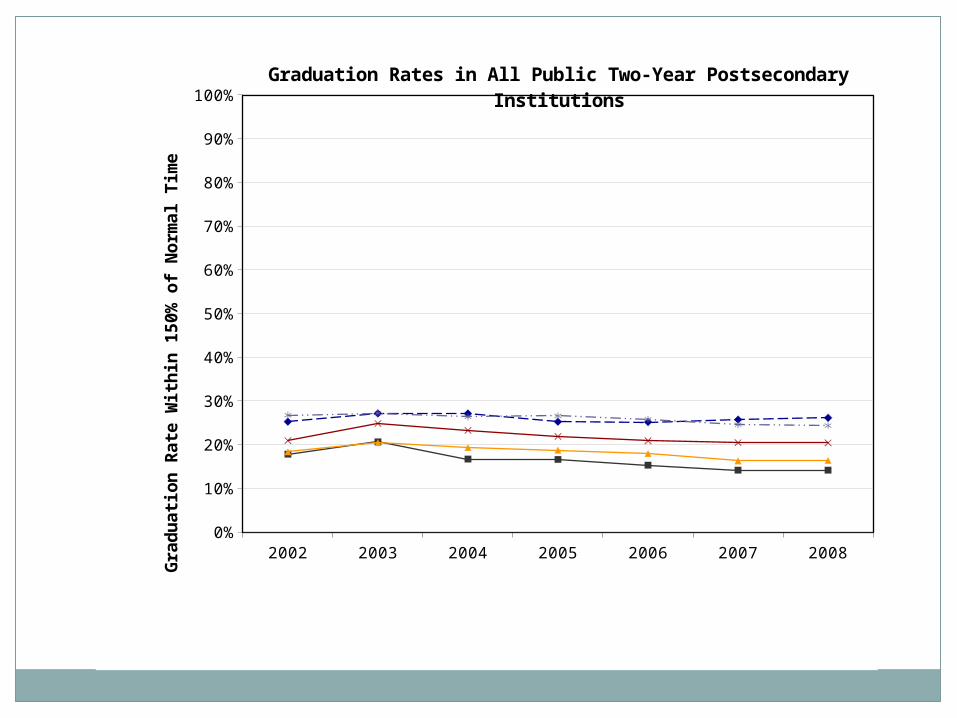
Graduation Rates in All Public Two-Year Postsecondary Insti-tutions
Grad
uatio
n R
ate W
ith
in 1
50%
of N
orm
al
Tim
e

1992 1994 1996 1998 2000 2002 2004 2006 2008
Asian
1.51986656423588
1.60215396581489
1.54539300485575
1.6176211851513
1.5952310518394
1.538943876293
1.41633089842354
1.40127166761389
1.39757643832002
Black
0.88119124800659
1
0.92127899720020
8
0.92879413646609
6
0.94170207761863
3
1.00450160111925
1.03649112436022
1.07512641423509
1.08105737593434
1.11174706239965
Latina/o
1.06771785909807
1.15752909071624
1.17901462548913
1.17715041972418
0.98464457062617
5
0.96694600472325
2
0.93458433800754
4
0.93245549725747
0.99399735081453
5
Native American
1.44276095510872
1.54513428530859
1.53706589769497
1.55166109888424
1.6168408720575
1.67589147754895
1.67812035758448
1.63958789244246
1.53477256178994
White
0.95758605037650
5
0.92654408389099
0.91401690104188
0.89476459912245
3
0.90001510117268
0.88773084323702
0.89199038235556
3
0.88482282436052
4
0.84872775971096
1
0.10
0.30
0.50
0.70
0.90
1.10
1.30
1.50
1.70
Racial/Ethnic Representation in All Public Two-Year Postsecondary Institutions as a Proportion of the United States Population
Data from NCES Integrated Postsecondary Education Data System and U.S. Census Bureau .© 2011 Projects Promoting Equity in Urban and Higher Education, NCID at the University of Michigan
Rep
resen
tatio
n R
atio
2002 2003 2004 2005 2006 2007 2008
Asian
0.252328115712305
0.271114615157189
0.271158235070369
0.252247357502716
0.251643835616438
0.25706380771226
0.261088061707474
Black
0.178010693371807
0.206298599189232
0.166772106955186
0.165941181435617
0.152786258222832
0.141487230572189
0.141471768915263
Latina/o
0.183513778542697
0.204378200211447
0.193067894306314
0.187338123892427
0.179485822172816
0.162686975913199
0.163678360700727
Native American
0.208979233694063
0.248241206030151
0.232573637211782
0.218579234972678
0.208692485128081
0.204370027312671
0.203757393018671
White
0.267165205191161
0.271866583389621
0.263350298809569
0.265552761130137
0.257801757408155
0.245508294586993
0.243477114439213
5%
15%
25%
35%
45%
55%
65%
75%
85%
95%
Graduation Rates in All Public Two-Year Postsecondary Institutions
Grad
uatio
n R
ate W
ith
in 1
50%
of N
orm
al
Tim
e
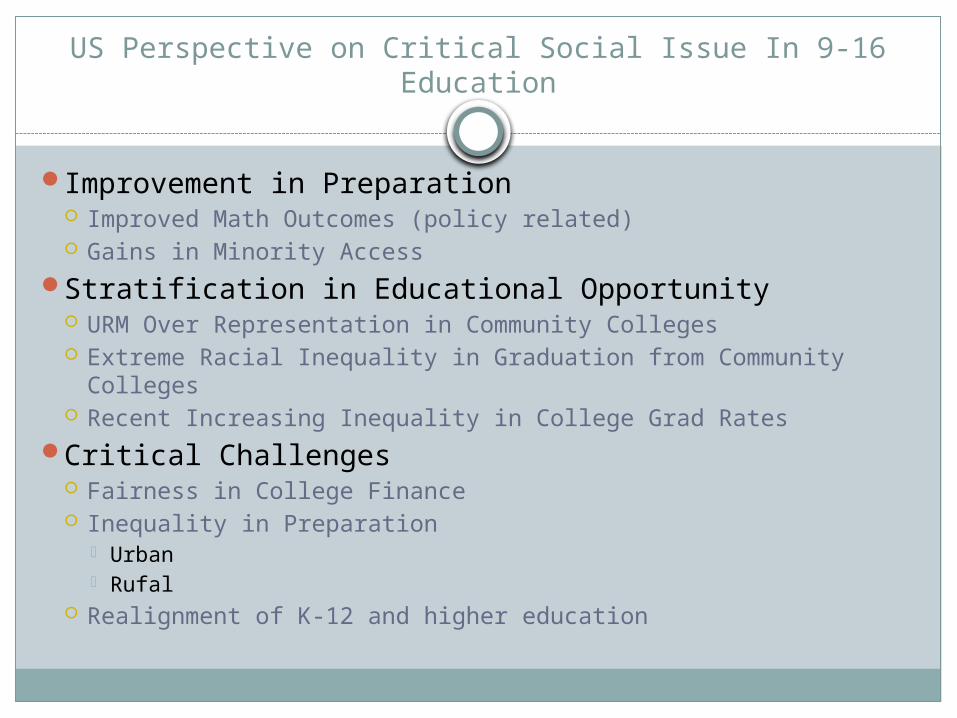
US Perspective on Critical Social Issue In 9-16 Education
Improvement in Preparation Improved Math Outcomes (policy related) Gains in Minority Access
Stratification in Educational Opportunity URM Over Representation in Community Colleges Extreme Racial Inequality in Graduation from Community
Colleges Recent Increasing Inequality in College Grad Rates
Critical Challenges Fairness in College Finance Inequality in Preparation
Urban Rufal
Realignment of K-12 and higher education
Missouri In Context
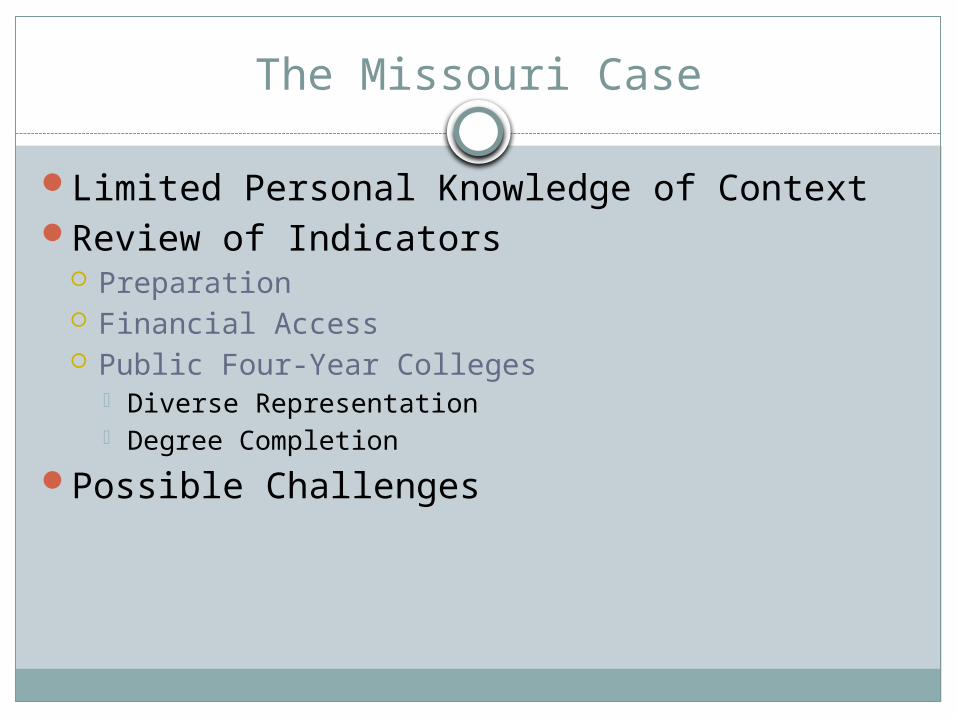
The Missouri Case
Limited Personal Knowledge of ContextReview of Indicators
Preparation Financial Access Public Four-Year Colleges
Diverse Representation Degree Completion
Possible Challenges
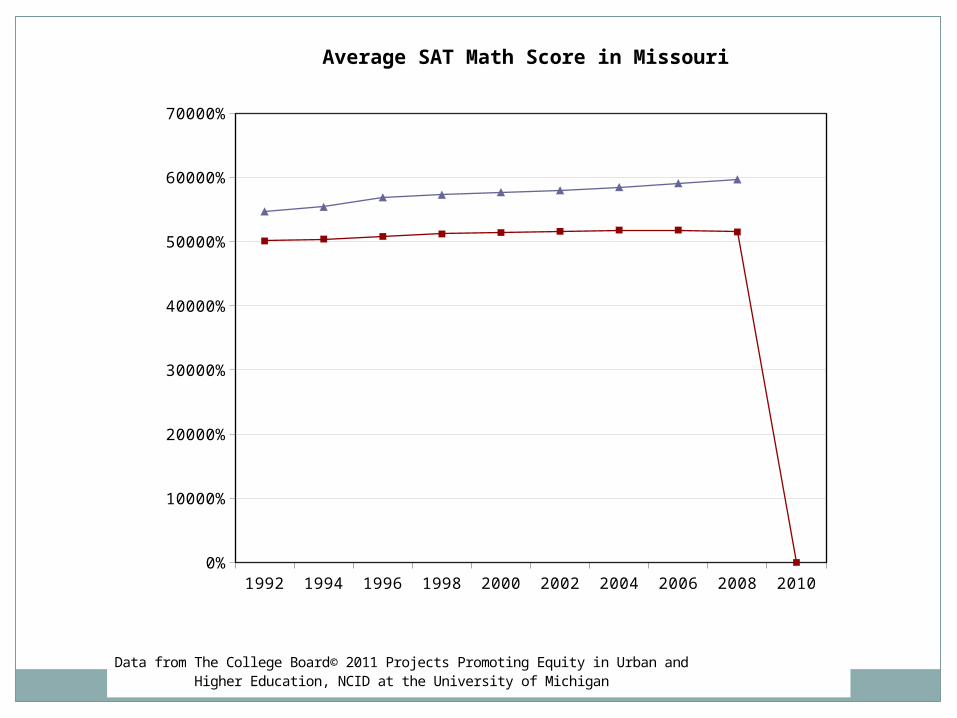
1992 1994 1996 1998 2000 2002 2004 2006 2008 2010
Missouri 547 554 569 573 577 580 585 591 597 NaN
United States 501 504 508 512 514 516 518 518 515 0
5000%
15000%
25000%
35000%
45000%
55000%
65000%
Average SAT Math Score in Missouri
Data from The College Board© 2011 Projects Promoting Equity in Urban and Higher Educa-tion, NCID at the University of Michigan
1992 1994 1996 1998 2000 2002 2004 2006 2008
Missouri
0.0372144172285275
0.0338550857427034
0.0344788372526295
0.0448310961107061
0.0436991857194026
0.0381534993143168
0.0230785813377104
0.0207385122566819
0.0666424786945809
United States
0.151351986359015
0.163222524687336
0.152143464202899
0.156915096347351
0.136230674199895
0.123752305449232
0.113198810080653
0.105421608093776
0.101616801667119
$0
$0
Missouri Need-based Grants as a Percent of State Tuition
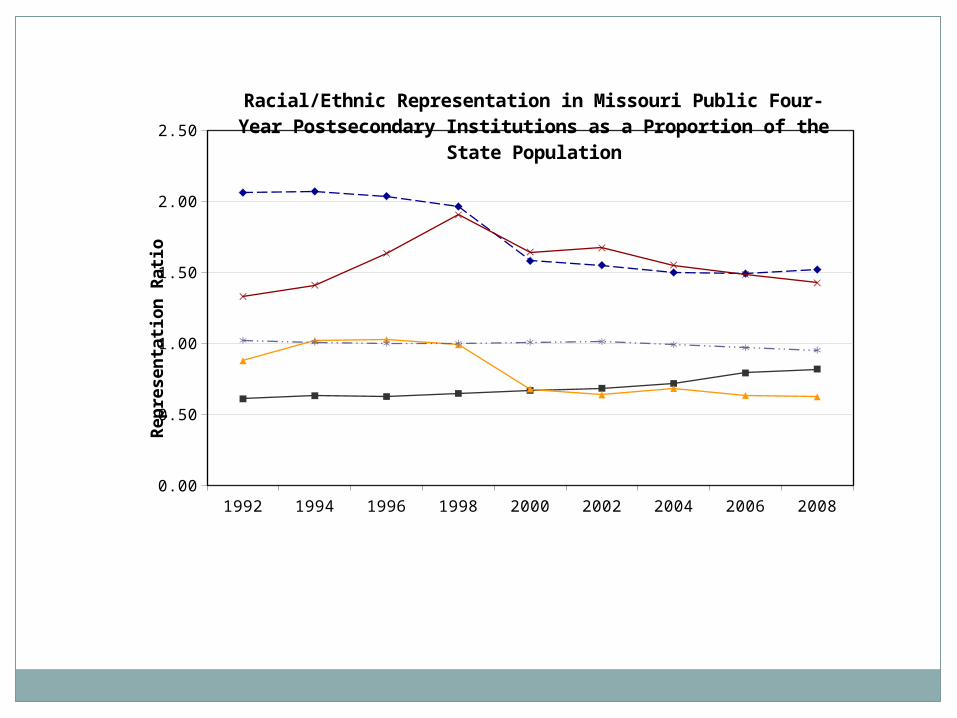
1992 1994 1996 1998 2000 2002 2004 2006 2008
Asian
2.0601319614563
2.0689044468337
2.03584680028201
1.96257897607525
1.57930594558166
1.54983943077978
1.49791593031189
1.49013802299748
1.51844946414668
Black
0.60832290742895
8
0.63053865405810
2
0.62402224419014
3
0.64657937053132
9
0.66718146563805
6
0.68271292863859
1
0.71658121547344
8
0.79048582458609
2
0.81774258259704
8
Latina/o
0.87625626311502
2
1.01816595213471
1.02563922323224
0.98890666287278
0.67754101514305
2
0.63588460535008
3
0.68006082150343
6
0.63169118341726
9
0.62235657760616
9
Native American
1.32868117289765
1.40884059921826
1.63282901364692
1.90365676301289
1.64208805167177
1.67100500834592
1.55059524024914
1.48414771985545
1.42457941465196
White
1.01969713933288
1.00755618267413
0.99832873844688
9
0.99988831849841
4
1.00683799512056
1.01158357012329
0.99034208956329
5
0.96823529642849
8
0.95060746492634
2
0.25
0.75
1.25
1.75
2.25
Racial/Ethnic Representation in Missouri Public Four-Year Post-secondary Institutions as a Proportion of the State Population
Rep
resen
tatio
n R
atio
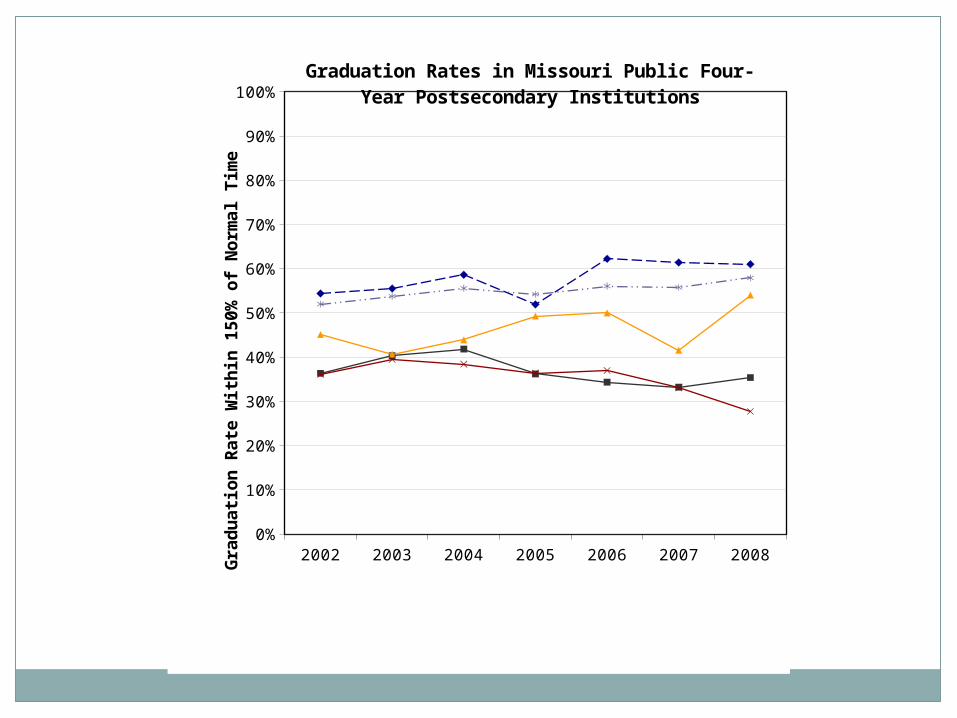
2002 2003 2004 2005 2006 2007 2008
Asian
0.5439739
0.5551602
0.5862069
0.5192308
0.622291 0.6140351
0.6103152
Black
0.3633721
0.4032587
0.4184261
0.3619529
0.3434089
0.3319398
0.353747
Latina/o
0.4511628
0.4065421
0.4390244
0.492823 0.5 0.4155844
0.5405405
Native American
0.3606557
0.3947369
0.384058 0.3636364
0.3697479
0.3307692
0.2771084
White
0.5201274
0.5375822
0.5557969
0.5423296
0.5607016
0.5577543
0.5792692
5%
15%
25%
35%
45%
55%
65%
75%
85%
95%
Graduation Rates in Missouri Public Four-Year Postsecondary Institutions
Grad
uatio
n R
ate W
ith
in 1
50%
of N
orm
al
Tim
e
Findings
Preparation Improving Rate For Taking ACT Competitive ACT & SAT/Mate Scores
Four-Year College Enrollment URM Gap Narrowing Probably Related to Improved Preparation
College Success URM Widening Probably Related to
Financial Challenges for Low-Income Students Challenging Preparation in Some Areas (Urban & Rural)
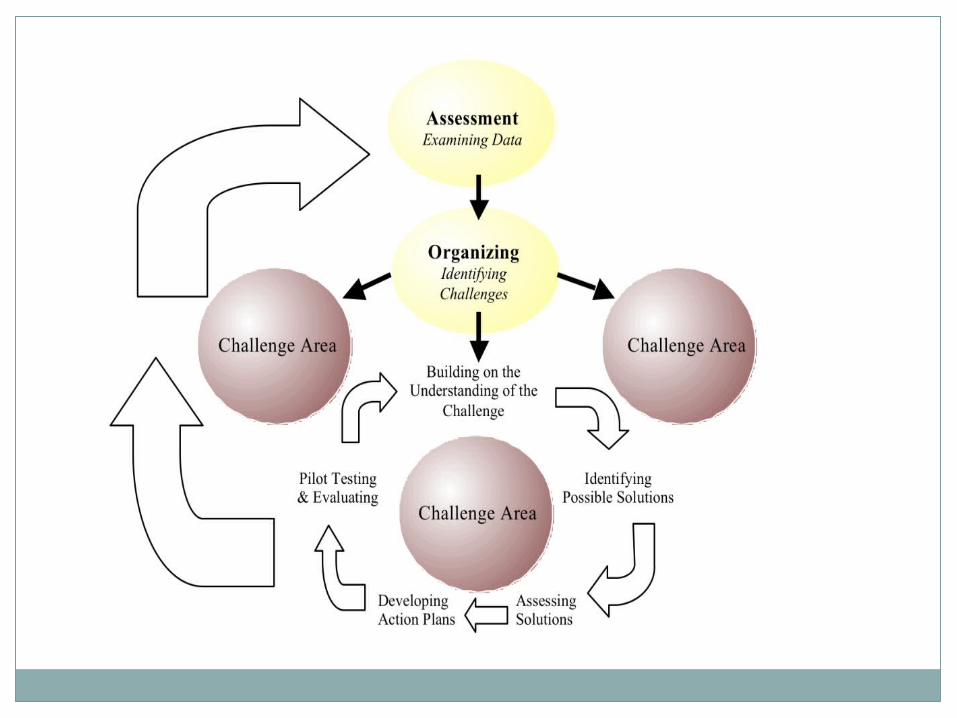
Research Partnerships
Actionable Approach to Reducing Inequality Action Inquiry Focusing on Critical Challenges Targeted Analyses Using Student-Record Data Pilot Testing
Try Out Innovations Adapt Using Evaluation Evidence
Role of University Partnerships Research Identifying Specific Challenges Technical Assistance with Action Inquiry Evaluation Informing Reform Research
Meeting Academic Standards Targeted on Informing Reform
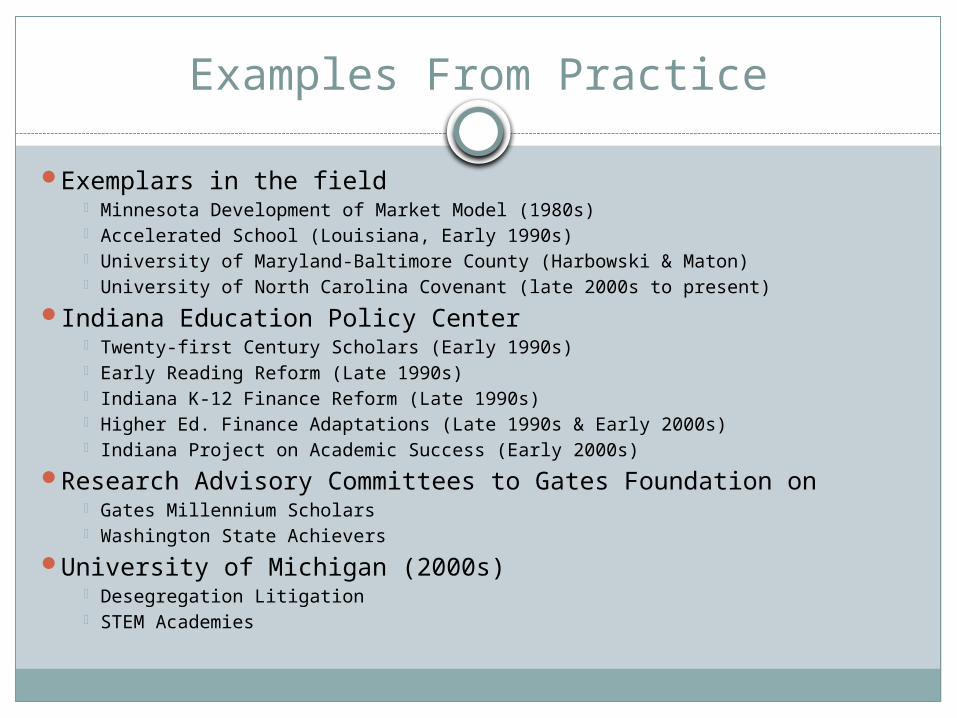
Examples From Practice
Exemplars in the field Minnesota Development of Market Model (1980s) Accelerated School (Louisiana, Early 1990s) University of Maryland-Baltimore County (Harbowski & Maton) University of North Carolina Covenant (late 2000s to present)
Indiana Education Policy Center Twenty-first Century Scholars (Early 1990s) Early Reading Reform (Late 1990s) Indiana K-12 Finance Reform (Late 1990s) Higher Ed. Finance Adaptations (Late 1990s & Early 2000s) Indiana Project on Academic Success (Early 2000s)
Research Advisory Committees to Gates Foundation on Gates Millennium Scholars Washington State Achievers
University of Michigan (2000s) Desegregation Litigation STEM Academies
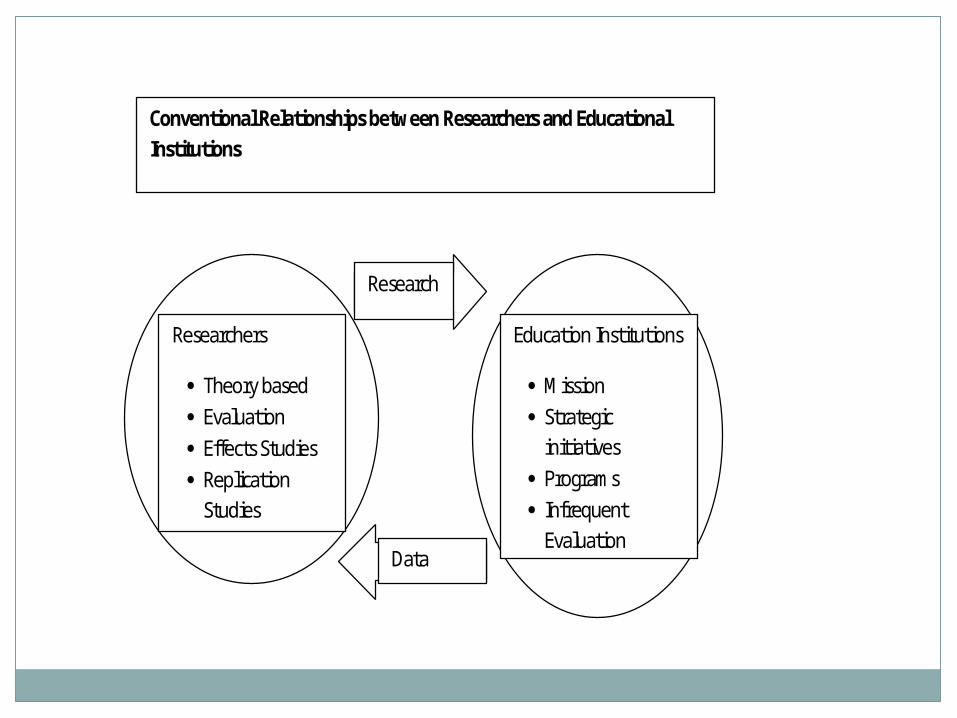
Research
Data
Education Institutions
Mission Strategic
initiatives Programs Infrequent
Evaluation
Researchers
Theory based Evaluation Effects Studies Replication
Studies
Conventional Relationships between Researchers and Educational Institutions
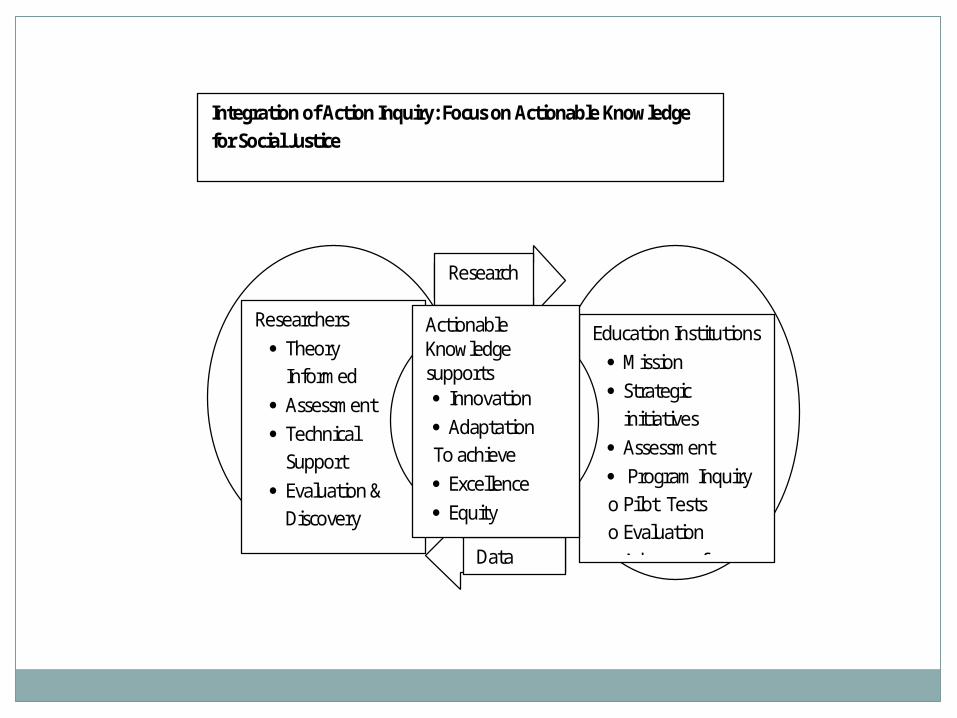
Research
Data
Education Institutions Mission Strategic
initiatives Assessment Program Inquiry o Pilot Tests o Evaluation Advocacy for
Reform
Researchers Theory
Informed Assessment Technical
Support Evaluation &
Discovery
Actionable Knowledge supports Innovation Adaptation To achieve Excellence Equity
Integration of Action Inquiry: Focus on Actionable Knowledge for Social Justice
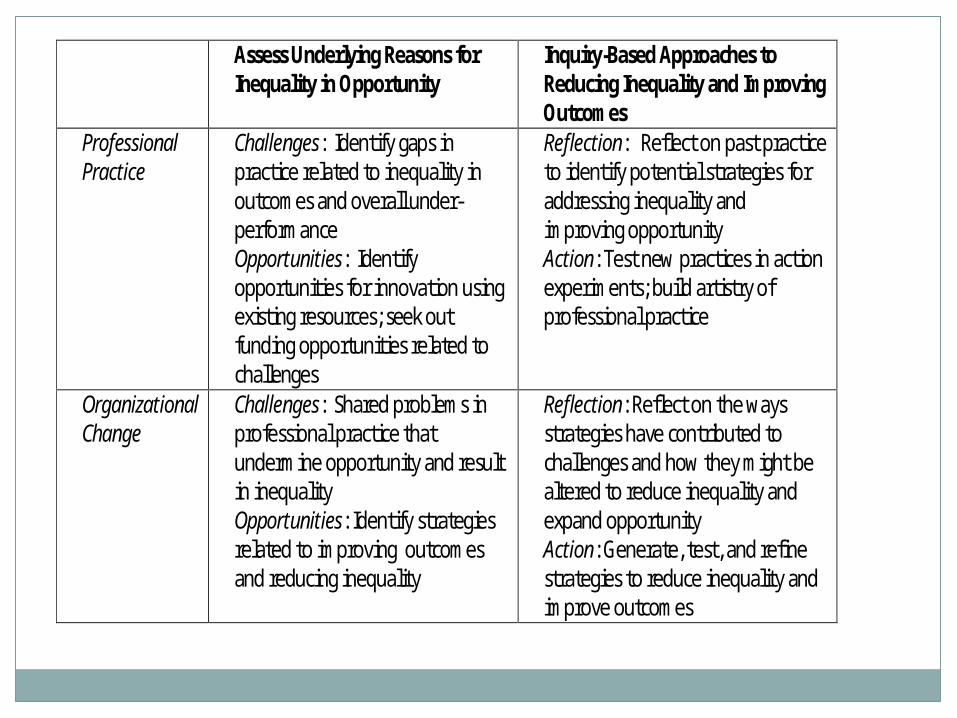
Assess Underlying Reasons for Inequality in Opportunity
Inquiry-Based Approaches to Reducing Inequality and Improving Outcomes
Professional Practice
Challenges: Identify gaps in practice related to inequality in outcomes and overall under- performance Opportunities: Identify opportunities for innovation using existing resources; seek out funding opportunities related to challenges
Reflection: Reflect on past practice to identify potential strategies for addressing inequality and improving opportunity Action: Test new practices in action experiments; build artistry of professional practice
Organizational Change
Challenges: Shared problems in professional practice that undermine opportunity and result in inequality Opportunities: Identify strategies related to improving outcomes and reducing inequality
Reflection: Reflect on the ways strategies have contributed to challenges and how they might be altered to reduce inequality and expand opportunity Action: Generate, test, and refine strategies to reduce inequality and improve outcomes
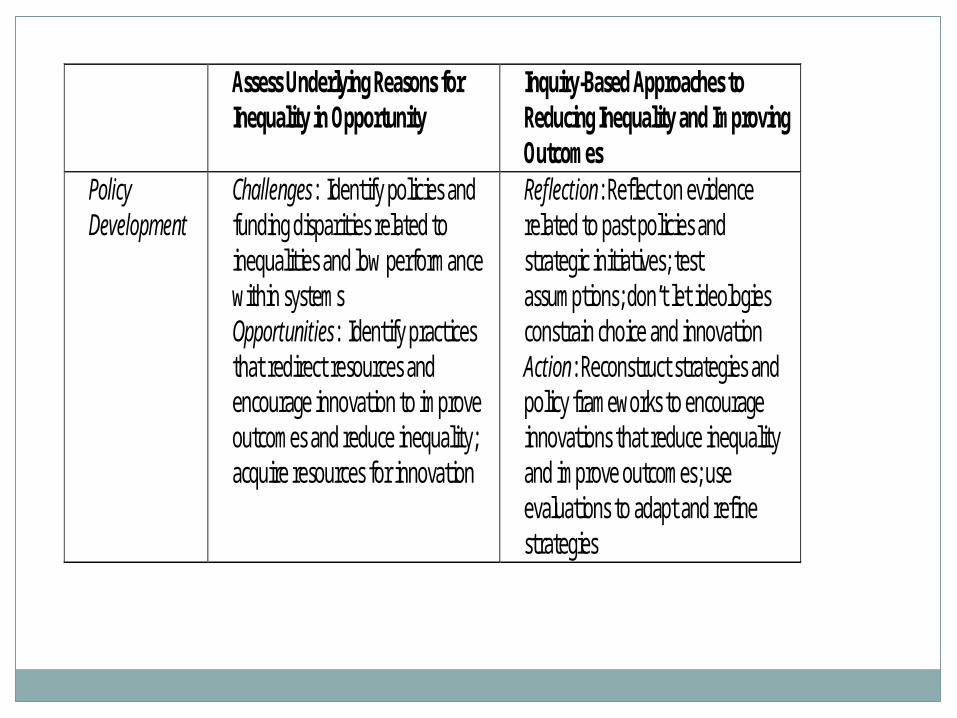
Assess Underlying Reasons for Inequality in Opportunity
Inquiry-Based Approaches to Reducing Inequality and Improving Outcomes
Policy Development
Challenges: Identify policies and funding disparities related to inequalities and low performance within systems Opportunities: Identify practices that redirect resources and encourage innovation to improve outcomes and reduce inequality; acquire resources for innovation
Reflection: Reflect on evidence related to past policies and strategic initiatives; test assumptions; don’t let ideologies constrain choice and innovation Action: Reconstruct strategies and policy frameworks to encourage innovations that reduce inequality and improve outcomes; use evaluations to adapt and refine strategies
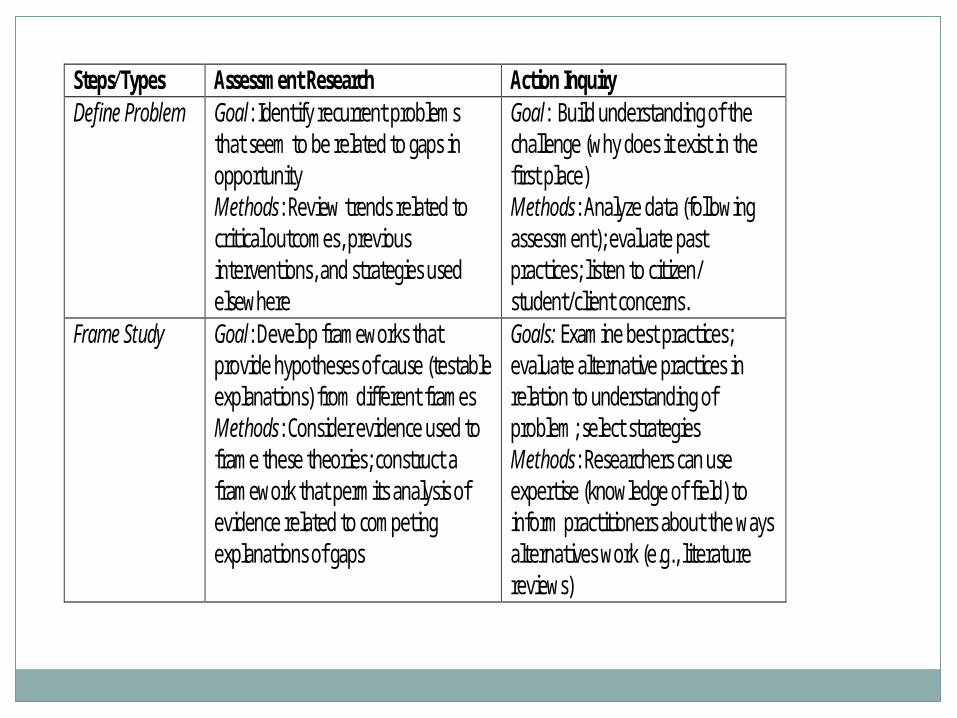
Steps/Types Assessment Research Action Inquiry Define Problem Goal: Identify recurrent problems
that seem to be related to gaps in opportunity Methods: Review trends related to critical outcomes, previous interventions, and strategies used elsewhere
Goal: Build understanding of the challenge (why does it exist in the first place) Methods: Analyze data (following assessment); evaluate past practices; listen to citizen/ student/client concerns.
Frame Study Goal: Develop frameworks that provide hypotheses of cause (testable explanations) from different frames Methods: Consider evidence used to frame these theories; construct a framework that permits analysis of evidence related to competing explanations of gaps
Goals: Examine best practices; evaluate alternative practices in relation to understanding of problem; select strategies Methods: Researchers can use expertise (knowledge of field) to inform practitioners about the ways alternatives work (e.g., literature reviews)
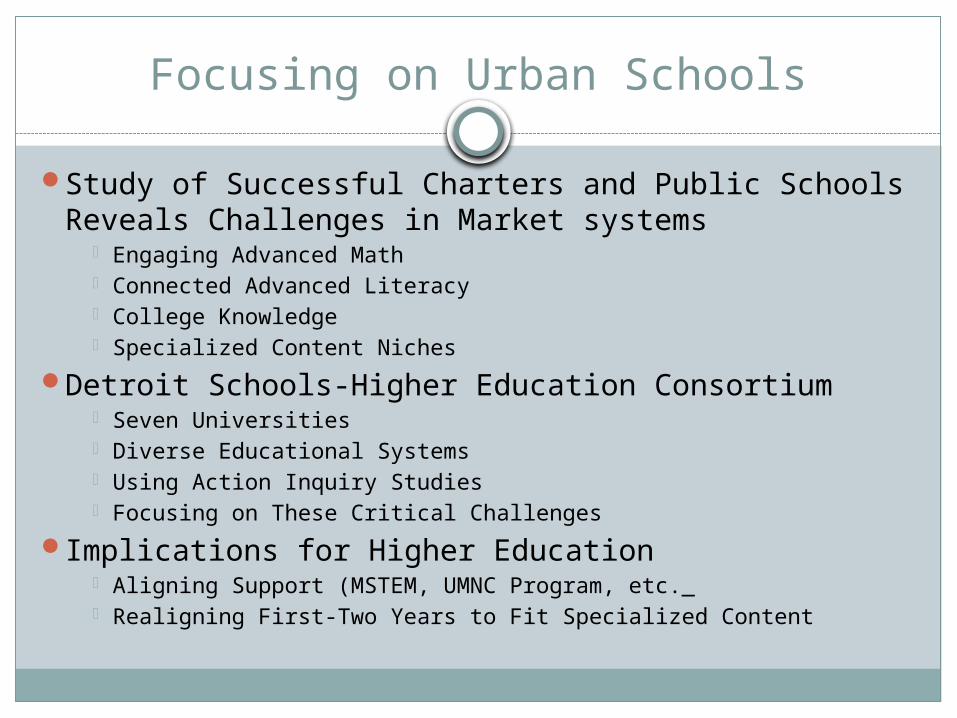
Focusing on Urban Schools
Study of Successful Charters and Public Schools Reveals Challenges in Market systems
Engaging Advanced Math Connected Advanced Literacy College Knowledge Specialized Content Niches
Detroit Schools-Higher Education Consortium Seven Universities Diverse Educational Systems Using Action Inquiry Studies Focusing on These Critical Challenges
Implications for Higher Education Aligning Support (MSTEM, UMNC Program, etc._ Realigning First-Two Years to Fit Specialized Content
Concluding Reflections
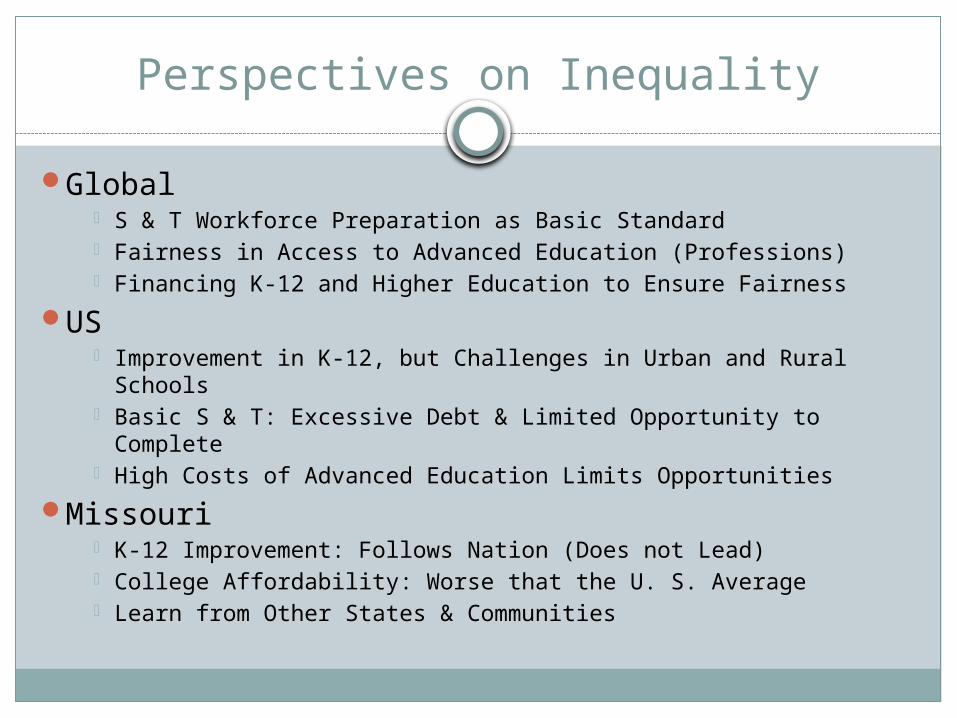
Perspectives on Inequality
Global S & T Workforce Preparation as Basic Standard Fairness in Access to Advanced Education (Professions) Financing K-12 and Higher Education to Ensure Fairness
US Improvement in K-12, but Challenges in Urban and Rural
Schools Basic S & T: Excessive Debt & Limited Opportunity to Complete High Costs of Advanced Education Limits Opportunities
Missouri K-12 Improvement: Follows Nation (Does not Lead) College Affordability: Worse that the U. S. Average Learn from Other States & Communities
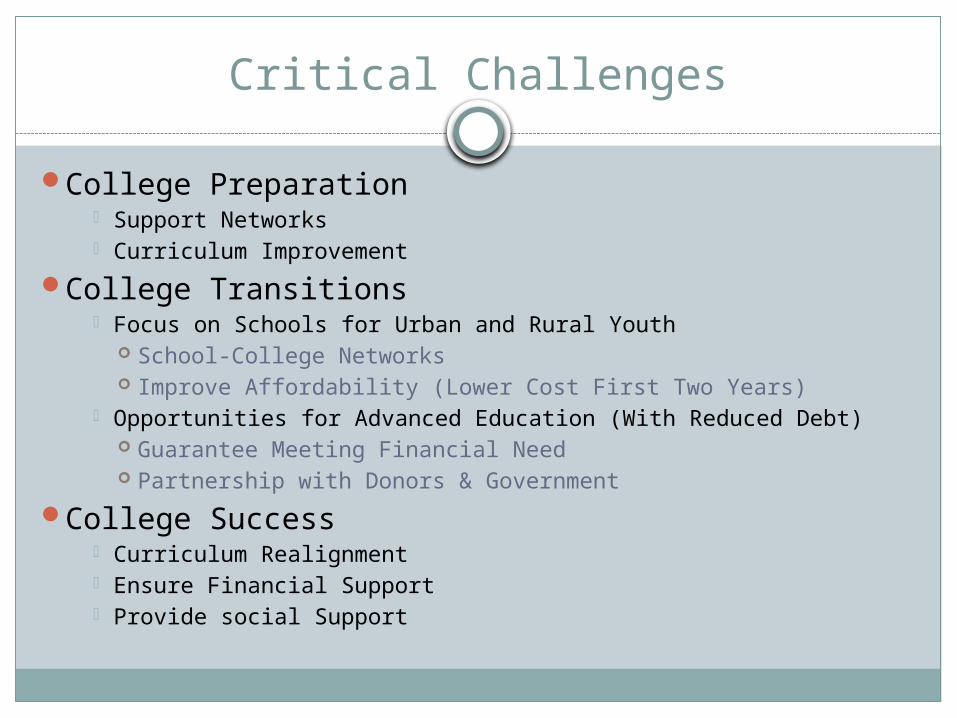
Critical Challenges
College Preparation Support Networks Curriculum Improvement
College Transitions Focus on Schools for Urban and Rural Youth
School-College Networks Improve Affordability (Lower Cost First Two Years)
Opportunities for Advanced Education (With Reduced Debt) Guarantee Meeting Financial Need Partnership with Donors & Government
College Success Curriculum Realignment Ensure Financial Support Provide social Support
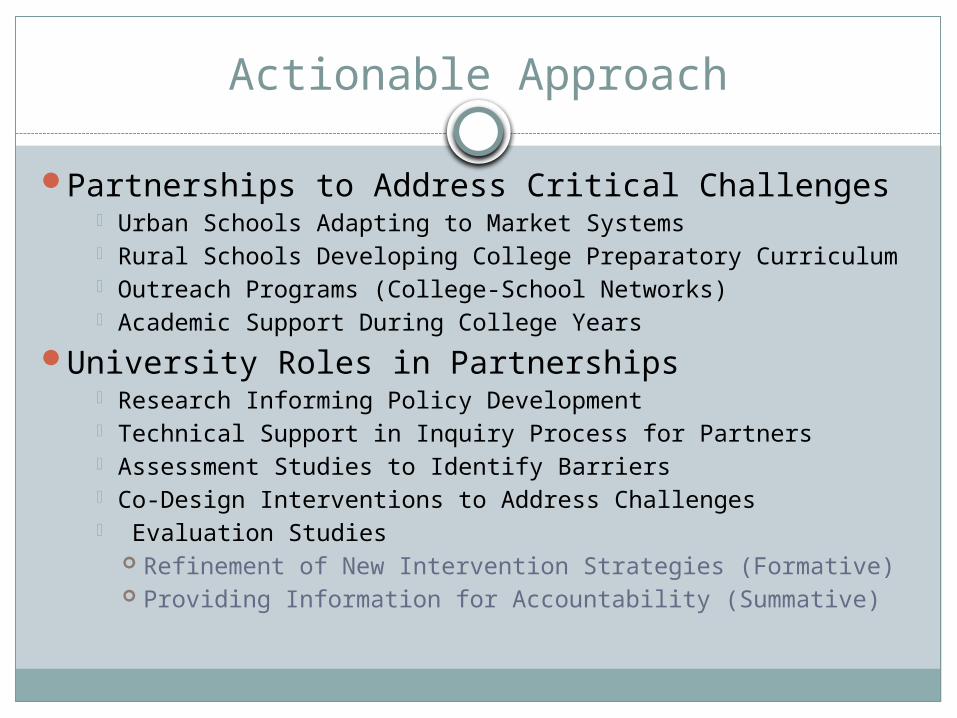
Actionable Approach
Partnerships to Address Critical Challenges Urban Schools Adapting to Market Systems Rural Schools Developing College Preparatory Curriculum Outreach Programs (College-School Networks) Academic Support During College Years
University Roles in Partnerships Research Informing Policy Development Technical Support in Inquiry Process for Partners Assessment Studies to Identify Barriers Co-Design Interventions to Address Challenges Evaluation Studies
Refinement of New Intervention Strategies (Formative) Providing Information for Accountability (Summative)
Selected References
St. John, E. P. (in press). Research, Actionable Knowledge, and Social Change. Sterling, VA: Stylus.
St. John, E.P., Chapman-Moronski, K., & Daun-Barnett, N. (2013). Public Policy and Higher Education: Reframing Strategies for Preparation, Access, and College Success. New York: Routledge.
St. John, E. P., Hu, S., & Fisher, A. S. (2011). Breaking through the access barrier: Academic capital formation informing public policy. New York: Routledge.
St. John, E. P., & Musoba, G. D. (2010). Pathways to academic success: Expanding opportunity for underrepresented students. New York: Routledge.