Embed Size (px)
Citation preview

本份文件若有中文說明異於英文原文之處,以英文原文為準。
*以 2013年第四季平均匯率 1US$=NT$29.442 換算,若有差異,是因美金尾數或四捨五入造成。
**以 2013年第三季平均匯率 1US$=NT$29.885換算,若有差異,是因美金尾數或四捨五入造成。
***以 2012年第四季平均匯率 1US$=NT$29.127 換算,若有差異,是因美金尾數或四捨五入造成。
****以 2013年全年平均匯率 1US$=NT$29.604 換算,若有差異,是因美金尾數或四捨五入造成。
*****以 2012年全年平均匯率 1US$=NT$29.562 換算,若有差異,是因美金尾數或四捨五入造成。
1/16
奇景光電公佈自結奇景光電公佈自結奇景光電公佈自結奇景光電公佈自結 2013 年第年第年第年第四四四四季季季季、、、、全年全年全年全年合併財務報表合併財務報表合併財務報表合併財務報表 及及及及 2014 年年年年第第第第一一一一季展望季展望季展望季展望 2013年第四季營收超過法說預估 每 ADS盈餘達預估高標 毛利率符合預估
2014年第一季預估營收持平或小跌 毛利率小跌
� 2013年第年第年第年第四四四四季季季季,,,,營收淨額為營收淨額為營收淨額為營收淨額為 1億億億億 9,520萬美元萬美元萬美元萬美元,,,,較前一季成長較前一季成長較前一季成長較前一季成長 1.3%,,,,超過法說預估超過法說預估超過法說預估超過法說預估
� 2013 年第年第年第年第四四四四季季季季,,,,中小尺寸驅動中小尺寸驅動中小尺寸驅動中小尺寸驅動 IC 營收營收營收營收,,,,較去年同期較去年同期較去年同期較去年同期成長成長成長成長 32.3%,,,,占營收比例達占營收比例達占營收比例達占營收比例達 57.9%,,,,連續四連續四連續四連續四季季季季突破五成突破五成突破五成突破五成,,,,總金額與占營收總金額與占營收總金額與占營收總金額與占營收比例比例比例比例皆皆皆皆創歷史新高創歷史新高創歷史新高創歷史新高
� 2013 年第年第年第年第四四四四季季季季,,,,非驅動非驅動非驅動非驅動 IC 產品營收淨額產品營收淨額產品營收淨額產品營收淨額,,,,較去年同期增加較去年同期增加較去年同期增加較去年同期增加 28.1%,,,,占營收比占營收比占營收比占營收比例例例例 18.1%,,,,總金額與總金額與總金額與總金額與占營收占營收占營收占營收比例連續三比例連續三比例連續三比例連續三季季季季創歷史新高創歷史新高創歷史新高創歷史新高
� 2013年第年第年第年第四四四四季毛利率為季毛利率為季毛利率為季毛利率為 25.1%,,,,符合符合符合符合預估預估預估預估,,,,較去年同期較去年同期較去年同期較去年同期 23.3%增加增加增加增加 1.8個百分點個百分點個百分點個百分點,,,,較前一季較前一季較前一季較前一季 25.3%微幅減少微幅減少微幅減少微幅減少 0.2個百分點個百分點個百分點個百分點
� 2013年第年第年第年第四四四四季稅後淨利為季稅後淨利為季稅後淨利為季稅後淨利為 1,580萬美元萬美元萬美元萬美元,,,,較去年同期較去年同期較去年同期較去年同期 1,480萬美元萬美元萬美元萬美元增加增加增加增加 7.2%;;;;每每每每 ADS盈餘為盈餘為盈餘為盈餘為 9.2美分美分美分美分(約新台幣約新台幣約新台幣約新台幣 2.71元元元元),,,,較去年同期較去年同期較去年同期較去年同期 8.6美分美分美分美分(約新台幣約新台幣約新台幣約新台幣 2.50元元元元)增加增加增加增加 6.4%
� 2013年全年稅後淨利為年全年稅後淨利為年全年稅後淨利為年全年稅後淨利為 6,150萬美元萬美元萬美元萬美元,,,,較較較較 2012年年年年 5,160萬美元成長萬美元成長萬美元成長萬美元成長 19.1%;;;;2013年每年每年每年每 ADS盈餘盈餘盈餘盈餘為為為為 35.8美分美分美分美分(約新台幣約新台幣約新台幣約新台幣 10.60元元元元),,,,較較較較 2012年年年年 30.2美分美分美分美分(約新台幣約新台幣約新台幣約新台幣 8.93元元元元)成長成長成長成長 18.4%
� 預估預估預估預估 2014 年第年第年第年第一一一一季季季季,,,,營收較營收較營收較營收較 2013 年年年年第第第第四四四四季季季季持平或小跌持平或小跌持平或小跌持平或小跌,,,,毛利率毛利率毛利率毛利率小跌小跌小跌小跌,,,,每每每每 ADS 盈餘為盈餘為盈餘為盈餘為 8.0 至至至至 9.5美分美分美分美分(約新台幣約新台幣約新台幣約新台幣 2.36至至至至 2.80元元元元)之間之間之間之間
[台南,2014年 2月 13日] 奇景光電 (納斯達克代號: HIMX) 今日公佈自結 2013年第四季與全年合併財務報表,及 2014 年第一季的展望。奇景光電 2013 年第四季營收淨額超過法說預估,每 ADS 盈餘達預估高標,毛利率則符合預估。
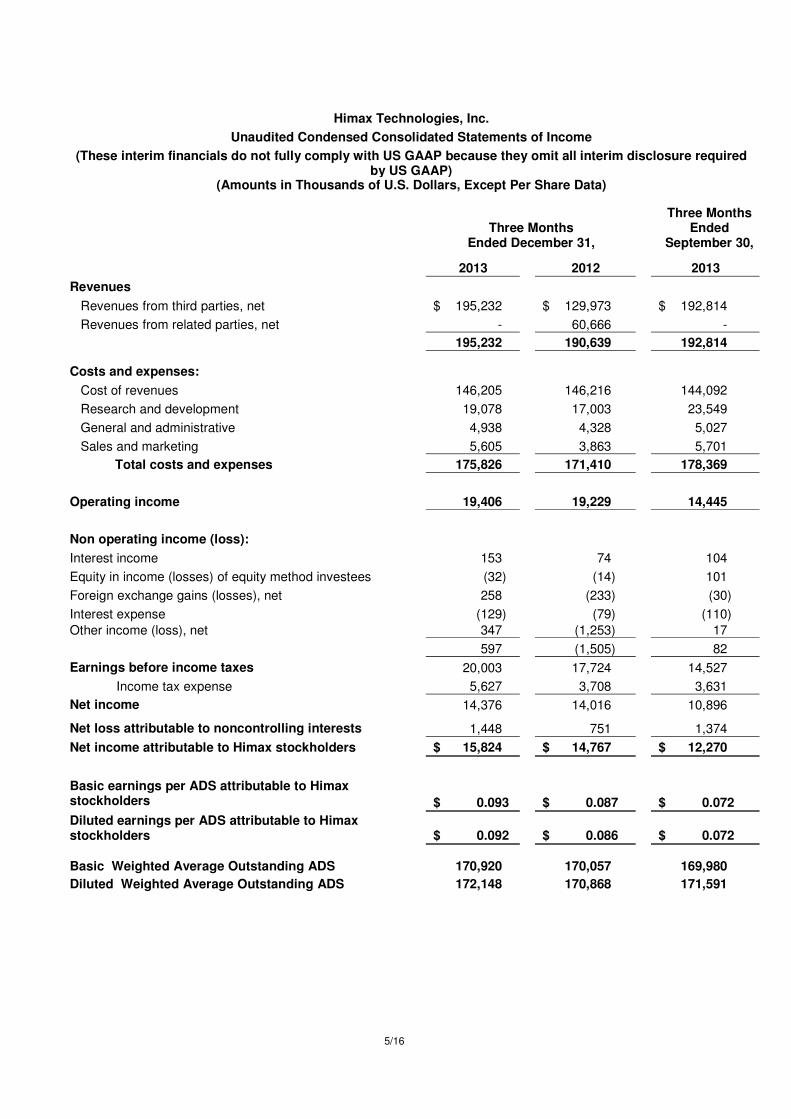
奇景光電 2013年第四季營收淨額為 1億 9,520萬美元(約新台幣 57億 4,800萬元*),較去年同期 1億 9,060萬美元 (約新台幣 55億 5,300萬元***)成長 2.4%,較第三季 1億 9,280萬美元(約新台幣 57億 6,200萬元**)增加1.3%。第四季毛利率為 25.1%,較去年同期 23.3%上升 1.8 個百分點,較第三季 25.3%微幅減少 0.2 個百分點,為過去毛利率連續八季成長後首次下降。
2013年第四季稅後淨利為 1,580萬美元 (約新台幣 4億 6,600萬元*),去年同期為 1,480萬美元 (約新台幣 4億3,000萬元***),第三季為 1,230萬美元(約新台幣 3億 6,700萬元**)。2013年第四季每 ADS盈餘為 9.2美分(約新台幣 2.71元*),去年同期為 8.6美分(約新台幣 2.50元***),第三季為 7.2美分(約新台幣 2.15元**)。
奇景表示,2013 年第四季營收淨額超過法說原本持平至小跌的預估,主要是中國大陸、韓國智慧型手機及平板電腦客戶驅動 IC 產品,以及非驅動 IC 產品等需求,最後較預期為佳。毛利率出現八季連續成長後首次下降,主要原因是產品組合變動影響。然而,第四季毛利率較去年同期仍大幅成長 1.8個百分點。
2013年第四季的大尺寸驅動 IC產品,營收淨額為 4,680萬美元(約新台幣 13億 7,800萬元*),較去年同期大幅減少 39.7%,較 2013年第三季下降 18.9%,占 2013年第四季營收比例為 24.0%,去年同期此比例為 40.7%,2013 年第三季為 29.9%。由於電視、筆記型電腦及監視器全球市場持續疲軟,以及來自群創訂單減少,因此第四季大尺寸驅動 IC產品營收衰退。但奇景對其他大尺寸客戶營收則呈現成長。
2013年第四季中小尺寸驅動 IC產品,營收淨額為 1億 1,300萬美元(約新台幣 33億 2,700萬元*),較去年同期大幅成長 32.3%,較 2013 年第三季成長 12.4%,占營收比例 57.9%,去年同期此比例為 44.8%,上一季為52.1%,連續四季突破五成,總金額與占營收比例皆創歷史新高。
2013年第四季非驅動 IC產品中,以時序控制 IC (TCON,Timing Controller)、觸控 IC、CMOS影像感測器、電源管理 IC、客製化 IC 及 LCOS 微投影解決方案等產品表現最好。營收淨額為 3,540 萬美元(約新台幣 10 億

本份文件若有中文說明異於英文原文之處,以英文原文為準。
*以 2013年第四季平均匯率 1US$=NT$29.442 換算,若有差異,是因美金尾數或四捨五入造成。
**以 2013年第三季平均匯率 1US$=NT$29.885換算,若有差異,是因美金尾數或四捨五入造成。
***以 2012年第四季平均匯率 1US$=NT$29.127 換算,若有差異,是因美金尾數或四捨五入造成。
****以 2013年全年平均匯率 1US$=NT$29.604 換算,若有差異,是因美金尾數或四捨五入造成。
*****以 2012年全年平均匯率 1US$=NT$29.562 換算,若有差異,是因美金尾數或四捨五入造成。
2/16
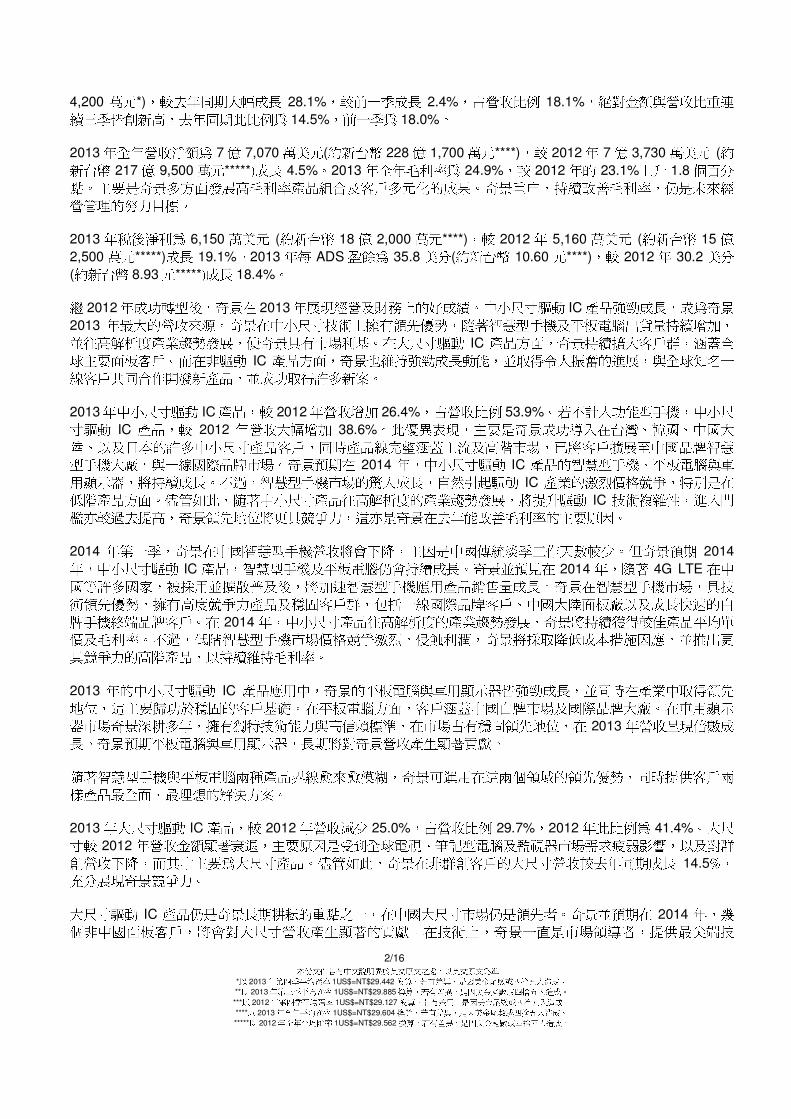
4,200 萬元*),較去年同期大幅成長 28.1%,較前一季成長 2.4%,占營收比例 18.1%,絕對金額與營收比重連續三季皆創新高,去年同期此比例為 14.5%,前一季為 18.0%。
2013年全年營收淨額為 7億 7,070萬美元(約新台幣 228億 1,700萬元****),較 2012年 7億 3,730萬美元 (約新台幣 217億 9,500萬元*****)成長 4.5%。2013年全年毛利率為 24.9%,較 2012年的 23.1%上升 1.8個百分點。主要是奇景多方面發展高毛利率產品組合及客戶多元化的成果。奇景重申,持續改善毛利率,仍是未來經營管理的努力目標。
2013年稅後淨利為 6,150萬美元 (約新台幣 18億 2,000萬元****),較 2012年 5,160萬美元 (約新台幣 15億2,500萬元*****)成長 19.1%。2013年每 ADS盈餘為 35.8美分(約新台幣 10.60元****),較 2012年 30.2美分(約新台幣 8.93元*****)成長 18.4%。
繼 2012年成功轉型後,奇景在 2013年展現經營及財務上的好成績。中小尺寸驅動 IC產品強勁成長,成為奇景2013 年最大的營收來源。奇景在中小尺寸技術上擁有領先優勢,隨著智慧型手機及平板電腦出貨量持續增加,並往高解析度產業趨勢發展,使奇景具有市場利基。在大尺寸驅動 IC 產品方面,奇景持續擴大客戶群,涵蓋全球主要面板客戶。而在非驅動 IC 產品方面,奇景也維持強勁成長動能,並取得令人振奮的進展,與全球知名一線客戶共同合作開發新產品,並成功取得許多新案。
2013年中小尺寸驅動 IC產品,較 2012年營收增加 26.4%,占營收比例 53.9%。若不計入功能型手機,中小尺寸驅動 IC 產品,較 2012 年營收大幅增加 38.6%。此優異表現,主要是奇景成功導入在台灣、韓國、中國大陸、以及日本的許多中小尺寸產品客戶,同時產品線完整涵蓋主流及高階市場,已將客戶擴展至中國品牌智慧型手機大廠,與一線國際品牌市場。奇景預期在 2014 年,中小尺寸驅動 IC 產品的智慧型手機、平板電腦與車用顯示器,將持續成長。不過,智慧型手機市場的驚人成長,自然引起驅動 IC 產業的激烈價格競爭,特別是在低階產品方面。儘管如此,隨著中小尺寸產品往高解析度的產業趨勢發展,將提升驅動 IC 技術複雜性,進入門檻亦較過去提高,奇景領先地位將更具競爭力,這亦是奇景在去年能改善毛利率的主要原因。
2014 年第一季,奇景在中國智慧型手機營收將會下降,主因是中國傳統淡季工作天數較少。但奇景預期 2014年,中小尺寸驅動 IC產品,智慧型手機及平板電腦仍會持續成長。奇景並預見在 2014年,隨著 4G LTE 在中國等許多國家,被採用並擴散普及後,將加速智慧型手機應用產品銷售量成長。奇景在智慧型手機市場,具技術領先優勢,擁有高度競爭力產品及穩固客戶群,包括一線國際品牌客戶、中國大陸面板廠以及成長快速的白牌手機終端品牌客戶。在 2014年,中小尺寸產品往高解析度的產業趨勢發展,奇景將持續獲得較佳產品平均單價及毛利率。不過,低階智慧型手機市場價格競爭激烈,侵蝕利潤,奇景將採取降低成本措施因應,並推出更具競爭力的高階產品,以持續維持毛利率。
2013 年的中小尺寸驅動 IC 產品應用中,奇景的平板電腦與車用顯示器皆強勁成長,並同時在產業中取得領先地位,這主要歸功於穩固的客戶基礎。在平板電腦方面,客戶涵蓋中國白牌市場及國際品牌大廠。在車用顯示器市場奇景深耕多年,擁有獨特技術能力與高信賴標準,在市場占有穩固領先地位,在 2013年營收呈現倍數成長。奇景預期平板電腦與車用顯示器,長期將對奇景營收產生顯著貢獻。
隨著智慧型手機與平板電腦兩種產品界線愈來愈模糊,奇景可運用在這兩個領域的領先優勢,同時提供客戶兩樣產品最全面、最理想的解決方案。
2013年大尺寸驅動 IC產品,較 2012年營收減少 25.0%,占營收比例 29.7%,2012年此比例為 41.4%。大尺寸較 2012年營收金額顯著衰退,主要原因是受到全球電視、筆記型電腦及監視器市場需求疲弱影響,以及對群創營收下降,而其中主要為大尺寸產品。儘管如此,奇景在非群創客戶的大尺寸營收較去年同期成長 14.5%,充分展現奇景競爭力。
大尺寸驅動 IC 產品仍是奇景長期耕耘的重點之一,在中國大尺寸市場仍是領先者。奇景並預期在 2014 年,幾個非中國面板客戶,將會對大尺寸營收產生顯著的貢獻。在技術上,奇景一直是市場領導者,提供最尖端技

本份文件若有中文說明異於英文原文之處,以英文原文為準。
*以 2013年第四季平均匯率 1US$=NT$29.442 換算,若有差異,是因美金尾數或四捨五入造成。
**以 2013年第三季平均匯率 1US$=NT$29.885換算,若有差異,是因美金尾數或四捨五入造成。
***以 2012年第四季平均匯率 1US$=NT$29.127 換算,若有差異,是因美金尾數或四捨五入造成。
****以 2013年全年平均匯率 1US$=NT$29.604 換算,若有差異,是因美金尾數或四捨五入造成。
*****以 2012年全年平均匯率 1US$=NT$29.562 換算,若有差異,是因美金尾數或四捨五入造成。
3/16
術。對快速發展的 4K 電視,奇景正在引領市場發展,提供 4K 電視常見散熱問題的解決方案。奇景一直是 4K電視技術領導者,而今年大尺寸主要成長動能將來自 4K 電視。在 2014 年第一季,奇景預期藉由既有及新客戶,帶動大尺寸營收成長,這是奇景長期努力展現的成果。在 2014 年,奇景有信心,大尺寸驅動 IC 產品營收將會恢復成長。
2013年非驅動 IC產品,較 2012年營收大幅增加 22.4%,占營收比例 16.4%,2012年此比例為 14.0%。奇景擁有技術領先的非驅動 IC產品,是公司最佳的長期成長動能,也是奇景與其他競爭者的最大差異之一。
在 2013年,奇景的 CMOS影像感測器營收顯著成長,並將繼續成為 2014年非驅動 IC快速成長的產品項目。在 2013年,奇景將自己定位為高階影像感測器供應商,並在第四季推出第一個八百萬畫素高階新產品。目前,奇景 CMOS 影像感測器產品,具備入門級 qVGA 及 VGA,及高階八百萬畫素等產品,供應智慧型手機、平板電腦、網路攝影機、安防監控與汽車領域等客戶。2014 年第一季,奇景預期 CMOS 影像感測器營收將繼續成長,惟低階產品庫存水位過高,將對此產品線毛利率產生負面影響。奇景有信心,在解決低階產品庫存水位過高問題,並增加高毛利率新產品出貨後,將可改善產品組合,進而提升毛利率。
奇景的觸控 IC 產品業務,已涵蓋手機及平板電腦市場,隨著成功導入中國大陸及國際客戶,奇景預期,在2014年觸控 IC產品將有強勁成長。奇景亦持續研發新技術,包括下一代 on-cell 及 in-cell觸控感應器。奇景在2014年獲得多件觸控 IC新開發案,相信觸控 IC產品將可長期成長。
至於 LCOS微投影業務,在 2013年第四季,奇景推出新一代技術,並獲得頂級客戶認可,繼續擴大與競爭者的技術領先差距。此新一代技術,能提高產品性能,大大簡化客戶端產品製程。此頭戴式顯示器新應用,具有相當大的市場潛力與商機,奇景對此感到振奮。奇景正與數家客戶,包括一線品牌大廠,合作多項開發案,並收取開發費用,提供客製化新設計。奇景亦繼續小批量出貨給客戶進行試產。奇景預期在 2014年,LCOS微投影產品營收將顯著成長。奇景相信, LCOS微投影解決方案,將是公司長期最重要的成長動能之一。
奇景一向重視新技術研發,繼 2013年研發費用較前年成長 13.3%後,奇景計畫在 2014年繼續提高研發費用支出,以因應未來新業務成長需要。
奇景光電預估,2014 年第一季營收較 2013年第四季持平或小跌,毛利率小跌,每 ADS盈餘為 8.0至 9.5美分(約新台幣 2.36*至 2.80*元)之間。
截至 2013年 12月 31日止,奇景期末流通在外股數為約當 1億 7,050萬單位 ADS。與第三季底維持不變。
本季依美國會計準則,(不含股票酬勞費用及購併相關費用)毛利率、營業利益率及淨利率之調節表,以及每ADS盈餘之調節表請參考本新聞稿後之附件。
線上法說會細節線上法說會細節線上法說會細節線上法說會細節 網路 www.himax.com.tw及電話收聽重播,將自線上法說會結束後兩小時開始,至台灣時間 2014年 2月 21日星期五下午 1點(美國東部標準時間 2月 20日午夜 12點) 結束,重播電話專線為+1-877-870-5176 (美國本土) 或+1-858-384-5517 (美國以外)。重播確認 ID 號碼為 13574978。至台灣時間 2015 年 2 月 13 日為止,線上法說會的網路線上收聽連結,可透過 ViaVid 網路廣播連結http://public.viavid.com/index.php?id=107617,或是 http://www.viavid.net收聽。
關於奇景光電關於奇景光電關於奇景光電關於奇景光電:::: 奇景光電股份有限公司(納斯達克代號:HIMX)為一個專注於影像顯示處理技術之 IC設計公司。本公司係全球顯示器驅動 IC與時序控制 IC領先廠商,產品應用於電視、筆記型電腦、桌上型電腦、手機、平板電腦、數位相機、汽車導航以及其他多種消費性電子產品。奇景光電的其他產品並包含觸控面板控制 IC、手持式與頭戴式矽控液晶光閥(LCOS)微型投影解決方案、LED驅動IC、電源管理 IC、監視器及投影機控制晶片、客製化影像處理晶片解決方案及提供矽智權的授權等。奇景光電亦提供數位相機解決方案,包括 CMOS影像感測 IC及晶圓級鏡頭,這些產品已被廣泛地應用在手機、平板電腦、筆記型電腦、電視、網路攝影機、汽車、保全及醫療器材等。奇景光電設立於 2001年,總部位於台灣台南,目前員工人數約 1,600人,分布於台南、新竹、台北、

本份文件若有中文說明異於英文原文之處,以英文原文為準。
*以 2013年第四季平均匯率 1US$=NT$29.442 換算,若有差異,是因美金尾數或四捨五入造成。
**以 2013年第三季平均匯率 1US$=NT$29.885換算,若有差異,是因美金尾數或四捨五入造成。
***以 2012年第四季平均匯率 1US$=NT$29.127 換算,若有差異,是因美金尾數或四捨五入造成。
****以 2013年全年平均匯率 1US$=NT$29.604 換算,若有差異,是因美金尾數或四捨五入造成。
*****以 2012年全年平均匯率 1US$=NT$29.562 換算,若有差異,是因美金尾數或四捨五入造成。
4/16
中國、韓國、日本與美國。至 2013年 12月 31日為止,奇景光電在全球已取得 2,207項專利,尚有 1,008項專利正在申請中,產品應用於全球各種消費性電子品牌產品,技術領先並維持影像顯示處理技術半導體解決方案領導廠商的地位。
聯絡人聯絡人聯絡人聯絡人:::: 黃華珮 / Jessica Huang 媒體關係 專案經理 奇景光電股份有限公司
Himax Technologies, Inc.
+886-3-516-3276 分機 38817
林佳慧 / Penny Lin 投資人關係 專案經理 奇景光電股份有限公司
Himax Technologies, Inc.
+886-2-2370-3999分機 22320
郭帝妮 / Stephanie Kuo
Investor Relations
Himax Technologies, Inc.
Tel: +1-949-585-9838 Ext.221
John Mattio
Investor Relations – US
Representative
Senior Vice President
MZ North America
Tel: +1-212-301-7130
[email protected] 風險說明風險說明風險說明風險說明: 本新聞稿的部分展望未來的陳述,特別是有關於財務、產業預測,可能會導致實際結果與本新聞稿的描述不同,可能造成差異的因素包括但不限於整體市場與經濟的狀況、半導體產業的狀況、市場對本公司驅動 IC產品及非驅動 IC產品之接受度、產品競爭力、市場競爭、終端市場需求、對少數主要客戶的依賴度、持續創新的技術、新面板技術發展、發展與維護智慧財產權的能力、價格壓力如平均售價下滑或客戶訂單模式改變、全年有效稅率預估的改變、面板其他關鍵零組件短缺、政策法規改變、匯率波動、子公司新投資案、對客戶應收帳款的回收與存貨的管理、維護及吸引人才,包括本公司為 2012年度所申報的 20-F文件中「風險因素」標題項下的該等風險。不論是否有其他新的訊息或事件,本公司皆無義務公開更新或修改此風險說明。

5/16
Himax Technologies, Inc.
Unaudited Condensed Consolidated Statements of Income
(These interim financials do not fully comply with US GAAP because they omit all interim disclosure required by US GAAP)
(Amounts in Thousands of U.S. Dollars, Except Per Share Data)
Three Months Ended December 31,
Three Months Ended
September 30,
2013 2012 2013
Revenues
Revenues from third parties, net $ 195,232 $ 129,973 $ 192,814
Revenues from related parties, net - 60,666 -
195,232 190,639 192,814 Costs and expenses:
Cost of revenues 146,205 146,216 144,092
Research and development 19,078 17,003 23,549
General and administrative 4,938 4,328 5,027
Sales and marketing 5,605 3,863 5,701
Total costs and expenses 175,826 171,410 178,369
Operating income 19,406 19,229 14,445
Non operating income (loss):
Interest income 153 74 104
Equity in income (losses) of equity method investees (32) (14) 101
Foreign exchange gains (losses), net 258 (233) (30)
Interest expense (129) (79) (110)
Other income (loss), net 347 (1,253) 17
597 (1,505) 82
Earnings before income taxes 20,003 17,724 14,527
Income tax expense 5,627 3,708 3,631
Net income 14,376 14,016 10,896
Net loss attributable to noncontrolling interests 1,448 751 1,374
Net income attributable to Himax stockholders $ 15,824 $ 14,767 $ 12,270
Basic earnings per ADS attributable to Himax stockholders $ 0.093 $ 0.087 $ 0.072
Diluted earnings per ADS attributable to Himax stockholders $ 0.092 $ 0.086 $ 0.072
Basic Weighted Average Outstanding ADS 170,920 170,057 169,980
Diluted Weighted Average Outstanding ADS 172,148 170,868 171,591

6/16
Himax Technologies, Inc.
Unaudited Condensed Consolidated Statements of Income
(Amounts in Thousands of U.S. Dollars, Except Per Share Data)
Twelve Months Ended December 31,
2013 2012 Revenues
Revenues from third parties, net $ 684,184 $ 485,281 Revenues from related parties, net 86,555 251,974
770,739 737,255
Costs and expenses:
Cost of revenues 578,886 566,700 Research and development 80,368 70,913 General and administrative 18,147 17,139 Sales and marketing 18,995 15,443
Total costs and expenses 696,396 670,195
Operating income 74,343 67,060
Non operating income (loss):
Interest income 527 317
Equity in losses of equity method investees (122) (128)
Foreign exchange gains (losses), net 643 (452)
Interest expense (401) (352)
Other income (loss), net 410 (559)
1,057 (1,174)
Earnings before income taxes 75,400 65,886 Income tax expense 19,476 15,748 Net income 55,924 50,138 Net loss attributable to noncontrolling interests 5,552 1,458 Net income attributable to Himax stockholders $ 61,476 $ 51,596
Basic earnings per ADS attributable to Himax stockholders $ 0.361 $ 0.303
Diluted earnings per ADS attributable to Himax stockholders $ 0.358 $ 0.302
Basic Weighted Average Outstanding ADS 170,211 170,528
Diluted Weighted Average Outstanding ADS 171,809 170,762

7/16
Himax Technologies, Inc.
Unaudited Supplemental Financial Information
(Amounts in Thousands of U.S. Dollars)
The amount of share-based compensation included in applicable statements of income categories is summarized as follows:
Three Months Ended December 31,
Three Months Ended
September 30,
2013 2012 2013
Share-based compensation
Cost of revenues $ 15 $ 15 $ 190
Research and development 234 316 5,854
General and administrative 50 58 1,145
Sales and marketing 57 73 1,222
Income tax benefit (84) (76) (1,872)
Total $ 272 $ 386 $ 6,539
The amount of acquisition-related charges included in applicable statements of income categories is summarized as follows:
Acquisition-related charges
Research and development $ 436 $ 559 $ 435
Sales and marketing 289 289 290
Income tax benefit (208) (289) (208)
Total $ 517 $ 559 $ 517

8/16
Himax Technologies, Inc.
Unaudited Supplemental Financial Information
(Amounts in Thousands of U.S. Dollars)
The amount of share-based compensation included in applicable statements of income categories is summarized as follows:
Twelve Months Ended December 31,
2013 2012
Share-based compensation
Cost of revenues $ 235 $ 176
Research and development 6,705 5,625
General and administrative 1,308 1,191
Sales and marketing 1,425 1,230
Income tax benefit (2,170) (1,367)
Total $ 7,503 $ 6,855
The amount of acquisition-related charges included in applicable statements of income categories is summarized as follows:
Acquisition-related charges
Research and development $ 1,746 $ 1,345
Sales and marketing 1,157 1,157
Income tax benefit (835) (664)
Total $ 2,068 $ 1,838

9/16
Himax Technologies, Inc. GAAP Unaudited Condensed Consolidated Balance Sheets
(Amounts in Thousands of U.S. Dollars, Except Per Share Data)
December 31,
2013
September 30,
2013 December 31,
2012 Assets Current assets:
Cash and cash equivalents $ 127,320 $ 133,090 $ 138,737 Restricted cash and cash equivalents 108,399 115,000 74,100 Investments in marketable securities available-for-
sale 788 789 172 Accounts receivable, less allowance for doubtful
accounts, sales returns and discounts 200,725 202,201 135,747 Accounts receivable from related parties, less
allowance for sales returns and discounts --- --- 73,258 Inventories 177,399 159,615 116,671 Deferred income taxes 9,974 11,142 15,374 Prepaid expenses and other current assets 15,052 14,428 13,029
Total current assets $ 639,657 $ 636,265 $ 567,088 Investment securities $ 21,877 $ 17,877 $ 12,688 Equity method investments 190 190 283
Property, plant and equipment, net 60,588 59,332 52,609 Deferred income taxes 2,135 4,479 4,303 Goodwill 28,138 28,138 28,138 Other intangible assets, net 5,234 5,960 8,143 Other assets 1,508 4,498 1,346 119,670 120,474 107,510 Total assets $ 759,327 $ 756,739 $ 674,598
Liabilities and Equity Current liabilities:
Short-term debts $ 105,500 $ 115,000 $ 73,000 Accounts payable 151,290 162,522 135,546 Income taxes payable 16,932 15,671 9,766 Other accrued expenses and other current liabilities 30,111 25,310 23,805
Total current liabilities $ 303,833 $ 318,503 $ 242,117
Other liabilities 3,279 2,846 4,323 Total liabilities $ 307,112 $ 321,349 $ 246,440 Redeemable noncontrolling interests $ 3,656 --- --- Equity Himax stockholders’ equity:
Ordinary shares, US$0.3 par value, 1,000,000,000 shares authorized; 356,699,482 shares issued and 341,049,418 shares, 341,049,418 shares, 339,149,508 shares outstanding at December 31, 2013, September 30, 2013, and December 31, 2012, respectively $ 107,010 $ 107,010 $ 107,010
Additional paid-in capital 106,636 105,312 104,911 Treasury shares, at cost, 15,650,064 shares,
15,650,064 shares and 17,549,974 shares at December 31, 2013, September 30, 2013, and December 31, 2012, respectively (11,120) (11,120) (12,469)
Accumulated other comprehensive loss (412) (69) (137) Unappropriated retained earnings 247,710 231,886 228,628
Himax stockholders’ equity $ 449,824 $ 433,019 $ 427,943 Noncontrolling interests (1,265) 2,371 215 Total equity $ 448,559 $ 435,390 $ 428,158 Total liabilities and equity $ 759,327 $ 756,739 $ 674,598

10/16
Himax Technologies, Inc.
Unaudited Condensed Consolidated Statements of Cash Flows (Amounts in Thousands of U.S. Dollars)
Three Months
Ended December 31,
Three Months Ended
September 30,
2013 2012 2013
Cash flows from operating activities: Net income $ 14,376 $ 14,016 $ 10,896 Adjustments to reconcile net income to net cash provided by (used in) operating activities: Depreciation and amortization 3,843 3,669 3,757 Share-based compensation expenses 356 458 578 Loss on disposal of property and equipment --- 6 1 Gain on disposal of equity method investment (54) --- --- Loss (gain) on disposal of marketable securities, net 13 (17) (4) Valuation gain on financial liabilities (160) --- --- Impairment loss on investment --- 1,299 --- Equity in losses (income) of equity method investees 32 14 (101) Deferred income tax expense 3,722 1,913 870 Inventories write downs 3,179 2,445 2,862
Changes in operating assets and liabilities: Accounts receivable 1,503 537 17,060 Accounts receivable from related parties --- 8,782 --- Inventories (20,964) 9,222 (19,554) Prepaid expenses and other current assets (587) 1,987 1,907 Accounts payable (11,232) 5,586 7,102 Income taxes payable 832 1,669 2,970 Other accrued expenses and other current liabilities 3,028 857 (861) Other liabilities 333 1 (49)
Net cash provided by (used in) operating activities (1,780) 52,444 27,434
Cash flows from investing activities: Purchase of property and equipment (3,925) (2,199) (3,752) Proceeds from disposal of property and equipment --- 1 --- Purchase of available-for-sale marketable securities (6,354) (4,485) (4,970) Disposal of available-for-sale marketable securities 6,344 5,290 4,361 Purchase of investment securities (4,000) --- --- Cash decrease resulting from change in consolidated
entity (4) --- --- Release (pledge)of restricted cash equivalents and
marketable securities 24 (2) 1,090 Increase in other assets (270) (535) (32)
Net cash used in investing activities (8,185) (1,930) (3,303)

11/16
Himax Technologies, Inc.
Unaudited Condensed Consolidated Statements of Cash Flows (Amounts in Thousands of U.S. Dollars)
Three Months
Ended December 31,
Three Months Ended
September 30,
2013 2012 2013
Cash flows from financing activities: Distribution of cash dividends --- --- (42,394) Proceeds from issuance of new shares by subsidiaries 5,071 --- 4,391 Payments to repurchase ordinary shares --- (664) --- Proceeds from disposal of subsidiary shares to noncontrolling interests by Himax Imaging, Inc. --- 25 (14)
Purchase of subsidiary shares from noncontrolling interests (896) (1) --- Release (pledge) of restricted cash equivalents (for borrowing of short-term debt) 9,500 --- (42,000)
Proceeds from borrowing of short-term debts 19,000 --- 115,000 Repayment of short-term debts (28,500) --- (73,000)
Net cash provided by (used in) financing activities 4,175 (640) (38,017) Effect of foreign currency exchange rate changes on
cash and cash equivalents 20 41 26 Net increase (decrease) in cash and cash equivalents (5,770) 49,915 (13,860) Cash and cash equivalents at beginning of period 133,090 88,822 146,950
Cash and cash equivalents at end of period $ 127,320 $ 138,737 $ 133,090
Supplemental disclosures of cash flow information:
Cash paid during the period for:
Interest expense $ 118 $ 79 $ 110
Income taxes $ 377 $ 96 $ 435

12/16
Himax Technologies, Inc.
Unaudited Condensed Consolidated Statements of Cash Flows (Amounts in Thousands of U.S. Dollars)
Twelve Months
Ended December 31, 2013 2012
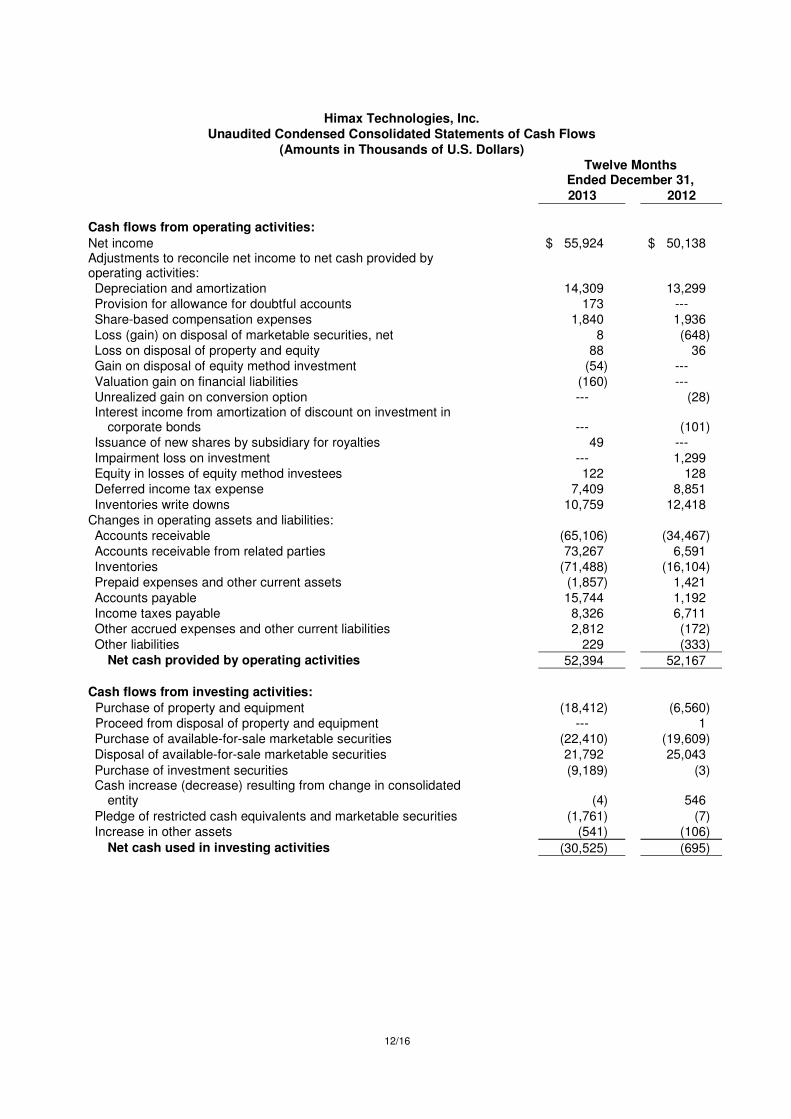
Cash flows from operating activities: Net income $ 55,924 $ 50,138 Adjustments to reconcile net income to net cash provided by operating activities: Depreciation and amortization 14,309 13,299 Provision for allowance for doubtful accounts 173 --- Share-based compensation expenses 1,840 1,936 Loss (gain) on disposal of marketable securities, net 8 (648) Loss on disposal of property and equity 88 36 Gain on disposal of equity method investment (54) --- Valuation gain on financial liabilities (160) --- Unrealized gain on conversion option --- (28) Interest income from amortization of discount on investment in
corporate bonds --- (101) Issuance of new shares by subsidiary for royalties 49 --- Impairment loss on investment --- 1,299 Equity in losses of equity method investees 122 128 Deferred income tax expense 7,409 8,851 Inventories write downs 10,759 12,418
Changes in operating assets and liabilities: Accounts receivable (65,106) (34,467) Accounts receivable from related parties 73,267 6,591 Inventories (71,488) (16,104) Prepaid expenses and other current assets (1,857) 1,421 Accounts payable 15,744 1,192 Income taxes payable 8,326 6,711 Other accrued expenses and other current liabilities 2,812 (172) Other liabilities 229 (333)
Net cash provided by operating activities 52,394 52,167
Cash flows from investing activities: Purchase of property and equipment (18,412) (6,560) Proceed from disposal of property and equipment --- 1 Purchase of available-for-sale marketable securities (22,410) (19,609) Disposal of available-for-sale marketable securities 21,792 25,043
Purchase of investment securities (9,189) (3) Cash increase (decrease) resulting from change in consolidated
entity (4) 546
Pledge of restricted cash equivalents and marketable securities (1,761) (7) Increase in other assets (541) (106)
Net cash used in investing activities (30,525) (695)

13/16
Himax Technologies, Inc. Unaudited Condensed Consolidated Statements of Cash Flows
(Amounts in Thousands of U.S. Dollars)
Twelve Months
Ended December 31,
2013 2012
Cash flows from financing activities: Distribution of cash dividends (42,394) (10,680) Proceeds from issuance of new shares by subsidiaries 9,852 116 Payments to repurchase ordinary shares --- (8,886) Proceeds from disposal of subsidiary shares to noncontrolling interests by Himax Technologies Limited --- 97
Proceeds from disposal of subsidiary shares to noncontrolling interests by Himax Imaging, Inc. 64 436
Purchase of subsidiary shares from noncontrolling interests (896) (14) Release (pledge) of restricted cash equivalents (for borrowing of short-term debt) (32,500) 11,200
Proceeds from borrowing of short-term debts 352,320 304,000 Repayment of short-term debts (319,820) (315,200)
Net cash used in financing activities (33,374) (18,931) Effect of foreign currency exchange rate changes on cash and
cash equivalents 88 32 Net increase (decrease) in cash and cash equivalents (11,417) 32,573 Cash and cash equivalents at beginning of period 138,737 106,164
Cash and cash equivalents at end of period $ 127,320 $ 138,737
Supplemental disclosures of cash flow information:
Cash paid during the period for:
Interest expense $ 390 $ 352
Income taxes $ 3,591 $ 456
Supplemental disclosures of non-cash investing activities: Fair value of ordinary shares issued by Himax Display, Inc. in the acquisition of Spatial Photonics, Inc. $ --- $ 270

14/16
Himax Technologies, Inc.
Non-GAAP Unaudited Supplemental Data – Reconciliation Schedule
(Amounts in Thousands of U.S. Dollars) Gross Margin, Operating Margin and Net Margin Excluding Share-based Compensation and Acquisition-Related Charges:
Three Months
Ended December 31,
Three Months Ended
September 30,
2013 2012 2013
Revenues $ 195,232 $ 190,639 $ 192,814 Gross profit 49,027 44,423 48,722
Add: Share-based compensation – Cost of revenues 15 15 190
Gross profit excluding share-based compensation 49,042 44,438 48,912
Gross margin excluding share-based compensation 25.1% 23.3% 25.4% Operating income 19,406 19,229 14,445
Add: Share-based compensation 356 462 8,411
Operating income excluding share-based compensation 19,762 19,691 22,856
Add: Acquisition-related charges –Intangible assets amortization 725 848 725
Operating income excluding share-based compensation and acquisition-related charges 20,487 20,539 23,581
Operating margin excluding share-based compensation and acquisition-related charges 10.5% 10.8% 12.2%
Net income attributable to Himax stockholders 15,824 14,767 12,270
Add: Share-based compensation, net of tax 272 386 6,539
Add: Acquisition-related charges, net of tax 517 559 517
Net income attributable to Himax stockholders excluding share-based compensation and acquisition-related charges 16,613 15,712 19,326
Net margin attributable to Himax stockholders excluding share-based compensation and acquisition-related charges 8.5% 8.2% 10.0%
*Gross margin excluding share-based compensation equals gross profit excluding share-based compensation divided by revenues
*Operating margin excluding share-based compensation and acquisition-related charges equals operating income excluding share-based compensation and acquisition-related charges divided by revenues
*Net margin attributable to Himax stockholders excluding share-based compensation and acquisition-related charges equals net income attributable to Himax stockholders excluding share-based compensation and acquisition-related charges divided by revenues

15/16
Himax Technologies, Inc.
Non-GAAP Unaudited Supplemental Data – Reconciliation Schedule
(Amounts in Thousands of U.S. Dollars) Gross Margin, Operating Margin and Net Margin Excluding Share-based Compensation and Acquisition-Related Charges:
Twelve Months
Ended December 31,
2013 2012
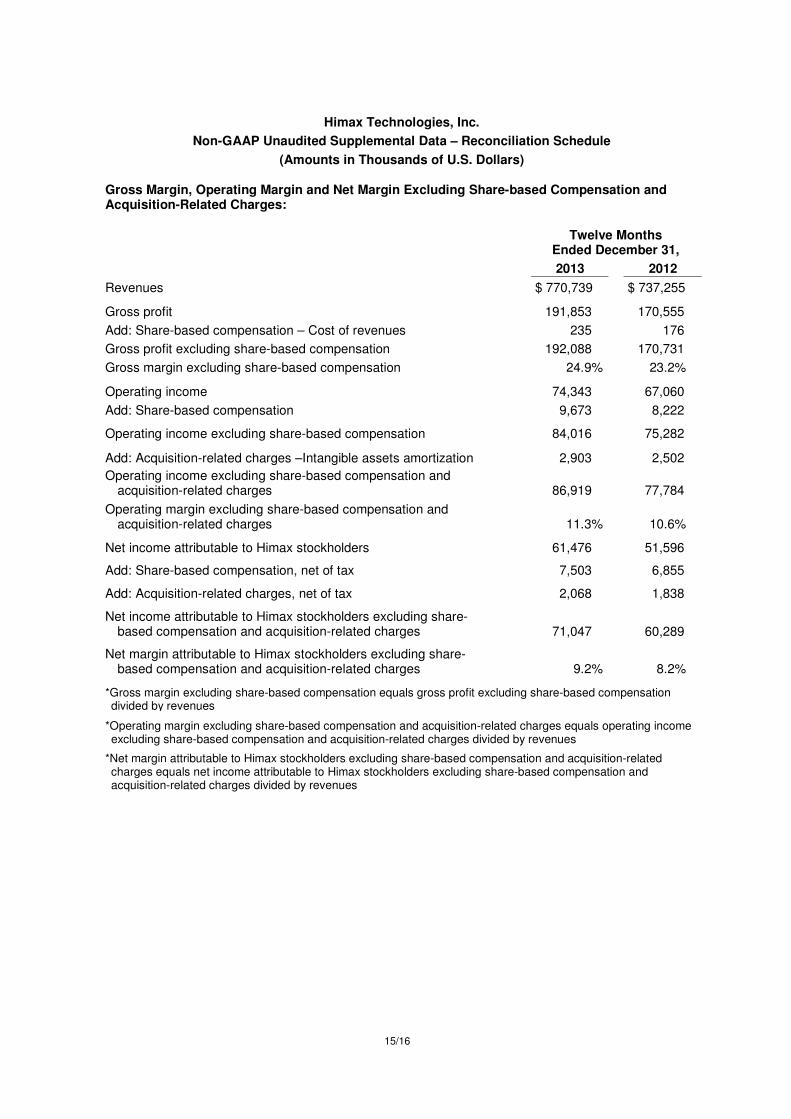
Revenues $ 770,739 $ 737,255 Gross profit 191,853 170,555
Add: Share-based compensation – Cost of revenues 235 176
Gross profit excluding share-based compensation 192,088 170,731
Gross margin excluding share-based compensation 24.9% 23.2% Operating income 74,343 67,060
Add: Share-based compensation 9,673 8,222
Operating income excluding share-based compensation 84,016 75,282
Add: Acquisition-related charges –Intangible assets amortization 2,903 2,502
Operating income excluding share-based compensation and acquisition-related charges 86,919 77,784
Operating margin excluding share-based compensation and acquisition-related charges 11.3% 10.6%
Net income attributable to Himax stockholders 61,476 51,596
Add: Share-based compensation, net of tax 7,503 6,855
Add: Acquisition-related charges, net of tax 2,068 1,838
Net income attributable to Himax stockholders excluding share-based compensation and acquisition-related charges 71,047 60,289
Net margin attributable to Himax stockholders excluding share-based compensation and acquisition-related charges 9.2% 8.2%
*Gross margin excluding share-based compensation equals gross profit excluding share-based compensation divided by revenues
*Operating margin excluding share-based compensation and acquisition-related charges equals operating income excluding share-based compensation and acquisition-related charges divided by revenues
*Net margin attributable to Himax stockholders excluding share-based compensation and acquisition-related charges equals net income attributable to Himax stockholders excluding share-based compensation and acquisition-related charges divided by revenues

16/16
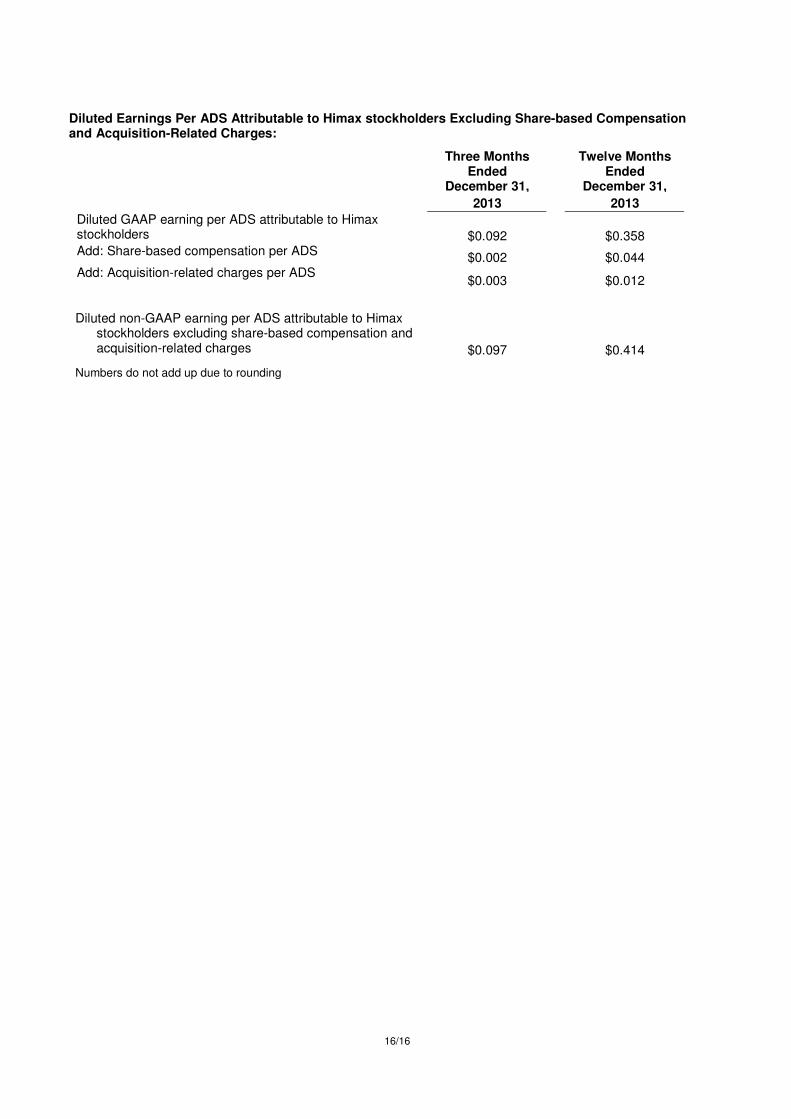
Diluted Earnings Per ADS Attributable to Himax stockholders Excluding Share-based Compensation and Acquisition-Related Charges:
Three Months Ended
December 31,
Twelve Months Ended
December 31, 2013 2013
Diluted GAAP earning per ADS attributable to Himax stockholders $0.092 $0.358 Add: Share-based compensation per ADS
$0.002 $0.044 Add: Acquisition-related charges per ADS
$0.003 $0.012
Diluted non-GAAP earning per ADS attributable to Himax
stockholders excluding share-based compensation and acquisition-related charges $0.097 $0.414
Numbers do not add up due to rounding

本份文件若有中文說明異於英文原文之處,以英文原文為準。
*以 2013年第四季平均匯率 1US$=NT$29.442 換算,若有差異,是因美金尾數或四捨五入造成。
**以 2013年第三季平均匯率 1US$=NT$29.885換算,若有差異,是因美金尾數或四捨五入造成。
***以 2012年第四季平均匯率 1US$=NT$29.127 換算,若有差異,是因美金尾數或四捨五入造成。
****以 2013年全年平均匯率 1US$=NT$29.604 換算,若有差異,是因美金尾數或四捨五入造成。
*****以 2012年全年平均匯率 1US$=NT$29.562 換算,若有差異,是因美金尾數或四捨五入造成。
1/16
奇景光電公佈自結奇景光電公佈自結奇景光電公佈自結奇景光電公佈自結 2013 年第年第年第年第四四四四季季季季、、、、全年全年全年全年合併財務報表合併財務報表合併財務報表合併財務報表 及及及及 2014 年年年年第第第第一一一一季展望季展望季展望季展望 2013年第四季營收超過法說預估 每 ADS盈餘達預估高標 毛利率符合預估
2014年第一季預估營收持平或小跌 毛利率小跌
� 2013年第年第年第年第四四四四季季季季,,,,營收淨額為營收淨額為營收淨額為營收淨額為 1億億億億 9,520萬美元萬美元萬美元萬美元,,,,較前一季成長較前一季成長較前一季成長較前一季成長 1.3%,,,,超過法說預估超過法說預估超過法說預估超過法說預估
� 2013 年第年第年第年第四四四四季季季季,,,,中小尺寸驅動中小尺寸驅動中小尺寸驅動中小尺寸驅動 IC 營收營收營收營收,,,,較去年同期較去年同期較去年同期較去年同期成長成長成長成長 32.3%,,,,占營收比例達占營收比例達占營收比例達占營收比例達 57.9%,,,,連續四連續四連續四連續四季季季季突破五成突破五成突破五成突破五成,,,,總金額與占營收總金額與占營收總金額與占營收總金額與占營收比例比例比例比例皆皆皆皆創歷史新高創歷史新高創歷史新高創歷史新高
� 2013 年第年第年第年第四四四四季季季季,,,,非驅動非驅動非驅動非驅動 IC 產品營收淨額產品營收淨額產品營收淨額產品營收淨額,,,,較去年同期增加較去年同期增加較去年同期增加較去年同期增加 28.1%,,,,占營收比占營收比占營收比占營收比例例例例 18.1%,,,,總金額與總金額與總金額與總金額與占營收占營收占營收占營收比例連續三比例連續三比例連續三比例連續三季季季季創歷史新高創歷史新高創歷史新高創歷史新高
� 2013年第年第年第年第四四四四季毛利率為季毛利率為季毛利率為季毛利率為 25.1%,,,,符合符合符合符合預估預估預估預估,,,,較去年同期較去年同期較去年同期較去年同期 23.3%增加增加增加增加 1.8個百分點個百分點個百分點個百分點,,,,較前一季較前一季較前一季較前一季 25.3%微幅減少微幅減少微幅減少微幅減少 0.2個百分點個百分點個百分點個百分點
� 2013年第年第年第年第四四四四季稅後淨利為季稅後淨利為季稅後淨利為季稅後淨利為 1,580萬美元萬美元萬美元萬美元,,,,較去年同期較去年同期較去年同期較去年同期 1,480萬美元萬美元萬美元萬美元增加增加增加增加 7.2%;;;;每每每每 ADS盈餘為盈餘為盈餘為盈餘為 9.2美分美分美分美分(約新台幣約新台幣約新台幣約新台幣 2.71元元元元),,,,較去年同期較去年同期較去年同期較去年同期 8.6美分美分美分美分(約新台幣約新台幣約新台幣約新台幣 2.50元元元元)增加增加增加增加 6.4%
� 2013年全年稅後淨利為年全年稅後淨利為年全年稅後淨利為年全年稅後淨利為 6,150萬美元萬美元萬美元萬美元,,,,較較較較 2012年年年年 5,160萬美元成長萬美元成長萬美元成長萬美元成長 19.1%;;;;2013年每年每年每年每 ADS盈餘盈餘盈餘盈餘為為為為 35.8美分美分美分美分(約新台幣約新台幣約新台幣約新台幣 10.60元元元元),,,,較較較較 2012年年年年 30.2美分美分美分美分(約新台幣約新台幣約新台幣約新台幣 8.93元元元元)成長成長成長成長 18.4%
� 預估預估預估預估 2014 年第年第年第年第一一一一季季季季,,,,營收較營收較營收較營收較 2013 年年年年第第第第四四四四季季季季持平或小跌持平或小跌持平或小跌持平或小跌,,,,毛利率毛利率毛利率毛利率小跌小跌小跌小跌,,,,每每每每 ADS 盈餘為盈餘為盈餘為盈餘為 8.0 至至至至 9.5美分美分美分美分(約新台幣約新台幣約新台幣約新台幣 2.36至至至至 2.80元元元元)之間之間之間之間
[台南,2014年 2月 13日] 奇景光電 (納斯達克代號: HIMX) 今日公佈自結 2013年第四季與全年合併財務報表,及 2014 年第一季的展望。奇景光電 2013 年第四季營收淨額超過法說預估,每 ADS 盈餘達預估高標,毛利率則符合預估。
奇景光電 2013年第四季營收淨額為 1億 9,520萬美元(約新台幣 57億 4,800萬元*),較去年同期 1億 9,060萬美元 (約新台幣 55億 5,300萬元***)成長 2.4%,較第三季 1億 9,280萬美元(約新台幣 57億 6,200萬元**)增加1.3%。第四季毛利率為 25.1%,較去年同期 23.3%上升 1.8 個百分點,較第三季 25.3%微幅減少 0.2 個百分點,為過去毛利率連續八季成長後首次下降。
2013年第四季稅後淨利為 1,580萬美元 (約新台幣 4億 6,600萬元*),去年同期為 1,480萬美元 (約新台幣 4億3,000萬元***),第三季為 1,230萬美元(約新台幣 3億 6,700萬元**)。2013年第四季每 ADS盈餘為 9.2美分(約新台幣 2.71元*),去年同期為 8.6美分(約新台幣 2.50元***),第三季為 7.2美分(約新台幣 2.15元**)。
奇景表示,2013 年第四季營收淨額超過法說原本持平至小跌的預估,主要是中國大陸、韓國智慧型手機及平板電腦客戶驅動 IC 產品,以及非驅動 IC 產品等需求,最後較預期為佳。毛利率出現八季連續成長後首次下降,主要原因是產品組合變動影響。然而,第四季毛利率較去年同期仍大幅成長 1.8個百分點。
2013年第四季的大尺寸驅動 IC產品,營收淨額為 4,680萬美元(約新台幣 13億 7,800萬元*),較去年同期大幅減少 39.7%,較 2013年第三季下降 18.9%,占 2013年第四季營收比例為 24.0%,去年同期此比例為 40.7%,2013 年第三季為 29.9%。由於電視、筆記型電腦及監視器全球市場持續疲軟,以及來自群創訂單減少,因此第四季大尺寸驅動 IC產品營收衰退。但奇景對其他大尺寸客戶營收則呈現成長。
2013年第四季中小尺寸驅動 IC產品,營收淨額為 1億 1,300萬美元(約新台幣 33億 2,700萬元*),較去年同期大幅成長 32.3%,較 2013 年第三季成長 12.4%,占營收比例 57.9%,去年同期此比例為 44.8%,上一季為52.1%,連續四季突破五成,總金額與占營收比例皆創歷史新高。
2013年第四季非驅動 IC產品中,以時序控制 IC (TCON,Timing Controller)、觸控 IC、CMOS影像感測器、電源管理 IC、客製化 IC 及 LCOS 微投影解決方案等產品表現最好。營收淨額為 3,540 萬美元(約新台幣 10 億
本份文件若有中文說明異於英文原文之處,以英文原文為準。
*以 2013年第四季平均匯率 1US$=NT$29.442 換算,若有差異,是因美金尾數或四捨五入造成。
**以 2013年第三季平均匯率 1US$=NT$29.885換算,若有差異,是因美金尾數或四捨五入造成。
***以 2012年第四季平均匯率 1US$=NT$29.127 換算,若有差異,是因美金尾數或四捨五入造成。
****以 2013年全年平均匯率 1US$=NT$29.604 換算,若有差異,是因美金尾數或四捨五入造成。
*****以 2012年全年平均匯率 1US$=NT$29.562 換算,若有差異,是因美金尾數或四捨五入造成。
2/16
4,200 萬元*),較去年同期大幅成長 28.1%,較前一季成長 2.4%,占營收比例 18.1%,絕對金額與營收比重連續三季皆創新高,去年同期此比例為 14.5%,前一季為 18.0%。
2013年全年營收淨額為 7億 7,070萬美元(約新台幣 228億 1,700萬元****),較 2012年 7億 3,730萬美元 (約新台幣 217億 9,500萬元*****)成長 4.5%。2013年全年毛利率為 24.9%,較 2012年的 23.1%上升 1.8個百分點。主要是奇景多方面發展高毛利率產品組合及客戶多元化的成果。奇景重申,持續改善毛利率,仍是未來經營管理的努力目標。
2013年稅後淨利為 6,150萬美元 (約新台幣 18億 2,000萬元****),較 2012年 5,160萬美元 (約新台幣 15億2,500萬元*****)成長 19.1%。2013年每 ADS盈餘為 35.8美分(約新台幣 10.60元****),較 2012年 30.2美分(約新台幣 8.93元*****)成長 18.4%。
繼 2012年成功轉型後,奇景在 2013年展現經營及財務上的好成績。中小尺寸驅動 IC產品強勁成長,成為奇景2013 年最大的營收來源。奇景在中小尺寸技術上擁有領先優勢,隨著智慧型手機及平板電腦出貨量持續增加,並往高解析度產業趨勢發展,使奇景具有市場利基。在大尺寸驅動 IC 產品方面,奇景持續擴大客戶群,涵蓋全球主要面板客戶。而在非驅動 IC 產品方面,奇景也維持強勁成長動能,並取得令人振奮的進展,與全球知名一線客戶共同合作開發新產品,並成功取得許多新案。
2013年中小尺寸驅動 IC產品,較 2012年營收增加 26.4%,占營收比例 53.9%。若不計入功能型手機,中小尺寸驅動 IC 產品,較 2012 年營收大幅增加 38.6%。此優異表現,主要是奇景成功導入在台灣、韓國、中國大陸、以及日本的許多中小尺寸產品客戶,同時產品線完整涵蓋主流及高階市場,已將客戶擴展至中國品牌智慧型手機大廠,與一線國際品牌市場。奇景預期在 2014 年,中小尺寸驅動 IC 產品的智慧型手機、平板電腦與車用顯示器,將持續成長。不過,智慧型手機市場的驚人成長,自然引起驅動 IC 產業的激烈價格競爭,特別是在低階產品方面。儘管如此,隨著中小尺寸產品往高解析度的產業趨勢發展,將提升驅動 IC 技術複雜性,進入門檻亦較過去提高,奇景領先地位將更具競爭力,這亦是奇景在去年能改善毛利率的主要原因。
2014 年第一季,奇景在中國智慧型手機營收將會下降,主因是中國傳統淡季工作天數較少。但奇景預期 2014年,中小尺寸驅動 IC產品,智慧型手機及平板電腦仍會持續成長。奇景並預見在 2014年,隨著 4G LTE 在中國等許多國家,被採用並擴散普及後,將加速智慧型手機應用產品銷售量成長。奇景在智慧型手機市場,具技術領先優勢,擁有高度競爭力產品及穩固客戶群,包括一線國際品牌客戶、中國大陸面板廠以及成長快速的白牌手機終端品牌客戶。在 2014年,中小尺寸產品往高解析度的產業趨勢發展,奇景將持續獲得較佳產品平均單價及毛利率。不過,低階智慧型手機市場價格競爭激烈,侵蝕利潤,奇景將採取降低成本措施因應,並推出更具競爭力的高階產品,以持續維持毛利率。
2013 年的中小尺寸驅動 IC 產品應用中,奇景的平板電腦與車用顯示器皆強勁成長,並同時在產業中取得領先地位,這主要歸功於穩固的客戶基礎。在平板電腦方面,客戶涵蓋中國白牌市場及國際品牌大廠。在車用顯示器市場奇景深耕多年,擁有獨特技術能力與高信賴標準,在市場占有穩固領先地位,在 2013年營收呈現倍數成長。奇景預期平板電腦與車用顯示器,長期將對奇景營收產生顯著貢獻。
隨著智慧型手機與平板電腦兩種產品界線愈來愈模糊,奇景可運用在這兩個領域的領先優勢,同時提供客戶兩樣產品最全面、最理想的解決方案。
2013年大尺寸驅動 IC產品,較 2012年營收減少 25.0%,占營收比例 29.7%,2012年此比例為 41.4%。大尺寸較 2012年營收金額顯著衰退,主要原因是受到全球電視、筆記型電腦及監視器市場需求疲弱影響,以及對群創營收下降,而其中主要為大尺寸產品。儘管如此,奇景在非群創客戶的大尺寸營收較去年同期成長 14.5%,充分展現奇景競爭力。
大尺寸驅動 IC 產品仍是奇景長期耕耘的重點之一,在中國大尺寸市場仍是領先者。奇景並預期在 2014 年,幾個非中國面板客戶,將會對大尺寸營收產生顯著的貢獻。在技術上,奇景一直是市場領導者,提供最尖端技

本份文件若有中文說明異於英文原文之處,以英文原文為準。
*以 2013年第四季平均匯率 1US$=NT$29.442 換算,若有差異,是因美金尾數或四捨五入造成。
**以 2013年第三季平均匯率 1US$=NT$29.885換算,若有差異,是因美金尾數或四捨五入造成。
***以 2012年第四季平均匯率 1US$=NT$29.127 換算,若有差異,是因美金尾數或四捨五入造成。
****以 2013年全年平均匯率 1US$=NT$29.604 換算,若有差異,是因美金尾數或四捨五入造成。
*****以 2012年全年平均匯率 1US$=NT$29.562 換算,若有差異,是因美金尾數或四捨五入造成。
3/16
術。對快速發展的 4K 電視,奇景正在引領市場發展,提供 4K 電視常見散熱問題的解決方案。奇景一直是 4K電視技術領導者,而今年大尺寸主要成長動能將來自 4K 電視。在 2014 年第一季,奇景預期藉由既有及新客戶,帶動大尺寸營收成長,這是奇景長期努力展現的成果。在 2014 年,奇景有信心,大尺寸驅動 IC 產品營收將會恢復成長。
2013年非驅動 IC產品,較 2012年營收大幅增加 22.4%,占營收比例 16.4%,2012年此比例為 14.0%。奇景擁有技術領先的非驅動 IC產品,是公司最佳的長期成長動能,也是奇景與其他競爭者的最大差異之一。
在 2013年,奇景的 CMOS影像感測器營收顯著成長,並將繼續成為 2014年非驅動 IC快速成長的產品項目。在 2013年,奇景將自己定位為高階影像感測器供應商,並在第四季推出第一個八百萬畫素高階新產品。目前,奇景 CMOS 影像感測器產品,具備入門級 qVGA 及 VGA,及高階八百萬畫素等產品,供應智慧型手機、平板電腦、網路攝影機、安防監控與汽車領域等客戶。2014 年第一季,奇景預期 CMOS 影像感測器營收將繼續成長,惟低階產品庫存水位過高,將對此產品線毛利率產生負面影響。奇景有信心,在解決低階產品庫存水位過高問題,並增加高毛利率新產品出貨後,將可改善產品組合,進而提升毛利率。
奇景的觸控 IC 產品業務,已涵蓋手機及平板電腦市場,隨著成功導入中國大陸及國際客戶,奇景預期,在2014年觸控 IC產品將有強勁成長。奇景亦持續研發新技術,包括下一代 on-cell 及 in-cell觸控感應器。奇景在2014年獲得多件觸控 IC新開發案,相信觸控 IC產品將可長期成長。
至於 LCOS微投影業務,在 2013年第四季,奇景推出新一代技術,並獲得頂級客戶認可,繼續擴大與競爭者的技術領先差距。此新一代技術,能提高產品性能,大大簡化客戶端產品製程。此頭戴式顯示器新應用,具有相當大的市場潛力與商機,奇景對此感到振奮。奇景正與數家客戶,包括一線品牌大廠,合作多項開發案,並收取開發費用,提供客製化新設計。奇景亦繼續小批量出貨給客戶進行試產。奇景預期在 2014年,LCOS微投影產品營收將顯著成長。奇景相信, LCOS微投影解決方案,將是公司長期最重要的成長動能之一。
奇景一向重視新技術研發,繼 2013年研發費用較前年成長 13.3%後,奇景計畫在 2014年繼續提高研發費用支出,以因應未來新業務成長需要。
奇景光電預估,2014 年第一季營收較 2013年第四季持平或小跌,毛利率小跌,每 ADS盈餘為 8.0至 9.5美分(約新台幣 2.36*至 2.80*元)之間。
截至 2013年 12月 31日止,奇景期末流通在外股數為約當 1億 7,050萬單位 ADS。與第三季底維持不變。
本季依美國會計準則,(不含股票酬勞費用及購併相關費用)毛利率、營業利益率及淨利率之調節表,以及每ADS盈餘之調節表請參考本新聞稿後之附件。
線上法說會細節線上法說會細節線上法說會細節線上法說會細節 網路 www.himax.com.tw及電話收聽重播,將自線上法說會結束後兩小時開始,至台灣時間 2014年 2月 21日星期五下午 1點(美國東部標準時間 2月 20日午夜 12點) 結束,重播電話專線為+1-877-870-5176 (美國本土) 或+1-858-384-5517 (美國以外)。重播確認 ID 號碼為 13574978。至台灣時間 2015 年 2 月 13 日為止,線上法說會的網路線上收聽連結,可透過 ViaVid 網路廣播連結http://public.viavid.com/index.php?id=107617,或是 http://www.viavid.net收聽。
關於奇景光電關於奇景光電關於奇景光電關於奇景光電:::: 奇景光電股份有限公司(納斯達克代號:HIMX)為一個專注於影像顯示處理技術之 IC設計公司。本公司係全球顯示器驅動 IC與時序控制 IC領先廠商,產品應用於電視、筆記型電腦、桌上型電腦、手機、平板電腦、數位相機、汽車導航以及其他多種消費性電子產品。奇景光電的其他產品並包含觸控面板控制 IC、手持式與頭戴式矽控液晶光閥(LCOS)微型投影解決方案、LED驅動IC、電源管理 IC、監視器及投影機控制晶片、客製化影像處理晶片解決方案及提供矽智權的授權等。奇景光電亦提供數位相機解決方案,包括 CMOS影像感測 IC及晶圓級鏡頭,這些產品已被廣泛地應用在手機、平板電腦、筆記型電腦、電視、網路攝影機、汽車、保全及醫療器材等。奇景光電設立於 2001年,總部位於台灣台南,目前員工人數約 1,600人,分布於台南、新竹、台北、

本份文件若有中文說明異於英文原文之處,以英文原文為準。
*以 2013年第四季平均匯率 1US$=NT$29.442 換算,若有差異,是因美金尾數或四捨五入造成。
**以 2013年第三季平均匯率 1US$=NT$29.885換算,若有差異,是因美金尾數或四捨五入造成。
***以 2012年第四季平均匯率 1US$=NT$29.127 換算,若有差異,是因美金尾數或四捨五入造成。
****以 2013年全年平均匯率 1US$=NT$29.604 換算,若有差異,是因美金尾數或四捨五入造成。
*****以 2012年全年平均匯率 1US$=NT$29.562 換算,若有差異,是因美金尾數或四捨五入造成。
4/16
中國、韓國、日本與美國。至 2013年 12月 31日為止,奇景光電在全球已取得 2,207項專利,尚有 1,008項專利正在申請中,產品應用於全球各種消費性電子品牌產品,技術領先並維持影像顯示處理技術半導體解決方案領導廠商的地位。
聯絡人聯絡人聯絡人聯絡人:::: 黃華珮 / Jessica Huang 媒體關係 專案經理 奇景光電股份有限公司
Himax Technologies, Inc.
+886-3-516-3276 分機 38817
林佳慧 / Penny Lin 投資人關係 專案經理 奇景光電股份有限公司
Himax Technologies, Inc.
+886-2-2370-3999分機 22320
郭帝妮 / Stephanie Kuo
Investor Relations
Himax Technologies, Inc.
Tel: +1-949-585-9838 Ext.221
John Mattio
Investor Relations – US
Representative
Senior Vice President
MZ North America
Tel: +1-212-301-7130
[email protected] 風險說明風險說明風險說明風險說明: 本新聞稿的部分展望未來的陳述,特別是有關於財務、產業預測,可能會導致實際結果與本新聞稿的描述不同,可能造成差異的因素包括但不限於整體市場與經濟的狀況、半導體產業的狀況、市場對本公司驅動 IC產品及非驅動 IC產品之接受度、產品競爭力、市場競爭、終端市場需求、對少數主要客戶的依賴度、持續創新的技術、新面板技術發展、發展與維護智慧財產權的能力、價格壓力如平均售價下滑或客戶訂單模式改變、全年有效稅率預估的改變、面板其他關鍵零組件短缺、政策法規改變、匯率波動、子公司新投資案、對客戶應收帳款的回收與存貨的管理、維護及吸引人才,包括本公司為 2012年度所申報的 20-F文件中「風險因素」標題項下的該等風險。不論是否有其他新的訊息或事件,本公司皆無義務公開更新或修改此風險說明。
5/16
Himax Technologies, Inc.
Unaudited Condensed Consolidated Statements of Income
(These interim financials do not fully comply with US GAAP because they omit all interim disclosure required by US GAAP)
(Amounts in Thousands of U.S. Dollars, Except Per Share Data)
Three Months Ended December 31,
Three Months Ended
September 30,
2013 2012 2013
Revenues
Revenues from third parties, net $ 195,232 $ 129,973 $ 192,814
Revenues from related parties, net - 60,666 -
195,232 190,639 192,814 Costs and expenses:
Cost of revenues 146,205 146,216 144,092
Research and development 19,078 17,003 23,549
General and administrative 4,938 4,328 5,027
Sales and marketing 5,605 3,863 5,701
Total costs and expenses 175,826 171,410 178,369
Operating income 19,406 19,229 14,445
Non operating income (loss):
Interest income 153 74 104
Equity in income (losses) of equity method investees (32) (14) 101
Foreign exchange gains (losses), net 258 (233) (30)
Interest expense (129) (79) (110)
Other income (loss), net 347 (1,253) 17
597 (1,505) 82
Earnings before income taxes 20,003 17,724 14,527
Income tax expense 5,627 3,708 3,631
Net income 14,376 14,016 10,896
Net loss attributable to noncontrolling interests 1,448 751 1,374
Net income attributable to Himax stockholders $ 15,824 $ 14,767 $ 12,270
Basic earnings per ADS attributable to Himax stockholders $ 0.093 $ 0.087 $ 0.072
Diluted earnings per ADS attributable to Himax stockholders $ 0.092 $ 0.086 $ 0.072
Basic Weighted Average Outstanding ADS 170,920 170,057 169,980
Diluted Weighted Average Outstanding ADS 172,148 170,868 171,591

6/16
Himax Technologies, Inc.
Unaudited Condensed Consolidated Statements of Income
(Amounts in Thousands of U.S. Dollars, Except Per Share Data)
Twelve Months Ended December 31,
2013 2012 Revenues
Revenues from third parties, net $ 684,184 $ 485,281 Revenues from related parties, net 86,555 251,974
770,739 737,255
Costs and expenses:
Cost of revenues 578,886 566,700 Research and development 80,368 70,913 General and administrative 18,147 17,139 Sales and marketing 18,995 15,443
Total costs and expenses 696,396 670,195
Operating income 74,343 67,060
Non operating income (loss):
Interest income 527 317
Equity in losses of equity method investees (122) (128)
Foreign exchange gains (losses), net 643 (452)
Interest expense (401) (352)
Other income (loss), net 410 (559)
1,057 (1,174)
Earnings before income taxes 75,400 65,886 Income tax expense 19,476 15,748 Net income 55,924 50,138 Net loss attributable to noncontrolling interests 5,552 1,458 Net income attributable to Himax stockholders $ 61,476 $ 51,596
Basic earnings per ADS attributable to Himax stockholders $ 0.361 $ 0.303
Diluted earnings per ADS attributable to Himax stockholders $ 0.358 $ 0.302
Basic Weighted Average Outstanding ADS 170,211 170,528
Diluted Weighted Average Outstanding ADS 171,809 170,762

7/16
Himax Technologies, Inc.
Unaudited Supplemental Financial Information
(Amounts in Thousands of U.S. Dollars)
The amount of share-based compensation included in applicable statements of income categories is summarized as follows:
Three Months Ended December 31,
Three Months Ended
September 30,
2013 2012 2013
Share-based compensation
Cost of revenues $ 15 $ 15 $ 190
Research and development 234 316 5,854
General and administrative 50 58 1,145
Sales and marketing 57 73 1,222
Income tax benefit (84) (76) (1,872)
Total $ 272 $ 386 $ 6,539
The amount of acquisition-related charges included in applicable statements of income categories is summarized as follows:
Acquisition-related charges
Research and development $ 436 $ 559 $ 435
Sales and marketing 289 289 290
Income tax benefit (208) (289) (208)
Total $ 517 $ 559 $ 517

8/16
Himax Technologies, Inc.
Unaudited Supplemental Financial Information
(Amounts in Thousands of U.S. Dollars)
The amount of share-based compensation included in applicable statements of income categories is summarized as follows:
Twelve Months Ended December 31,
2013 2012
Share-based compensation
Cost of revenues $ 235 $ 176
Research and development 6,705 5,625
General and administrative 1,308 1,191
Sales and marketing 1,425 1,230
Income tax benefit (2,170) (1,367)
Total $ 7,503 $ 6,855
The amount of acquisition-related charges included in applicable statements of income categories is summarized as follows:
Acquisition-related charges
Research and development $ 1,746 $ 1,345
Sales and marketing 1,157 1,157
Income tax benefit (835) (664)
Total $ 2,068 $ 1,838

9/16
Himax Technologies, Inc. GAAP Unaudited Condensed Consolidated Balance Sheets
(Amounts in Thousands of U.S. Dollars, Except Per Share Data)
December 31,
2013
September 30,
2013 December 31,
2012 Assets Current assets:
Cash and cash equivalents $ 127,320 $ 133,090 $ 138,737 Restricted cash and cash equivalents 108,399 115,000 74,100 Investments in marketable securities available-for-
sale 788 789 172 Accounts receivable, less allowance for doubtful
accounts, sales returns and discounts 200,725 202,201 135,747 Accounts receivable from related parties, less
allowance for sales returns and discounts --- --- 73,258 Inventories 177,399 159,615 116,671 Deferred income taxes 9,974 11,142 15,374 Prepaid expenses and other current assets 15,052 14,428 13,029
Total current assets $ 639,657 $ 636,265 $ 567,088 Investment securities $ 21,877 $ 17,877 $ 12,688 Equity method investments 190 190 283
Property, plant and equipment, net 60,588 59,332 52,609 Deferred income taxes 2,135 4,479 4,303 Goodwill 28,138 28,138 28,138 Other intangible assets, net 5,234 5,960 8,143 Other assets 1,508 4,498 1,346 119,670 120,474 107,510 Total assets $ 759,327 $ 756,739 $ 674,598
Liabilities and Equity Current liabilities:
Short-term debts $ 105,500 $ 115,000 $ 73,000 Accounts payable 151,290 162,522 135,546 Income taxes payable 16,932 15,671 9,766 Other accrued expenses and other current liabilities 30,111 25,310 23,805
Total current liabilities $ 303,833 $ 318,503 $ 242,117
Other liabilities 3,279 2,846 4,323 Total liabilities $ 307,112 $ 321,349 $ 246,440 Redeemable noncontrolling interests $ 3,656 --- --- Equity Himax stockholders’ equity:
Ordinary shares, US$0.3 par value, 1,000,000,000 shares authorized; 356,699,482 shares issued and 341,049,418 shares, 341,049,418 shares, 339,149,508 shares outstanding at December 31, 2013, September 30, 2013, and December 31, 2012, respectively $ 107,010 $ 107,010 $ 107,010
Additional paid-in capital 106,636 105,312 104,911 Treasury shares, at cost, 15,650,064 shares,
15,650,064 shares and 17,549,974 shares at December 31, 2013, September 30, 2013, and December 31, 2012, respectively (11,120) (11,120) (12,469)
Accumulated other comprehensive loss (412) (69) (137) Unappropriated retained earnings 247,710 231,886 228,628
Himax stockholders’ equity $ 449,824 $ 433,019 $ 427,943 Noncontrolling interests (1,265) 2,371 215 Total equity $ 448,559 $ 435,390 $ 428,158 Total liabilities and equity $ 759,327 $ 756,739 $ 674,598
10/16
Himax Technologies, Inc.
Unaudited Condensed Consolidated Statements of Cash Flows (Amounts in Thousands of U.S. Dollars)
Three Months
Ended December 31,
Three Months Ended
September 30,
2013 2012 2013
Cash flows from operating activities: Net income $ 14,376 $ 14,016 $ 10,896 Adjustments to reconcile net income to net cash provided by (used in) operating activities: Depreciation and amortization 3,843 3,669 3,757 Share-based compensation expenses 356 458 578 Loss on disposal of property and equipment --- 6 1 Gain on disposal of equity method investment (54) --- --- Loss (gain) on disposal of marketable securities, net 13 (17) (4) Valuation gain on financial liabilities (160) --- --- Impairment loss on investment --- 1,299 --- Equity in losses (income) of equity method investees 32 14 (101) Deferred income tax expense 3,722 1,913 870 Inventories write downs 3,179 2,445 2,862
Changes in operating assets and liabilities: Accounts receivable 1,503 537 17,060 Accounts receivable from related parties --- 8,782 --- Inventories (20,964) 9,222 (19,554) Prepaid expenses and other current assets (587) 1,987 1,907 Accounts payable (11,232) 5,586 7,102 Income taxes payable 832 1,669 2,970 Other accrued expenses and other current liabilities 3,028 857 (861) Other liabilities 333 1 (49)
Net cash provided by (used in) operating activities (1,780) 52,444 27,434
Cash flows from investing activities: Purchase of property and equipment (3,925) (2,199) (3,752) Proceeds from disposal of property and equipment --- 1 --- Purchase of available-for-sale marketable securities (6,354) (4,485) (4,970) Disposal of available-for-sale marketable securities 6,344 5,290 4,361 Purchase of investment securities (4,000) --- --- Cash decrease resulting from change in consolidated
entity (4) --- --- Release (pledge)of restricted cash equivalents and
marketable securities 24 (2) 1,090 Increase in other assets (270) (535) (32)
Net cash used in investing activities (8,185) (1,930) (3,303)
11/16
Himax Technologies, Inc.
Unaudited Condensed Consolidated Statements of Cash Flows (Amounts in Thousands of U.S. Dollars)
Three Months
Ended December 31,
Three Months Ended
September 30,
2013 2012 2013
Cash flows from financing activities: Distribution of cash dividends --- --- (42,394) Proceeds from issuance of new shares by subsidiaries 5,071 --- 4,391 Payments to repurchase ordinary shares --- (664) --- Proceeds from disposal of subsidiary shares to noncontrolling interests by Himax Imaging, Inc. --- 25 (14)
Purchase of subsidiary shares from noncontrolling interests (896) (1) --- Release (pledge) of restricted cash equivalents (for borrowing of short-term debt) 9,500 --- (42,000)
Proceeds from borrowing of short-term debts 19,000 --- 115,000 Repayment of short-term debts (28,500) --- (73,000)
Net cash provided by (used in) financing activities 4,175 (640) (38,017) Effect of foreign currency exchange rate changes on
cash and cash equivalents 20 41 26 Net increase (decrease) in cash and cash equivalents (5,770) 49,915 (13,860) Cash and cash equivalents at beginning of period 133,090 88,822 146,950
Cash and cash equivalents at end of period $ 127,320 $ 138,737 $ 133,090
Supplemental disclosures of cash flow information:
Cash paid during the period for:
Interest expense $ 118 $ 79 $ 110
Income taxes $ 377 $ 96 $ 435
12/16
Himax Technologies, Inc.
Unaudited Condensed Consolidated Statements of Cash Flows (Amounts in Thousands of U.S. Dollars)
Twelve Months
Ended December 31, 2013 2012
Cash flows from operating activities: Net income $ 55,924 $ 50,138 Adjustments to reconcile net income to net cash provided by operating activities: Depreciation and amortization 14,309 13,299 Provision for allowance for doubtful accounts 173 --- Share-based compensation expenses 1,840 1,936 Loss (gain) on disposal of marketable securities, net 8 (648) Loss on disposal of property and equity 88 36 Gain on disposal of equity method investment (54) --- Valuation gain on financial liabilities (160) --- Unrealized gain on conversion option --- (28) Interest income from amortization of discount on investment in
corporate bonds --- (101) Issuance of new shares by subsidiary for royalties 49 --- Impairment loss on investment --- 1,299 Equity in losses of equity method investees 122 128 Deferred income tax expense 7,409 8,851 Inventories write downs 10,759 12,418
Changes in operating assets and liabilities: Accounts receivable (65,106) (34,467) Accounts receivable from related parties 73,267 6,591 Inventories (71,488) (16,104) Prepaid expenses and other current assets (1,857) 1,421 Accounts payable 15,744 1,192 Income taxes payable 8,326 6,711 Other accrued expenses and other current liabilities 2,812 (172) Other liabilities 229 (333)
Net cash provided by operating activities 52,394 52,167
Cash flows from investing activities: Purchase of property and equipment (18,412) (6,560) Proceed from disposal of property and equipment --- 1 Purchase of available-for-sale marketable securities (22,410) (19,609) Disposal of available-for-sale marketable securities 21,792 25,043
Purchase of investment securities (9,189) (3) Cash increase (decrease) resulting from change in consolidated
entity (4) 546
Pledge of restricted cash equivalents and marketable securities (1,761) (7) Increase in other assets (541) (106)
Net cash used in investing activities (30,525) (695)

13/16
Himax Technologies, Inc. Unaudited Condensed Consolidated Statements of Cash Flows
(Amounts in Thousands of U.S. Dollars)
Twelve Months
Ended December 31,
2013 2012
Cash flows from financing activities: Distribution of cash dividends (42,394) (10,680) Proceeds from issuance of new shares by subsidiaries 9,852 116 Payments to repurchase ordinary shares --- (8,886) Proceeds from disposal of subsidiary shares to noncontrolling interests by Himax Technologies Limited --- 97
Proceeds from disposal of subsidiary shares to noncontrolling interests by Himax Imaging, Inc. 64 436
Purchase of subsidiary shares from noncontrolling interests (896) (14) Release (pledge) of restricted cash equivalents (for borrowing of short-term debt) (32,500) 11,200
Proceeds from borrowing of short-term debts 352,320 304,000 Repayment of short-term debts (319,820) (315,200)
Net cash used in financing activities (33,374) (18,931) Effect of foreign currency exchange rate changes on cash and
cash equivalents 88 32 Net increase (decrease) in cash and cash equivalents (11,417) 32,573 Cash and cash equivalents at beginning of period 138,737 106,164
Cash and cash equivalents at end of period $ 127,320 $ 138,737
Supplemental disclosures of cash flow information:
Cash paid during the period for:
Interest expense $ 390 $ 352
Income taxes $ 3,591 $ 456
Supplemental disclosures of non-cash investing activities: Fair value of ordinary shares issued by Himax Display, Inc. in the acquisition of Spatial Photonics, Inc. $ --- $ 270

14/16
Himax Technologies, Inc.
Non-GAAP Unaudited Supplemental Data – Reconciliation Schedule
(Amounts in Thousands of U.S. Dollars) Gross Margin, Operating Margin and Net Margin Excluding Share-based Compensation and Acquisition-Related Charges:
Three Months
Ended December 31,
Three Months Ended
September 30,
2013 2012 2013
Revenues $ 195,232 $ 190,639 $ 192,814 Gross profit 49,027 44,423 48,722
Add: Share-based compensation – Cost of revenues 15 15 190
Gross profit excluding share-based compensation 49,042 44,438 48,912
Gross margin excluding share-based compensation 25.1% 23.3% 25.4% Operating income 19,406 19,229 14,445
Add: Share-based compensation 356 462 8,411
Operating income excluding share-based compensation 19,762 19,691 22,856
Add: Acquisition-related charges –Intangible assets amortization 725 848 725
Operating income excluding share-based compensation and acquisition-related charges 20,487 20,539 23,581
Operating margin excluding share-based compensation and acquisition-related charges 10.5% 10.8% 12.2%
Net income attributable to Himax stockholders 15,824 14,767 12,270
Add: Share-based compensation, net of tax 272 386 6,539
Add: Acquisition-related charges, net of tax 517 559 517
Net income attributable to Himax stockholders excluding share-based compensation and acquisition-related charges 16,613 15,712 19,326
Net margin attributable to Himax stockholders excluding share-based compensation and acquisition-related charges 8.5% 8.2% 10.0%
*Gross margin excluding share-based compensation equals gross profit excluding share-based compensation divided by revenues
*Operating margin excluding share-based compensation and acquisition-related charges equals operating income excluding share-based compensation and acquisition-related charges divided by revenues
*Net margin attributable to Himax stockholders excluding share-based compensation and acquisition-related charges equals net income attributable to Himax stockholders excluding share-based compensation and acquisition-related charges divided by revenues
15/16
Himax Technologies, Inc.
Non-GAAP Unaudited Supplemental Data – Reconciliation Schedule
(Amounts in Thousands of U.S. Dollars) Gross Margin, Operating Margin and Net Margin Excluding Share-based Compensation and Acquisition-Related Charges:
Twelve Months
Ended December 31,
2013 2012
Revenues $ 770,739 $ 737,255 Gross profit 191,853 170,555
Add: Share-based compensation – Cost of revenues 235 176
Gross profit excluding share-based compensation 192,088 170,731
Gross margin excluding share-based compensation 24.9% 23.2% Operating income 74,343 67,060
Add: Share-based compensation 9,673 8,222
Operating income excluding share-based compensation 84,016 75,282
Add: Acquisition-related charges –Intangible assets amortization 2,903 2,502
Operating income excluding share-based compensation and acquisition-related charges 86,919 77,784
Operating margin excluding share-based compensation and acquisition-related charges 11.3% 10.6%
Net income attributable to Himax stockholders 61,476 51,596
Add: Share-based compensation, net of tax 7,503 6,855
Add: Acquisition-related charges, net of tax 2,068 1,838
Net income attributable to Himax stockholders excluding share-based compensation and acquisition-related charges 71,047 60,289
Net margin attributable to Himax stockholders excluding share-based compensation and acquisition-related charges 9.2% 8.2%
*Gross margin excluding share-based compensation equals gross profit excluding share-based compensation divided by revenues
*Operating margin excluding share-based compensation and acquisition-related charges equals operating income excluding share-based compensation and acquisition-related charges divided by revenues
*Net margin attributable to Himax stockholders excluding share-based compensation and acquisition-related charges equals net income attributable to Himax stockholders excluding share-based compensation and acquisition-related charges divided by revenues
16/16
Diluted Earnings Per ADS Attributable to Himax stockholders Excluding Share-based Compensation and Acquisition-Related Charges:
Three Months Ended
December 31,
Twelve Months Ended
December 31, 2013 2013
Diluted GAAP earning per ADS attributable to Himax stockholders $0.092 $0.358 Add: Share-based compensation per ADS
$0.002 $0.044 Add: Acquisition-related charges per ADS
$0.003 $0.012
Diluted non-GAAP earning per ADS attributable to Himax
stockholders excluding share-based compensation and acquisition-related charges $0.097 $0.414
Numbers do not add up due to rounding