Embed Size (px)
Citation preview
This project has received funding from the European Union Seventh Framework Programme
under grant agreement n° 609349.
OPTIMISED DESIGN METHODOLOGIES FOR ENERGY-EFFICIENT BUILDINGS
INTEGRATED IN THE NEIGHBOURHOOD ENERGY SYSTEMS
eeEmbedded – D2.1
Holistic multi-disciplinary Key Point based design framework
Responsible Author:
Romy Guruz, Gloria Calleja-Rodríguez
Co-Authors:
Marie-Christine Geißler, Peter Katranuschkov, Raimund Zellner, Tuomas Laine,
Jens Kaiser, Pit Stenzel, Klaus Linhard, Francisco Forns-Samso, Theodora Pappou,
Friedrich Jonas, Dominique Kunz, Robert Schülbe.
Due date: 31.12.2014
Issue date: 31.03.2015
Nature: Public
Coordinator: R. J. Scherer, Institute for Construction Informatics, Technische Universität Dresden, Germany
D2.1 Holistic multi-disciplinary Key Point based design framework
Version 1.0
Page 2/85
© eeEmbedded Consortium www.eeEmbedded.eu
Start date of project: 01.10.2013 Duration: 48 months
Organisation name of lead contractor for this deliverable:
Institute for Construction Informatics, Technische Universität Dresden, Germany
History
Version Description Lead Author Date
0.1 Deliverable Structure Guruz (CIB) 25.08.2014 0.2 Initial Input Concepts Guruz (CIB), Calleja (CEM) 14.10.2014
0.3 Input Introduction, SotA, WP01 outcomes
Guruz, (CIB),Calleja (CEM), Geißler (BAM)
26.11.2014
0.4 Workflow development Guruz, (CIB),Calleja (CEM), Geißler (BAM)
15.01.2015
0.5 Software Solutions & Developer Input Katranuschkov (CIB) Laine (GRA), Zellner (NEM), Baumgärtel (CIB), Linhard (IAB)
02.03.2015
0.6 Input Concept & Procedures Guruz, (CIB),Calleja (CEM), Geißler (BAM)
09.03.2015
0.7 Input eeE Sustainable Value Geißler (BAM), Calleja (CEM), Kaiser (IET), Stenzel (EAS), Zellner (NEM), Solvik (DDS), Forns-Samso (GRA), Guruz, (CIB),
18.03.2015
0.8 Re-organization Guruz (CIB) 20.03.2015
1.0 Revision, Final Reading Guruz, Schülbe (CIB), Calleja (CEM), Geißler (BAM)
27.03.2015
Copyright
This report is © eeEmbedded Consortium 2015. Its duplication is restricted to the personal use within the
consortium, the funding agency and the project reviewers. Its duplication is allowed in its integral form
only for anyone's personal use for the purposes of research or education.
Citation
Guruz, R., Calleja-Rodríguez, G. Geißler, M.-C., (2015): eeEmbedded D2.1 Holistic multi-disciplinary Key Point-based design framework, © eeEmbedded Consortium, Brussels.
Acknowledgements
The work presented in this document has been conducted in the context of the seventh framework
programme of the European community project eeEmbedded (n° 609349). eeEmbedded is a 48 month
project that started in October 2013 and is funded by the European Commission as well as by the
industrial partners. Their support is gratefully appreciated. The partners in the project are Technische
Universität Dresden (Germany), Fraunhofer-Gesellschaft zur Förderung der angewandten Forschung E.V
(Germany), NEMETSCHEK Slovensko, S.R.O. (Slovakia), Data Design System ASA (Norway), RIB
Information Technologies AG (Germany), Jotne EPM Technology AS (Norway), Granlund OY (Finland),
SOFISTIK HELLAS AE (Greece), Institute for applied Building Informatics IABI (Germany), FR. SAUTER AG
(Switzerland), , Obermeyer Planen + Beraten (Germany), Centro de Estudios Materiales y Control de
Obras S.A. (Spain), STRABAG AG (Austria) and Koninklijke BAM Group NV (The Netherlands). This report
owes to a collaborative effort of the above organizations.

D2.1 Holistic multi-disciplinary Key Point based design framework
Version 1.0
Page 3/85
© eeEmbedded Consortium www.eeEmbedded.eu
Project of SEVENTH FRAMEWORK PROGRAMME OF THE EUROPEAN COMMUNITY
Dissemination Level
PU Public X
PP Restricted to other programme participants (including the Commission Services)
RE Restricted to a group specified by the consortium (including the Commission Services)
CO Confidential, only for members of the consortium (including the Commission Services)

D2.1 Holistic multi-disciplinary Key Point based design framework
Version 1.0
Page 4/85
© eeEmbedded Consortium www.eeEmbedded.eu
Abbreviations
BACS Building Automation and Control Systems
BIM Building Information Modelling
BCF BIM Collaboration Format
BREEAM British Research Establishment Environmental Method
CFD Computational Fluid Dynamics
DV Decision Value
eeE eeEmbedded
EPBD Energy Performance of Building Directive
ESIM Energy System Information Model
ER Exchange Requirement
FM Facility Management
GUI Graphical User Interface
GWP Global Warming Potential
HVAC Heating Ventilation and Air Conditioning
IDM Information Delivery Manual
IFC Industry Foundation Classes
KP Key Point
KDP Key Design Parameter
KPI Key Performance Indicator
KRI Key Risk Indicators
LEED Leadership in Energy and Environmental Design
LCC Life Cycle Costing
LCA Life Cycle Assessment
LoD Level of Detail
LOD Level of Development
MM Multi-Model
PMV Predicted Mean Vote
PPD Predicted Percentage of Dissatisfied
RA Room Automation
TEB Thermal Energy Building simulation
TES Thermal Energy System simulation
TBM Technical Building Management
UML Unified Modelling Language
D2.1 Holistic multi-disciplinary Key Point based design framework
Version 1.0
Page 5/85
© eeEmbedded Consortium www.eeEmbedded.eu
TABLE OF CONTENTS
Executive Summary __________________________________________________________________ 7
1. Basis Ideas and State-of-the-Art ......................................................................................................8
Overview eeE Key Point Framework _______________________________________________ 9 1.1
Outcomes from eeE WP 01 _____________________________________________________10 1.2
State of the Art_______________________________________________________________12 1.3
2 Preliminary Work ..........................................................................................................................15
Key Point Structure ___________________________________________________________15 2.1
Requirements Specification for Key Points _________________________________________16 2.2
Pattern 1: Design verification with Key Design Parameters ____________________________18 2.3
Pattern 2: Performance optimization - Key Performance Indicators_____________________19 2.4
Pattern 3: Prioritisation and decision making with Decision Values _____________________20 2.5
3 eeE Key Point Framework – Concepts............................................................................................21
Step 1: Requirements Decomposition – Key Points to-be _____________________________21 3.1
Step 2: Process Tasks – Key Points as-is ___________________________________________23 3.2
Step 3: Comparing KP to-be and KP as-is – Result Aggregation _________________________23 3.3
Step 4: Consistency Check – Key Point Revision _____________________________________25 3.4
4 eeE Key Point Framework – Procedures ........................................................................................26
Evaluation Criteria and Procedures for Key Points ___________________________________26 4.1
Evaluation of Requirements in Key Points Setup ____________________________________27 4.2
Evaluation of Design Alternatives in Key Points Checking _____________________________28 4.3
Key Point Workflow (UML) _____________________________________________________31 4.4
4.4.1 Key Point Setup __________________________________________________________ 32
4.4.2 Key Point Designers’ View __________________________________________________ 33
4.4.3 Key Point Simulation/ Analysts’ View _________________________________________ 34
4.4.4 Key Point Decision makers’ View ____________________________________________ 34
Key Point Requirements for Graphical User Interface ________________________________36 4.5
5 eeE Key Point Framework – Software Solution ..............................................................................40
Key Point related Components and eeE System Architecture __________________________40 5.1
Workflow “Key Point Setup” in specification details _________________________________43 5.2
Workflow “Key Point Designers’ View” in specification details _________________________49 5.3
Workflow “Simulation/ Analysts’ View” in specification details ________________________55 5.4
Workflow “Decision makers’ View” in specification details ____________________________61 5.5
D2.1 Holistic multi-disciplinary Key Point based design framework
Version 1.0
Page 6/85
© eeEmbedded Consortium www.eeEmbedded.eu
6 Key Point Specification – eeE Sustainable Value (eeSV).................................................................67
eeE Key Point Taxonomy _______________________________________________________67 6.1
eeE Sustainable Value: DV to-be _________________________________________________69 6.2
eeE Sustainable Value: KPIs to-be ________________________________________________69 6.3
6.3.1 Simulation Domain _______________________________________________________ 69
6.3.2 Life Cycle Assessment (LCA) Domain _________________________________________ 71
6.3.3 Life Cycle Cost (LCC) Domain ________________________________________________ 72
eeE Sustainable Value: KDPs to-be _______________________________________________72 6.4
6.4.1 Architectural Domain______________________________________________________ 72
6.4.2 Energy System (ESIM) Domain ______________________________________________ 75
6.4.3 Heating, Ventilation and Air-Conditioning (HVAC) Domain ________________________ 75
6.4.4 Building Automation and Control System (BACS) Domain _________________________ 78
6.4.5 Facility Management (FM) Domain___________________________________________ 81
7 Conclusions....................................................................................................................................83
References ________________________________________________________________________84
D2.1 Holistic multi-disciplinary Key Point based design framework
Version 1.0
Page 7/85
© eeEmbedded Consortium www.eeEmbedded.eu
Executive Summary
The objective of “Deliverable D2.1 Holistic multi-disciplinary Key Point based design framework” is to
define and specify technically and semantically underpinned Key Points (KP) that play the role of control
units guiding and structuring the complex design process and the multi-disciplinary design team. The
Key Points will be structured to a flexible design progress measurement system and a related Key Point
Framework will be developed and embedded in the design lab and office architecture.
The deliverable report is structured into seven chapters:
The first chapter “Basis Ideas and State-of-the-Art” comprise the definition of terms Key Point
and Framework, the introduction of concepts, procedures and software solutions which
constitute the fundamental structure and basis of a work environment, the review of the state
of the art highlighting the existing gaps and a brief description of WP1 outputs related to Key
Point Methodology.
In the second chapter “Preliminary Work” the Key Point Structure is introduced and the
decision making pattern are examined on (1) input conditions, (2) process tasks, (3) Key Points
and (4) output conditions. The worked out results are basis for development of Key Point
Framework in the next chapter.
The third chapter “eeE Key Point Framework – Concepts” suggested new developed techniques
to fulfil basis requirements for using Key Point based design methodology. Therefore, the
concept of decomposition of requirements and the aggregation of results is explained based on
the process patterns.
The fourth chapter “eeE Key Point Framework – Procedures” addresses the procedures that
are part of the eeE Key Point Framework comprising procedures to evaluate requirements and
setup Key Points, procedures to evaluate design alternatives and procedures for the overall Key
Point Methodology. In addition, the sequences of the steps of the Key Point Workflow are
specified via Unified Modelling Language (UML).
In the fifth chapter “eeE Key Point Framework – Software Solutions” required S/W
components are specified based on the developed Key Point Workflows for the Set Up View, the
Designers’ View, the Simulation and Analyst’s View and the Decision makers’ view and
implementation plans are developed.
In the sixth chapter the three identified Key Point Groups Decision Value (DV), Key Performance
Indicators (KPIs), Key Design Parameters (KDPs) are specified in an eeE Taxonomy example
which will be basis for the development of the eeE ontology to support the design process of
energy-efficient and sustainable buildings optimally embedded in their neighbourhood.
The seventh chapter emphasises the most relevant conclusions gained from the results of this
deliverable as well as about the process including the various discussions to come to those
results.
The following partners were involved and each partner has contributed from their expert viewpoint:
CIB: Lead and contributions, all tasks.
CEM and BAM: Contributions from end-user point of view, all tasks.
NEM, GRA, DDS, IABI, EAS, IET: Contributions in chapter 2 and 4 from developer point of view.
D2.1 Holistic multi-disciplinary Key Point based design framework
Version 1.0
Page 8/85
© eeEmbedded Consortium www.eeEmbedded.eu
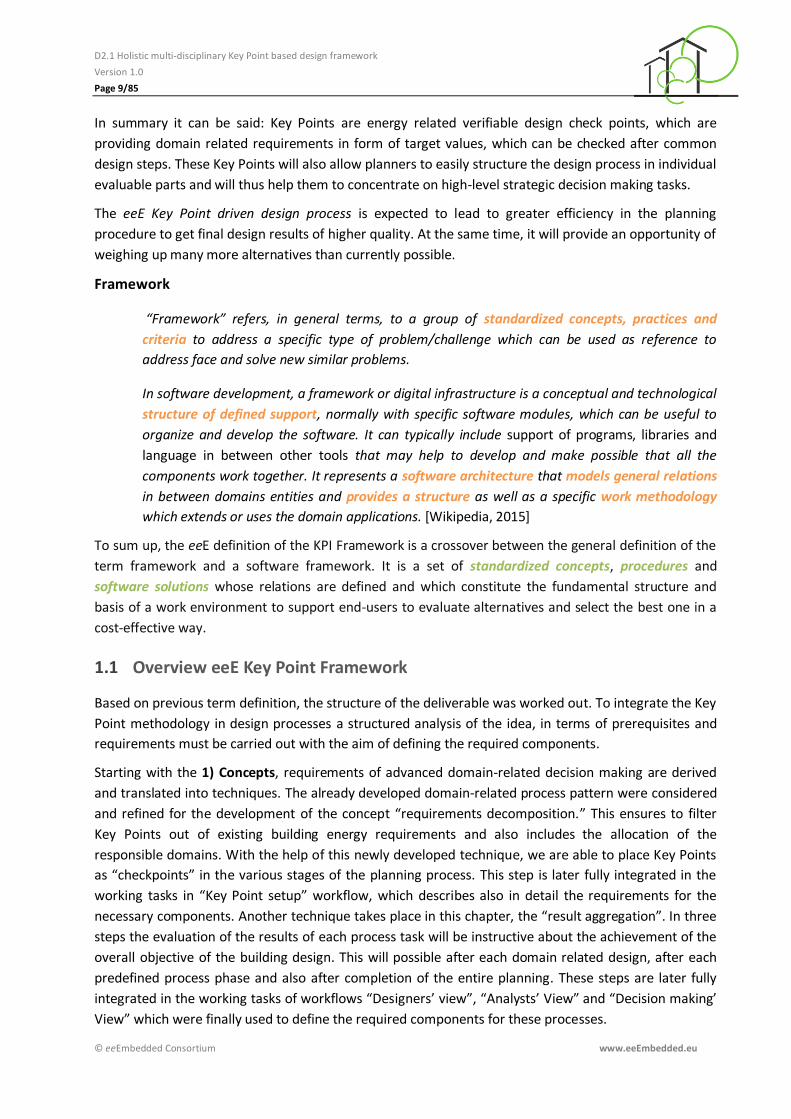
1. Basis Ideas and State-of-the-Art
This chapter is focused on the definition of the terms Key Point and Framework, as well as on the
localisation of the workspace before figuring it out. This basis work involves a review of the state of the
art, highlighting the existing gaps and a brief description of WP1 outputs related to Key Point
Methodology. Therefore, the eeE framework term concept including a structured working method is
developed to guide the specifications in the entire deliverable.
Key Points
To start the specification of the eeE Key Point (KP), a basis definition of the new created term Key Points
is mandatory. The idea is based on the wish to integrate energy goals in the earliest design steps of a
building project. It is commonly known that unilateral elaborate design decisions can have substantial
negative influence on the environmental, social and economic performance of a building. Great
opportunities are seen in the early design phases, where only general conditions and basic constraints
are predetermined by the client and the participating planners. Based on the well-known concept to
place verifiable control points by using Key Performance Indicators (KPIs), we have analysed the
relationship between energy related performance goals, the associated design parameters and of
course general building requirements. Building requirements contain numerous explicit and implicit
requests, which are also addressed at several domain planners at the same time. The question was:
how can we assist all planners to get a holistic energy efficient design? Our method aims to structure
energy related requirements in detail already in the run-up to the actual planning phases. Thus makes
able to define the domain-related goals which can be checked against pre-defined target values by each
planner after the conclusion of a design phase. At the end of a phase, the decision maker can evaluate
all partial results to find the best alternatives related to the project goals.
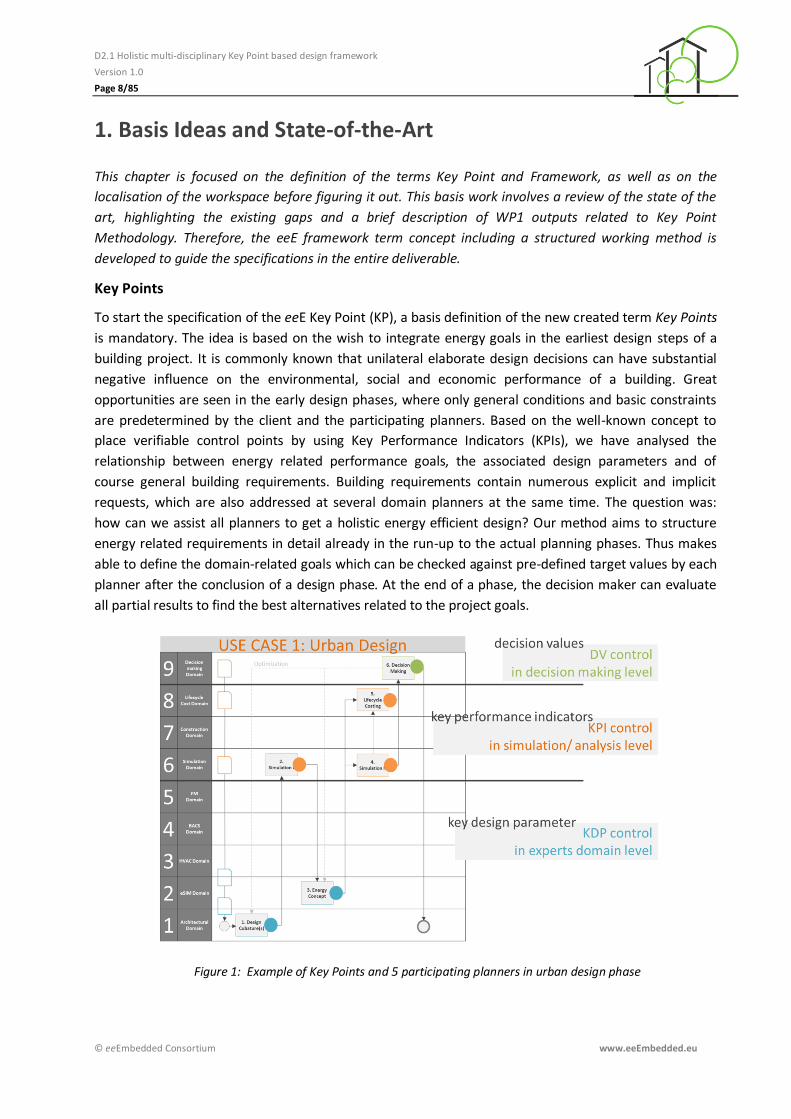
Figure 1: Example of Key Points and 5 participating planners in urban design phase
D2.1 Holistic multi-disciplinary Key Point based design framework
Version 1.0
Page 9/85
© eeEmbedded Consortium www.eeEmbedded.eu
In summary it can be said: Key Points are energy related verifiable design check points, which are
providing domain related requirements in form of target values, which can be checked after common
design steps. These Key Points will also allow planners to easily structure the design process in individual
evaluable parts and will thus help them to concentrate on high-level strategic decision making tasks.
The eeE Key Point driven design process is expected to lead to greater efficiency in the planning
procedure to get final design results of higher quality. At the same time, it will provide an opportunity of
weighing up many more alternatives than currently possible.
Framework
“Framework” refers, in general terms, to a group of standardized concepts, practices and
criteria to address a specific type of problem/challenge which can be used as reference to
address face and solve new similar problems.
In software development, a framework or digital infrastructure is a conceptual and technological
structure of defined support, normally with specific software modules, which can be useful to
organize and develop the software. It can typically include support of programs, libraries and
language in between other tools that may help to develop and make possible that all the
components work together. It represents a software architecture that models general relations
in between domains entities and provides a structure as well as a specific work methodology
which extends or uses the domain applications. [Wikipedia, 2015]
To sum up, the eeE definition of the KPI Framework is a crossover between the general definition of the
term framework and a software framework. It is a set of standardized concepts, procedures and
software solutions whose relations are defined and which constitute the fundamental structure and
basis of a work environment to support end-users to evaluate alternatives and select the best one in a
cost-effective way.
Overview eeE Key Point Framework 1.1
Based on previous term definition, the structure of the deliverable was worked out. To integrate the Key
Point methodology in design processes a structured analysis of the idea, in terms of prerequisites and
requirements must be carried out with the aim of defining the required components.
Starting with the 1) Concepts, requirements of advanced domain-related decision making are derived
and translated into techniques. The already developed domain-related process pattern were considered
and refined for the development of the concept “requirements decomposition.” This ensures to filter
Key Points out of existing building energy requirements and also includes the allocation of the
responsible domains. With the help of this newly developed technique, we are able to place Key Points
as “checkpoints” in the various stages of the planning process. This step is later fully integrated in the
working tasks in “Key Point setup” workflow, which describes also in detail the requirements for the
necessary components. Another technique takes place in this chapter, the “result aggregation”. In three
steps the evaluation of the results of each process task will be instructive about the achievement of the
overall objective of the building design. This will possible after each domain related design, after each
predefined process phase and also after completion of the entire planning. These steps are later fully
integrated in the working tasks of workflows “Designers’ view”, “Analysts’ View” and “Decision making’
View” which were finally used to define the required components for these processes.
D2.1 Holistic multi-disciplinary Key Point based design framework
Version 1.0
Page 10/85
© eeEmbedded Consortium www.eeEmbedded.eu
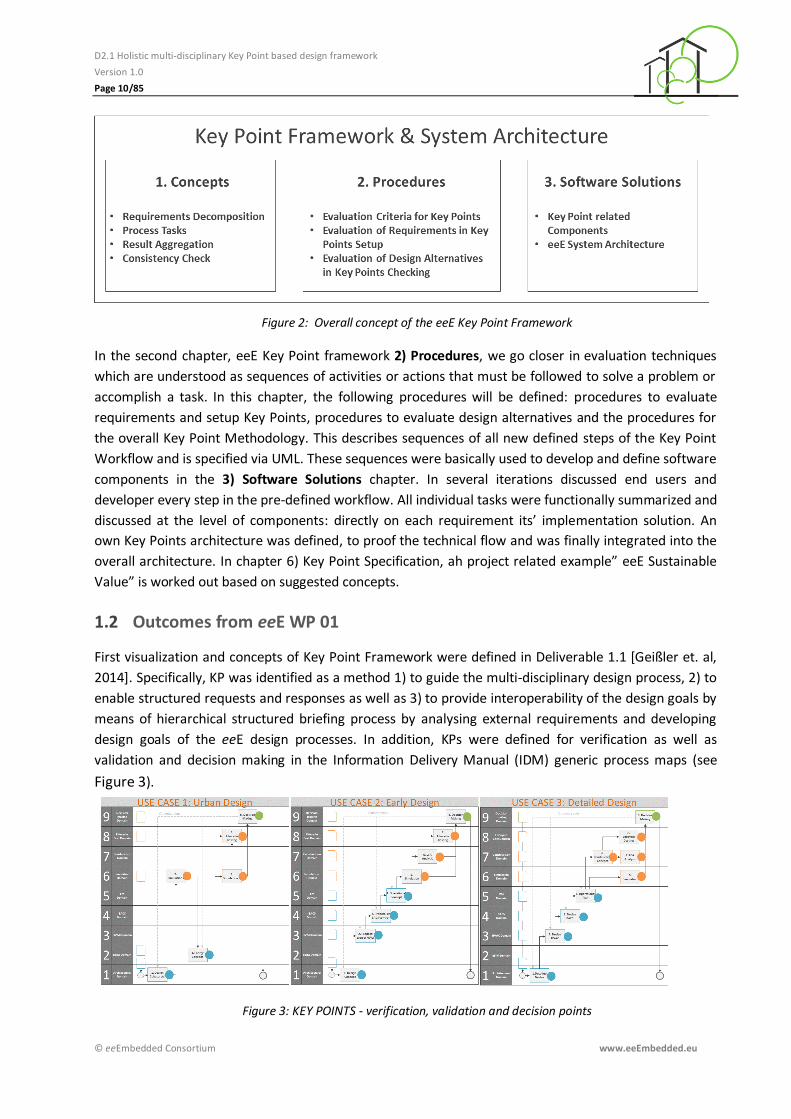
Figure 2: Overall concept of the eeE Key Point Framework
In the second chapter, eeE Key Point framework 2) Procedures, we go closer in evaluation techniques
which are understood as sequences of activities or actions that must be followed to solve a problem or
accomplish a task. In this chapter, the following procedures will be defined: procedures to evaluate
requirements and setup Key Points, procedures to evaluate design alternatives and the procedures for
the overall Key Point Methodology. This describes sequences of all new defined steps of the Key Point
Workflow and is specified via UML. These sequences were basically used to develop and define software
components in the 3) Software Solutions chapter. In several iterations discussed end users and
developer every step in the pre-defined workflow. All individual tasks were functionally summarized and
discussed at the level of components: directly on each requirement its’ implementation solution. An
own Key Points architecture was defined, to proof the technical flow and was finally integrated into the
overall architecture. In chapter 6) Key Point Specification, ah project related example” eeE Sustainable
Value” is worked out based on suggested concepts.
Outcomes from eeE WP 01 1.2
First visualization and concepts of Key Point Framework were defined in Deliverable 1.1 [Geißler et. al,
2014]. Specifically, KP was identified as a method 1) to guide the multi-disciplinary design process, 2) to
enable structured requests and responses as well as 3) to provide interoperability of the design goals by
means of hierarchical structured briefing process by analysing external requirements and developing
design goals of the eeE design processes. In addition, KPs were defined for verification as well as
validation and decision making in the Information Delivery Manual (IDM) generic process maps (see
Figure 3).
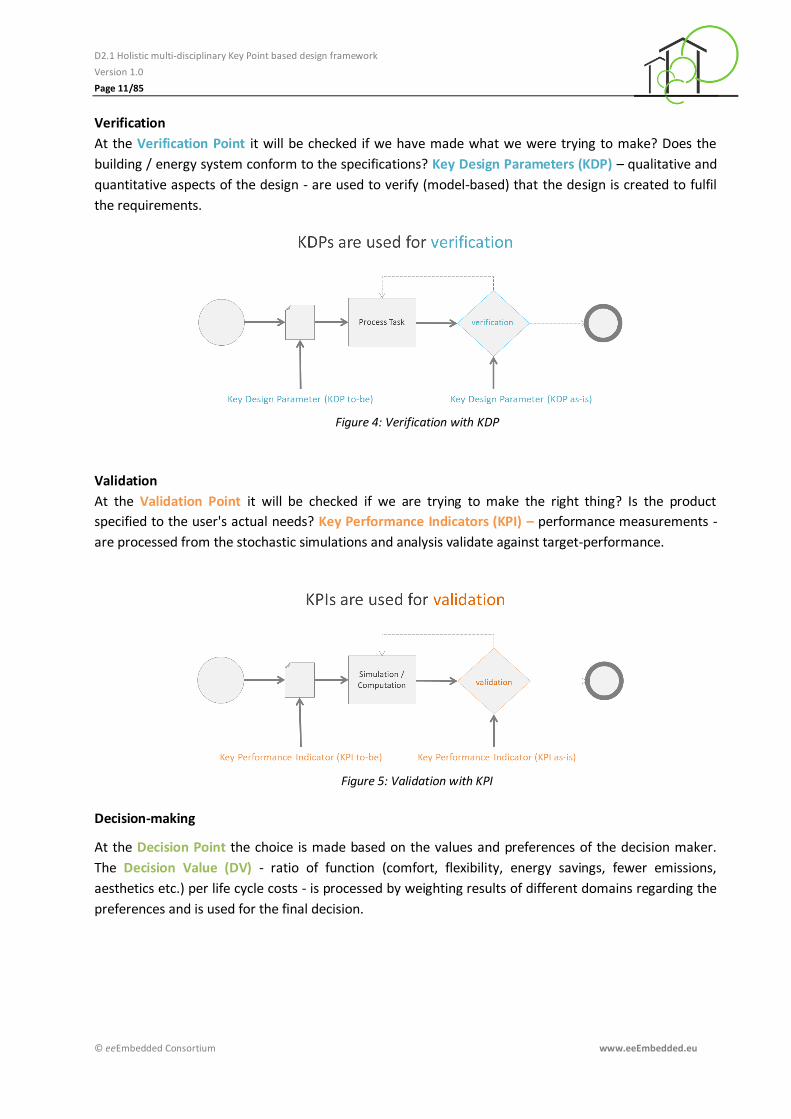
Figure 3: KEY POINTS - verification, validation and decision points
D2.1 Holistic multi-disciplinary Key Point based design framework
Version 1.0
Page 11/85
© eeEmbedded Consortium www.eeEmbedded.eu
Verification
At the Verification Point it will be checked if we have made what we were trying to make? Does the
building / energy system conform to the specifications? Key Design Parameters (KDP) – qualitative and
quantitative aspects of the design - are used to verify (model-based) that the design is created to fulfil
the requirements.
Figure 4: Verification with KDP
Validation
At the Validation Point it will be checked if we are trying to make the right thing? Is the product
specified to the user's actual needs? Key Performance Indicators (KPI) – performance measurements -
are processed from the stochastic simulations and analysis validate against target-performance.
Figure 5: Validation with KPI
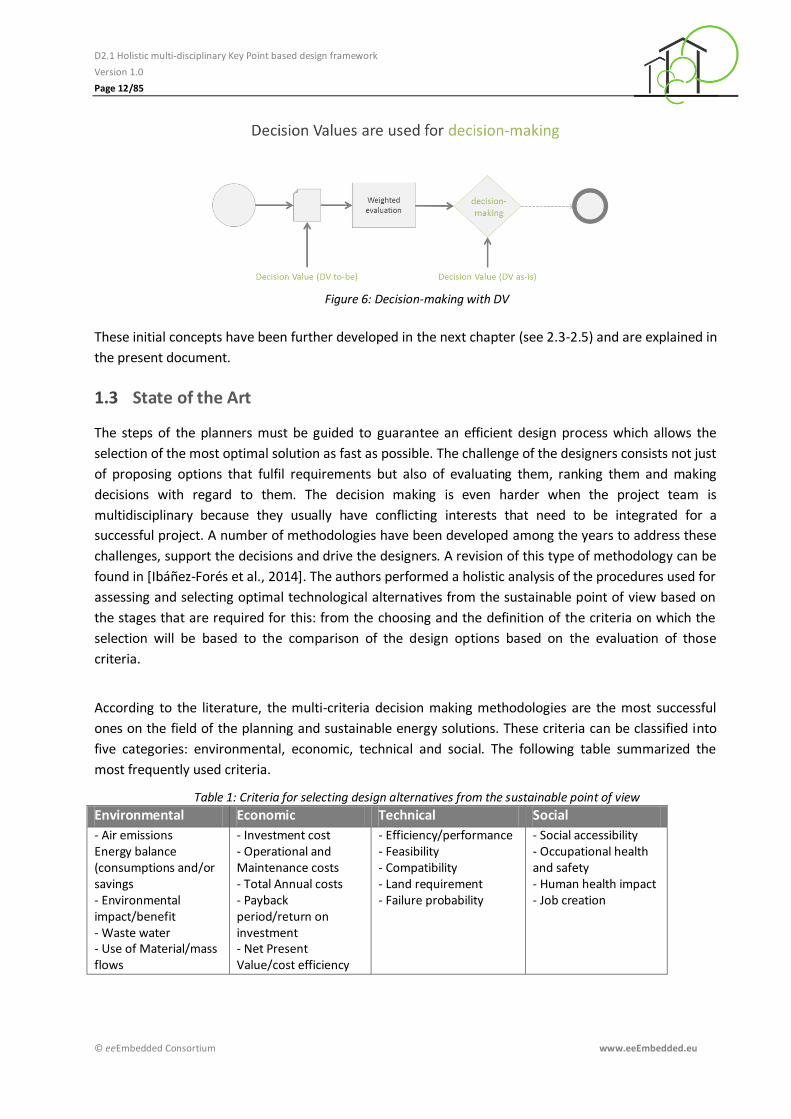
Decision-making
At the Decision Point the choice is made based on the values and preferences of the decision maker.
The Decision Value (DV) - ratio of function (comfort, flexibility, energy savings, fewer emissions,
aesthetics etc.) per life cycle costs - is processed by weighting results of different domains regarding the
preferences and is used for the final decision.
D2.1 Holistic multi-disciplinary Key Point based design framework
Version 1.0
Page 12/85
© eeEmbedded Consortium www.eeEmbedded.eu
Figure 6: Decision-making with DV
These initial concepts have been further developed in the next chapter (see 2.3-2.5) and are explained in
the present document.
State of the Art 1.3
The steps of the planners must be guided to guarantee an efficient design process which allows the
selection of the most optimal solution as fast as possible. The challenge of the designers consists not just
of proposing options that fulfil requirements but also of evaluating them, ranking them and making
decisions with regard to them. The decision making is even harder when the project team is
multidisciplinary because they usually have conflicting interests that need to be integrated for a
successful project. A number of methodologies have been developed among the years to address these
challenges, support the decisions and drive the designers. A revision of this type of methodology can be
found in [Ibáñez-Forés et al., 2014]. The authors performed a holistic analysis of the procedures used for
assessing and selecting optimal technological alternatives from the sustainable point of view based on
the stages that are required for this: from the choosing and the definition of the criteria on which the
selection will be based to the comparison of the design options based on the evaluation of those
criteria.
According to the literature, the multi-criteria decision making methodologies are the most successful
ones on the field of the planning and sustainable energy solutions. These criteria can be classified into
five categories: environmental, economic, technical and social. The following table summarized the
most frequently used criteria.
Table 1: Criteria for selecting design alternatives from the sustainable point of view
Environmental Economic Technical Social
- Air emissions Energy balance (consumptions and/or savings - Environmental impact/benefit - Waste water - Use of Material/mass flows
- Investment cost - Operational and Maintenance costs - Total Annual costs - Payback period/return on investment - Net Present Value/cost efficiency
- Efficiency/performance - Feasibility - Compatibility - Land requirement - Failure probability
- Social accessibility - Occupational health and safety - Human health impact - Job creation
D2.1 Holistic multi-disciplinary Key Point based design framework
Version 1.0
Page 13/85
© eeEmbedded Consortium www.eeEmbedded.eu
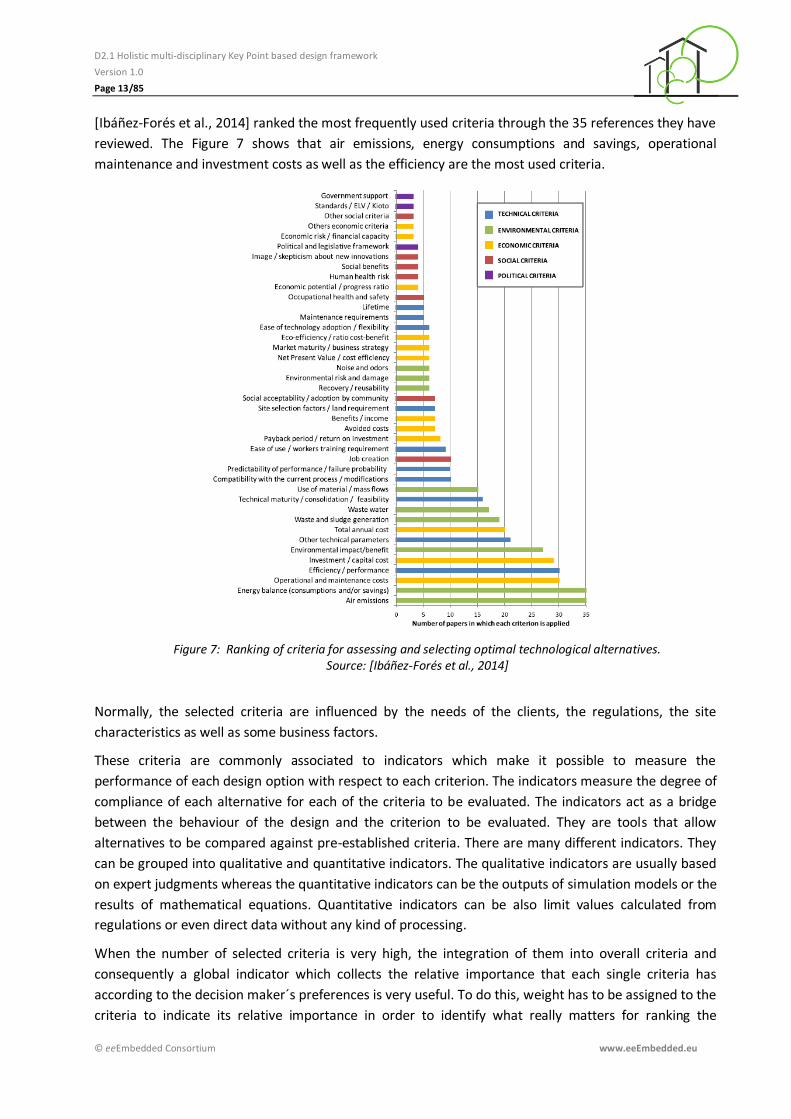
[Ibáñez-Forés et al., 2014] ranked the most frequently used criteria through the 35 references they have
reviewed. The Figure 7 shows that air emissions, energy consumptions and savings, operational
maintenance and investment costs as well as the efficiency are the most used criteria.
Figure 7: Ranking of criteria for assessing and selecting optimal technological alternatives. Source: [Ibáñez-Forés et al., 2014]
Normally, the selected criteria are influenced by the needs of the clients, the regulations, the site
characteristics as well as some business factors.
These criteria are commonly associated to indicators which make it possible to measure the
performance of each design option with respect to each criterion. The indicators measure the degree of
compliance of each alternative for each of the criteria to be evaluated. The indicators act as a bridge
between the behaviour of the design and the criterion to be evaluated. They are tools that allow
alternatives to be compared against pre-established criteria. There are many different indicators. They
can be grouped into qualitative and quantitative indicators. The qualitative indicators are usually based
on expert judgments whereas the quantitative indicators can be the outputs of simulation models or the
results of mathematical equations. Quantitative indicators can be also limit values calculated from
regulations or even direct data without any kind of processing.
When the number of selected criteria is very high, the integration of them into overall criteria and
consequently a global indicator which collects the relative importance that each single criteria has
according to the decision maker´s preferences is very useful. To do this, weight has to be assigned to the
criteria to indicate its relative importance in order to identify what really matters for ranking the
D2.1 Holistic multi-disciplinary Key Point based design framework
Version 1.0
Page 14/85
© eeEmbedded Consortium www.eeEmbedded.eu
alternatives effectively. The priority assigned to the criteria plays a vital role in obtaining results and
must be applied with care, since the final decision can vary significantly depending on the importance
granted to each criterion. An application of indicators system approach is found in [Alwaer et al., 2010]
to assess sustainable intelligent buildings.
This way, the design alternatives are selected or discarded based on the indicators and following rules
such as:
Discard design options which are not compliant with the requirements/constraints.
Selecting the alternatives whose indicators are the lowest or the highest (min/max value).
[Wikipedia, 2015] For example, if the objective is to reduce consumption, then the design
alternatives whose consumption indicator is the lowest will be selected.
Selecting the alternatives whose distance to the target value is lower. For example, if the
objective is to have an office building with 7000 m2 then the design alternatives whose surface
are closer to 7000 m2 will be selected.
Selecting alternatives based on using a mathematical function which is generally configured by
combining and/or aggregating several calculated parameters within a single index or indicator.
It should be highlighted that there are many evaluation tools in the market which implement this kind of
framework to support the assessment of alternative design options. According to [Gil et al. 2012], the
most of the evaluation tools in the field of sustainability urban design have the following lacks:
They often neglect requirements analysis or do not connect to the optimization tools [Shao et
al., 2014] (Solution provided criteria to discard / select design options; see section 3)
They do not deal with aggregating and weighting indicator systems for multi-criteria. They are
mainly focused on disaggregated systems of indicators [Gil et al., 2012]
They do not consider synergies or interrelations between indicators [Gil et al., 2012]
They are not BIM tools. The use of BIM to support this kind of framework needs to be studied
further and connected to construction classification and ontology [Jansson et al. 2013]
In addition, the authors of this deliverable have identified a lack of standardization related to the
indicator systems which provides formulation, publication, and implementation of guidelines, rules, and
specifications for a common and repeated use of this type of decision support framework. This is crucial
to ensure compatibility, interoperability, safety, repeatability and quality of the indicator system.
The eeE KPI Framework aims to be a systematic and rigorous support tool to bridge the above
mentioned gaps and deficiencies. Moreover, another vision of eeE KPI Framework is to extend the
existing indicators systems and methodologies to address one of the main challenges of the
construction projects which is the management of the high amount of specified requirements and
restrictions which have to be fulfilled by the final solution. In this line, [Jansson et al., 2013] proposes a
framework for the management of the requirements in the construction work which consists of
translating the functional requirements and the constraints into design parameters in order to track
them. Although some developments have been done in this field, there is still a gap. Taking into account
that these requirements can be seen as criteria to assess and select design alternatives, eeE aims to go
further and address this challenge by translating the requirements into indicators that guide the design
steps.
D2.1 Holistic multi-disciplinary Key Point based design framework
Version 1.0
Page 15/85
© eeEmbedded Consortium www.eeEmbedded.eu
2 Preliminary Work
In this chapter, the requirements to specify Key Points are discussed with the help of refining the former
presented decision pattern. Before that, the Key Points are hierarchically categorized, in Key Points to-be
(design requirements) and Key Points as-is (design results,) and reflected. The already developed process
pattern for domain related decision making are fundamentally refined and adapted in order to our
envisaged technical workflow (see, 4.4).
Key Point Structure 2.1
The vision of our new design methodology necessitates a structured net of verifiable design checkpoints,
which are based on building requirements and during the different design phases used as milestones
which are defined as Key Points (KPs). In section 3.1 we discuss the basis interdependencies of the KPs
between building requirements. We suggest a stepwise decomposition of building requirements to
derive KPs for design phases and participating domains. This step is later described in detail in the
workflow pattern “Key Point Setup” (see 4.4.1). In section 3.3 we present the concept of result
aggregation. That includes the workflow patterns “Designers’, Simulation/Analysts’ and Decision
makers’ view” (see 4.4.2-4.4.4).
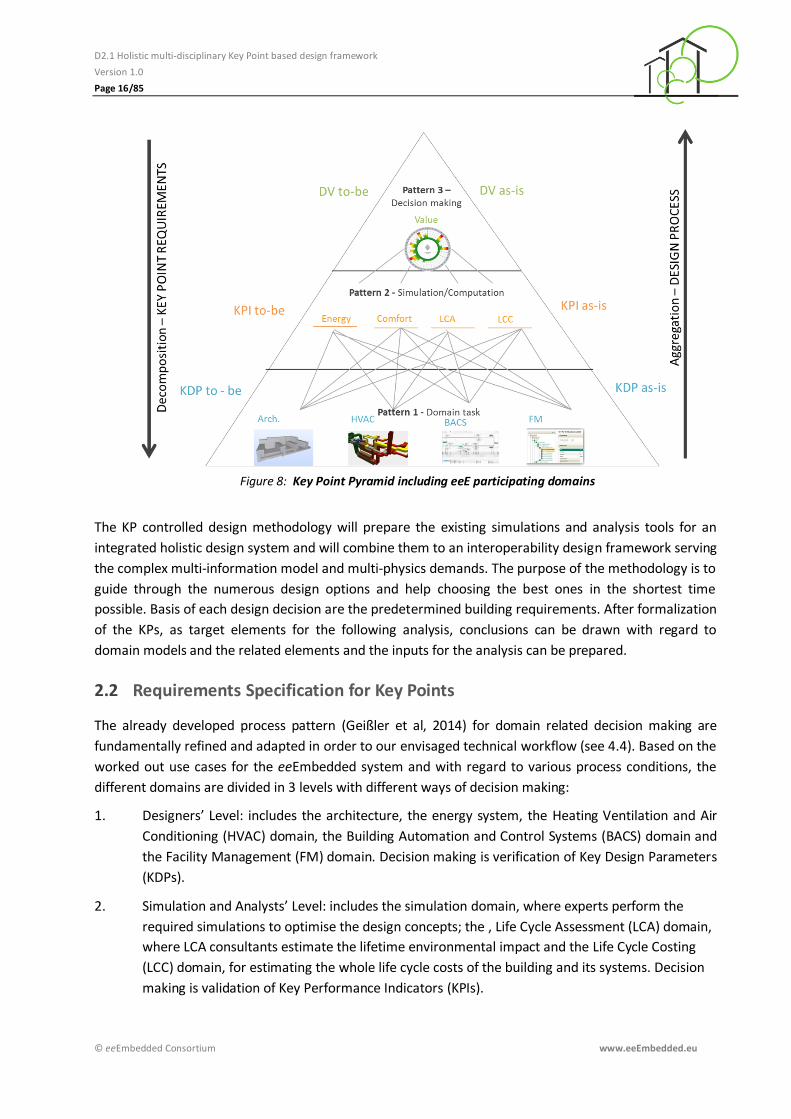
As shown in figure below (Fig. 8) the Key Points are hierarchically categorized:
Decision Value (DV): Represent the preferences of the decision makers related to the project goals. This allows prioritising KPIs by means of a weighting factor. DVs are categorized as energy certifications (e.g. passive house, LEED, DGNB)
DV to-be: ~is described as target value. Client (and planners) set to one (or more) certification. It is also the highest value in score (see 6.1)
DV as-is: ~is described as design result.
Key Performance Indicators (KPIs): Numeric metrics of energy usage of building performance (e.g. final energy, thermal comfort, life cycle costs etc.) or observed building characteristics that can be associated with better or worse energy performance. They are influenced by Key Design Parameters and are additionally the basis values for evaluation via Decision Values.
KPI to-be: ~represents the target value. Client (and planners) set target values for performance.
KPI as-is: ~represents the simulation result(s). Key Design Parameter (KDP): ~ represent the mandatory building properties and usually have a limited
or a range value. KDP to-be: ~ are requirements´ measures which are used for tracking the design process,
usually they have a range but they have always have influences on at least 1 KPI. KDP as-is: ~ are parameters of the design, related to spaces or elements/systems and
represent the design results.
D2.1 Holistic multi-disciplinary Key Point based design framework
Version 1.0
Page 16/85
© eeEmbedded Consortium www.eeEmbedded.eu
Figure 8: Key Point Pyramid including eeE participating domains
The KP controlled design methodology will prepare the existing simulations and analysis tools for an
integrated holistic design system and will combine them to an interoperability design framework serving
the complex multi‐information model and multi‐physics demands. The purpose of the methodology is to
guide through the numerous design options and help choosing the best ones in the shortest time
possible. Basis of each design decision are the predetermined building requirements. After formalization
of the KPs, as target elements for the following analysis, conclusions can be drawn with regard to
domain models and the related elements and the inputs for the analysis can be prepared.
Requirements Specification for Key Points 2.2
The already developed process pattern (Geißler et al, 2014) for domain related decision making are
fundamentally refined and adapted in order to our envisaged technical workflow (see 4.4). Based on the
worked out use cases for the eeEmbedded system and with regard to various process conditions, the
different domains are divided in 3 levels with different ways of decision making:
1. Designers’ Level: includes the architecture, the energy system, the Heating Ventilation and Air
Conditioning (HVAC) domain, the Building Automation and Control Systems (BACS) domain and
the Facility Management (FM) domain. Decision making is verification of Key Design Parameters
(KDPs).
2. Simulation and Analysts’ Level: includes the simulation domain, where experts perform the
required simulations to optimise the design concepts; the , Life Cycle Assessment (LCA) domain,
where LCA consultants estimate the lifetime environmental impact and the Life Cycle Costing
(LCC) domain, for estimating the whole life cycle costs of the building and its systems. Decision
making is validation of Key Performance Indicators (KPIs).
D2.1 Holistic multi-disciplinary Key Point based design framework
Version 1.0
Page 17/85
© eeEmbedded Consortium www.eeEmbedded.eu
3. Decision Makers’ Level: The developer/owner or one of the experts above (in most cases the
architect) decides if the concept developed by the project team is worth implementing.
Decision making is evaluation of Decision Values (DVs).
As a result of this classification, we precisely examined these levels to reduce complexity by inference
and derivation of complex tasks and decision making in a generic process. For each of the above levels, a
pattern was defined. For this Deliverable we refined the 3 pattern in the following with regard to input
and output conditions as well as technical requirements and required details to the KPs itself. The three
elaborated patterns were detailed as follows:
I. Input conditions: decomposed requirements and additional requirements, as well as models
by other domains and results of former iterations. These conditions are split in mandatory and
optional sets;
II. Process starting point;
III. The individual process task (usually initiated by requirements) produces results;
IV. Results (including different Alternatives);
V. Key Point: decision making within the pattern related to evaluation of the results;
VI. Process end point;
VII. Output conditions: also separated in mandatory and optional sets- typically results,
transferred as domain model, as well as further requirements.
Therefore, each design phase can be described with the 3 patterns: Domain task pattern,
simulation/computation pattern and the decision making pattern. In front of the different methods and
strategies existing in the decision theory, it is necessary to further define the characteristics and
restrictions of the decision challenge.
In the following sections, focus is on input parameter, related domain tasks, KPs (verification points) and
output parameter.
D2.1 Holistic multi-disciplinary Key Point based design framework
Version 1.0
Page 18/85
© eeEmbedded Consortium www.eeEmbedded.eu
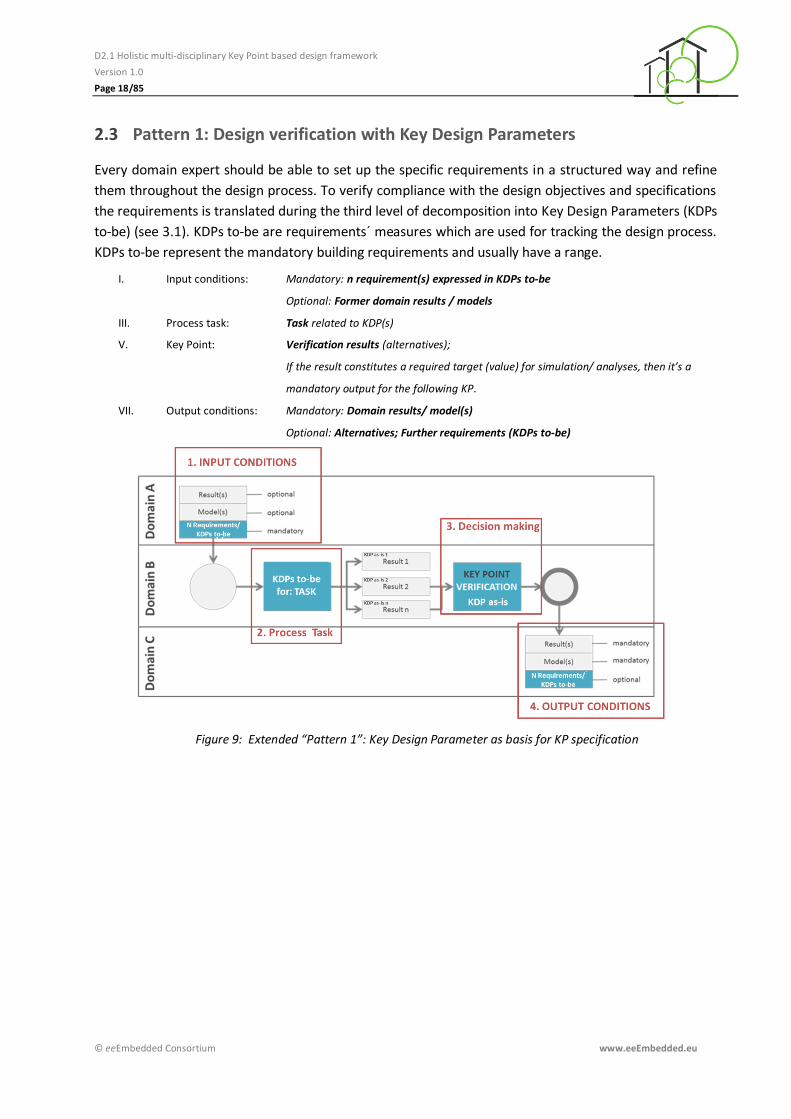
Pattern 1: Design verification with Key Design Parameters 2.3
Every domain expert should be able to set up the specific requirements in a structured way and refine
them throughout the design process. To verify compliance with the design objectives and specifications
the requirements is translated during the third level of decomposition into Key Design Parameters (KDPs
to-be) (see 3.1). KDPs to-be are requirements´ measures which are used for tracking the design process.
KDPs to-be represent the mandatory building requirements and usually have a range.
I. Input conditions: Mandatory: n requirement(s) expressed in KDPs to-be
Optional: Former domain results / models
III. Process task: Task related to KDP(s)
V. Key Point: Verification results (alternatives);
If the result constitutes a required target (value) for simulation/ analyses, then it’s a
mandatory output for the following KP.
VII. Output conditions: Mandatory: Domain results/ model(s)
Optional: Alternatives; Further requirements (KDPs to-be)
Figure 9: Extended “Pattern 1”: Key Design Parameter as basis for KP specification
D2.1 Holistic multi-disciplinary Key Point based design framework
Version 1.0
Page 19/85
© eeEmbedded Consortium www.eeEmbedded.eu
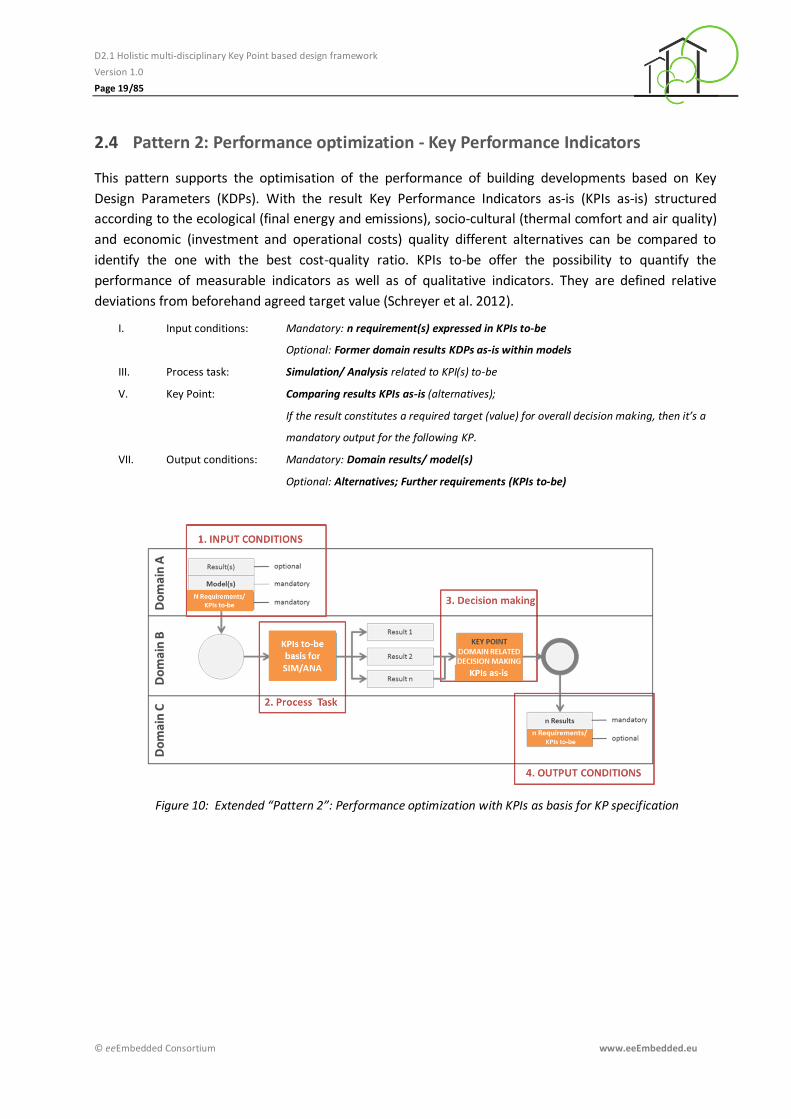
Pattern 2: Performance optimization - Key Performance Indicators 2.4
This pattern supports the optimisation of the performance of building developments based on Key
Design Parameters (KDPs). With the result Key Performance Indicators as-is (KPIs as-is) structured
according to the ecological (final energy and emissions), socio-cultural (thermal comfort and air quality)
and economic (investment and operational costs) quality different alternatives can be compared to
identify the one with the best cost-quality ratio. KPIs to-be offer the possibility to quantify the
performance of measurable indicators as well as of qualitative indicators. They are defined relative
deviations from beforehand agreed target value (Schreyer et al. 2012).
I. Input conditions: Mandatory: n requirement(s) expressed in KPIs to-be
Optional: Former domain results KDPs as-is within models
III. Process task: Simulation/ Analysis related to KPI(s) to-be
V. Key Point: Comparing results KPIs as-is (alternatives);
If the result constitutes a required target (value) for overall decision making, then it’s a
mandatory output for the following KP.
VII. Output conditions: Mandatory: Domain results/ model(s)
Optional: Alternatives; Further requirements (KPIs to-be)
Figure 10: Extended “Pattern 2”: Performance optimization with KPIs as basis for KP specification
D2.1 Holistic multi-disciplinary Key Point based design framework
Version 1.0
Page 20/85
© eeEmbedded Consortium www.eeEmbedded.eu
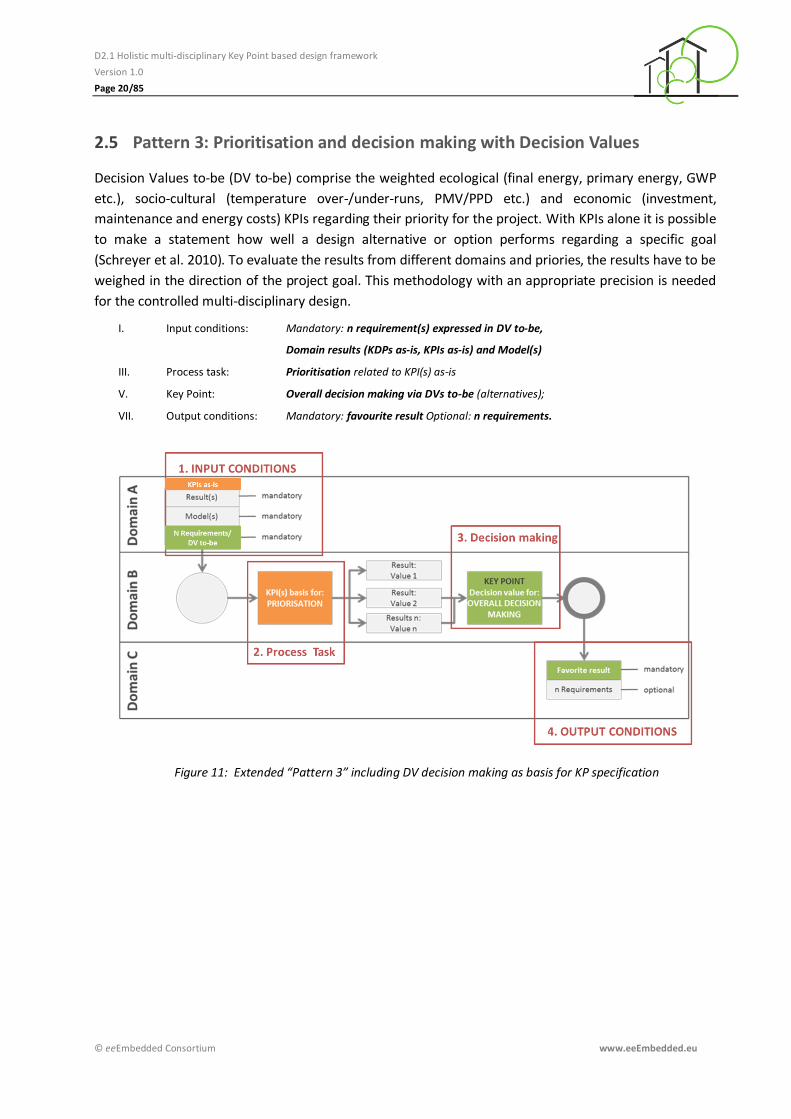
Pattern 3: Prioritisation and decision making with Decision Values 2.5
Decision Values to-be (DV to-be) comprise the weighted ecological (final energy, primary energy, GWP
etc.), socio-cultural (temperature over-/under-runs, PMV/PPD etc.) and economic (investment,
maintenance and energy costs) KPIs regarding their priority for the project. With KPIs alone it is possible
to make a statement how well a design alternative or option performs regarding a specific goal
(Schreyer et al. 2010). To evaluate the results from different domains and priories, the results have to be
weighed in the direction of the project goal. This methodology with an appropriate precision is needed
for the controlled multi-disciplinary design.
I. Input conditions: Mandatory: n requirement(s) expressed in DV to-be,
Domain results (KDPs as-is, KPIs as-is) and Model(s)
III. Process task: Prioritisation related to KPI(s) as-is
V. Key Point: Overall decision making via DVs to-be (alternatives);
VII. Output conditions: Mandatory: favourite result Optional: n requirements.
Figure 11: Extended “Pattern 3” including DV decision making as basis for KP specification
D2.1 Holistic multi-disciplinary Key Point based design framework
Version 1.0
Page 21/85
© eeEmbedded Consortium www.eeEmbedded.eu
3 eeE Key Point Framework – Concepts
This chapter is dedicated to the new developed concepts related to the Key Point driven design process.
The former Key Points structure and pattern analysis allows now to enlarge concepts: main ingredients
are now improved and the concept of decomposing building requirements, to set up Key Points, as well
as the aggregation of design results is exemplified. These describe the working method for the
subsequent detailing specification of eeE Key Point Taxonomy and the basis for the later formalization.
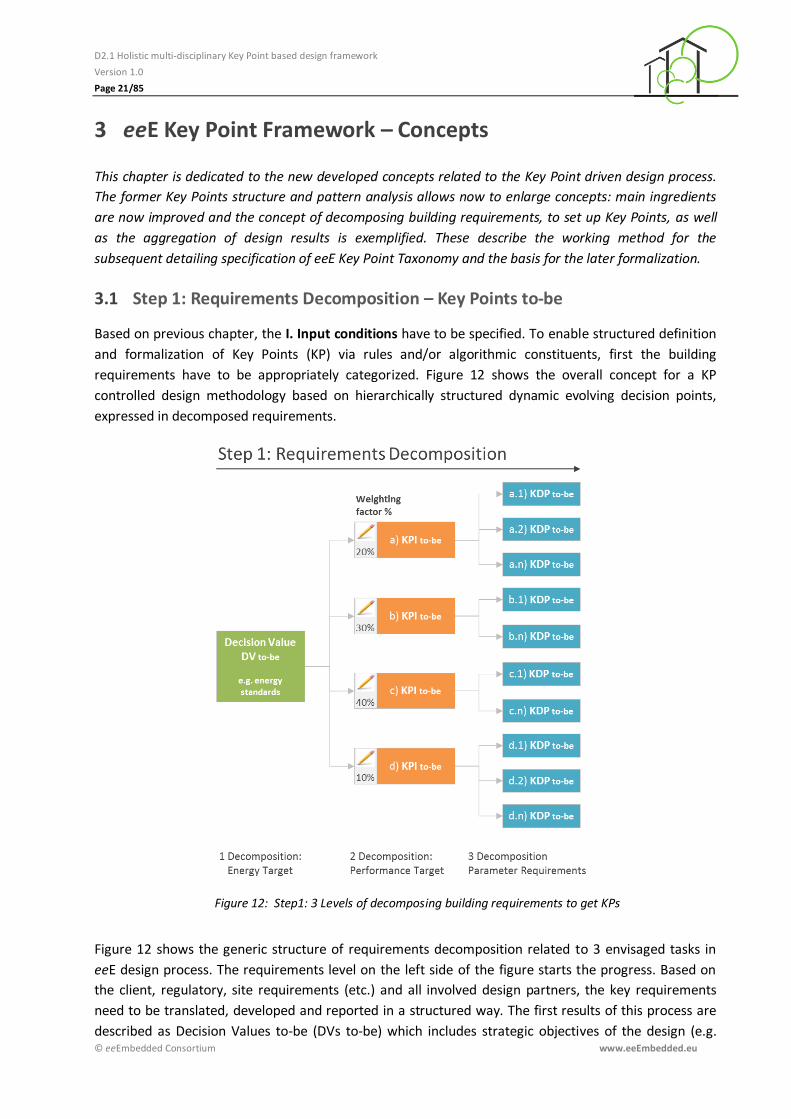
Step 1: Requirements Decomposition – Key Points to-be 3.1
Based on previous chapter, the I. Input conditions have to be specified. To enable structured definition
and formalization of Key Points (KP) via rules and/or algorithmic constituents, first the building
requirements have to be appropriately categorized. Figure 12 shows the overall concept for a KP
controlled design methodology based on hierarchically structured dynamic evolving decision points,
expressed in decomposed requirements.
Figure 12: Step1: 3 Levels of decomposing building requirements to get KPs
Figure 12 shows the generic structure of requirements decomposition related to 3 envisaged tasks in
eeE design process. The requirements level on the left side of the figure starts the progress. Based on
the client, regulatory, site requirements (etc.) and all involved design partners, the key requirements
need to be translated, developed and reported in a structured way. The first results of this process are
described as Decision Values to-be (DVs to-be) which includes strategic objectives of the design (e.g.
D2.1 Holistic multi-disciplinary Key Point based design framework
Version 1.0
Page 22/85
© eeEmbedded Consortium www.eeEmbedded.eu
energy certifications), shown in the left side of the figure. Next decomposing step is related to the
performance of the building and are expressed in target values via Key Performance Indicators to-be
(KPIs to-be). To verify compliance with the design objectives and specifications the requirements should
be translated to Key Design Parameters to-be (KDPs to-be). As part of this process step, the KDPs to-be
are also finally checked and matched within the participating domains.
In detail, the 3 levels of requirements decomposition are defined as follows:
1. Level of Decomposition – define Decision Values (DVs to-be)
The first decomposition of building requirements is in higher decision making, the translation of project
goals into Key Points. The preferences of the decision-makers vary, so they need the possibility to
prioritize KPIs with a weighting factor. The DVs comprise the weighted ecological (final energy, primary
energy, etc.), socio-cultural (temperature over-/underruns, etc.) and economic (investment,
maintenance and energy costs) KPI regarding their priority for the project. With KPIs alone it is possible
to make a statement on how well a design alternative or option performs regarding a specific goal. To
evaluate the results from different domains and priories, the results have to be weighted in the
direction of the project goal. This methodology with an appropriate precision is needed for the
controlled multi-disciplinary design. Variants or alternatives with the best score are selected as the basis
for the next development stage.
2. Level of Decomposition – define Key Performance Indicators (KPIs to-be):
The second decomposition takes place during the simulation and analysis tasks. The KPIs to-be are used
for comparing and ranking the later simulation results (KPIs as-is). To compare the design variants and
alternatives regarding their sustainable performance, relevant KPIs have to be introduced. For
elaborated comparisons, the simulation, Life Cycle Assessment (LCA) and Life Cycle Costing (LCC) experts
develop based on the requirements their KPIs to evaluate the performance in their field of expertise.
With KPIs to-be it is possible to make a statement on how well a design alternative or option performs
regarding the specific project goal. KPIs to-be are structured according to the ecological (final energy
and emissions), socio-cultural (thermal comfort and air quality) and economic (investment and
operational costs) target-quality, different alternatives can be compared to identify the one with the
best cost-quality ratio. KPIs to-be offer the possibility to quantify the performance of measurable
indicators as well as of qualitative indicators and have a direct link to the DVs.
The weighting factor describes on how much per cent the KPI is weighted in the decision value.
3. Level of Decomposition – define Key Design Parameters (KDPs to-be):
The KDPs to-be guide the design, by inclusion (reach the range) or exclusion (don't reach the range), and
are used for ruling out different design options. In the domain task level, where all domains start their
iterating working cycles, the KDPs to-be are used as target values for verification of the alternatives, for
tracking the design process. KDPs to-be represent the mandatory requirements and usually have a
limited value and have a direct link to the KPIs.
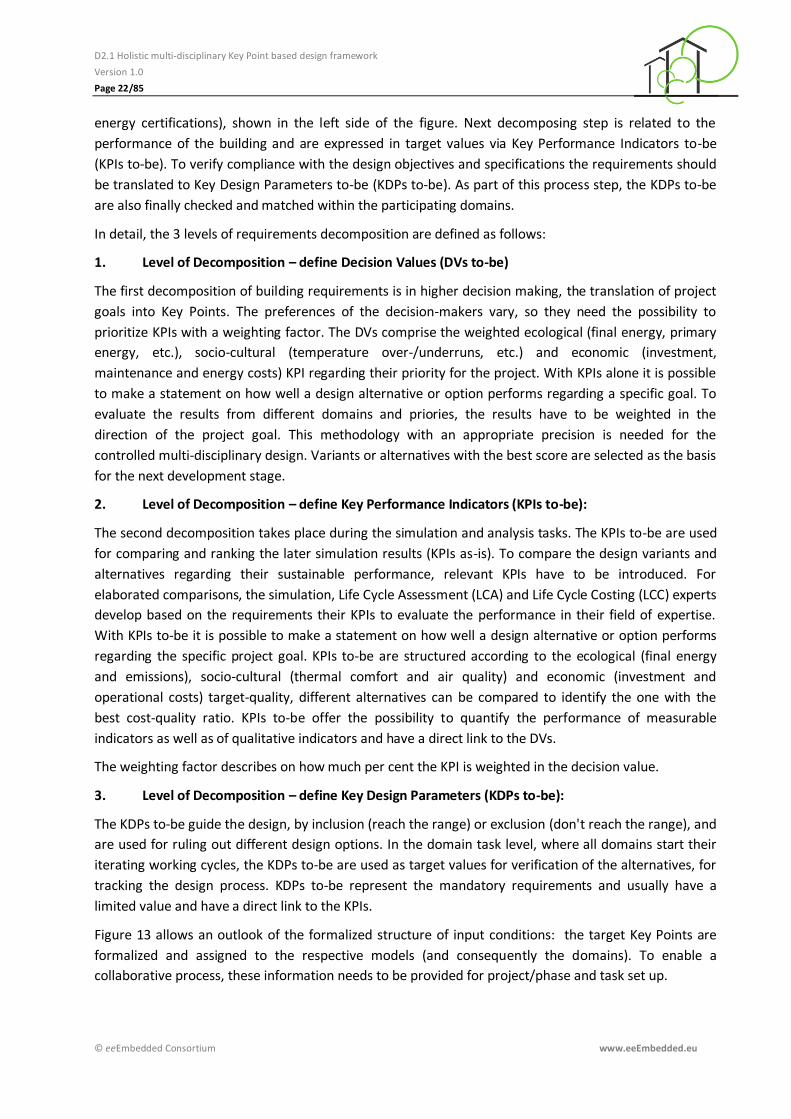
Figure 13 allows an outlook of the formalized structure of input conditions: the target Key Points are
formalized and assigned to the respective models (and consequently the domains). To enable a
collaborative process, these information needs to be provided for project/phase and task set up.
D2.1 Holistic multi-disciplinary Key Point based design framework
Version 1.0
Page 23/85
© eeEmbedded Consortium www.eeEmbedded.eu
Figure 13: Expected result: Formalized structure to provide input conditions (see example chapter 6)
Step 2: Process Tasks – Key Points as-is 3.2
This step embraces the II. Process Tasks which are already specified in deliverable D1.2 (Geißler et al,
2014b). After getting the I. Input conditions, the individual process task is performed (usually
consecutive design and simulation tasks.) Within this step, result producing related to the envisaged Key
Point is mandatory (see 4.4.2-4.4.4).
Related to the Key Points (KPs) it has to be clarified that:
The designers’ values, which are to be introduced by the designers domains after this working step, are expressed in Key Design Parameters as-is (KDPs as-is), see 4.4.
The simulation/analysis values, which are to be introduced by the simulation/analysts domains after this working step, are expressed in Key Performance Indicators as-is (KPIs as-is).
The decision values, which are to be introduced by the decision making domain after this working step, are expressed in Decision Values as-is (DVs as-is).
Step 3: Comparing KP to-be and KP as-is – Result Aggregation 3.3
Third step, in pattern formerly defined as III. Key Point contains the domain related comparing the
target and result values and is defined in 3 aggregation steps.
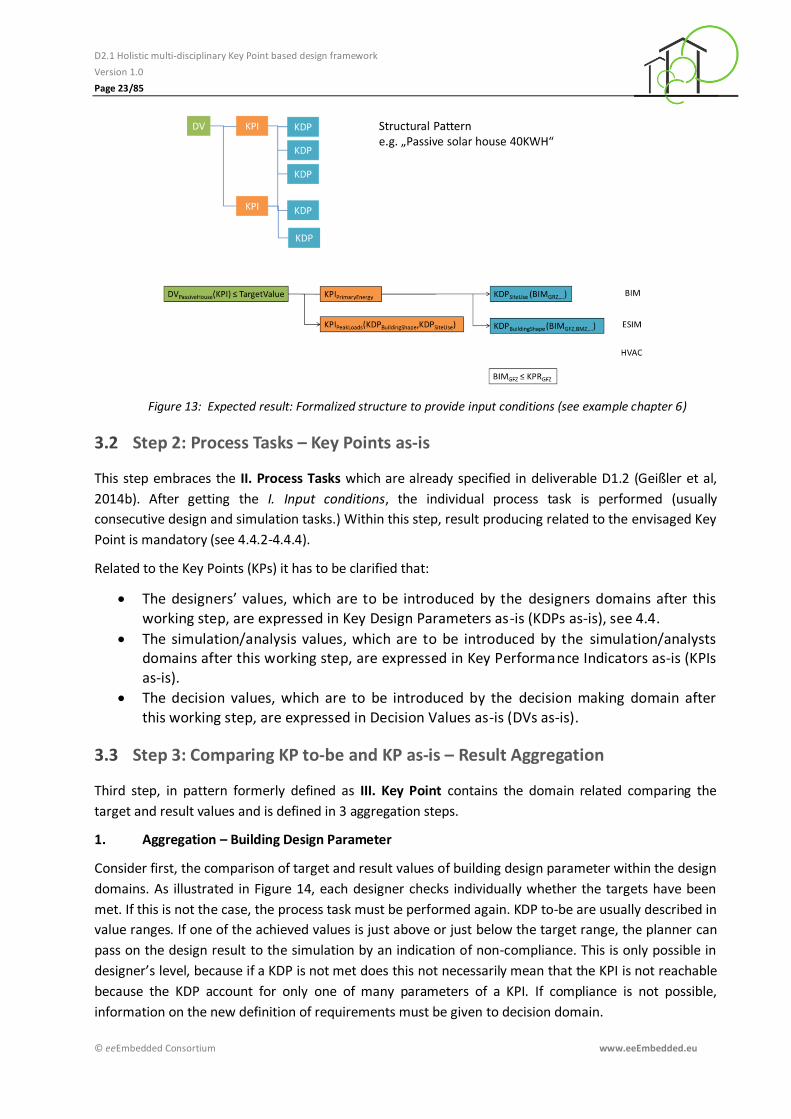
1. Aggregation – Building Design Parameter
Consider first, the comparison of target and result values of building design parameter within the design
domains. As illustrated in Figure 14, each designer checks individually whether the targets have been
met. If this is not the case, the process task must be performed again. KDP to-be are usually described in
value ranges. If one of the achieved values is just above or just below the target range, the planner can
pass on the design result to the simulation by an indication of non-compliance. This is only possible in
designer’s level, because if a KDP is not met does this not necessarily mean that the KPI is not reachable
because the KDP account for only one of many parameters of a KPI. If compliance is not possible,
information on the new definition of requirements must be given to decision domain.
D2.1 Holistic multi-disciplinary Key Point based design framework
Version 1.0
Page 24/85
© eeEmbedded Consortium www.eeEmbedded.eu
2. Aggregation – Ranked Performance Results
The second aggregation describes the ranking of simulations and cost analysis results. After each design
phase, the design is verified by energy simulations and compliance of the investment and lifecycle costs.
The compliance target value (Figure 14) describes how much per cent on the KPI has reached the
predicted value. The results are finally transmitted to the decision making domain. However, if the
desired target value of the KPI as-is not achieved, the requirements must to be re-examined and a
message to which the decision making domain are sent.
The full procedures are described in next chapter, 4.3.
Figure 14: Expected result: Formalized structure to provide input conditions (see example chapter 6)
3. Aggregation – Best Alternative
In the third aggregation describes the weighted evaluation the KPIs to the decision value. The
preferences of the decision-makers vary, so they need the possibility to priories KPI with a weighting
factor. The DV comprise the weighted ecologic (final energy, primary energy, GWP etc.), socio-cultural
(temperature over-/underruns, PMV/PPD etc.) and economic (investment, maintenance and energy
costs) KPI regarding their priority for the project. In this method, the decision value can be an e.g.
certification standard like passive house, DGNB etc. With KPIs alone it is possible to make a statement
how well a design alternative or option performs regarding a specific goal. To evaluate the results from
different domains and priories, the results have to be weighted in the direction of the project goal. If
design variants haven’t met the decision value, a request to the domains for optimization or revising the
requirements is send. This methodology with an appropriate precision is needed for the controlled
multi-disciplinary design. Variant or alternative with the best score is selected as the basis for the next
development stage.

D2.1 Holistic multi-disciplinary Key Point based design framework
Version 1.0
Page 25/85
© eeEmbedded Consortium www.eeEmbedded.eu
Step 4: Consistency Check – Key Point Revision 3.4
The IV. Output conditions have to be specified in this section. These are separated in mandatory and
optional sets. Mandatory sets are the results of the individual process task, expressed as KDP as-is, KPI
as-is and DV as-is. These values may have influence on the upcoming Key Points in the next stages. Thus,
after each design phase a Key Point revision is necessary. It is optional basis only, whether the Key
Points are changing.
D2.1 Holistic multi-disciplinary Key Point based design framework
Version 1.0
Page 26/85
© eeEmbedded Consortium www.eeEmbedded.eu
4 eeE Key Point Framework – Procedures
This chapter will describe the procedures that are part of the eeE Key Point Framework. As it was
explained previously in this document, procedures are one of the three pillars of eeE Key Point
Framework, together with concepts and software solutions.
Procedures are understood as sequences of activities or actions that must be followed to solve a
problem or accomplish a task. In this chapter, the following procedures will be defined:
Procedures to evaluate requirements and setup Key Points (KPs)
Procedures to evaluate design alternatives
Procedures for the overall Key Point Methodology. The sequence of the steps of the Key Point Workflow will be specified via UML. It will be divided into four views/patterns: setup, planners, simulation and decision making.
Evaluation Criteria and Procedures for Key Points 4.1
From the end-user point of view, there are several types of simulations and analysis which will influence
the evaluation criteria, the procedures and the usage of KPs:
1) Single simulation: every input parameter has a single value. Only one simulation is required. The objective is to do design alternatives analysis (AA) and compare different design options but every alternative is simulated separately.
2) Parametric simulation: one or more parameters have several values. A number of simulations are required
Alternatives Analysis (AA) to evaluate multiple design alternatives and compare them
Sensitivity Analysis (SA) to study the effect of the input parameters on the outputs o Local SA: the parameters are modified one by one o Global SA: the parameters are modified all at the same time
Uncertainty Analysis (UA). Stochastic simulations to study the influence that uncertainties have on outputs
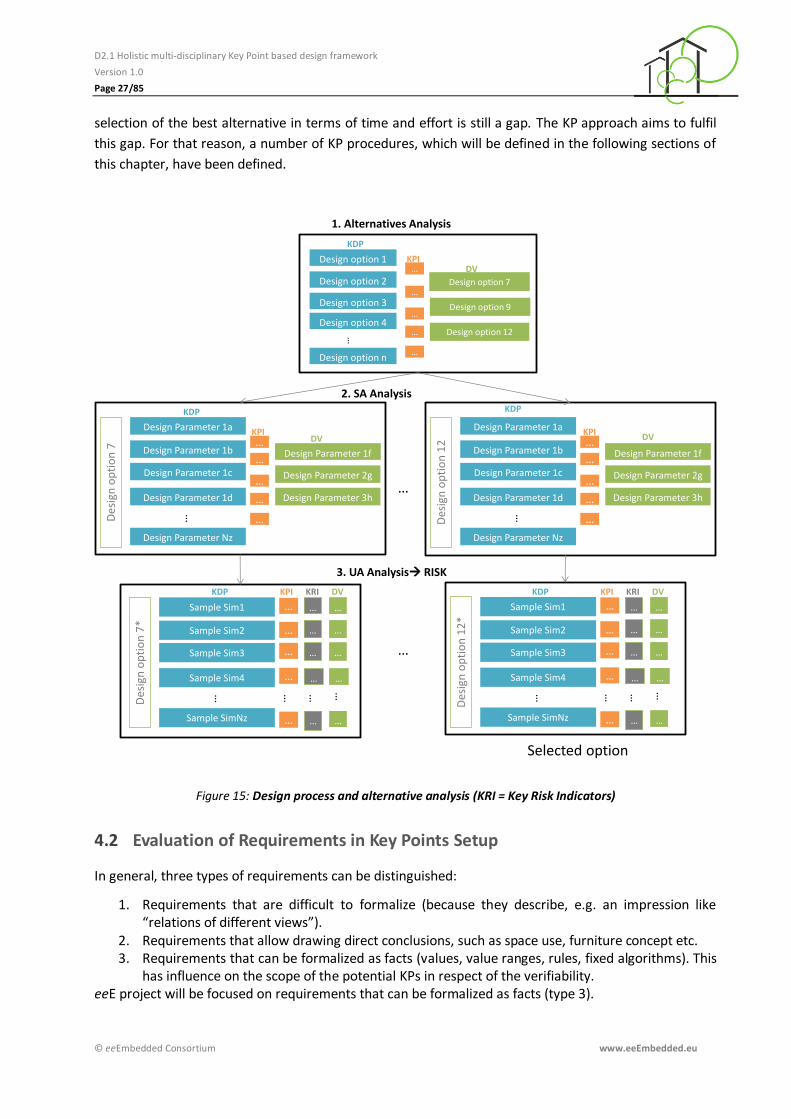
Normally, all these kinds of analysis are carried out among the design process. Figure 15 illustrates an
example of the steps to be followed by end-users. First of all, a set of parametric simulations is launched
to select the best design alternative based on KPs. Secondly, a sensitivity analysis is done to analyse the
influence of some specific parameters in the selected alternatives and find out their most optimal value
based on KPs. Thirdly, uncertainties are defined in the selected alternatives to analyse their risk and
decide the best design option based on KPs.
The usage and procedures of KPs will be defined for every type of analysis among eeE project. However,
this section is focused on design alternatives analysis based on Key Design Parameters (KDPs), Key
Performance Indicators (KPIs) and Decision Values (DVs); whereas key risk indicators (KRIs) will be
developed in WP 03 to cover SA and UA. KRIs, e.g. the mean time to failure, is a subgroup of KPIs and
follows the same methodology.
It must be highlighted that one of the challenges of the design process from the end-user point of view
and from the software point of view is to handle design alternatives and find the most optimal option
investing less time possible. In this line, parametric simulations are a very helpful approach as it allows
run simulations automatically after defining the values of the input parameters. However, the effective
D2.1 Holistic multi-disciplinary Key Point based design framework
Version 1.0
Page 27/85
© eeEmbedded Consortium www.eeEmbedded.eu
selection of the best alternative in terms of time and effort is still a gap. The KP approach aims to fulfil
this gap. For that reason, a number of KP procedures, which will be defined in the following sections of
this chapter, have been defined.
Figure 15: Design process and alternative analysis (KRI = Key Risk Indicators)
Evaluation of Requirements in Key Points Setup 4.2
In general, three types of requirements can be distinguished:
1. Requirements that are difficult to formalize (because they describe, e.g. an impression like “relations of different views”).
2. Requirements that allow drawing direct conclusions, such as space use, furniture concept etc. 3. Requirements that can be formalized as facts (values, value ranges, rules, fixed algorithms). This
has influence on the scope of the potential KPs in respect of the verifiability. eeE project will be focused on requirements that can be formalized as facts (type 3).
1. Alternatives Analysis
Design option 1
Design option 2
Design option 3
Design option 4
Design option n
…
Design option 7
Design option 9
Design option 12
2. SA Analysis
Design Parameter 1a
Design Parameter 1b
Design Parameter 1c
Design Parameter 1d
Design Parameter Nz
…
Design Parameter 1f
Design Parameter 2g
Design Parameter 3h
…
…
…
…
…
…
…
…
…
…Des
ign
op
tio
n7
Design Parameter 1a
Design Parameter 1b
Design Parameter 1c
Design Parameter 1d
Design Parameter Nz
…
Design Parameter 1f
Design Parameter 2g
Design Parameter 3h
…
…
…
…
…Des
ign
op
tio
n1
2
…
Sample Sim1
Sample Sim2
Sample Sim3
Sample Sim4
Sample SimNz
…
…
…
Des
ign
op
tio
n1
2*
…
…
…
…
…
…
…
…
… …
3. UA Analysis RISK
…
…
…
…
…
…
KDP
KPIDV
KDP
KPIDV
KDP
KPIDV
Sample Sim1
Sample Sim2
Sample Sim3
Sample Sim4
Sample SimNz
…
…
…
Des
ign
op
tio
n7
*
…
…
…
…
…
…
…
…
… …
…
…
…
…
…
…
…
KDP KPI DVKRI KDP KPI DVKRI
Selected option
D2.1 Holistic multi-disciplinary Key Point based design framework
Version 1.0
Page 28/85
© eeEmbedded Consortium www.eeEmbedded.eu
Procedure: requirements classification
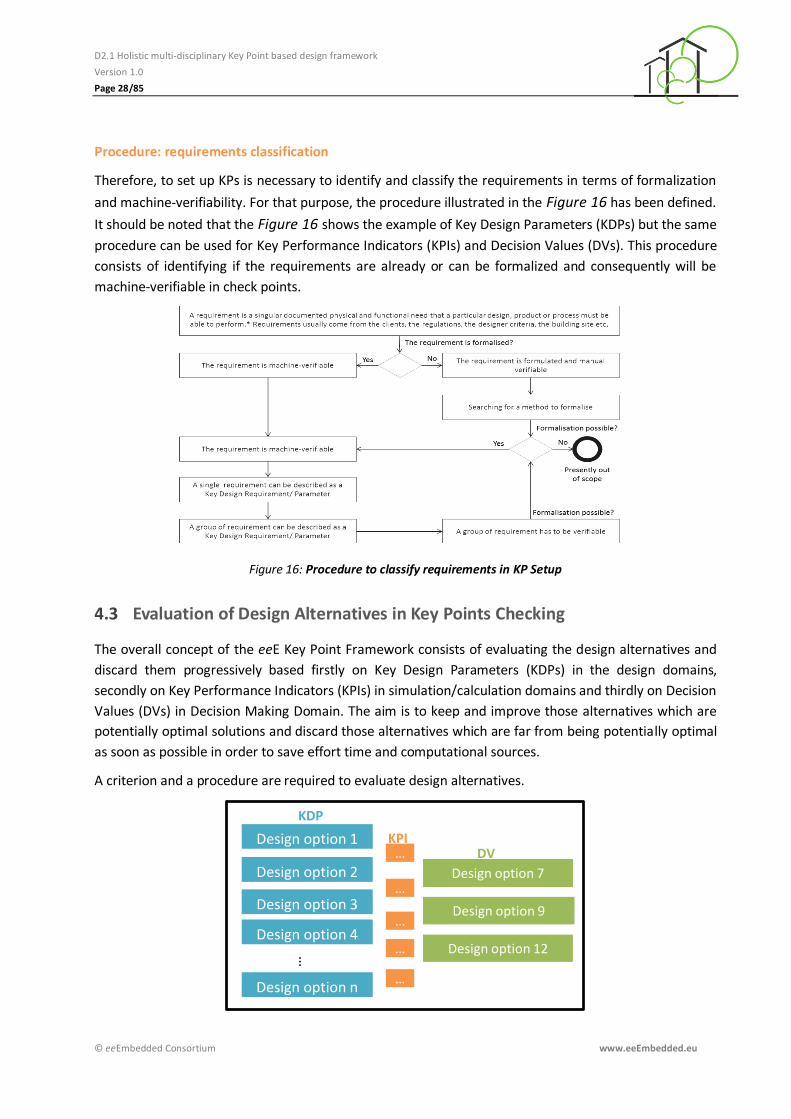
Therefore, to set up KPs is necessary to identify and classify the requirements in terms of formalization
and machine-verifiability. For that purpose, the procedure illustrated in the Figure 16 has been defined.
It should be noted that the Figure 16 shows the example of Key Design Parameters (KDPs) but the same
procedure can be used for Key Performance Indicators (KPIs) and Decision Values (DVs). This procedure
consists of identifying if the requirements are already or can be formalized and consequently will be
machine-verifiable in check points.
Figure 16: Procedure to classify requirements in KP Setup
Evaluation of Design Alternatives in Key Points Checking 4.3
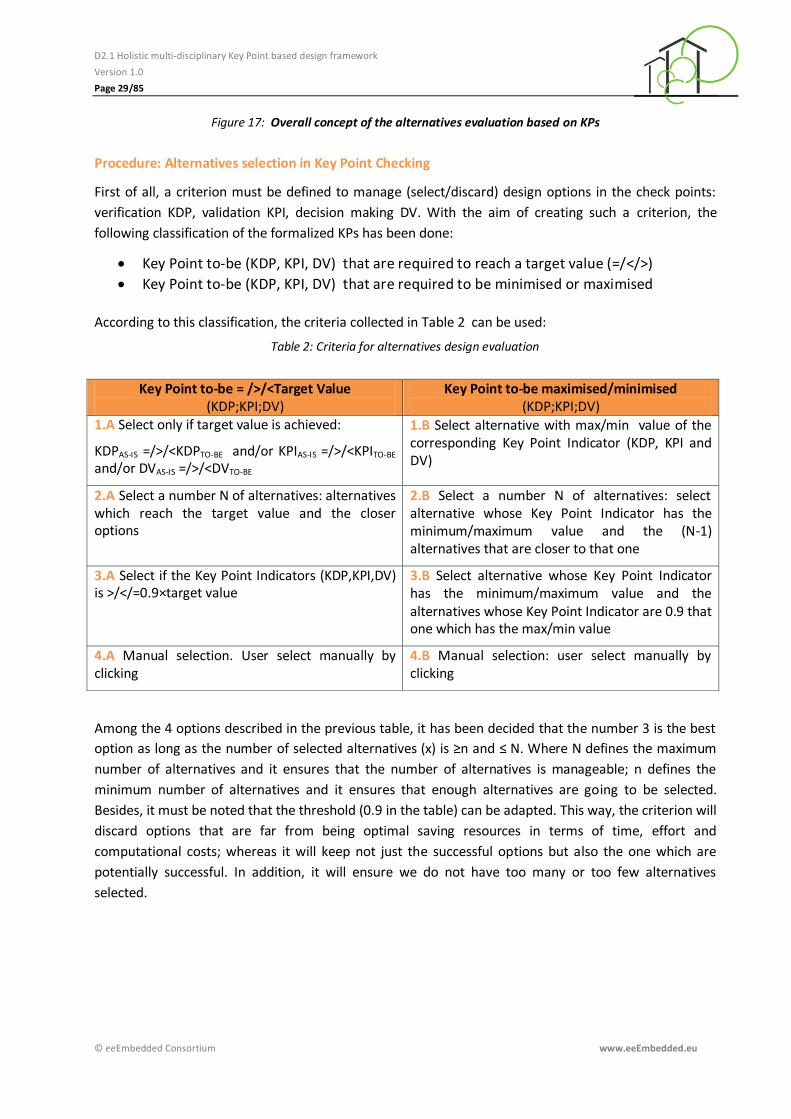
The overall concept of the eeE Key Point Framework consists of evaluating the design alternatives and
discard them progressively based firstly on Key Design Parameters (KDPs) in the design domains,
secondly on Key Performance Indicators (KPIs) in simulation/calculation domains and thirdly on Decision
Values (DVs) in Decision Making Domain. The aim is to keep and improve those alternatives which are
potentially optimal solutions and discard those alternatives which are far from being potentially optimal
as soon as possible in order to save effort time and computational sources.
A criterion and a procedure are required to evaluate design alternatives.
Design option 1
Design option 2
Design option 3
Design option 4
Design option n
…
Design option 7
Design option 9
Design option 12
…
…
…
…
…
KDP
KPIDV
D2.1 Holistic multi-disciplinary Key Point based design framework
Version 1.0
Page 29/85
© eeEmbedded Consortium www.eeEmbedded.eu
Figure 17: Overall concept of the alternatives evaluation based on KPs
Procedure: Alternatives selection in Key Point Checking
First of all, a criterion must be defined to manage (select/discard) design options in the check points:
verification KDP, validation KPI, decision making DV. With the aim of creating such a criterion, the
following classification of the formalized KPs has been done:
Key Point to-be (KDP, KPI, DV) that are required to reach a target value (=/</>)
Key Point to-be (KDP, KPI, DV) that are required to be minimised or maximised According to this classification, the criteria collected in Table 2 can be used:
Table 2: Criteria for alternatives design evaluation
Key Point to-be = />/<Target Value (KDP;KPI;DV)
Key Point to-be maximised/minimised (KDP;KPI;DV)
1.A Select only if target value is achieved:
KDPAS-IS =/>/<KDPTO-BE and/or KPIAS-IS =/>/<KPITO-BE and/or DVAS-IS =/>/<DVTO-BE
1.B Select alternative with max/min value of the corresponding Key Point Indicator (KDP, KPI and DV)
2.A Select a number N of alternatives: alternatives which reach the target value and the closer options
2.B Select a number N of alternatives: select alternative whose Key Point Indicator has the minimum/maximum value and the (N-1) alternatives that are closer to that one
3.A Select if the Key Point Indicators (KDP,KPI,DV) is >/</=0.9×target value
3.B Select alternative whose Key Point Indicator has the minimum/maximum value and the alternatives whose Key Point Indicator are 0.9 that one which has the max/min value
4.A Manual selection. User select manually by clicking
4.B Manual selection: user select manually by clicking
Among the 4 options described in the previous table, it has been decided that the number 3 is the best
option as long as the number of selected alternatives (x) is ≥n and ≤ N. Where N defines the maximum
number of alternatives and it ensures that the number of alternatives is manageable; n defines the
minimum number of alternatives and it ensures that enough alternatives are going to be selected.
Besides, it must be noted that the threshold (0.9 in the table) can be adapted. This way, the criterion will
discard options that are far from being optimal saving resources in terms of time, effort and
computational costs; whereas it will keep not just the successful options but also the one which are
potentially successful. In addition, it will ensure we do not have too many or too few alternatives
selected.
D2.1 Holistic multi-disciplinary Key Point based design framework
Version 1.0
Page 30/85
© eeEmbedded Consortium www.eeEmbedded.eu
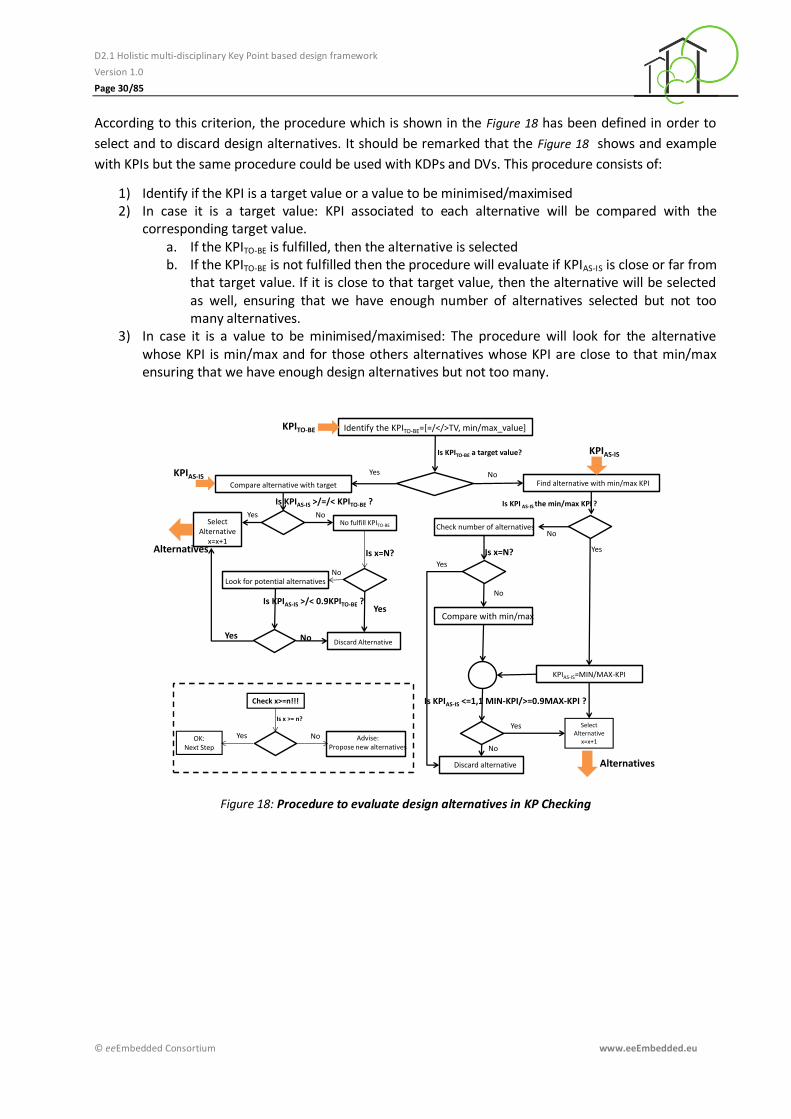
According to this criterion, the procedure which is shown in the Figure 18 has been defined in order to
select and to discard design alternatives. It should be remarked that the Figure 18 shows and example
with KPIs but the same procedure could be used with KDPs and DVs. This procedure consists of:
1) Identify if the KPI is a target value or a value to be minimised/maximised 2) In case it is a target value: KPI associated to each alternative will be compared with the
corresponding target value. a. If the KPITO-BE is fulfilled, then the alternative is selected b. If the KPITO-BE is not fulfilled then the procedure will evaluate if KPIAS-IS is close or far from
that target value. If it is close to that target value, then the alternative will be selected as well, ensuring that we have enough number of alternatives selected but not too many alternatives.
3) In case it is a value to be minimised/maximised: The procedure will look for the alternative whose KPI is min/max and for those others alternatives whose KPI are close to that min/max ensuring that we have enough design alternatives but not too many.
Figure 18: Procedure to evaluate design alternatives in KP Checking
Identify the KPITO-BE=[=/</>TV, min/max_value]
Is KPITO-BE a target value?
Compare alternative with target
Is KPIAS-IS >/=/< KPITO-BE ?
Select Alternative
x=x+1
No fulfill KPITO-BE
Is x=N?
Yes No
Discard Alternative
Look for potential alternatives
Is KPIAS-IS >/< 0.9KPITO-BE ?
No
Yes
Yes
Yes No
Find alternative with min/max KPI
Select Alternative
x=x+1
Is KPI AS-IS the min/max KPI ?
KPIAS-IS=MIN/MAX-KPI
Is KPIAS-IS <=1,1 MIN-KPI/>=0.9MAX-KPI ?
Discard alternative
Yes
Check number of alternatives
Compare with min/max
Is x=N?
No
No
Yes
Yes
No
Check x>=n!!!
No
Is x >= n?
No Advise:Propose new alternatives
YesOK:Next Step
KPITO-BE
KPIAS-IS
KPIAS-IS
Alternatives
Alternatives

D2.1 Holistic multi-disciplinary Key Point based design framework
Version 1.0
Page 31/85
© eeEmbedded Consortium www.eeEmbedded.eu
Key Point Workflow (UML) 4.4
The Key Point Workflow follows the same basic structure as the generic workflow in eeE Deliverable
D1.5 (Zellner et al, 2015). Whereas the main focus was on assigning (and defining) components for high
level project tasks, as well as their technical interactions in the eeE platform architecture, in this section
our focus is on technical translation of the developed Key Point Design Methodology.
The workflow method includes the following features: definition of all major tasks for execution of the
Key Point Design Methodology involving all processes and actors, then starting the discussion about
required basic and exceptional functionalities and to conclude and finally the assignment of potential
components to the major tasks. Subsequently, we will review the proposed components in the next
chapter (see 5.2-5.5), where we discussed with the developers all Key Point Design Methodology
requirements with regard to implementation possibilities. An excavated Key Point Architecture (see 5.1)
is determined based of the overall eeE system architecture.
The Key Point Workflow is worked out based on the project use case scenarios in Deliverable D1.2
(Geißler et al, 2014b). As well as the generic workflow, it is structured in the main task groups:
1. Key Point Setup View: the opening tasks of our use cases. This process is started by the decision maker who sets up the overall design goals in form of decision values and is respectively concluded by him after consistency check. All further participating domains entering their target values in the provided fields thereafter. This workflow is used by all eeE actors.
2. Key Point Designers’ View: the workflow describes the representative tasks of the planners’ level. The verification is discarding design options (KDPs as-is) by reducing those to the ones which meet the domain related KDPs to-be. This workflow is used for decision making by: architects, eSIM domain, HVAC domain, BACS and FM domain.
3. Key Point Simulation/Analysts’ View: includes the simulation domain, where experts perform the required simulations to optimise the design concepts; the LCA domain, where LCA consultants estimate the lifetime environmental impact and the LCC domain, for estimating the whole life cycle costs of the building and its systems. The domain-related decision making is described as comparing and/or ranking of simulation/ analysis results (KPI as-is) with assistance of KPIs to-be.
4. Key Point Decision makers’ View: the decision maker (developer/owner/ or one of the experts above, in some cases the architect) decides if the concept developed by the project team is worth implementing. This step is dedicated to the overall decision making, the prioritisation of decision criteria with goal oriented DVs (e.g. passive house or other standards).
D2.1 Holistic multi-disciplinary Key Point based design framework
Version 1.0
Page 32/85
© eeEmbedded Consortium www.eeEmbedded.eu
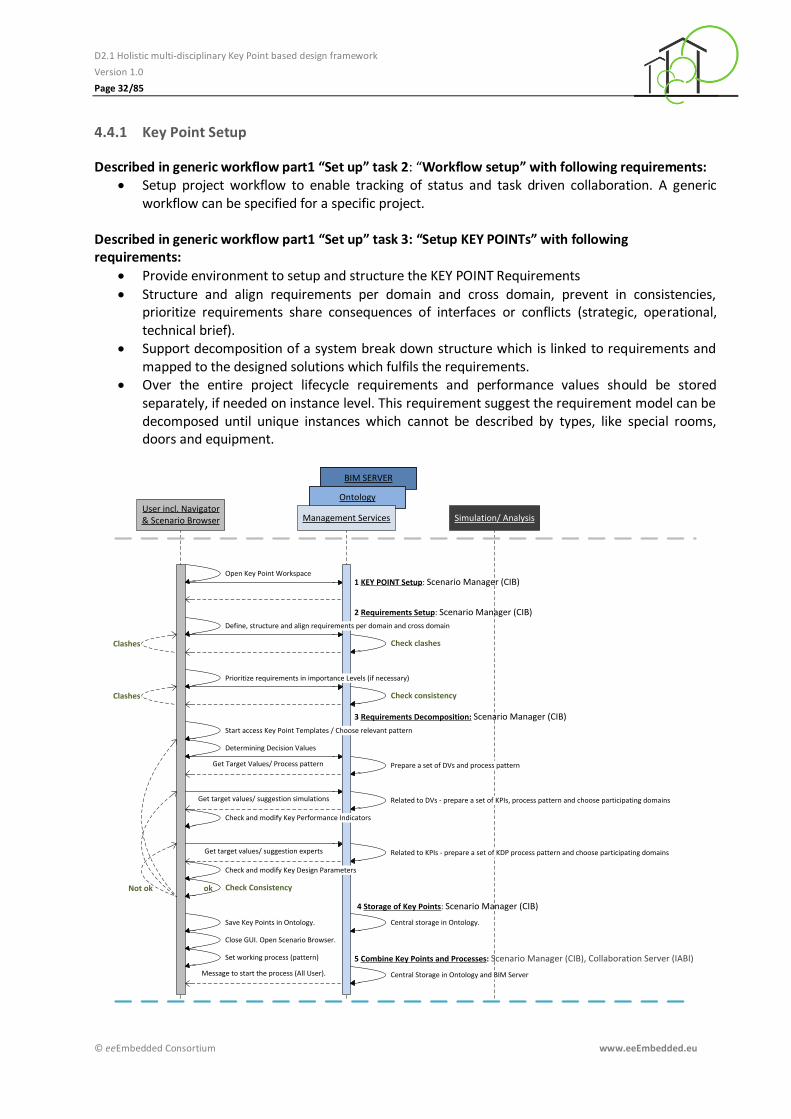
4.4.1 Key Point Setup
Described in generic workflow part1 “Set up” task 2: “Workflow setup” with following requirements: Setup project workflow to enable tracking of status and task driven collaboration. A generic
workflow can be specified for a specific project. Described in generic workflow part1 “Set up” task 3: “Setup KEY POINTs” with following requirements:
Provide environment to setup and structure the KEY POINT Requirements
Structure and align requirements per domain and cross domain, prevent in consistencies, prioritize requirements share consequences of interfaces or conflicts (strategic, operational, technical brief).
Support decomposition of a system break down structure which is linked to requirements and mapped to the designed solutions which fulfils the requirements.
Over the entire project lifecycle requirements and performance values should be stored separately, if needed on instance level. This requirement suggest the requirement model can be decomposed until unique instances which cannot be described by types, like special rooms, doors and equipment.
BIM SERVER
OntologyUser incl. Navigator& Scenario Browser Management Services Simulation/ Analysis
Determining Decision Values
Get Target Values/ Process pattern
Get target values/ suggestion simulations
1 KEY POINT Setup: Scenario Manager (CIB)
Get target values/ suggestion experts
Check clashes
Not ok ok
Prepare a set of DVs and process pattern
Related to DVs - prepare a set of KPIs, process pattern and choose participating domains
Related to KPIs - prepare a set of KDP process pattern and choose participating domains
Define, structure and align requirements per domain and cross domain
2 Requirements Setup: Scenario Manager (CIB)
Clashes
Prioritize requirements in importance Levels (if necessary)
Check consistency
Clashes
3 Requirements Decomposition: Scenario Manager (CIB) Start access Key Point Templates / Choose relevant pattern
Check Consistency
4 Storage of Key Points: Scenario Manager (CIB)
Set working process (pattern) 5 Combine Key Points and Processes: Scenario Manager (CIB), Collaboration Server (IABI)
Open Key Point Workspace
Check and modify Key Performance Indicators
Check and modify Key Design Parameters
Close GUI. Open Scenario Browser.
Save Key Points in Ontology. Central storage in Ontology.
Central Storage in Ontology and BIM ServerMessage to start the process (All User).
D2.1 Holistic multi-disciplinary Key Point based design framework
Version 1.0
Page 33/85
© eeEmbedded Consortium www.eeEmbedded.eu
Figure 19: KP Workflow "Setup"
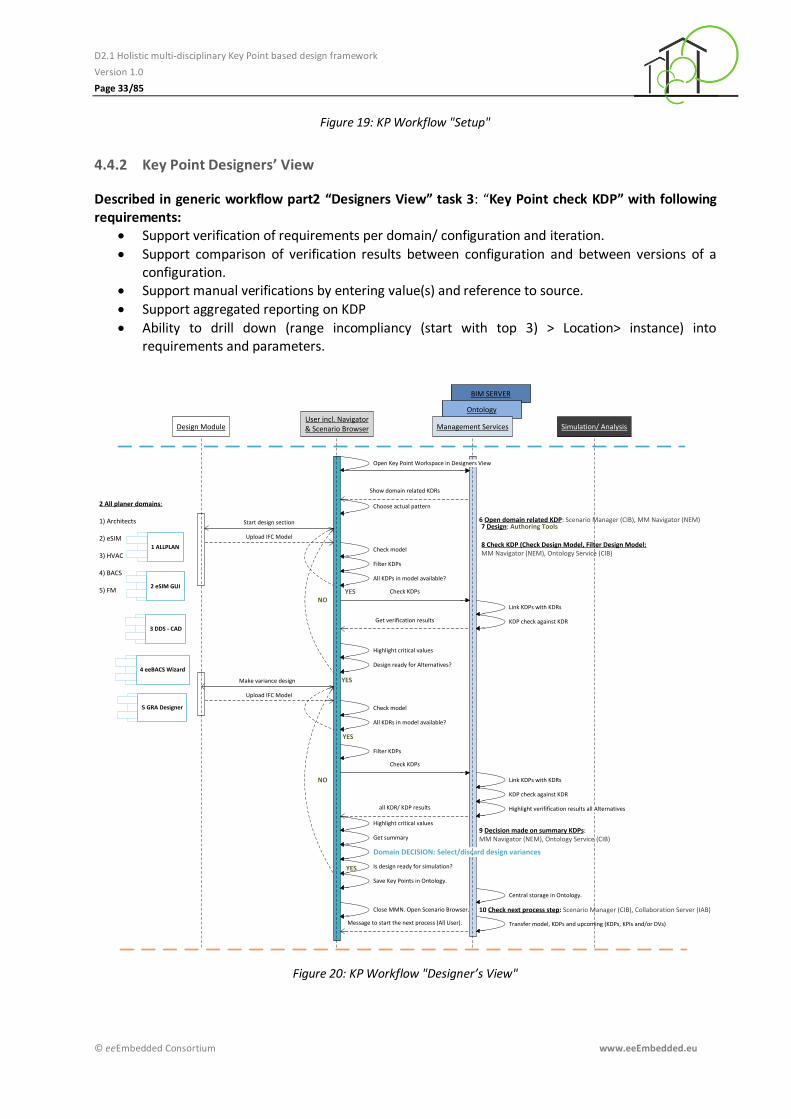
4.4.2 Key Point Designers’ View
Described in generic workflow part2 “Designers View” task 3: “Key Point check KDP” with following requirements:
Support verification of requirements per domain/ configuration and iteration.
Support comparison of verification results between configuration and between versions of a configuration.
Support manual verifications by entering value(s) and reference to source.
Support aggregated reporting on KDP
Ability to drill down (range incompliancy (start with top 3) > Location> instance) into requirements and parameters.
Is design ready for simulation?
Filter KDPs
Check KDPs
1 ALLPLAN
Choose actual pattern
all KDR/ KDP results
Highlight critical values
2 All planer domains:
1) Architects
2) eSIM
3) HVAC
4) BACS
5) FM
Check model
Start design section
Upload IFC Model
KDP check against KDR3 DDS - CAD
4 eeBACS Wizard
5 GRA Designer
YES
Get summary
NO
YES
Transfer model, KDPs and upcoming (KDPs, KPIs and/or DVs)
2 eSIM GUI
Make variance design
Upload IFC Model
Domain DECISION: Select/discard design variances
BIM SERVER
OntologyUser incl. Navigator& Scenario BrowserDesign Module Management Services Simulation/ Analysis
Open Key Point Workspace in Designers View
Show domain related KDRs
6 Open domain related KDP: Scenario Manager (CIB), MM Navigator (NEM)
All KDPs in model available?
YES
Link KDPs with KDRs
Get verification results
Highlight critical values
Design ready for Alternatives?
Filter KDPs
Check KDPs
Check model
All KDRs in model available?
YES
KDP check against KDR
Link KDPs with KDRs
Highlight verifification results all Alternatives
NO
7 Design: Authoring Tools
8 Check KDP (Check Design Model, Filter Design Model: MM Navigator (NEM), Ontology Service (CIB)
9 Decision made on summary KDPs: MM Navigator (NEM), Ontology Service (CIB)
10 Check next process step: Scenario Manager (CIB), Collaboration Server (IAB)
Close MMN. Open Scenario Browser.
Save Key Points in Ontology.
Central storage in Ontology.
Message to start the next process (All User).
Figure 20: KP Workflow "Designer’s View"
D2.1 Holistic multi-disciplinary Key Point based design framework
Version 1.0
Page 34/85
© eeEmbedded Consortium www.eeEmbedded.eu
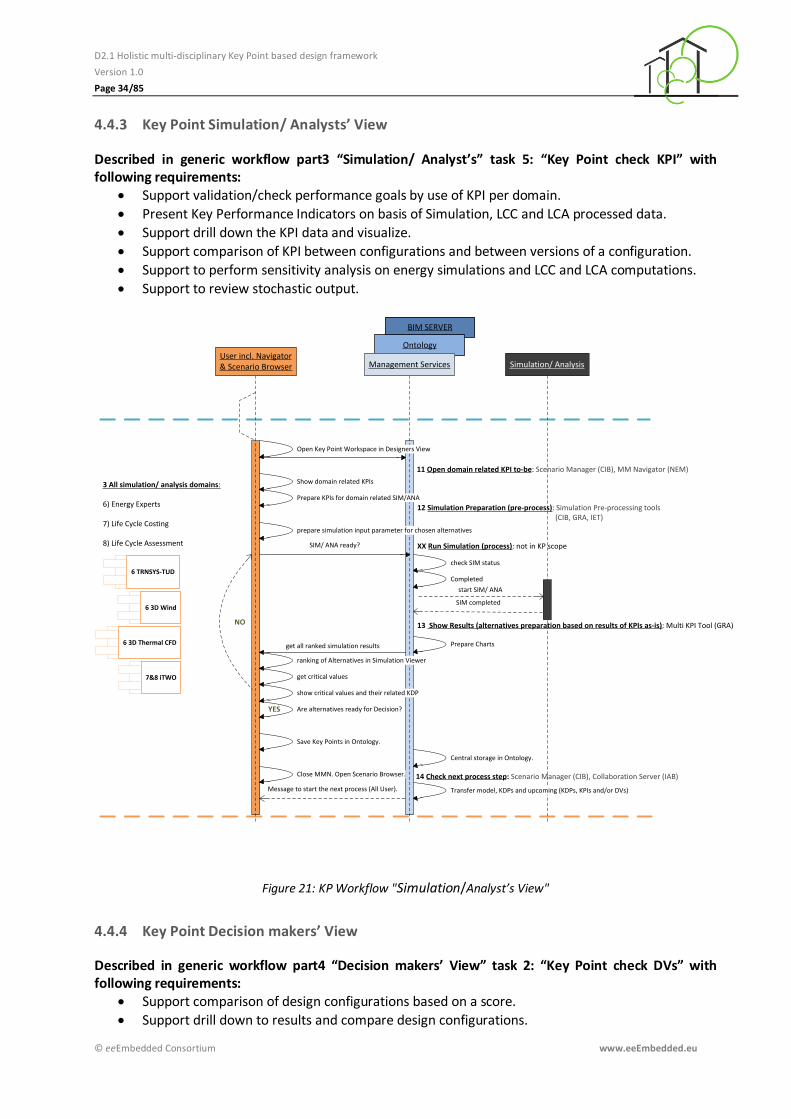
4.4.3 Key Point Simulation/ Analysts’ View
Described in generic workflow part3 “Simulation/ Analyst’s” task 5: “Key Point check KPI” with following requirements:
Support validation/check performance goals by use of KPI per domain.
Present Key Performance Indicators on basis of Simulation, LCC and LCA processed data.
Support drill down the KPI data and visualize.
Support comparison of KPI between configurations and between versions of a configuration.
Support to perform sensitivity analysis on energy simulations and LCC and LCA computations.
Support to review stochastic output.
BIM SERVER
OntologyUser incl. Navigator& Scenario Browser Management Services Simulation/ Analysis
Open Key Point Workspace in Designers View
11 Open domain related KPI to-be: Scenario Manager (CIB), MM Navigator (NEM)
start SIM/ ANA
SIM/ ANA ready?
SIM completed
check SIM status
get all ranked simulation results
prepare simulation input parameter for chosen alternatives
3 All simulation/ analysis domains:
6) Energy Experts
7) Life Cycle Costing
8) Life Cycle Assessment
6 TRNSYS-TUD
6 3D Wind
6 3D Thermal CFD
7&8 iTWO
Show domain related KPIs
Prepare KPIs for domain related SIM/ANA
Completed
Prepare Charts
ranking of Alternatives in Simulation Viewer
Are alternatives ready for Decision?
get critical values
show critical values and their related KDP
NO
YES
12 Simulation Preparation (pre-process): Simulation Pre-processing tools (CIB, GRA, IET)
XX Run Simulation (process): not in KP scope
13 Show Results (alternatives preparation based on results of KPIs as-is): Multi KPI Tool (GRA)
Transfer model, KDPs and upcoming (KDPs, KPIs and/or DVs)
14 Check next process step: Scenario Manager (CIB), Collaboration Server (IAB) Close MMN. Open Scenario Browser.
Save Key Points in Ontology.
Central storage in Ontology.
Message to start the next process (All User).
Figure 21: KP Workflow "Simulation/Analyst’s View"
4.4.4 Key Point Decision makers’ View
Described in generic workflow part4 “Decision makers’ View” task 2: “Key Point check DVs” with following requirements:
Support comparison of design configurations based on a score.
Support drill down to results and compare design configurations.
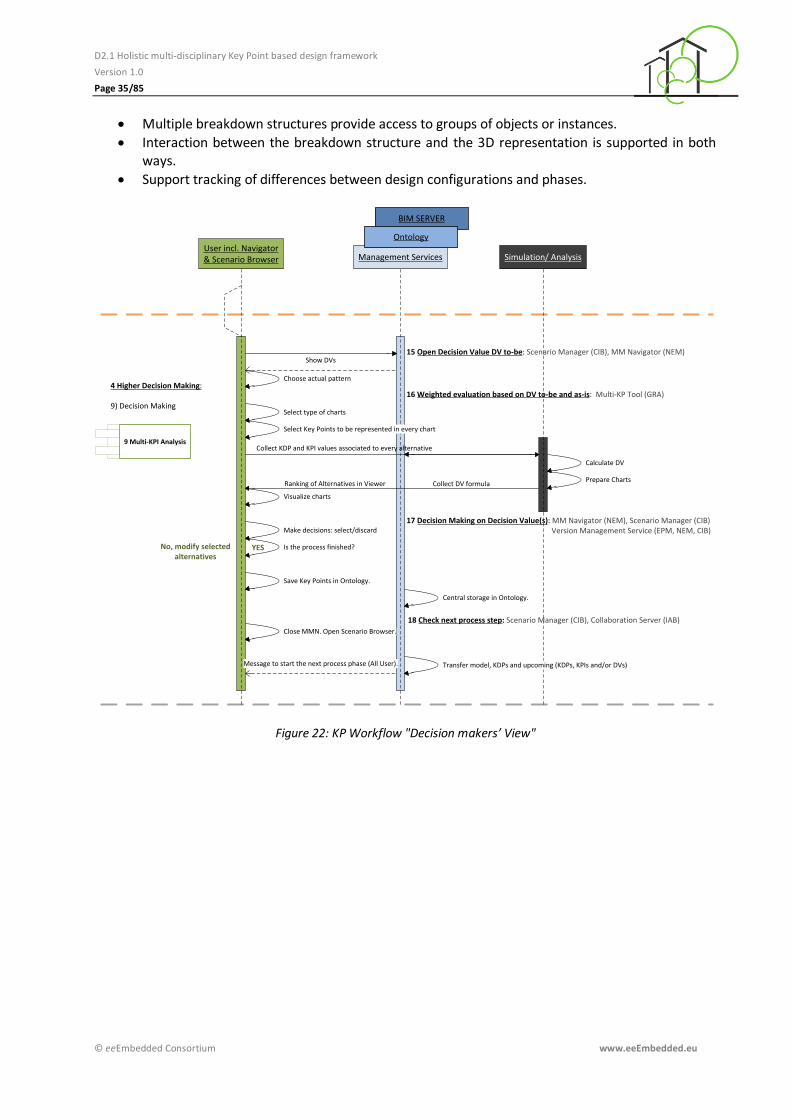
D2.1 Holistic multi-disciplinary Key Point based design framework
Version 1.0
Page 35/85
© eeEmbedded Consortium www.eeEmbedded.eu
Multiple breakdown structures provide access to groups of objects or instances.
Interaction between the breakdown structure and the 3D representation is supported in both ways.
Support tracking of differences between design configurations and phases.
Management Services
4 Higher Decision Making:
9) Decision Making
9 Multi-KPI Analysis
Select type of charts
Select Key Points to be represented in every chart
Visualize charts
Make decisions: select/discard
Is the process finished?YESNo, modify selected alternatives
Prepare Charts
Calculate DV
Collect KDP and KPI values associated to every alternative
Collect DV formulaRanking of Alternatives in Viewer
BIM SERVER
OntologyUser incl. Navigator& Scenario Browser Simulation/ Analysis
Choose actual pattern
Show DVs15 Open Decision Value DV to-be: Scenario Manager (CIB), MM Navigator (NEM)
16 Weighted evaluation based on DV to-be and as-is: Multi-KP Tool (GRA)
17 Decision Making on Decision Value(s): MM Navigator (NEM), Scenario Manager (CIB) Version Management Service (EPM, NEM, CIB)
Transfer model, KDPs and upcoming (KDPs, KPIs and/or DVs)
18 Check next process step: Scenario Manager (CIB), Collaboration Server (IAB) Close MMN. Open Scenario Browser.
Save Key Points in Ontology.
Central storage in Ontology.
Message to start the next process phase (All User).
Figure 22: KP Workflow "Decision makers’ View"
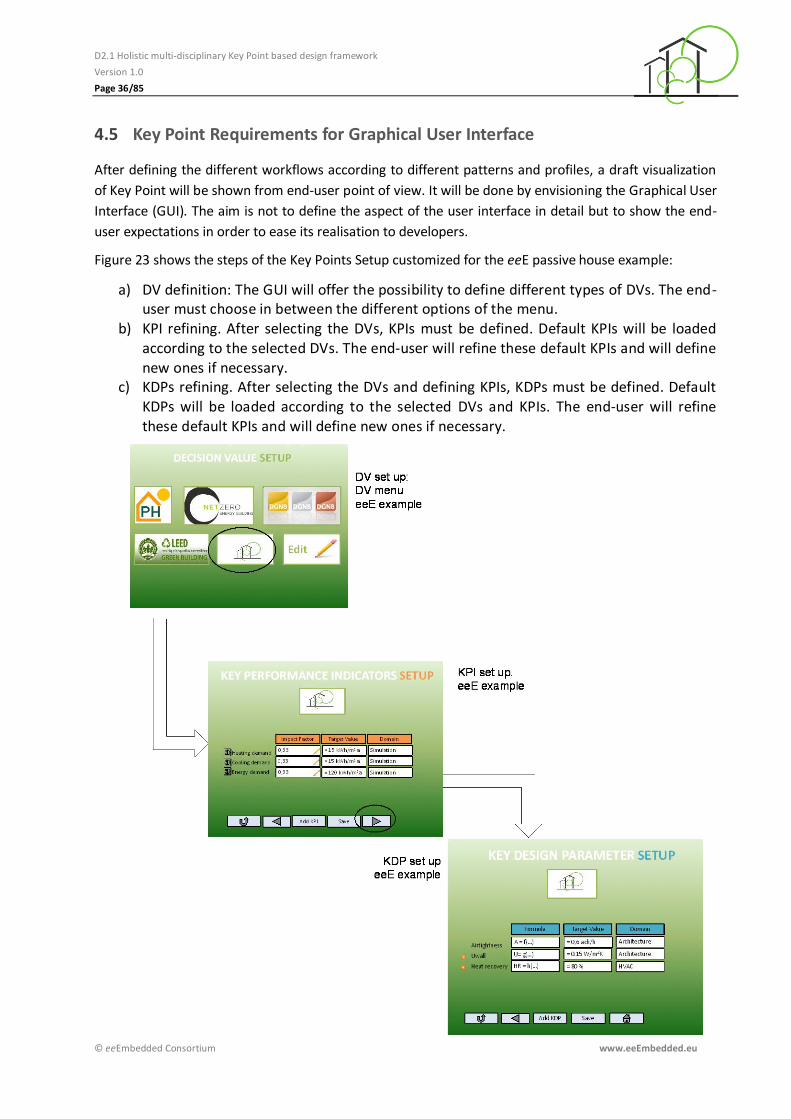
D2.1 Holistic multi-disciplinary Key Point based design framework
Version 1.0
Page 36/85
© eeEmbedded Consortium www.eeEmbedded.eu
Key Point Requirements for Graphical User Interface 4.5
After defining the different workflows according to different patterns and profiles, a draft visualization
of Key Point will be shown from end-user point of view. It will be done by envisioning the Graphical User
Interface (GUI). The aim is not to define the aspect of the user interface in detail but to show the end-
user expectations in order to ease its realisation to developers.
Figure 23 shows the steps of the Key Points Setup customized for the eeE passive house example:
a) DV definition: The GUI will offer the possibility to define different types of DVs. The end-user must choose in between the different options of the menu.
b) KPI refining. After selecting the DVs, KPIs must be defined. Default KPIs will be loaded according to the selected DVs. The end-user will refine these default KPIs and will define new ones if necessary.
c) KDPs refining. After selecting the DVs and defining KPIs, KDPs must be defined. Default KDPs will be loaded according to the selected DVs and KPIs. The end-user will refine these default KPIs and will define new ones if necessary.
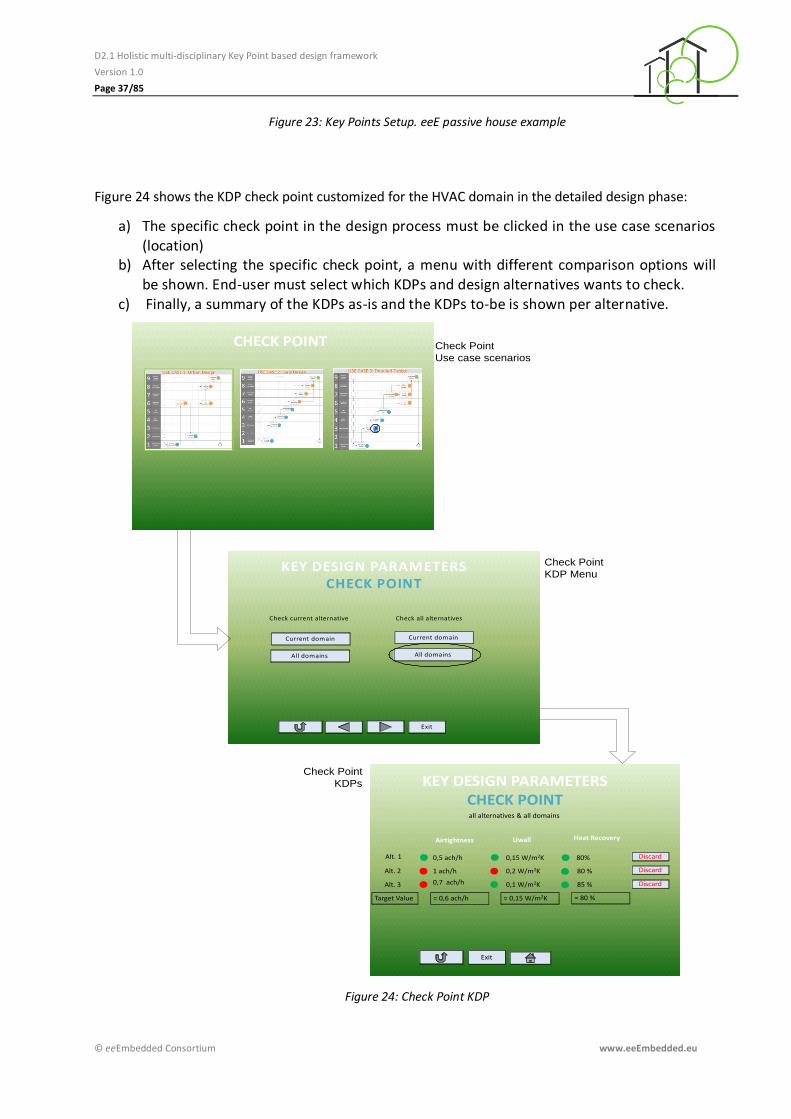
D2.1 Holistic multi-disciplinary Key Point based design framework
Version 1.0
Page 37/85
© eeEmbedded Consortium www.eeEmbedded.eu
Figure 23: Key Points Setup. eeE passive house example
Figure 24 shows the KDP check point customized for the HVAC domain in the detailed design phase:
a) The specific check point in the design process must be clicked in the use case scenarios (location)
b) After selecting the specific check point, a menu with different comparison options will be shown. End-user must select which KDPs and design alternatives wants to check.
c) Finally, a summary of the KDPs as-is and the KDPs to-be is shown per alternative.
Figure 24: Check Point KDP
CHECK POINT
X
KEY DESIGN PARAMETERS CHECK POINT
Check current alternative Check all alternatives
Current domain
All domains
Current domain
All domains
Exit
KEY DESIGN PARAMETERS CHECK POINT
Exit
all alternatives & all domains
Alt. 1
Alt. 2
Alt. 3
= 0,6 ach/h = 80 %= 0,15 W/m2KTarget Value
Airtightness Uwall Heat Recovery
0,5 ach/h
1 ach/h
0,7 ach/h
0,15 W/m2K
0,2 W/m2K
0,1 W/m2K
80%
80 %
85 %
Discard
Discard
Discard
Check Point
Use case scenarios
Check Point
KDP Menu
Check Point
KDPs
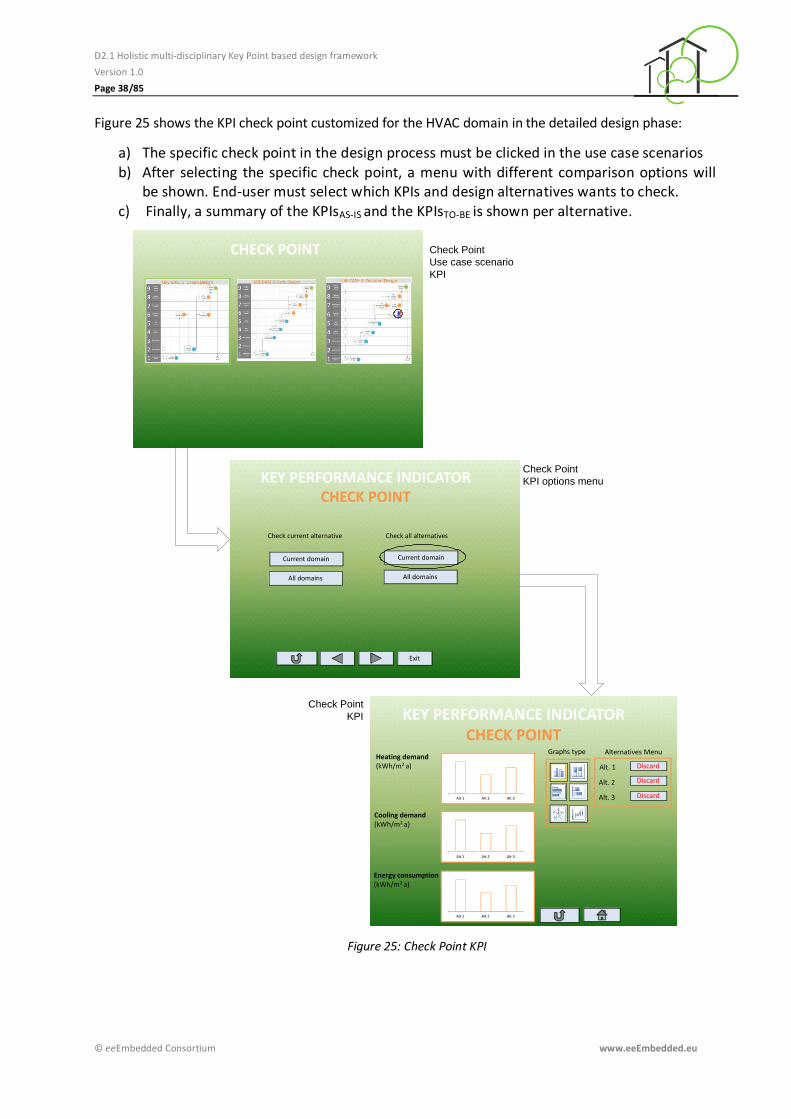
D2.1 Holistic multi-disciplinary Key Point based design framework
Version 1.0
Page 38/85
© eeEmbedded Consortium www.eeEmbedded.eu
Figure 25 shows the KPI check point customized for the HVAC domain in the detailed design phase:
a) The specific check point in the design process must be clicked in the use case scenarios b) After selecting the specific check point, a menu with different comparison options will
be shown. End-user must select which KPIs and design alternatives wants to check. c) Finally, a summary of the KPIsAS-IS and the KPIsTO-BE is shown per alternative.
Figure 25: Check Point KPI
CHECK POINT
X
KEY PERFORMANCE INDICATOR CHECK POINT
Check current alternative Check all alternatives
Current domain
All domains
Current domain
All domains
Exit
KEY PERFORMANCE INDICATOR CHECK POINT
Heating demand(kWh/m2 a)
Cooling demand(kWh/m2 a)
Energy consumption(kWh/m2 a)
Alt 1 Alt 2 Alt 3
Alt 1 Alt 2 Alt 3
Alt 1 Alt 2 Alt 3
Graphs type
Discard
Discard
Discard
Alt. 1
Alt. 2
Alt. 3
Alternatives Menu
Check Point
Use case scenario
KPI
Check Point
KPI options menu
Check Point
KPI
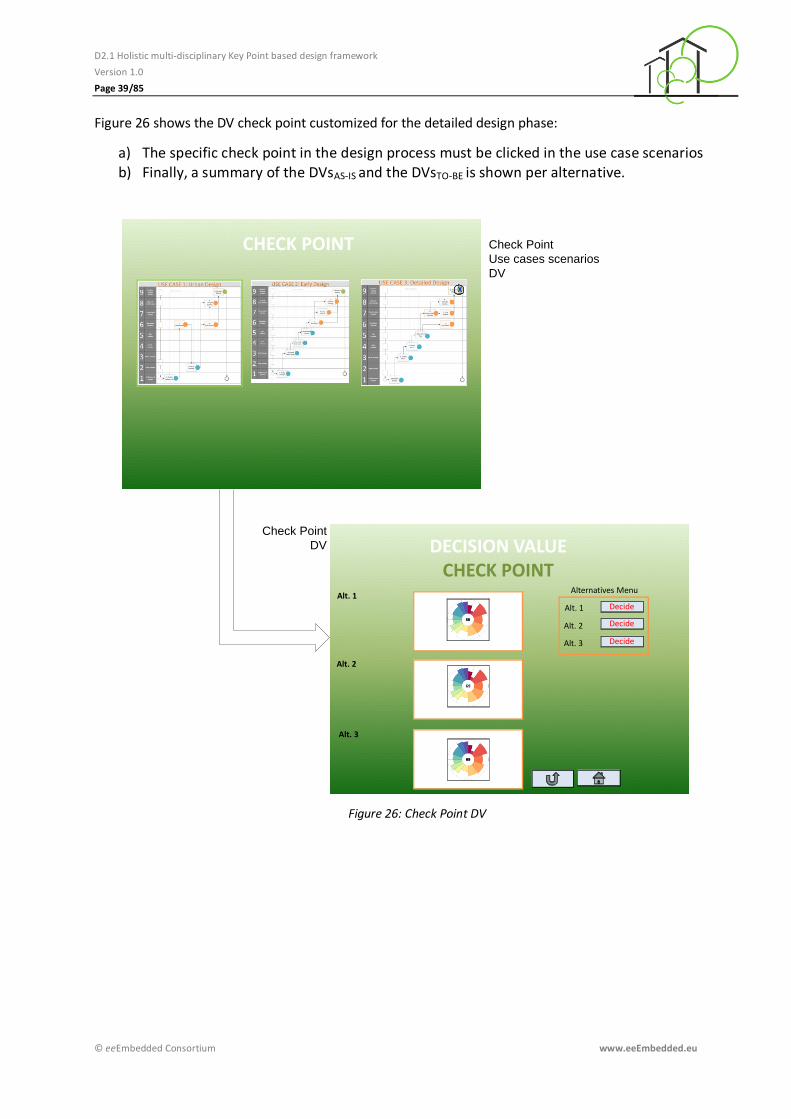
D2.1 Holistic multi-disciplinary Key Point based design framework
Version 1.0
Page 39/85
© eeEmbedded Consortium www.eeEmbedded.eu
Figure 26 shows the DV check point customized for the detailed design phase:
a) The specific check point in the design process must be clicked in the use case scenarios b) Finally, a summary of the DVsAS-IS and the DVsTO-BE is shown per alternative.
Figure 26: Check Point DV
CHECK POINT
X
DECISION VALUE CHECK POINT
Alt. 1
Alt. 2
Alt. 3
Decide
Decide
Decide
Alt. 1
Alt. 2
Alt. 3
Alternatives Menu
Check Point
Use cases scenarios
DV
Check Point
DV
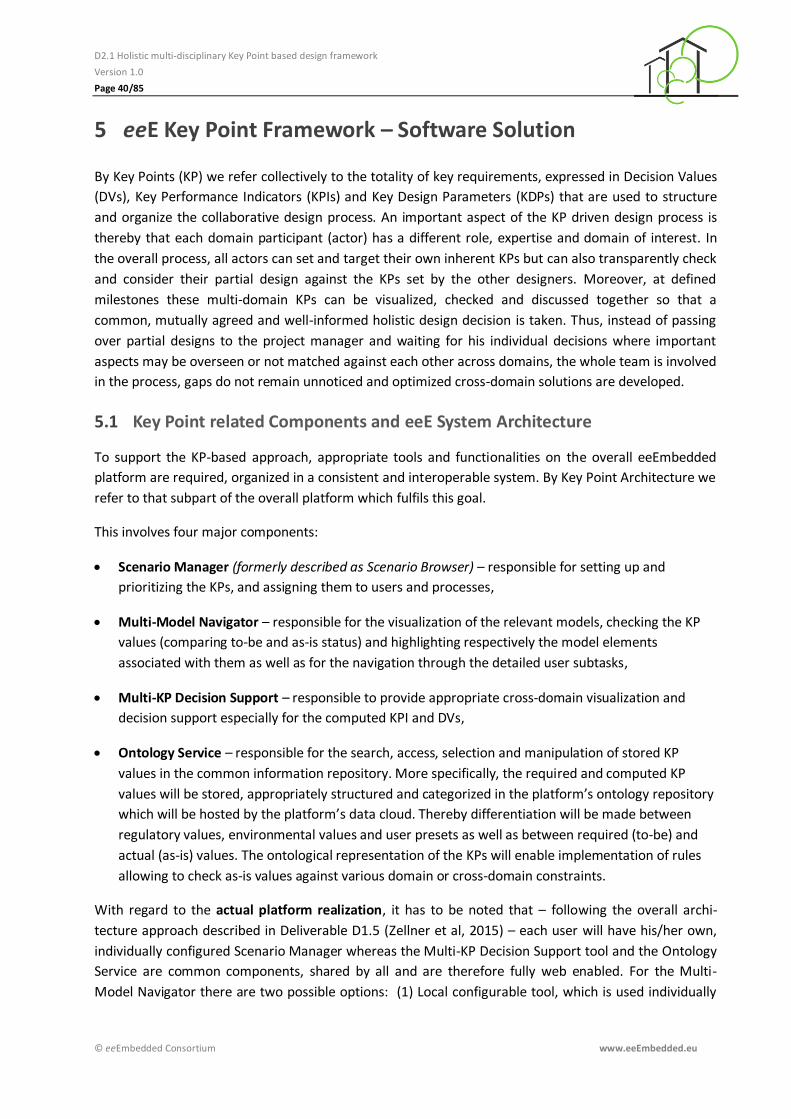
D2.1 Holistic multi-disciplinary Key Point based design framework
Version 1.0
Page 40/85
© eeEmbedded Consortium www.eeEmbedded.eu
5 eeE Key Point Framework – Software Solution
By Key Points (KP) we refer collectively to the totality of key requirements, expressed in Decision Values
(DVs), Key Performance Indicators (KPIs) and Key Design Parameters (KDPs) that are used to structure
and organize the collaborative design process. An important aspect of the KP driven design process is
thereby that each domain participant (actor) has a different role, expertise and domain of interest. In
the overall process, all actors can set and target their own inherent KPs but can also transparently check
and consider their partial design against the KPs set by the other designers. Moreover, at defined
milestones these multi-domain KPs can be visualized, checked and discussed together so that a
common, mutually agreed and well-informed holistic design decision is taken. Thus, instead of passing
over partial designs to the project manager and waiting for his individual decisions where important
aspects may be overseen or not matched against each other across domains, the whole team is involved
in the process, gaps do not remain unnoticed and optimized cross-domain solutions are developed.
Key Point related Components and eeE System Architecture 5.1
To support the KP-based approach, appropriate tools and functionalities on the overall eeEmbedded
platform are required, organized in a consistent and interoperable system. By Key Point Architecture we
refer to that subpart of the overall platform which fulfils this goal.
This involves four major components:
Scenario Manager (formerly described as Scenario Browser) – responsible for setting up and
prioritizing the KPs, and assigning them to users and processes,
Multi-Model Navigator – responsible for the visualization of the relevant models, checking the KP
values (comparing to-be and as-is status) and highlighting respectively the model elements
associated with them as well as for the navigation through the detailed user subtasks,
Multi-KP Decision Support – responsible to provide appropriate cross-domain visualization and
decision support especially for the computed KPI and DVs,
Ontology Service – responsible for the search, access, selection and manipulation of stored KP
values in the common information repository. More specifically, the required and computed KP
values will be stored, appropriately structured and categorized in the platform’s ontology repository
which will be hosted by the platform’s data cloud. Thereby differentiation will be made between
regulatory values, environmental values and user presets as well as between required (to-be) and
actual (as-is) values. The ontological representation of the KPs will enable implementation of rules
allowing to check as-is values against various domain or cross-domain constraints.
With regard to the actual platform realization, it has to be noted that – following the overall archi-
tecture approach described in Deliverable D1.5 (Zellner et al, 2015) – each user will have his/her own,
individually configured Scenario Manager whereas the Multi-KP Decision Support tool and the Ontology
Service are common components, shared by all and are therefore fully web enabled. For the Multi-
Model Navigator there are two possible options: (1) Local configurable tool, which is used individually
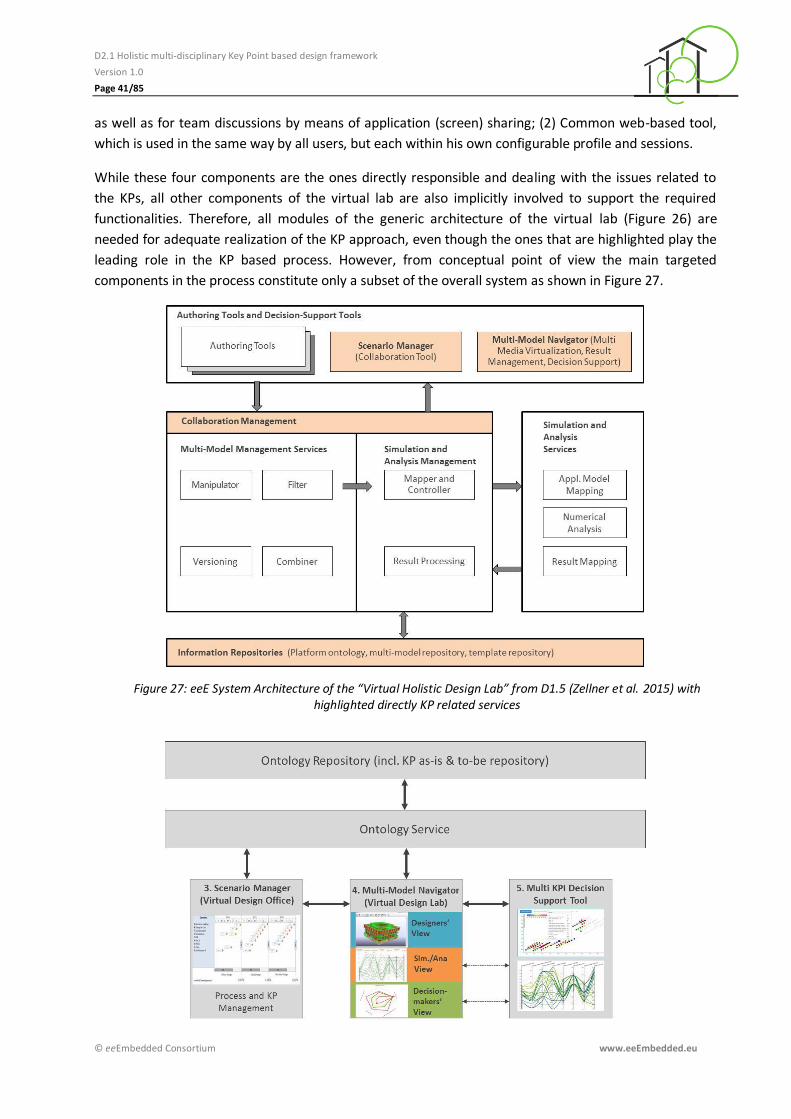
D2.1 Holistic multi-disciplinary Key Point based design framework
Version 1.0
Page 41/85
© eeEmbedded Consortium www.eeEmbedded.eu
as well as for team discussions by means of application (screen) sharing; (2) Common web-based tool,
which is used in the same way by all users, but each within his own configurable profile and sessions.
While these four components are the ones directly responsible and dealing with the issues related to
the KPs, all other components of the virtual lab are also implicitly involved to support the required
functionalities. Therefore, all modules of the generic architecture of the virtual lab (Figure 26) are
needed for adequate realization of the KP approach, even though the ones that are highlighted play the
leading role in the KP based process. However, from conceptual point of view the main targeted
components in the process constitute only a subset of the overall system as shown in Figure 27.
Figure 27: eeE System Architecture of the “Virtual Holistic Design Lab” from D1.5 (Zellner et al. 2015) with highlighted directly KP related services

D2.1 Holistic multi-disciplinary Key Point based design framework
Version 1.0
Page 42/85
© eeEmbedded Consortium www.eeEmbedded.eu
Figure 28: Conceptual view of the Key Point Architecture
In the following sections the specific functions that need to be supported are detailed on the basis of
the overall Key Point Workflow. Note that this workflow regards in similar manner all users and all
envisaged scenarios. Therefore, the workflow is structured in 4 parts: first part follows the opening tasks
of our use cases: the KP Setup. This process is started by the Project Manager who sets up the overall
design goals in form of DVs and is respectively concluded by him. All further participating domains
entering their target values in the provided fields thereafter. The second, third and fourth part of the
workflow describes exemplary the required tasks of the actors levels: planners, simulation and analysis
experts as well as Decision Makers. Thus, where e.g. in second part an authoring tool is involved it can
be architectural CAD (ALLPLAN), building services CAD (DDS-CAD), facility management CAD (Granlund
Designer) etc.
Remark regarding the following workflow tables: It was decided that all requests are serviced using the
PULL principle. Therefore, only where relevant a PUSH (as exception) should be noted. Default is PULL.
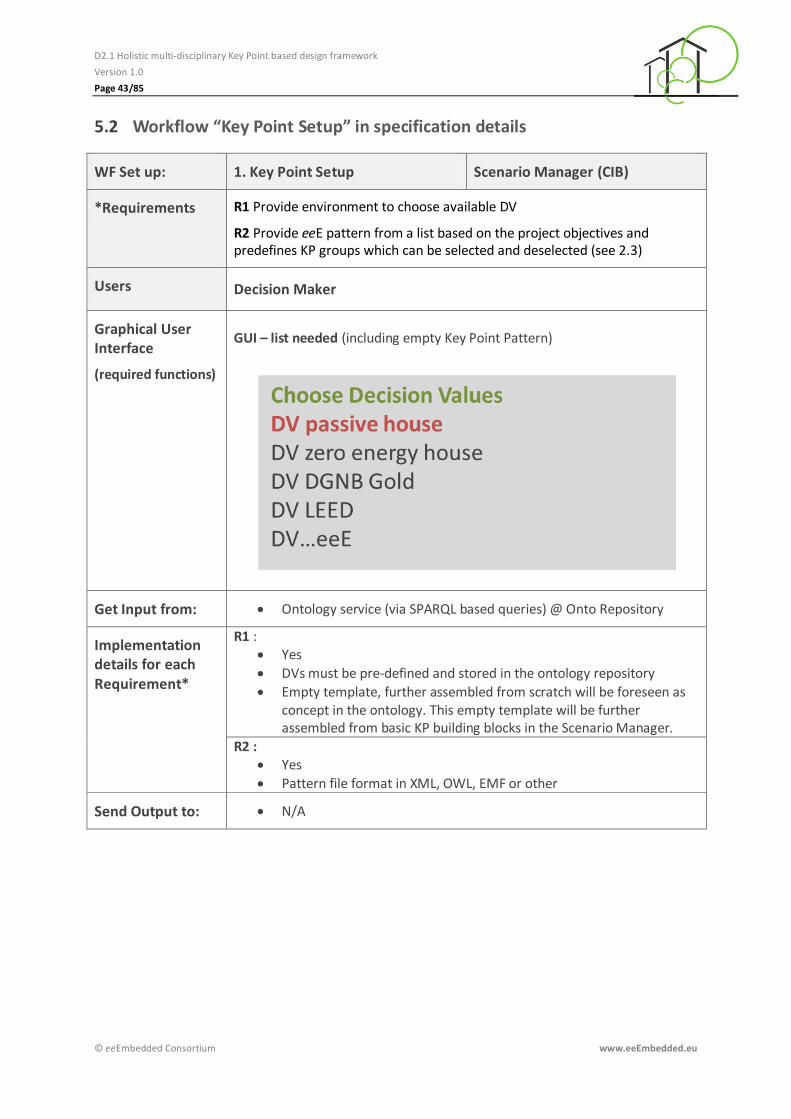
D2.1 Holistic multi-disciplinary Key Point based design framework
Version 1.0
Page 43/85
© eeEmbedded Consortium www.eeEmbedded.eu
Workflow “Key Point Setup” in specification details 5.2
WF Set up: 1. Key Point Setup Scenario Manager (CIB)
*Requirements R1 Provide environment to choose available DV
R2 Provide eeE pattern from a list based on the project objectives and predefines KP groups which can be selected and deselected (see 2.3)
Users Decision Maker
Graphical User Interface
(required functions)
GUI – list needed (including empty Key Point Pattern)
Get Input from: Ontology service (via SPARQL based queries) @ Onto Repository
Implementation details for each Requirement*
R1 : Yes
DVs must be pre-defined and stored in the ontology repository
Empty template, further assembled from scratch will be foreseen as concept in the ontology. This empty template will be further assembled from basic KP building blocks in the Scenario Manager.
R2 : Yes
Pattern file format in XML, OWL, EMF or other
Send Output to: N/A
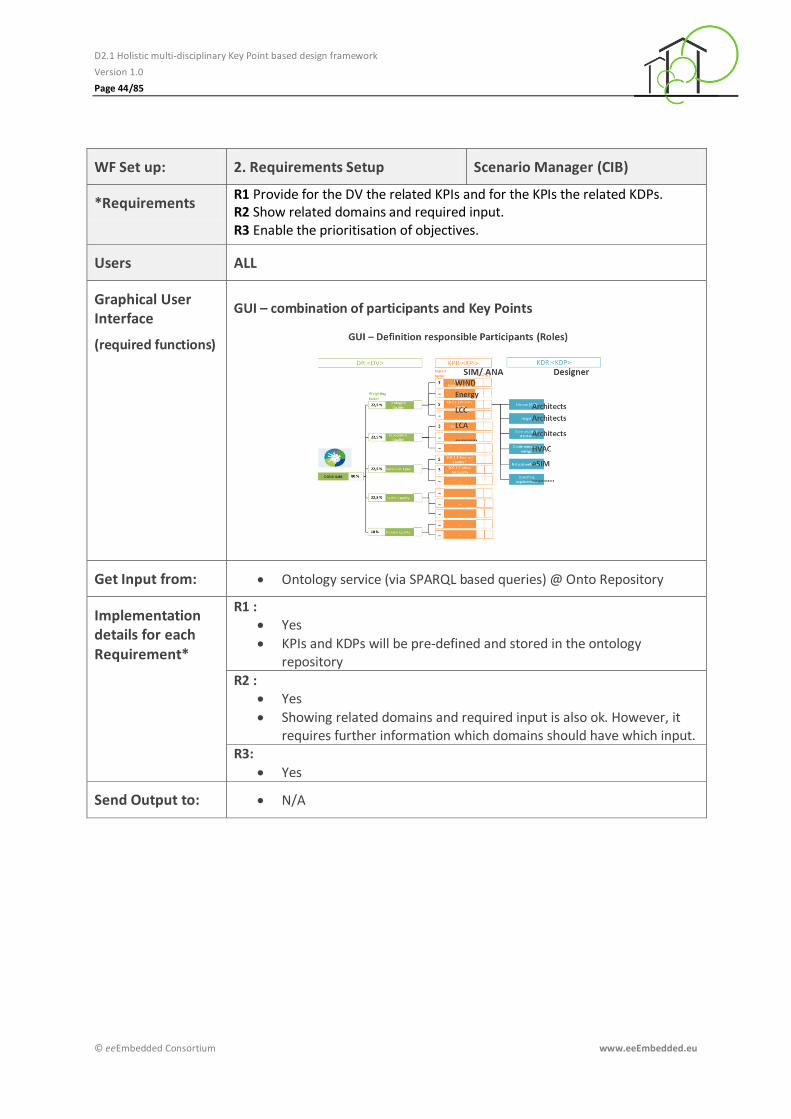
D2.1 Holistic multi-disciplinary Key Point based design framework
Version 1.0
Page 44/85
© eeEmbedded Consortium www.eeEmbedded.eu
WF Set up: 2. Requirements Setup Scenario Manager (CIB)
*Requirements R1 Provide for the DV the related KPIs and for the KPIs the related KDPs. R2 Show related domains and required input. R3 Enable the prioritisation of objectives.
Users ALL
Graphical User Interface
(required functions)
GUI – combination of participants and Key Points
Get Input from: Ontology service (via SPARQL based queries) @ Onto Repository
Implementation details for each Requirement*
R1 : Yes
KPIs and KDPs will be pre-defined and stored in the ontology repository
R2 : Yes
Showing related domains and required input is also ok. However, it requires further information which domains should have which input.
R3:
Yes
Send Output to: N/A
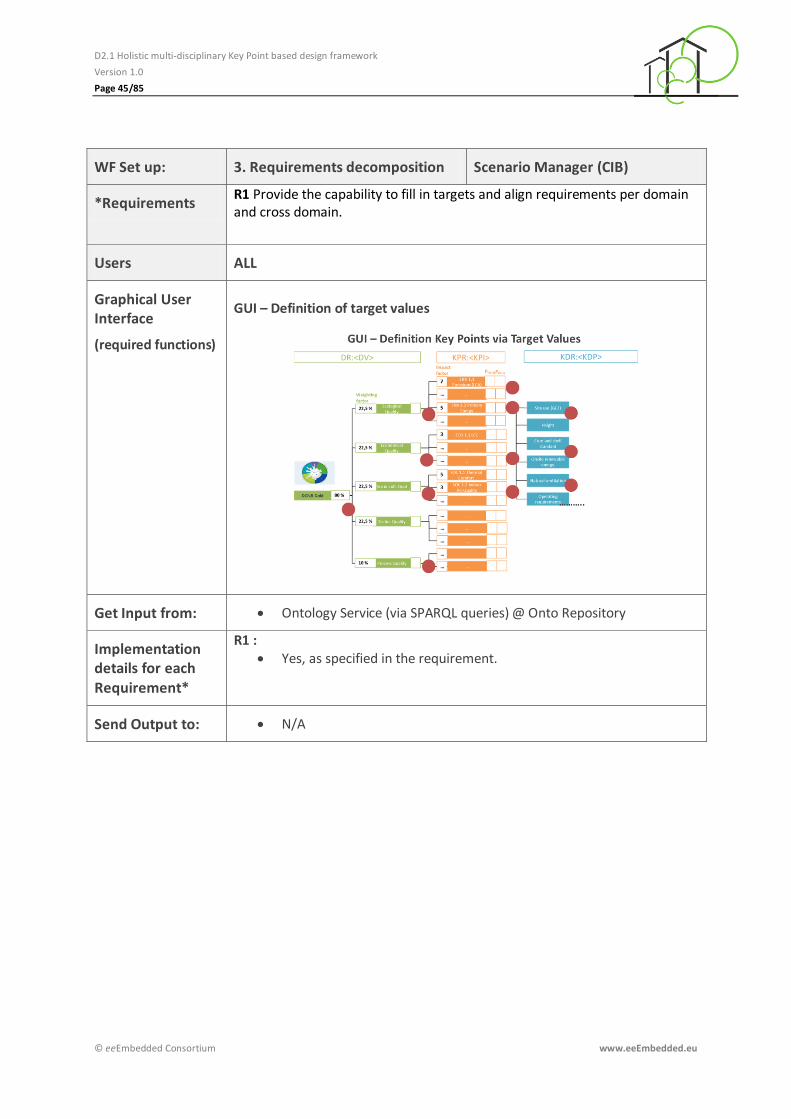
D2.1 Holistic multi-disciplinary Key Point based design framework
Version 1.0
Page 45/85
© eeEmbedded Consortium www.eeEmbedded.eu
WF Set up: 3. Requirements decomposition Scenario Manager (CIB)
*Requirements R1 Provide the capability to fill in targets and align requirements per domain and cross domain.
Users ALL
Graphical User Interface
(required functions)
GUI – Definition of target values
Get Input from: Ontology Service (via SPARQL queries) @ Onto Repository
Implementation details for each Requirement*
R1 : Yes, as specified in the requirement.
Send Output to: N/A
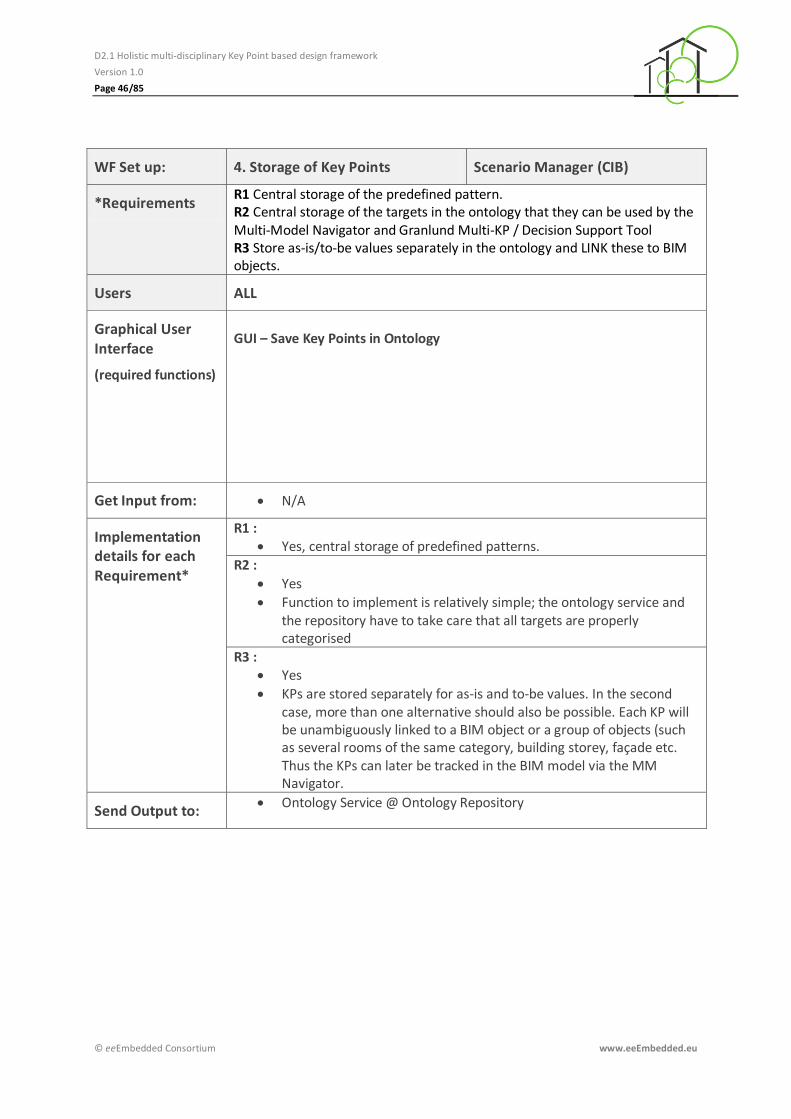
D2.1 Holistic multi-disciplinary Key Point based design framework
Version 1.0
Page 46/85
© eeEmbedded Consortium www.eeEmbedded.eu
WF Set up: 4. Storage of Key Points Scenario Manager (CIB)
*Requirements R1 Central storage of the predefined pattern. R2 Central storage of the targets in the ontology that they can be used by the Multi-Model Navigator and Granlund Multi-KP / Decision Support Tool R3 Store as-is/to-be values separately in the ontology and LINK these to BIM objects.
Users ALL
Graphical User Interface
(required functions)
GUI – Save Key Points in Ontology
Get Input from: N/A
Implementation details for each Requirement*
R1 : Yes, central storage of predefined patterns.
R2 :
Yes
Function to implement is relatively simple; the ontology service and the repository have to take care that all targets are properly categorised
R3 : Yes
KPs are stored separately for as-is and to-be values. In the second case, more than one alternative should also be possible. Each KP will be unambiguously linked to a BIM object or a group of objects (such as several rooms of the same category, building storey, façade etc. Thus the KPs can later be tracked in the BIM model via the MM Navigator.
Send Output to: Ontology Service @ Ontology Repository
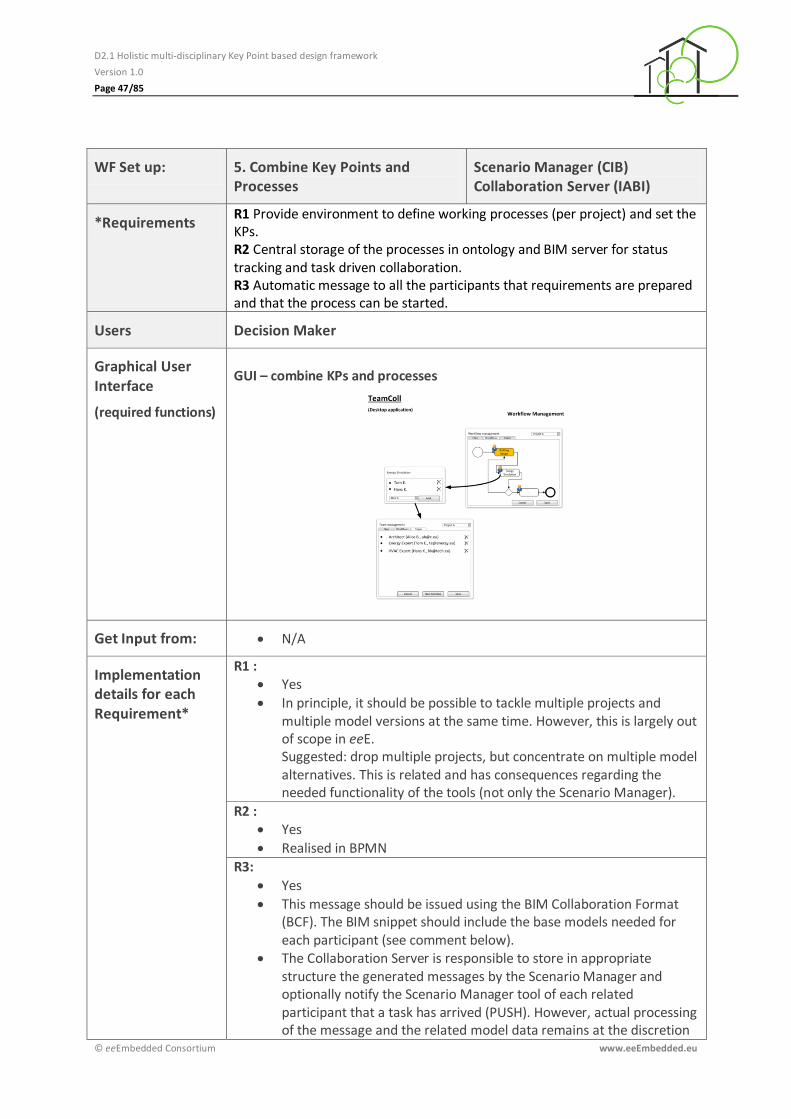
D2.1 Holistic multi-disciplinary Key Point based design framework
Version 1.0
Page 47/85
© eeEmbedded Consortium www.eeEmbedded.eu
WF Set up: 5. Combine Key Points and Processes
Scenario Manager (CIB) Collaboration Server (IABI)
*Requirements R1 Provide environment to define working processes (per project) and set the KPs. R2 Central storage of the processes in ontology and BIM server for status tracking and task driven collaboration. R3 Automatic message to all the participants that requirements are prepared and that the process can be started.
Users Decision Maker
Graphical User Interface
(required functions)
GUI – combine KPs and processes
Get Input from: N/A
Implementation details for each Requirement*
R1 : Yes
In principle, it should be possible to tackle multiple projects and multiple model versions at the same time. However, this is largely out of scope in eeE. Suggested: drop multiple projects, but concentrate on multiple model alternatives. This is related and has consequences regarding the needed functionality of the tools (not only the Scenario Manager).
R2 : Yes
Realised in BPMN
R3:
Yes
This message should be issued using the BIM Collaboration Format (BCF). The BIM snippet should include the base models needed for each participant (see comment below).
The Collaboration Server is responsible to store in appropriate structure the generated messages by the Scenario Manager and optionally notify the Scenario Manager tool of each related participant that a task has arrived (PUSH). However, actual processing of the message and the related model data remains at the discretion

D2.1 Holistic multi-disciplinary Key Point based design framework
Version 1.0
Page 48/85
© eeEmbedded Consortium www.eeEmbedded.eu
of the recipient (PULL principle).
Send Output to: Ontology Service @ Ontology Repository Collaboration Server
Comment
This WF node requires (presumes) that the BIM model is already available – via the respective authoring tool – and has been stored at the multi-model repository of the platform. However, such a preceding task is currently not defined.
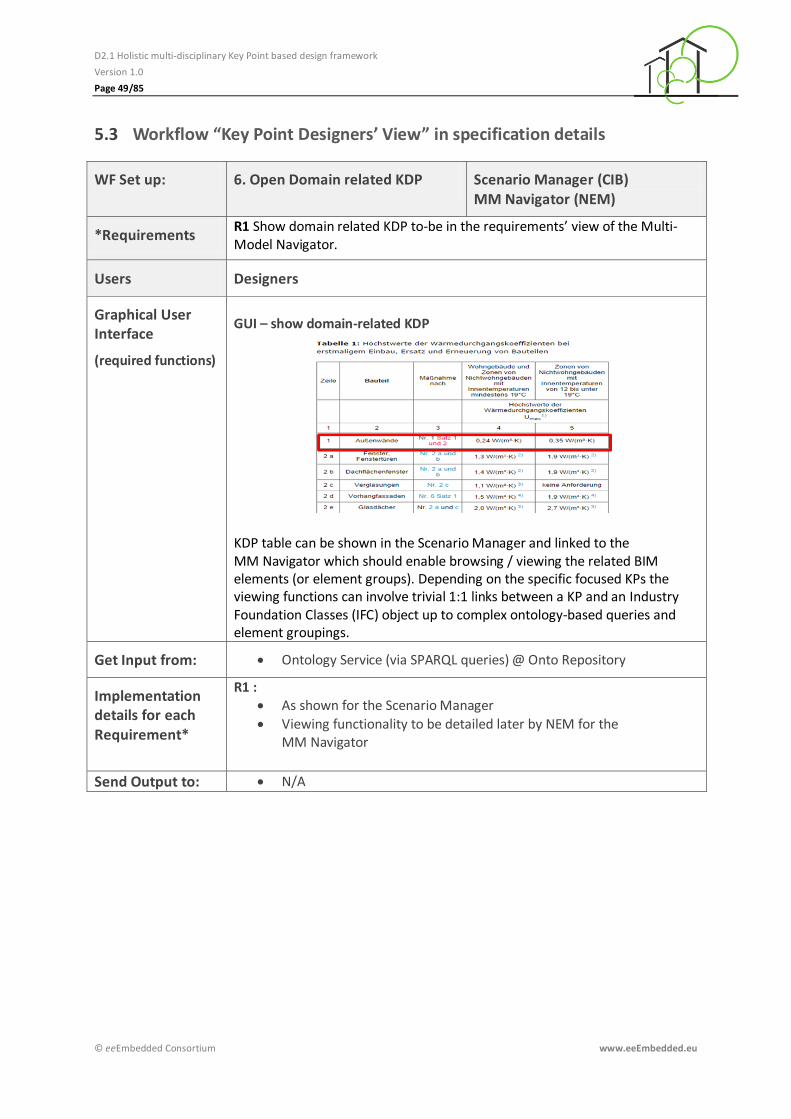
D2.1 Holistic multi-disciplinary Key Point based design framework
Version 1.0
Page 49/85
© eeEmbedded Consortium www.eeEmbedded.eu
Workflow “Key Point Designers’ View” in specification details 5.3
WF Set up: 6. Open Domain related KDP Scenario Manager (CIB) MM Navigator (NEM)
*Requirements R1 Show domain related KDP to-be in the requirements’ view of the Multi-Model Navigator.
Users Designers
Graphical User Interface
(required functions)
GUI – show domain-related KDP
KDP table can be shown in the Scenario Manager and linked to the MM Navigator which should enable browsing / viewing the related BIM elements (or element groups). Depending on the specific focused KPs the viewing functions can involve trivial 1:1 links between a KP and an Industry Foundation Classes (IFC) object up to complex ontology-based queries and element groupings.
Get Input from: Ontology Service (via SPARQL queries) @ Onto Repository
Implementation details for each Requirement*
R1 : As shown for the Scenario Manager
Viewing functionality to be detailed later by NEM for the MM Navigator
Send Output to: N/A
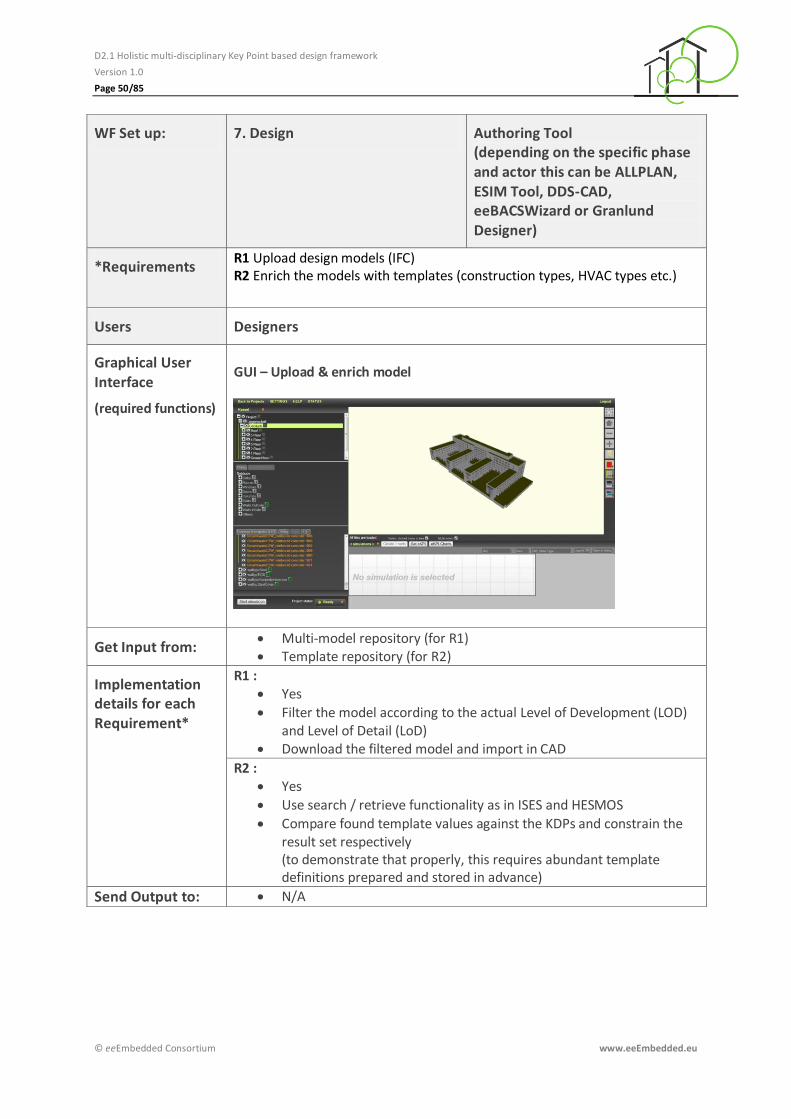
D2.1 Holistic multi-disciplinary Key Point based design framework
Version 1.0
Page 50/85
© eeEmbedded Consortium www.eeEmbedded.eu
WF Set up: 7. Design Authoring Tool (depending on the specific phase and actor this can be ALLPLAN, ESIM Tool, DDS-CAD, eeBACSWizard or Granlund Designer)
*Requirements R1 Upload design models (IFC) R2 Enrich the models with templates (construction types, HVAC types etc.)
Users Designers
Graphical User Interface
(required functions)
GUI – Upload & enrich model
Get Input from: Multi-model repository (for R1) Template repository (for R2)
Implementation details for each Requirement*
R1 : Yes
Filter the model according to the actual Level of Development (LOD) and Level of Detail (LoD)
Download the filtered model and import in CAD
R2 : Yes
Use search / retrieve functionality as in ISES and HESMOS
Compare found template values against the KDPs and constrain the result set respectively (to demonstrate that properly, this requires abundant template definitions prepared and stored in advance)
Send Output to: N/A
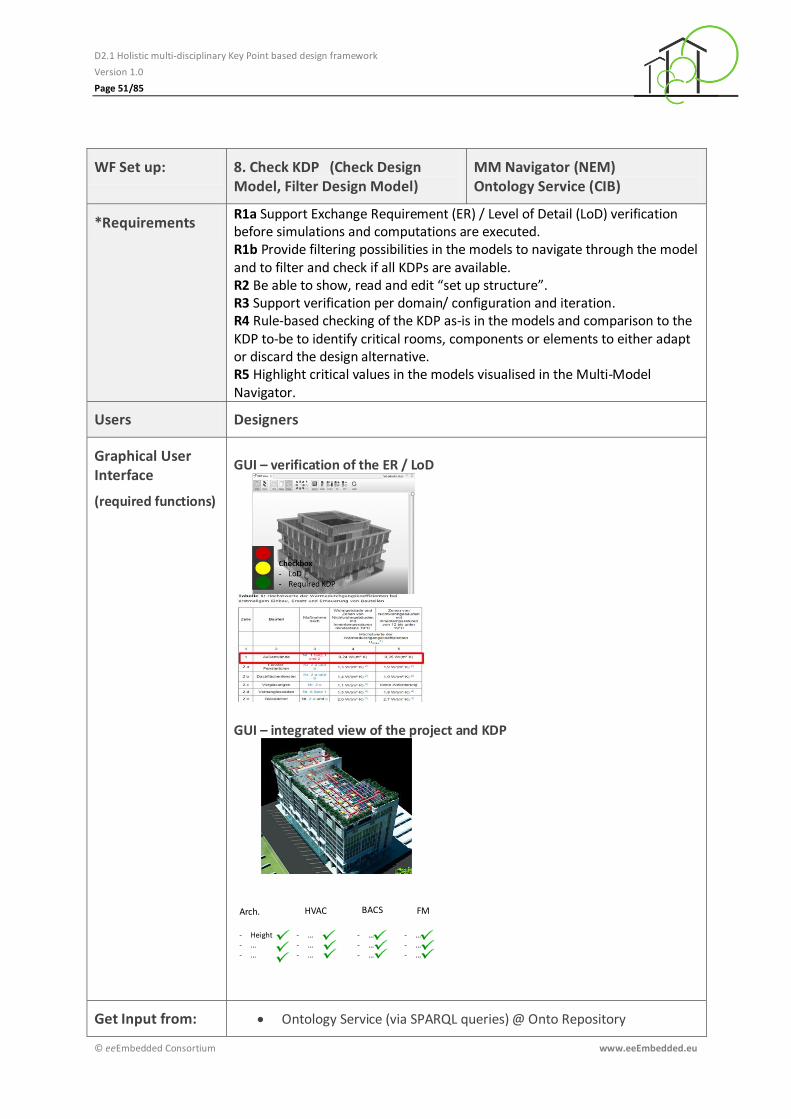
D2.1 Holistic multi-disciplinary Key Point based design framework
Version 1.0
Page 51/85
© eeEmbedded Consortium www.eeEmbedded.eu
WF Set up: 8. Check KDP (Check Design Model, Filter Design Model)
MM Navigator (NEM) Ontology Service (CIB)
*Requirements R1a Support Exchange Requirement (ER) / Level of Detail (LoD) verification before simulations and computations are executed. R1b Provide filtering possibilities in the models to navigate through the model and to filter and check if all KDPs are available. R2 Be able to show, read and edit “set up structure”. R3 Support verification per domain/ configuration and iteration. R4 Rule-based checking of the KDP as-is in the models and comparison to the KDP to-be to identify critical rooms, components or elements to either adapt or discard the design alternative. R5 Highlight critical values in the models visualised in the Multi-Model Navigator.
Users Designers
Graphical User Interface
(required functions)
GUI – verification of the ER / LoD
GUI – integrated view of the project and KDP
Get Input from: Ontology Service (via SPARQL queries) @ Onto Repository
Arch. HVAC BACS FM
- Height- …- …
- …- …- …
- …- …- …
- …- …- …
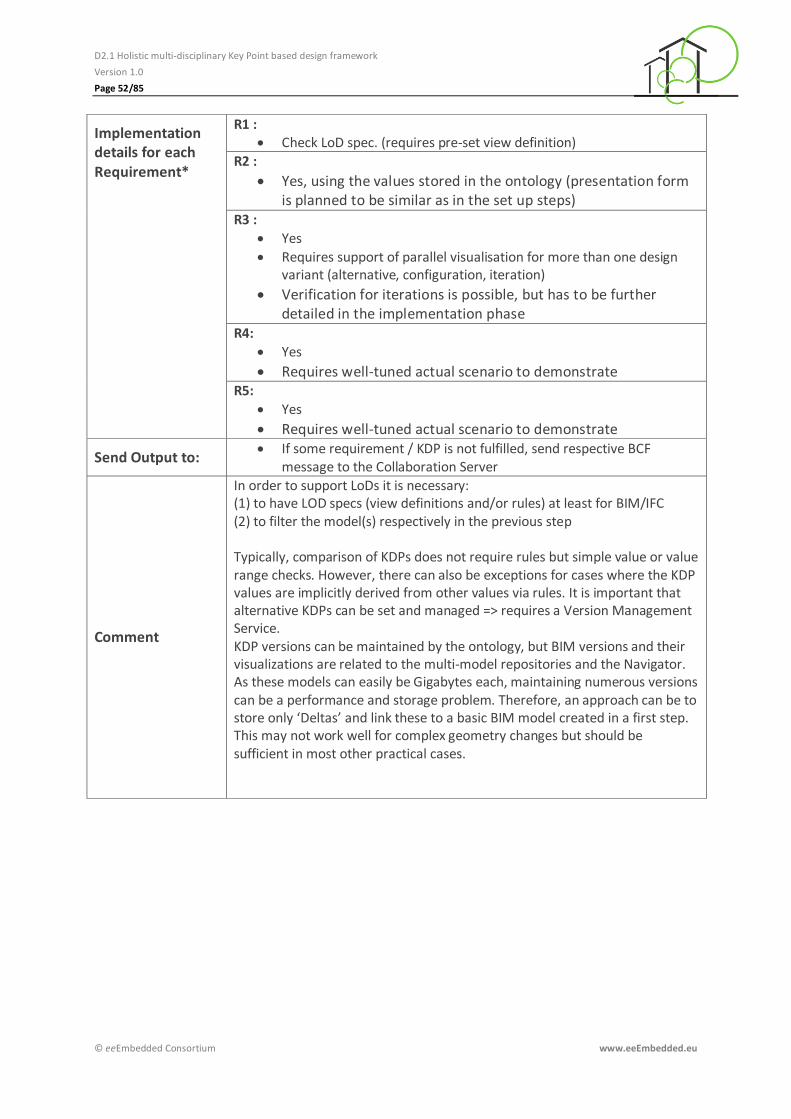
D2.1 Holistic multi-disciplinary Key Point based design framework
Version 1.0
Page 52/85
© eeEmbedded Consortium www.eeEmbedded.eu
Implementation details for each Requirement*
R1 : Check LoD spec. (requires pre-set view definition)
R2 :
Yes, using the values stored in the ontology (presentation form is planned to be similar as in the set up steps)
R3 :
Yes
Requires support of parallel visualisation for more than one design variant (alternative, configuration, iteration)
Verification for iterations is possible, but has to be further detailed in the implementation phase
R4:
Yes
Requires well-tuned actual scenario to demonstrate R5:
Yes
Requires well-tuned actual scenario to demonstrate
Send Output to: If some requirement / KDP is not fulfilled, send respective BCF
message to the Collaboration Server
Comment
In order to support LoDs it is necessary: (1) to have LOD specs (view definitions and/or rules) at least for BIM/IFC (2) to filter the model(s) respectively in the previous step Typically, comparison of KDPs does not require rules but simple value or value range checks. However, there can also be exceptions for cases where the KDP values are implicitly derived from other values via rules. It is important that alternative KDPs can be set and managed => requires a Version Management Service. KDP versions can be maintained by the ontology, but BIM versions and their visualizations are related to the multi-model repositories and the Navigator. As these models can easily be Gigabytes each, maintaining numerous versions can be a performance and storage problem. Therefore, an approach can be to store only ‘Deltas’ and link these to a basic BIM model created in a first step. This may not work well for complex geometry changes but should be sufficient in most other practical cases.
D2.1 Holistic multi-disciplinary Key Point based design framework
Version 1.0
Page 53/85
© eeEmbedded Consortium www.eeEmbedded.eu
WF Set up: 9. Decision made on summary Key Design Parameters
MM Navigator (NEM) Ontology Service (CIB)
*Requirements R1 The summary of the KDP related to the design alternatives must be shown in the MM Navigator R2 MM Navigator must give the opportunity (to the end user) of selecting and discard design alternative R3 Ontology must save Key Points in its repository. Probably, MM Navigator must have a command button or launch a dialogue so the end-user can “click” it and the KPs are stored
Users Designers
Graphical User Interface
(required functions)
Get Input from: Ontology Service (via SPARQL queries) @ Onto Repository
Implementation details for each Requirement*
R1 : Yes
Implies that all participants in the design team have reached that point and have set their KDPs.
R2 : Yes
Visualization of alternatives (per participant, merged?)
Visualization of KDPs of all actors and check for inconsistencies via the ontology service
R3 : Yes
Store selected alternative in the ontology per mouse click; In the ontology denote the selected alternative as the ‘chosen’ one
Issue respective BCF messages
Send Output to: Ontology Service (via SPARQL queries) @ Onto Repository
Collaboration Server (via BCF)
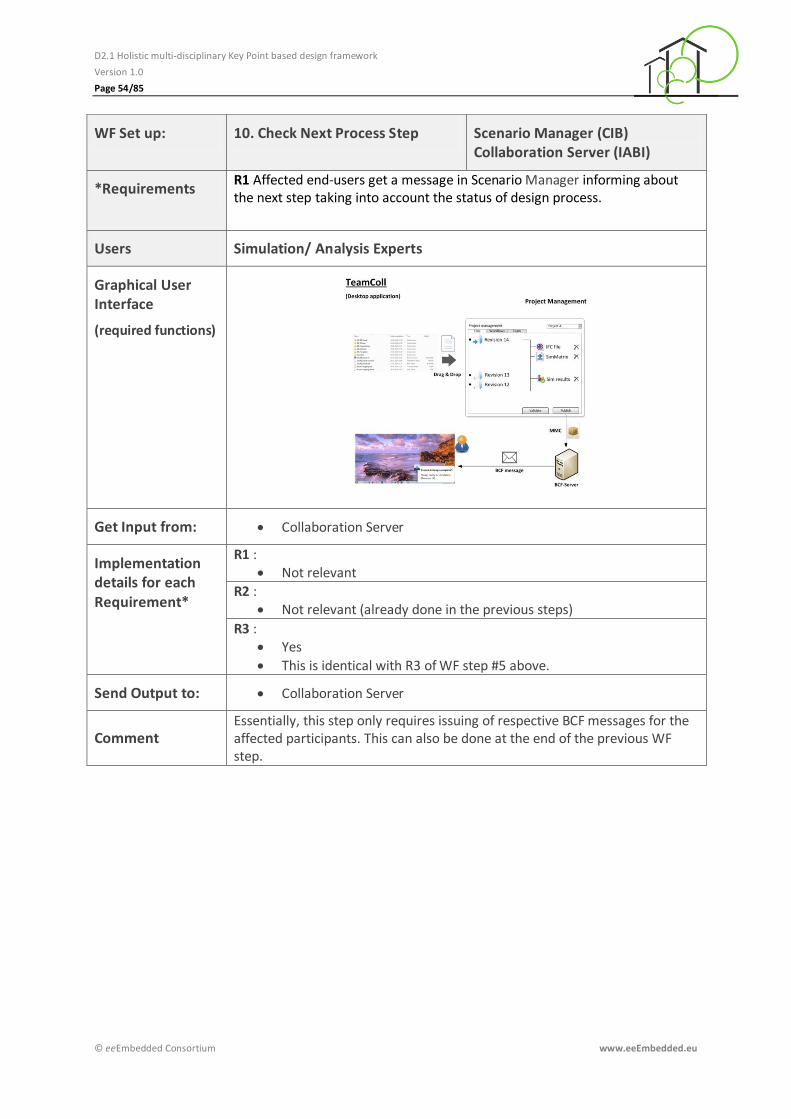
D2.1 Holistic multi-disciplinary Key Point based design framework
Version 1.0
Page 54/85
© eeEmbedded Consortium www.eeEmbedded.eu
WF Set up: 10. Check Next Process Step Scenario Manager (CIB) Collaboration Server (IABI)
*Requirements R1 Affected end-users get a message in Scenario Manager informing about the next step taking into account the status of design process.
Users Simulation/ Analysis Experts
Graphical User Interface
(required functions)
Get Input from: Collaboration Server
Implementation details for each Requirement*
R1 : Not relevant
R2 : Not relevant (already done in the previous steps)
R3 : Yes
This is identical with R3 of WF step #5 above.
Send Output to: Collaboration Server
Comment Essentially, this step only requires issuing of respective BCF messages for the affected participants. This can also be done at the end of the previous WF step.
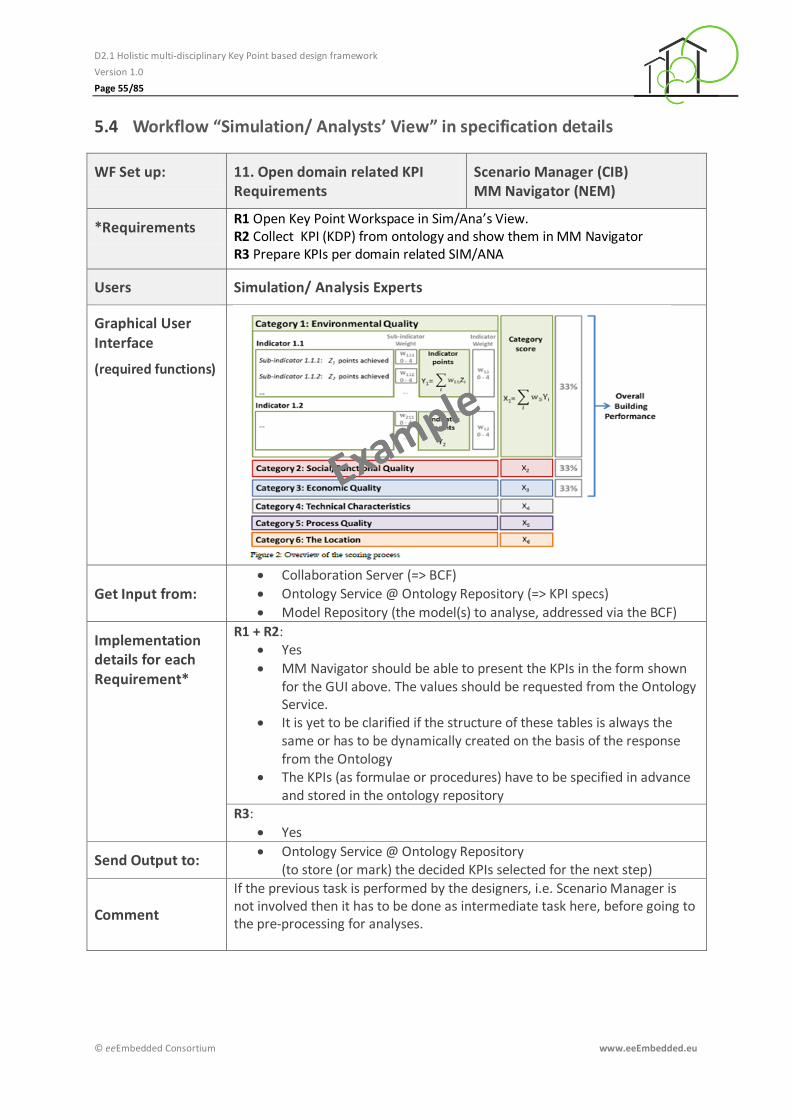
D2.1 Holistic multi-disciplinary Key Point based design framework
Version 1.0
Page 55/85
© eeEmbedded Consortium www.eeEmbedded.eu
Workflow “Simulation/ Analysts’ View” in specification details 5.4
WF Set up: 11. Open domain related KPI Requirements
Scenario Manager (CIB) MM Navigator (NEM)
*Requirements R1 Open Key Point Workspace in Sim/Ana’s View. R2 Collect KPI (KDP) from ontology and show them in MM Navigator R3 Prepare KPIs per domain related SIM/ANA
Users Simulation/ Analysis Experts
Graphical User Interface
(required functions)
Get Input from: Collaboration Server (=> BCF)
Ontology Service @ Ontology Repository (=> KPI specs)
Model Repository (the model(s) to analyse, addressed via the BCF)
Implementation details for each Requirement*
R1 + R2: Yes
MM Navigator should be able to present the KPIs in the form shown for the GUI above. The values should be requested from the Ontology Service.
It is yet to be clarified if the structure of these tables is always the same or has to be dynamically created on the basis of the response from the Ontology
The KPIs (as formulae or procedures) have to be specified in advance and stored in the ontology repository
R3:
Yes
Send Output to: Ontology Service @ Ontology Repository
(to store (or mark) the decided KPIs selected for the next step)
Comment
If the previous task is performed by the designers, i.e. Scenario Manager is not involved then it has to be done as intermediate task here, before going to the pre-processing for analyses.
D2.1 Holistic multi-disciplinary Key Point based design framework
Version 1.0
Page 56/85
© eeEmbedded Consortium www.eeEmbedded.eu
WF Set up: 12. Simulation Preparation (pre-processing)
Simulation Pre-processing tools (CIB, GRA, IET)
*Requirements R1 SIM results must be stored in ontology/BIM server where KPI SW components have access
NOTE: Further defined by simulation experts out of KPI framework
Users Simulation/ Analysis Experts
Graphical User Interface
(required functions)
Get Input from: Ontology Service @ Ontology Repository
[ Template Management Service @ Template Repository ]
Model Management Service @ Model Repository
Implementation details for each Requirement*
R1: No. The simulation results are stored by the simulation tools where
they are executed, i.e. in the compute cloud. After post-processing the required KPIs are derived and returned to the users.
R2: Pre-processing may involve several services. For energy analysis these
can be e.g. o Second level space boundary generation o Additional template management (optional) o Generation of computational alternatives o Creating input data sets for the analysis services in the cloud
For all services holds: o If user interaction is required the subtask is executed within
the mmNavigator o If no user interaction is needed, the service can be
automatically executed locally or in the cloud. In this case, it is invoked by the mmNavigator or by another preceding service.
Send Output to: Simulation (Compute Cloud)
Comments
The KPIs addressed in the next step are produced by post-processing services/tools on the basis of the results from the performed multiple analyses. Therefore, before proceeding to the next step, two more steps are required:
Performing the analyses Post-processing the analysis results and generation of the required
KPIs The first step addresses the following tools:
TRNSYS (for various energy analysis/simulation tasks) => IET
CFD => SOF
iTWO (for LCA/LCC) => RIB The use of these tools should be typically fully automatic on the cloud. This is currently confirmed for TRNSYS and Computational Fluid Dynamics (CFD). It is not clarified for iTWO and the use of Granlund tools is to my knowledge

D2.1 Holistic multi-disciplinary Key Point based design framework
Version 1.0
Page 57/85
© eeEmbedded Consortium www.eeEmbedded.eu
optional and yet to be decided. If some of the tools should be used locally instead on the cloud, the pre-processing step would probably be different. However, this has no relevance with regard to the overall Key Point approach. Due to the large amount of results produced, the post-processing should typically happen at the same node where these results are stored, i.e. in the case of energy analyses/simulations it will be done in the cloud. Only the final results are then transferred back to the users for final decision (see next WF step). If results from more than one (type of) simulation are needed, then their availability has to be synchronised via the Collaboration Server and the Scenario Manager as in all other similar situations. This creates also a more complex post-processing task (yet to be defined in detail).
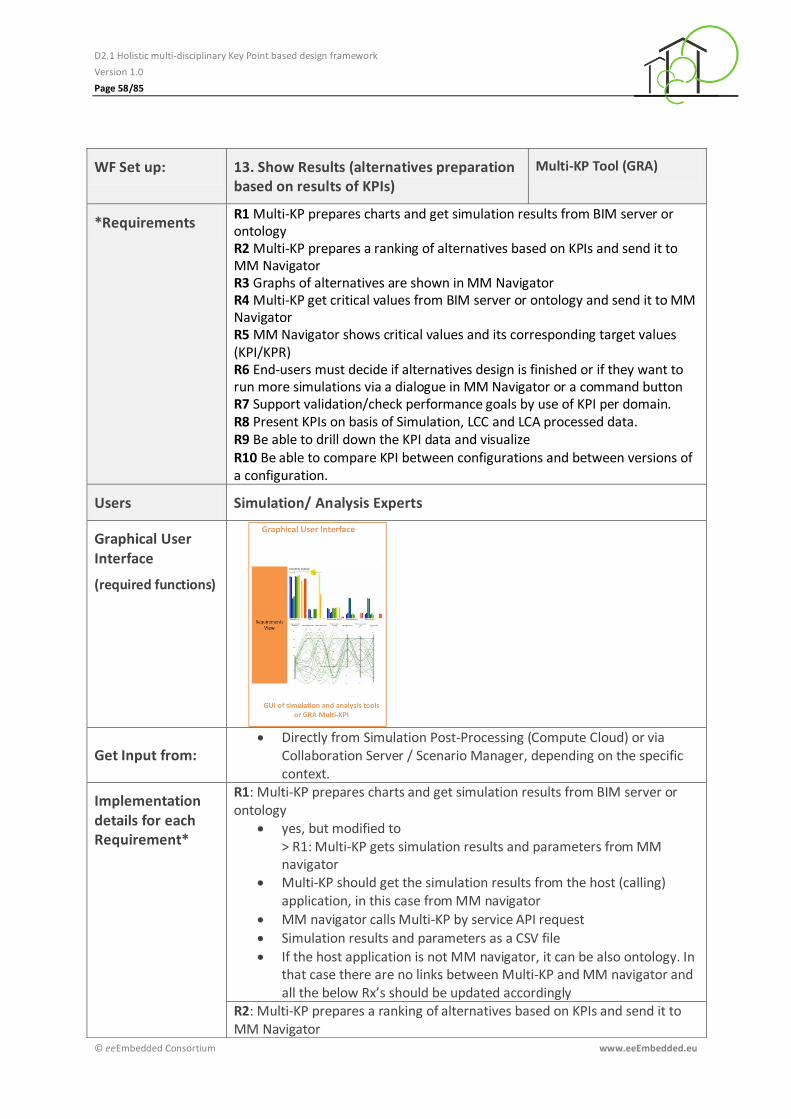
D2.1 Holistic multi-disciplinary Key Point based design framework
Version 1.0
Page 58/85
© eeEmbedded Consortium www.eeEmbedded.eu
WF Set up: 13. Show Results (alternatives preparation based on results of KPIs)
Multi-KP Tool (GRA)
*Requirements R1 Multi-KP prepares charts and get simulation results from BIM server or ontology R2 Multi-KP prepares a ranking of alternatives based on KPIs and send it to MM Navigator R3 Graphs of alternatives are shown in MM Navigator R4 Multi-KP get critical values from BIM server or ontology and send it to MM Navigator R5 MM Navigator shows critical values and its corresponding target values (KPI/KPR) R6 End-users must decide if alternatives design is finished or if they want to run more simulations via a dialogue in MM Navigator or a command button R7 Support validation/check performance goals by use of KPI per domain. R8 Present KPIs on basis of Simulation, LCC and LCA processed data. R9 Be able to drill down the KPI data and visualize R10 Be able to compare KPI between configurations and between versions of a configuration.
Users Simulation/ Analysis Experts
Graphical User Interface
(required functions)
Get Input from: Directly from Simulation Post-Processing (Compute Cloud) or via
Collaboration Server / Scenario Manager, depending on the specific context.
Implementation details for each Requirement*
R1: Multi-KP prepares charts and get simulation results from BIM server or ontology
yes, but modified to > R1: Multi-KP gets simulation results and parameters from MM navigator
Multi-KP should get the simulation results from the host (calling) application, in this case from MM navigator
MM navigator calls Multi-KP by service API request
Simulation results and parameters as a CSV file
If the host application is not MM navigator, it can be also ontology. In that case there are no links between Multi-KP and MM navigator and all the below Rx’s should be updated accordingly
R2: Multi-KP prepares a ranking of alternatives based on KPIs and send it to MM Navigator
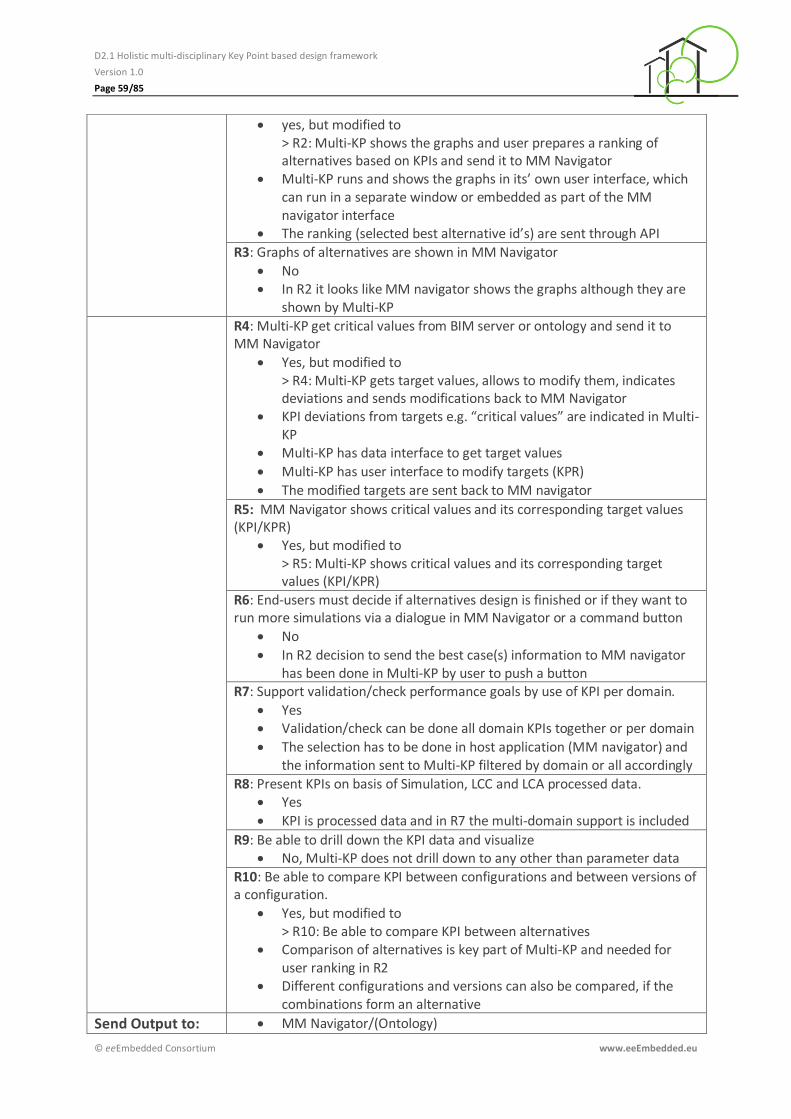
D2.1 Holistic multi-disciplinary Key Point based design framework
Version 1.0
Page 59/85
© eeEmbedded Consortium www.eeEmbedded.eu
yes, but modified to > R2: Multi-KP shows the graphs and user prepares a ranking of alternatives based on KPIs and send it to MM Navigator
Multi-KP runs and shows the graphs in its’ own user interface, which can run in a separate window or embedded as part of the MM navigator interface
The ranking (selected best alternative id’s) are sent through API
R3: Graphs of alternatives are shown in MM Navigator
No In R2 it looks like MM navigator shows the graphs although they are
shown by Multi-KP
R4: Multi-KP get critical values from BIM server or ontology and send it to MM Navigator
Yes, but modified to > R4: Multi-KP gets target values, allows to modify them, indicates deviations and sends modifications back to MM Navigator
KPI deviations from targets e.g. “critical values” are indicated in Multi-KP
Multi-KP has data interface to get target values
Multi-KP has user interface to modify targets (KPR)
The modified targets are sent back to MM navigator
R5: MM Navigator shows critical values and its corresponding target values (KPI/KPR)
Yes, but modified to > R5: Multi-KP shows critical values and its corresponding target values (KPI/KPR)
R6: End-users must decide if alternatives design is finished or if they want to run more simulations via a dialogue in MM Navigator or a command button
No
In R2 decision to send the best case(s) information to MM navigator has been done in Multi-KP by user to push a button
R7: Support validation/check performance goals by use of KPI per domain.
Yes Validation/check can be done all domain KPIs together or per domain
The selection has to be done in host application (MM navigator) and the information sent to Multi-KP filtered by domain or all accordingly
R8: Present KPIs on basis of Simulation, LCC and LCA processed data. Yes
KPI is processed data and in R7 the multi-domain support is included
R9: Be able to drill down the KPI data and visualize No, Multi-KP does not drill down to any other than parameter data
R10: Be able to compare KPI between configurations and between versions of a configuration.
Yes, but modified to > R10: Be able to compare KPI between alternatives
Comparison of alternatives is key part of Multi-KP and needed for user ranking in R2
Different configurations and versions can also be compared, if the combinations form an alternative
Send Output to: MM Navigator/(Ontology)
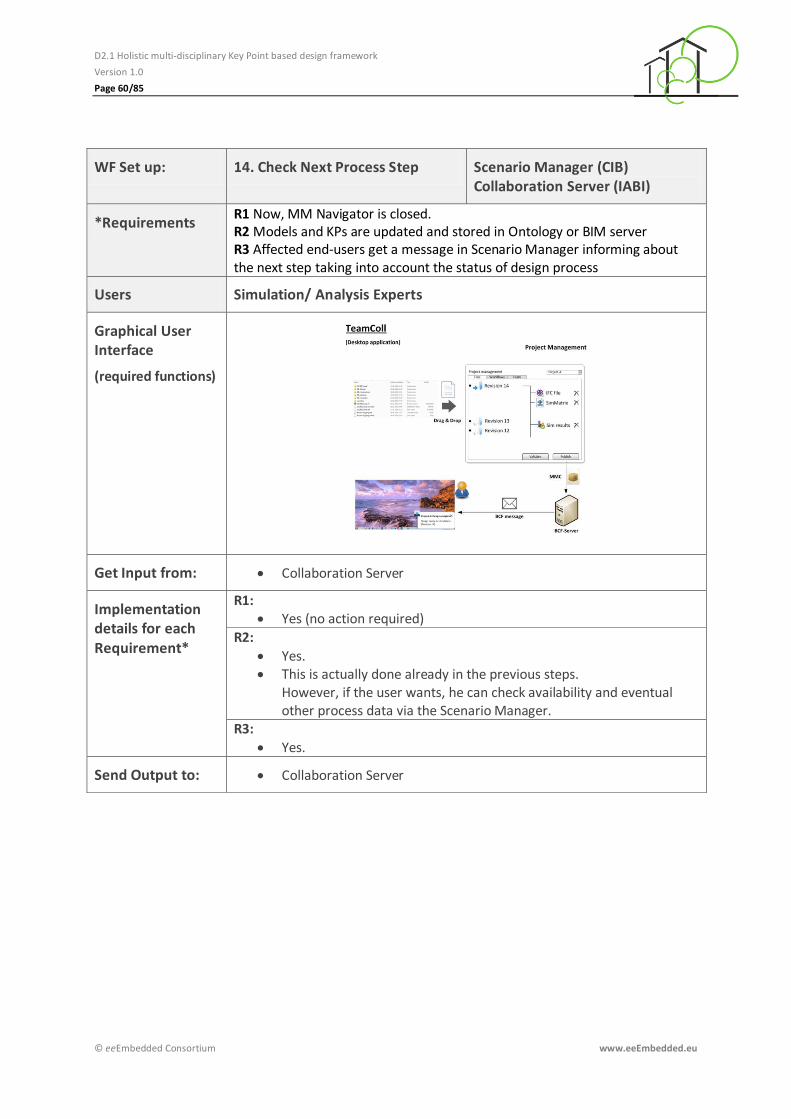
D2.1 Holistic multi-disciplinary Key Point based design framework
Version 1.0
Page 60/85
© eeEmbedded Consortium www.eeEmbedded.eu
WF Set up: 14. Check Next Process Step Scenario Manager (CIB) Collaboration Server (IABI)
*Requirements R1 Now, MM Navigator is closed. R2 Models and KPs are updated and stored in Ontology or BIM server R3 Affected end-users get a message in Scenario Manager informing about the next step taking into account the status of design process
Users Simulation/ Analysis Experts
Graphical User Interface
(required functions)
Get Input from: Collaboration Server
Implementation details for each Requirement*
R1: Yes (no action required)
R2:
Yes. This is actually done already in the previous steps.
However, if the user wants, he can check availability and eventual other process data via the Scenario Manager.
R3:
Yes.
Send Output to: Collaboration Server
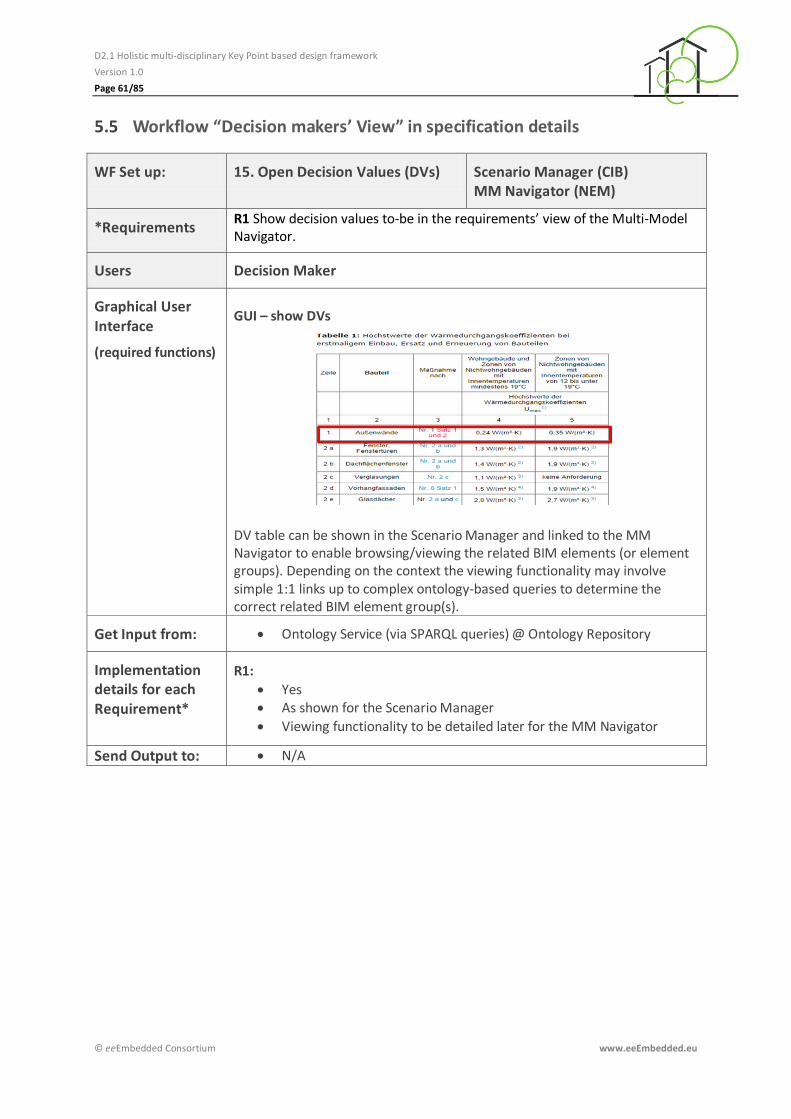
D2.1 Holistic multi-disciplinary Key Point based design framework
Version 1.0
Page 61/85
© eeEmbedded Consortium www.eeEmbedded.eu
Workflow “Decision makers’ View” in specification details 5.5
WF Set up: 15. Open Decision Values (DVs) Scenario Manager (CIB) MM Navigator (NEM)
*Requirements R1 Show decision values to-be in the requirements’ view of the Multi-Model Navigator.
Users Decision Maker
Graphical User Interface
(required functions)
GUI – show DVs
DV table can be shown in the Scenario Manager and linked to the MM Navigator to enable browsing/viewing the related BIM elements (or element groups). Depending on the context the viewing functionality may involve simple 1:1 links up to complex ontology-based queries to determine the correct related BIM element group(s).
Get Input from: Ontology Service (via SPARQL queries) @ Ontology Repository
Implementation details for each Requirement*
R1:
Yes As shown for the Scenario Manager
Viewing functionality to be detailed later for the MM Navigator
Send Output to: N/A
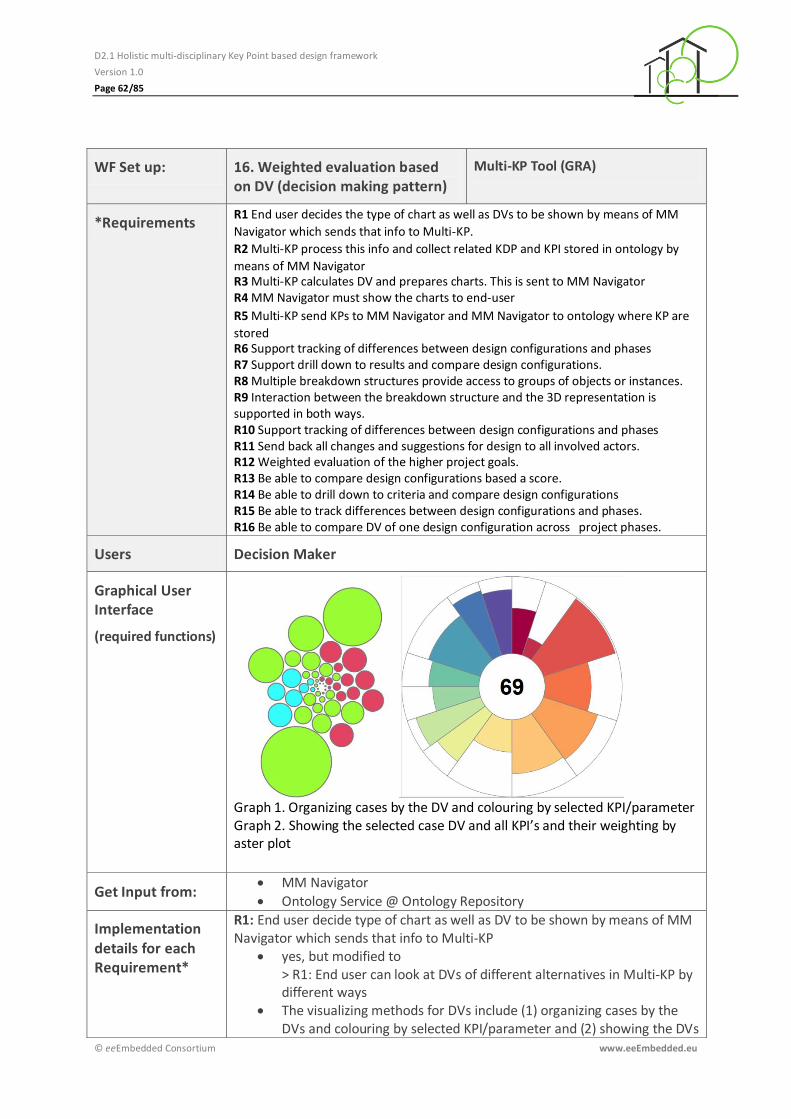
D2.1 Holistic multi-disciplinary Key Point based design framework
Version 1.0
Page 62/85
© eeEmbedded Consortium www.eeEmbedded.eu
WF Set up: 16. Weighted evaluation based on DV (decision making pattern)
Multi-KP Tool (GRA)
*Requirements R1 End user decides the type of chart as well as DVs to be shown by means of MM
Navigator which sends that info to Multi-KP.
R2 Multi-KP process this info and collect related KDP and KPI stored in ontology by
means of MM Navigator R3 Multi-KP calculates DV and prepares charts. This is sent to MM Navigator R4 MM Navigator must show the charts to end-user
R5 Multi-KP send KPs to MM Navigator and MM Navigator to ontology where KP are
stored R6 Support tracking of differences between design configurations and phases R7 Support drill down to results and compare design configurations. R8 Multiple breakdown structures provide access to groups of objects or instances. R9 Interaction between the breakdown structure and the 3D representation is supported in both ways. R10 Support tracking of differences between design configurations and phases R11 Send back all changes and suggestions for design to all involved actors. R12 Weighted evaluation of the higher project goals. R13 Be able to compare design configurations based a score. R14 Be able to drill down to criteria and compare design configurations R15 Be able to track differences between design configurations and phases. R16 Be able to compare DV of one design configuration across project phases.
Users Decision Maker
Graphical User Interface
(required functions)
Graph 1. Organizing cases by the DV and colouring by selected KPI/parameter Graph 2. Showing the selected case DV and all KPI’s and their weighting by aster plot
Get Input from: MM Navigator
Ontology Service @ Ontology Repository
Implementation details for each Requirement*
R1: End user decide type of chart as well as DV to be shown by means of MM Navigator which sends that info to Multi-KP
yes, but modified to > R1: End user can look at DVs of different alternatives in Multi-KP by different ways
The visualizing methods for DVs include (1) organizing cases by the DVs and colouring by selected KPI/parameter and (2) showing the DVs
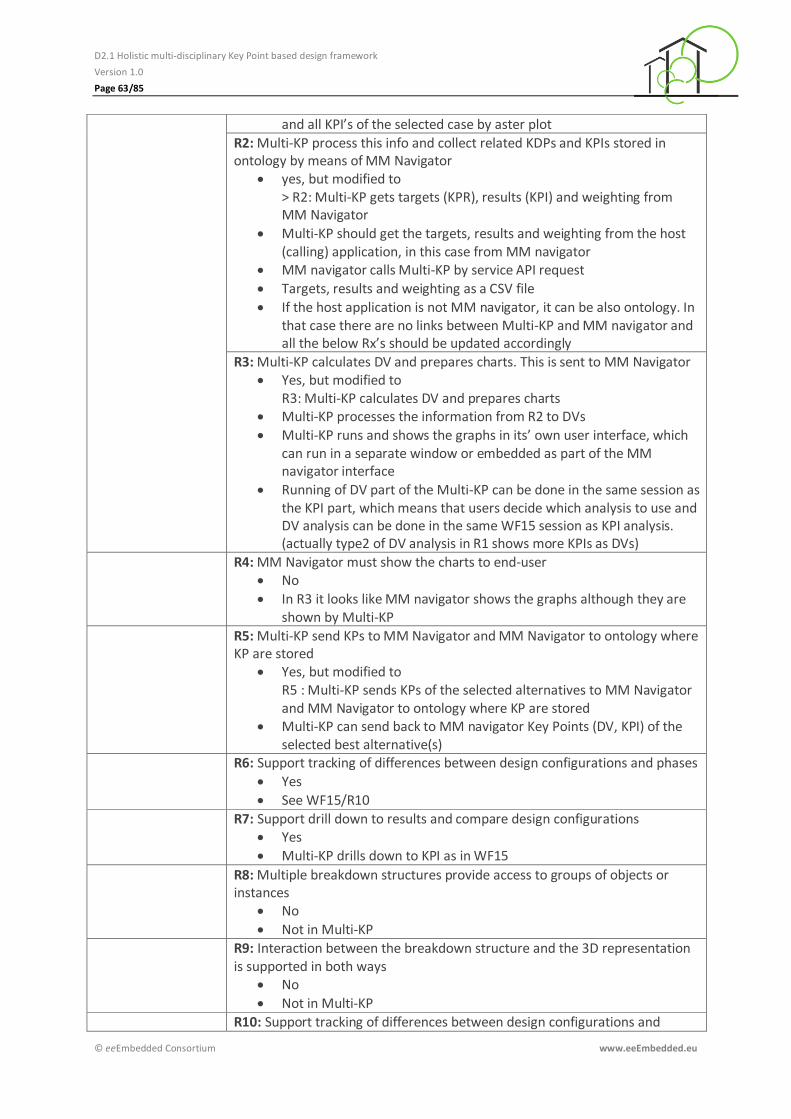
D2.1 Holistic multi-disciplinary Key Point based design framework
Version 1.0
Page 63/85
© eeEmbedded Consortium www.eeEmbedded.eu
and all KPI’s of the selected case by aster plot
R2: Multi-KP process this info and collect related KDPs and KPIs stored in ontology by means of MM Navigator
yes, but modified to > R2: Multi-KP gets targets (KPR), results (KPI) and weighting from MM Navigator
Multi-KP should get the targets, results and weighting from the host (calling) application, in this case from MM navigator
MM navigator calls Multi-KP by service API request
Targets, results and weighting as a CSV file
If the host application is not MM navigator, it can be also ontology. In that case there are no links between Multi-KP and MM navigator and all the below Rx’s should be updated accordingly
R3: Multi-KP calculates DV and prepares charts. This is sent to MM Navigator Yes, but modified to
R3: Multi-KP calculates DV and prepares charts Multi-KP processes the information from R2 to DVs
Multi-KP runs and shows the graphs in its’ own user interface, which can run in a separate window or embedded as part of the MM navigator interface
Running of DV part of the Multi-KP can be done in the same session as the KPI part, which means that users decide which analysis to use and DV analysis can be done in the same WF15 session as KPI analysis. (actually type2 of DV analysis in R1 shows more KPIs as DVs)
R4: MM Navigator must show the charts to end-user No
In R3 it looks like MM navigator shows the graphs although they are shown by Multi-KP
R5: Multi-KP send KPs to MM Navigator and MM Navigator to ontology where KP are stored
Yes, but modified to R5 : Multi-KP sends KPs of the selected alternatives to MM Navigator and MM Navigator to ontology where KP are stored
Multi-KP can send back to MM navigator Key Points (DV, KPI) of the selected best alternative(s)
R6: Support tracking of differences between design configurations and phases
Yes
See WF15/R10
R7: Support drill down to results and compare design configurations Yes
Multi-KP drills down to KPI as in WF15
R8: Multiple breakdown structures provide access to groups of objects or instances
No
Not in Multi-KP
R9: Interaction between the breakdown structure and the 3D representation is supported in both ways
No
Not in Multi-KP
R10: Support tracking of differences between design configurations and
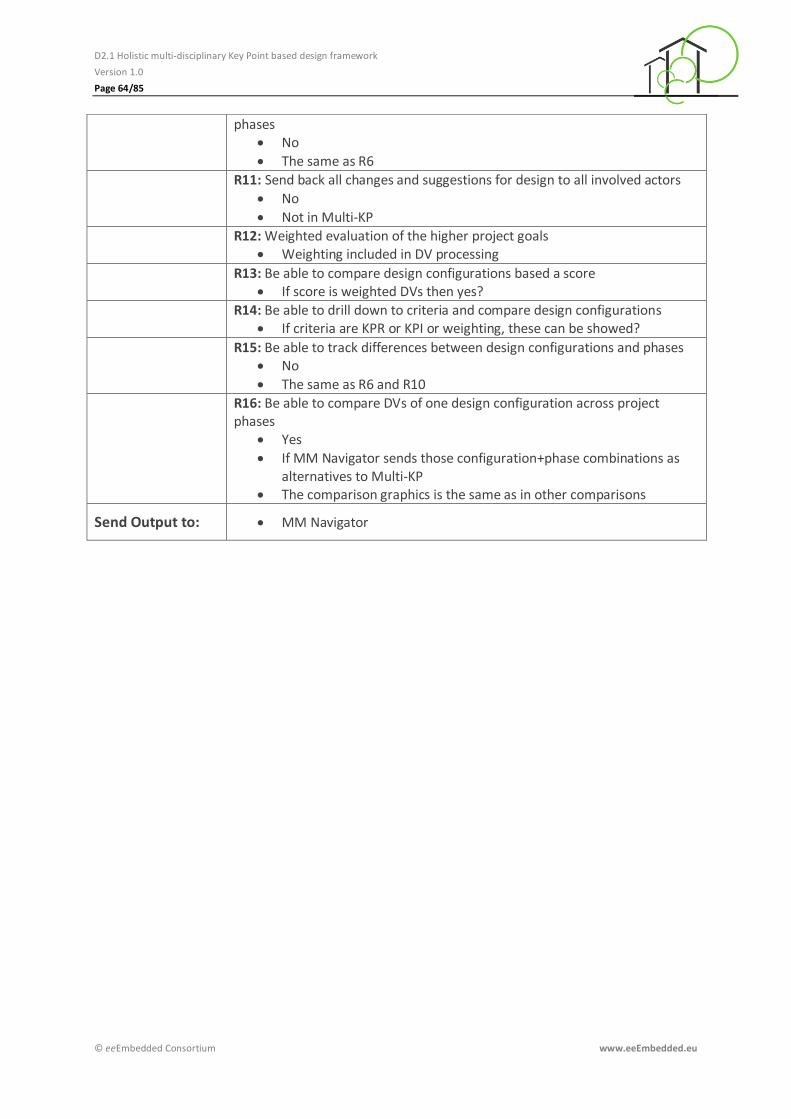
D2.1 Holistic multi-disciplinary Key Point based design framework
Version 1.0
Page 64/85
© eeEmbedded Consortium www.eeEmbedded.eu
phases No
The same as R6
R11: Send back all changes and suggestions for design to all involved actors
No
Not in Multi-KP
R12: Weighted evaluation of the higher project goals
Weighting included in DV processing
R13: Be able to compare design configurations based a score
If score is weighted DVs then yes?
R14: Be able to drill down to criteria and compare design configurations
If criteria are KPR or KPI or weighting, these can be showed?
R15: Be able to track differences between design configurations and phases No
The same as R6 and R10
R16: Be able to compare DVs of one design configuration across project phases
Yes
If MM Navigator sends those configuration+phase combinations as alternatives to Multi-KP
The comparison graphics is the same as in other comparisons
Send Output to: MM Navigator
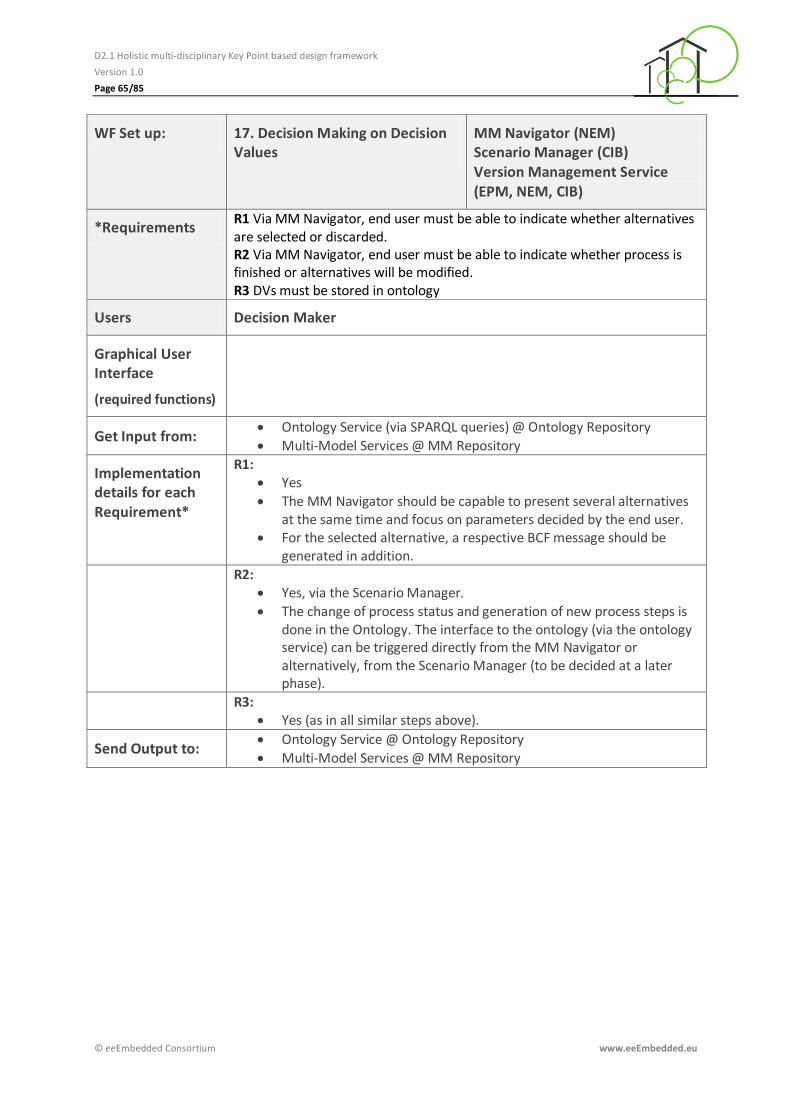
D2.1 Holistic multi-disciplinary Key Point based design framework
Version 1.0
Page 65/85
© eeEmbedded Consortium www.eeEmbedded.eu
WF Set up: 17. Decision Making on Decision Values
MM Navigator (NEM) Scenario Manager (CIB) Version Management Service (EPM, NEM, CIB)
*Requirements R1 Via MM Navigator, end user must be able to indicate whether alternatives are selected or discarded. R2 Via MM Navigator, end user must be able to indicate whether process is finished or alternatives will be modified. R3 DVs must be stored in ontology
Users Decision Maker
Graphical User Interface
(required functions)
Get Input from: Ontology Service (via SPARQL queries) @ Ontology Repository
Multi-Model Services @ MM Repository
Implementation details for each Requirement*
R1: Yes
The MM Navigator should be capable to present several alternatives at the same time and focus on parameters decided by the end user.
For the selected alternative, a respective BCF message should be generated in addition.
R2: Yes, via the Scenario Manager.
The change of process status and generation of new process steps is done in the Ontology. The interface to the ontology (via the ontology service) can be triggered directly from the MM Navigator or alternatively, from the Scenario Manager (to be decided at a later phase).
R3:
Yes (as in all similar steps above).
Send Output to: Ontology Service @ Ontology Repository
Multi-Model Services @ MM Repository
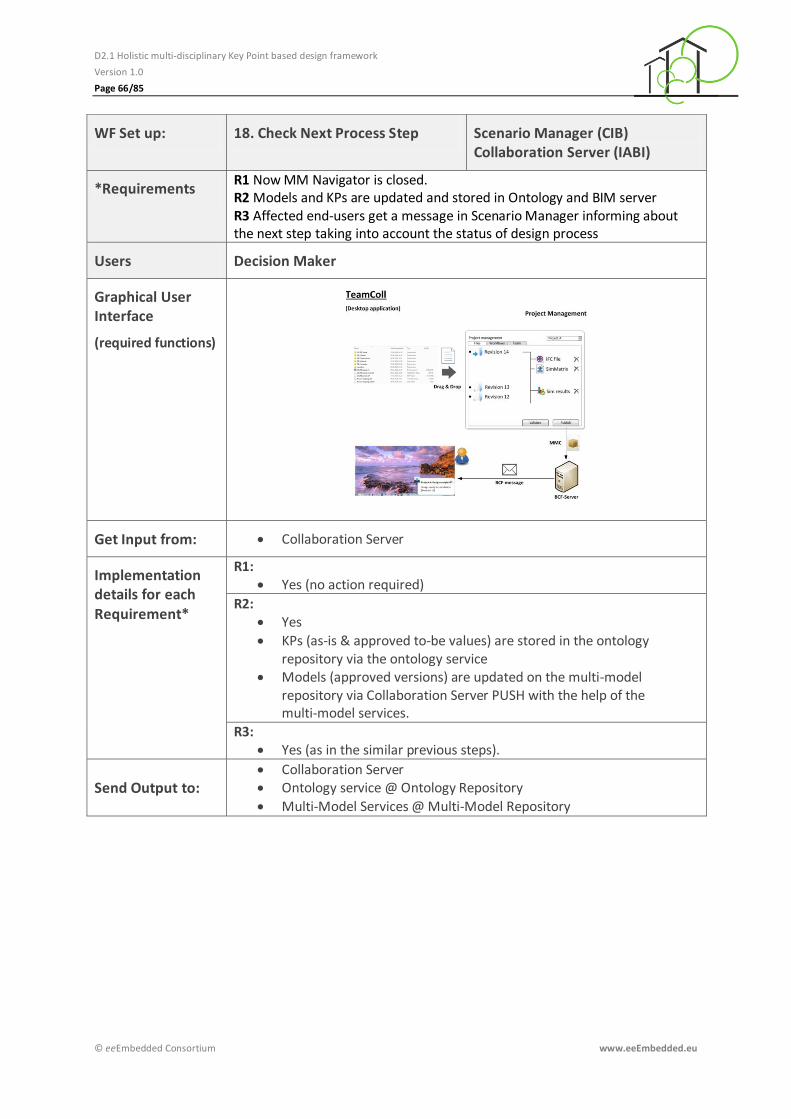
D2.1 Holistic multi-disciplinary Key Point based design framework
Version 1.0
Page 66/85
© eeEmbedded Consortium www.eeEmbedded.eu
WF Set up: 18. Check Next Process Step Scenario Manager (CIB) Collaboration Server (IABI)
*Requirements R1 Now MM Navigator is closed. R2 Models and KPs are updated and stored in Ontology and BIM server R3 Affected end-users get a message in Scenario Manager informing about the next step taking into account the status of design process
Users Decision Maker
Graphical User Interface
(required functions)
Get Input from: Collaboration Server
Implementation details for each Requirement*
R1: Yes (no action required)
R2: Yes
KPs (as-is & approved to-be values) are stored in the ontology repository via the ontology service
Models (approved versions) are updated on the multi-model repository via Collaboration Server PUSH with the help of the multi-model services.
R3: Yes (as in the similar previous steps).
Send Output to: Collaboration Server Ontology service @ Ontology Repository
Multi-Model Services @ Multi-Model Repository

D2.1 Holistic multi-disciplinary Key Point based design framework
Version 1.0
Page 67/85
© eeEmbedded Consortium www.eeEmbedded.eu
6 Key Point Specification – eeE Sustainable Value (eeSV)
In this chapter, practical examples for the three identified eeE Key Point Groups are introduced. For that
purpose, all Key Point Groups - Decision Value (DV), Key Performance Indicators (KPIs), Key Design
Parameters (KDPs) - of the generic taxonomy described in chapter 3.1, will be specified to support the
eeE design process of energy-efficient and sustainable buildings optimally embedded in their
neighbourhood.
eeE Key Point Taxonomy 6.1
For the “Key Point Set Up” an eeE ontology will be developed to transfer the key points into logical rules
and to control the simplified calculation methods. As basis for this formalisation:
The eeE sustainable value and value drivers are introduced in section 6.2 as Decision Values
(DVs) which focuses on the expected project outcome and will be defined based on the clients’
objectives.
Key Performance Indicators (KPIs) are defined in section 6.3 for the evaluation with the eeE
platform used also by well-accepted certification systems such as the German Sustainability
Certificate (DGNB), the American Leadership in Energy and Environmental Design (LEED) and
British Research Establishment Environmental Method (BREEAM).
Examples for Key Design Parameters (KDP) and their constraints are given in section 6.4 derived
from the master plan, codes and regulations.
The matrix in table 3 eeE Key Point Taxonomy defines the structure and is followed by the detailed
description of every Key Point Group. The matrix comprises the decomposition of key point groups, the
involved domains as well as the Level of Detail (LoD) of the model in the three evolving eeE phases.
This deliverable introduces the Key Point Groups, which are basis for the eeE Key Point controlled design
process. The eeE ontology for decomposition of Key Points will be further specified and developed in
D6.5 Optimization of multi-model criteria: Prototype of mathematical methods based on the link model
information and the ontology model for multi-criteria optimization and the methods for aggregation of
Key Points will be part of D3.2 Sustainability prognosis, quality and ROI methods.
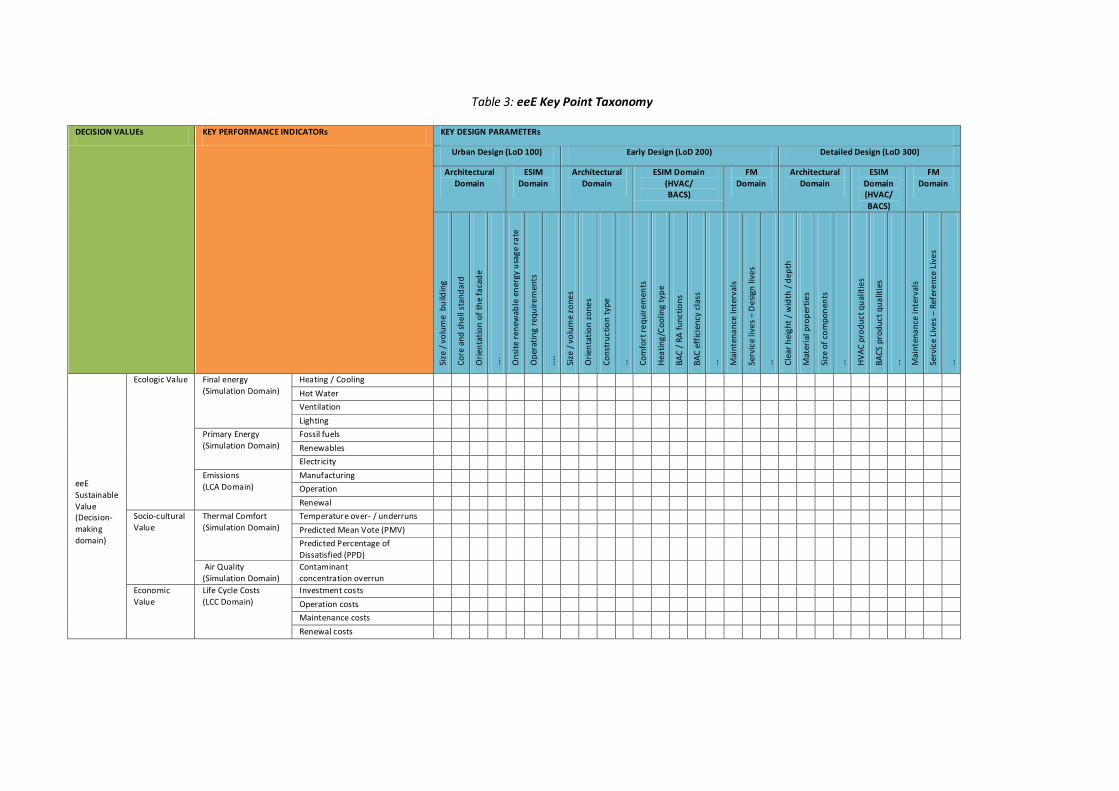
Table 3: eeE Key Point Taxonomy
DECISION VALUEs KEY PERFORMANCE INDICATORs KEY DESIGN PARAMETERs
Urban Design (LoD 100) Early Design (LoD 200) Detailed Design (LoD 300)
Architectural
Domain
ESIM
Domain
Architectural
Domain
ESIM Domain
(HVAC/ BACS)
FM
Domain
Architectural
Domain
ESIM
Domain (HVAC/
BACS)
FM
Domain
Size
/ v
olu
me
bu
ildin
g
Co
re a
nd
sh
ell
stan
dar
d
Ori
enta
tio
n o
f th
e fa
cad
e
….
On
site
ren
ewab
le e
ner
gy u
sag
e ra
te
Op
erat
ing
req
uir
em
ents
….
Size
/ v
olu
me
zon
es
Ori
enta
tio
n z
on
es
Co
nst
ruct
ion
typ
e
…
Co
mfo
rt r
eq
uir
emen
ts
Hea
tin
g/C
oo
ling
typ
e
BA
C /
RA
fu
nct
ion
s
BA
C e
ffic
ien
cy c
lass
…
Mai
nte
na
nce
Inte
rval
s
Serv
ice
live
s –
De
sign
live
s
…
Cle
ar h
eig
ht
/ w
idth
/ d
epth
Mat
eria
l pro
per
tie
s
Size
of
com
po
nen
ts
…
HV
AC
pro
du
ct q
ual
itie
s
BA
CS
pro
du
ct q
ua
litie
s
…
Mai
nte
na
nce
inte
rval
s
Serv
ice
Live
s –
Ref
ere
nce
Liv
es
…
eeE
Sustainable
Value (Decision-
making
domain)
Ecologic Value Final energy
(Simulation Domain)
Heating / Cooling Hot Water Ventilation Lighting
Primary Energy
(Simulation Domain)
Fossil fuels Renewables Electricity
Emissions
(LCA Domain)
Manufacturing Operation Renewal
Socio-cultural
Value
Thermal Comfort
(Simulation Domain)
Temperature over- / underruns Predicted Mean Vote (PMV) Predicted Percentage of
Dissatisfied (PPD)
Air Quality
(Simulation Domain)
Contaminant
concentration overrun
Economic
Value
Life Cycle Costs
(LCC Domain)
Investment costs Operation costs Maintenance costs Renewal costs
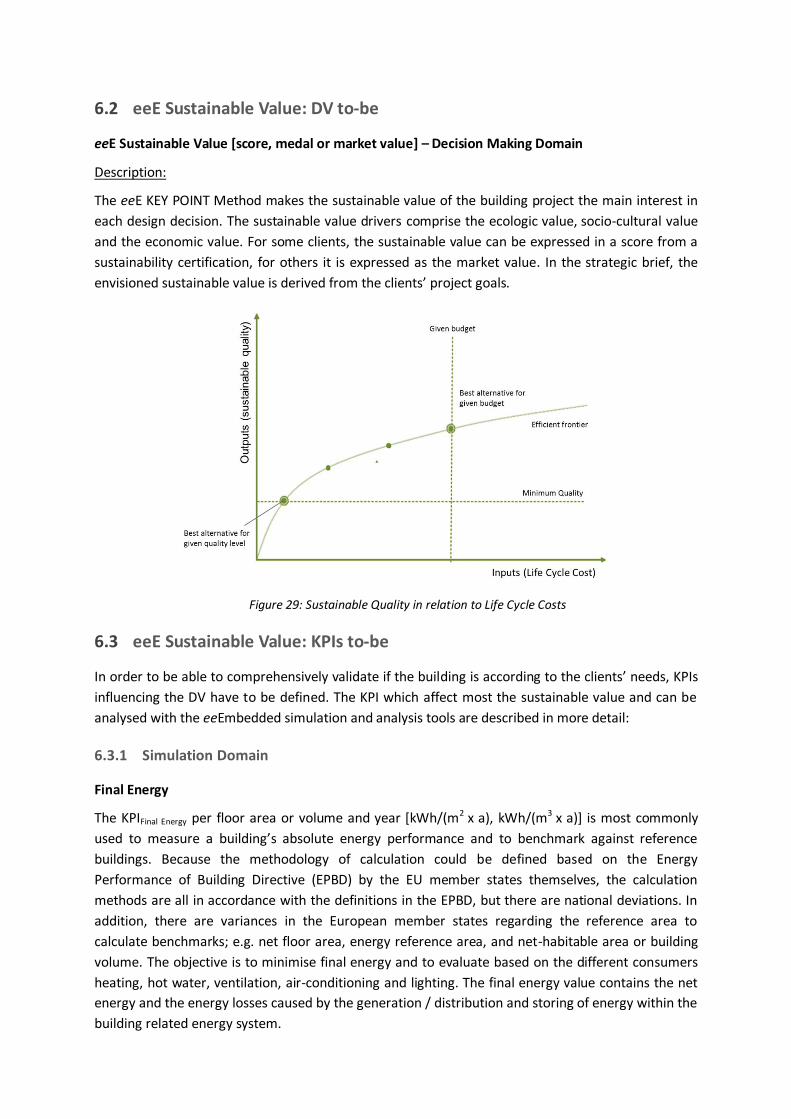
eeE Sustainable Value: DV to-be 6.2
eeE Sustainable Value [score, medal or market value] – Decision Making Domain
Description:
The eeE KEY POINT Method makes the sustainable value of the building project the main interest in
each design decision. The sustainable value drivers comprise the ecologic value, socio-cultural value
and the economic value. For some clients, the sustainable value can be expressed in a score from a
sustainability certification, for others it is expressed as the market value. In the strategic brief, the
envisioned sustainable value is derived from the clients’ project goals.
Figure 29: Sustainable Quality in relation to Life Cycle Costs
eeE Sustainable Value: KPIs to-be 6.3
In order to be able to comprehensively validate if the building is according to the clients’ needs, KPIs
influencing the DV have to be defined. The KPI which affect most the sustainable value and can be
analysed with the eeEmbedded simulation and analysis tools are described in more detail:
6.3.1 Simulation Domain
Final Energy
The KPIFinal Energy per floor area or volume and year [kWh/(m2 x a), kWh/(m3 x a)] is most commonly
used to measure a building’s absolute energy performance and to benchmark against reference
buildings. Because the methodology of calculation could be defined based on the Energy
Performance of Building Directive (EPBD) by the EU member states themselves, the calculation
methods are all in accordance with the definitions in the EPBD, but there are national deviations. In
addition, there are variances in the European member states regarding the reference area to
calculate benchmarks; e.g. net floor area, energy reference area, and net-habitable area or building
volume. The objective is to minimise final energy and to evaluate based on the different consumers
heating, hot water, ventilation, air-conditioning and lighting. The final energy value contains the net
energy and the energy losses caused by the generation / distribution and storing of energy within the
building related energy system.
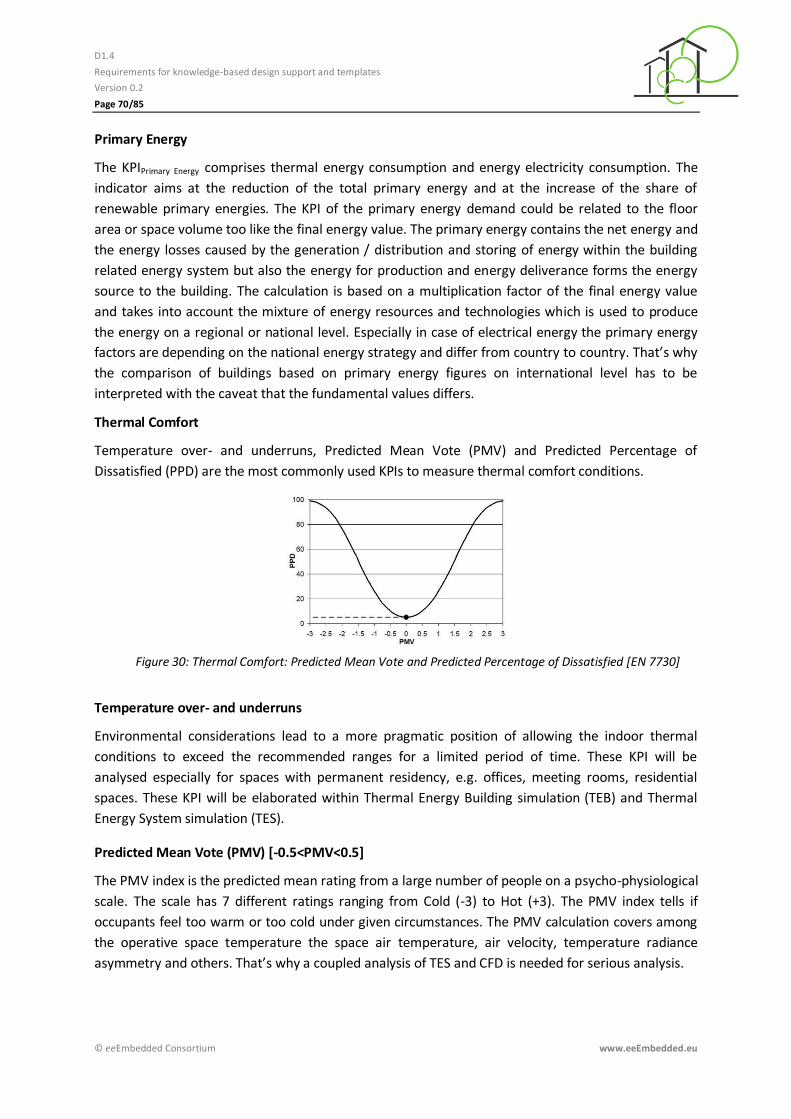
D1.4
Requirements for knowledge-based design support and templates
Version 0.2
Page 70/85
© eeEmbedded Consortium www.eeEmbedded.eu
Primary Energy
The KPIPrimary Energy comprises thermal energy consumption and energy electricity consumption. The
indicator aims at the reduction of the total primary energy and at the increase of the share of
renewable primary energies. The KPI of the primary energy demand could be related to the floor
area or space volume too like the final energy value. The primary energy contains the net energy and
the energy losses caused by the generation / distribution and storing of energy within the building
related energy system but also the energy for production and energy deliverance forms the energy
source to the building. The calculation is based on a multiplication factor of the final energy value
and takes into account the mixture of energy resources and technologies which is used to produce
the energy on a regional or national level. Especially in case of electrical energy the primary energy
factors are depending on the national energy strategy and differ from country to country. That’s why
the comparison of buildings based on primary energy figures on international level has to be
interpreted with the caveat that the fundamental values differs.
Thermal Comfort
Temperature over- and underruns, Predicted Mean Vote (PMV) and Predicted Percentage of
Dissatisfied (PPD) are the most commonly used KPIs to measure thermal comfort conditions.
Figure 30: Thermal Comfort: Predicted Mean Vote and Predicted Percentage of Dissatisfied [EN 7730]
Temperature over- and underruns
Environmental considerations lead to a more pragmatic position of allowing the indoor thermal
conditions to exceed the recommended ranges for a limited period of time. These KPI will be
analysed especially for spaces with permanent residency, e.g. offices, meeting rooms, residential
spaces. These KPI will be elaborated within Thermal Energy Building simulation (TEB) and Thermal
Energy System simulation (TES).
Predicted Mean Vote (PMV) [-0.5<PMV<0.5]
The PMV index is the predicted mean rating from a large number of people on a psycho-physiological
scale. The scale has 7 different ratings ranging from Cold (-3) to Hot (+3). The PMV index tells if
occupants feel too warm or too cold under given circumstances. The PMV calculation covers among
the operative space temperature the space air temperature, air velocity, temperature radiance
asymmetry and others. That’s why a coupled analysis of TES and CFD is needed for serious analysis.
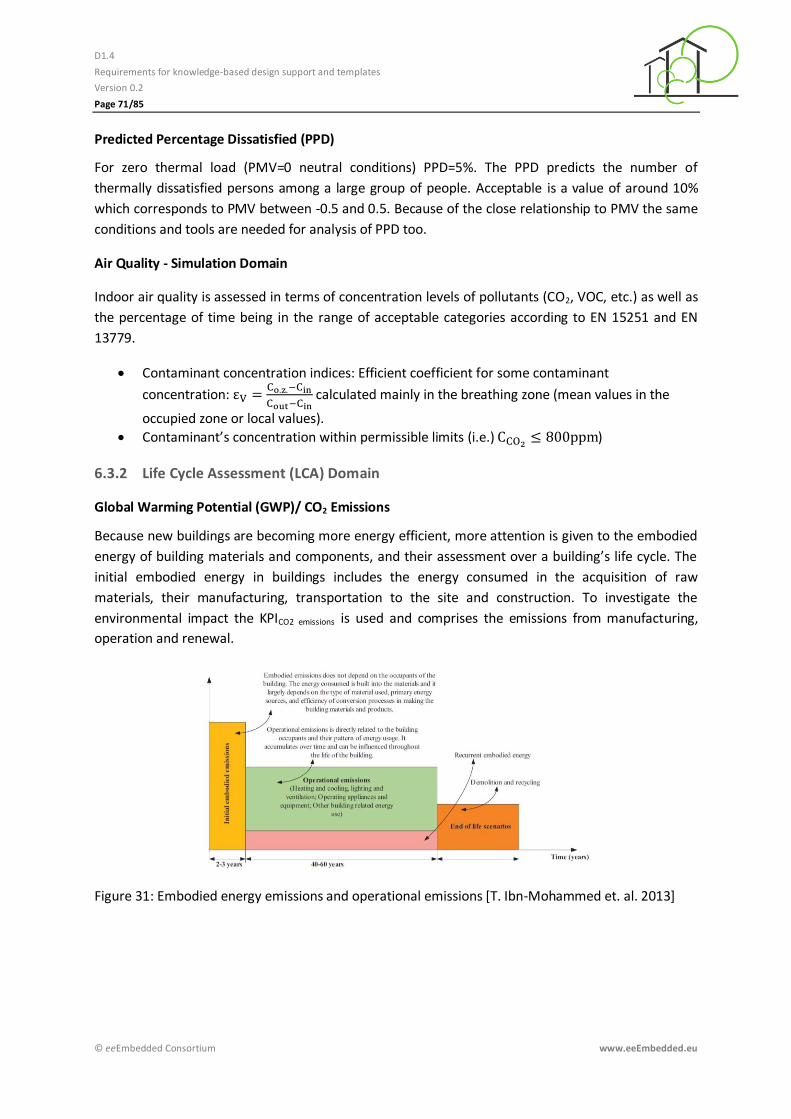
D1.4
Requirements for knowledge-based design support and templates
Version 0.2
Page 71/85
© eeEmbedded Consortium www.eeEmbedded.eu
Predicted Percentage Dissatisfied (PPD)
For zero thermal load (PMV=0 neutral conditions) PPD=5%. The PPD predicts the number of
thermally dissatisfied persons among a large group of people. Acceptable is a value of around 10%
which corresponds to PMV between -0.5 and 0.5. Because of the close relationship to PMV the same
conditions and tools are needed for analysis of PPD too.
Air Quality - Simulation Domain
Indoor air quality is assessed in terms of concentration levels of pollutants (CO2, VOC, etc.) as well as
the percentage of time being in the range of acceptable categories according to EN 15251 and EN
13779.
Contaminant concentration indices: Efficient coefficient for some contaminant
concentration:
calculated mainly in the breathing zone (mean values in the
occupied zone or local values).
Contaminant’s concentration within permissible limits (i.e.) )
6.3.2 Life Cycle Assessment (LCA) Domain
Global Warming Potential (GWP)/ CO2 Emissions
Because new buildings are becoming more energy efficient, more attention is given to the embodied
energy of building materials and components, and their assessment over a building’s life cycle. The
initial embodied energy in buildings includes the energy consumed in the acquisition of raw
materials, their manufacturing, transportation to the site and construction. To investigate the
environmental impact the KPICO2 emissions is used and comprises the emissions from manufacturing,
operation and renewal.
Figure 31: Embodied energy emissions and operational emissions [T. Ibn-Mohammed et. al. 2013]
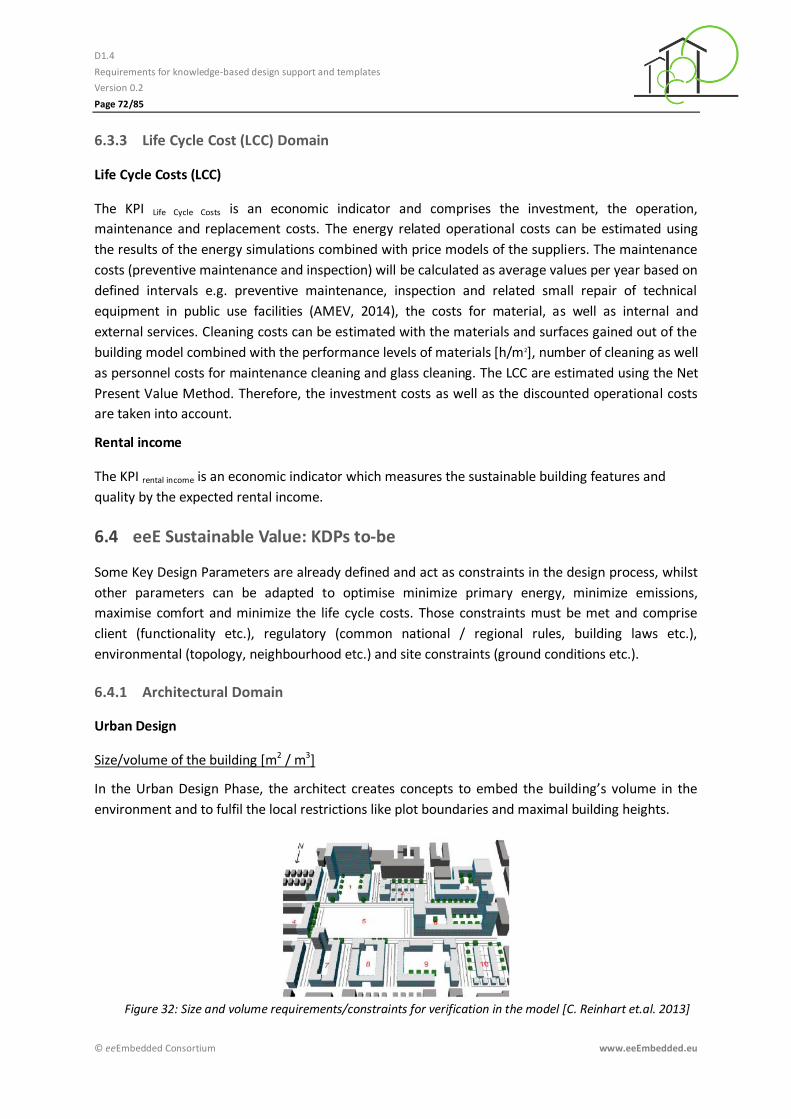
D1.4
Requirements for knowledge-based design support and templates
Version 0.2
Page 72/85
© eeEmbedded Consortium www.eeEmbedded.eu
6.3.3 Life Cycle Cost (LCC) Domain
Life Cycle Costs (LCC)
The KPI Life Cycle Costs is an economic indicator and comprises the investment, the operation,
maintenance and replacement costs. The energy related operational costs can be estimated using
the results of the energy simulations combined with price models of the suppliers. The maintenance
costs (preventive maintenance and inspection) will be calculated as average values per year based on
defined intervals e.g. preventive maintenance, inspection and related small repair of technical
equipment in public use facilities (AMEV, 2014), the costs for material, as well as internal and
external services. Cleaning costs can be estimated with the materials and surfaces gained out of the
building model combined with the performance levels of materials [h/m2], number of cleaning as well
as personnel costs for maintenance cleaning and glass cleaning. The LCC are estimated using the Net
Present Value Method. Therefore, the investment costs as well as the discounted operational costs
are taken into account.
Rental income
The KPI rental income is an economic indicator which measures the sustainable building features and
quality by the expected rental income.
eeE Sustainable Value: KDPs to-be 6.4
Some Key Design Parameters are already defined and act as constraints in the design process, whilst
other parameters can be adapted to optimise minimize primary energy, minimize emissions,
maximise comfort and minimize the life cycle costs. Those constraints must be met and comprise
client (functionality etc.), regulatory (common national / regional rules, building laws etc.),
environmental (topology, neighbourhood etc.) and site constraints (ground conditions etc.).
6.4.1 Architectural Domain
Urban Design
Size/volume of the building [m2 / m3]
In the Urban Design Phase, the architect creates concepts to embed the building’s volume in the
environment and to fulfil the local restrictions like plot boundaries and maximal building heights.
Figure 32: Size and volume requirements/constraints for verification in the model [C. Reinhart et.al. 2013]

D1.4
Requirements for knowledge-based design support and templates
Version 0.2
Page 73/85
© eeEmbedded Consortium www.eeEmbedded.eu
Key Requirement: Maximum Height Hmax = 10 m KDPh= 10-H ≥ 0 Key Requirement: Width Wparcel = 60 m KDPw= 60-W ≥ 0 Key Requirement: Length Lparcel = 120 m KDPL= 120-L ≥ 0 Key Requirement: Gross floor area Abuilding = 8000 m2
KDPA= A-8000 ≥ 0
Core & shell standard
If the objective is to design a passive house building optimally embedded in the neighbourhood, the following requirements have to be met: Key Requirement: Building insulation: UW-value < 0,15 W/(m²K) KDPUW= UW - 0,15 ≤ 0 Key Requirement: Triple glazing: UF-value < 0,8 W/(m²K) KDPUF= UF - 0,8 ≤ 0 Key Requirement: Infiltration rate: n50 < 0,6 h-1
KDPInf. = n50 - 0,6 ≤ 0 The surrounding context of natural and built elements directs the design towards choosing certain
materials, colours and textures.
Early Design
Size/volume of zones [m2 / m3]
In the Early Design Phase, design concepts are created based on the requirements and the cubature
of the urban design phase by detailing the room structure and geometry. The concepts have to fulfil
the space programme. In this space programme the needs of the other design domains (HVAC and
FM) are incorporated.
Figure 33: Space programme and space relationship requirements/constraints for verification in the model
Key Requirement: Space (e.g. A = 16m2) KDPA = A m2 – 16 m2 ≥ 0 Key Requirement: Functional relations (e.g. d =10 m) KDPd = 10 m - d m ≥ 0
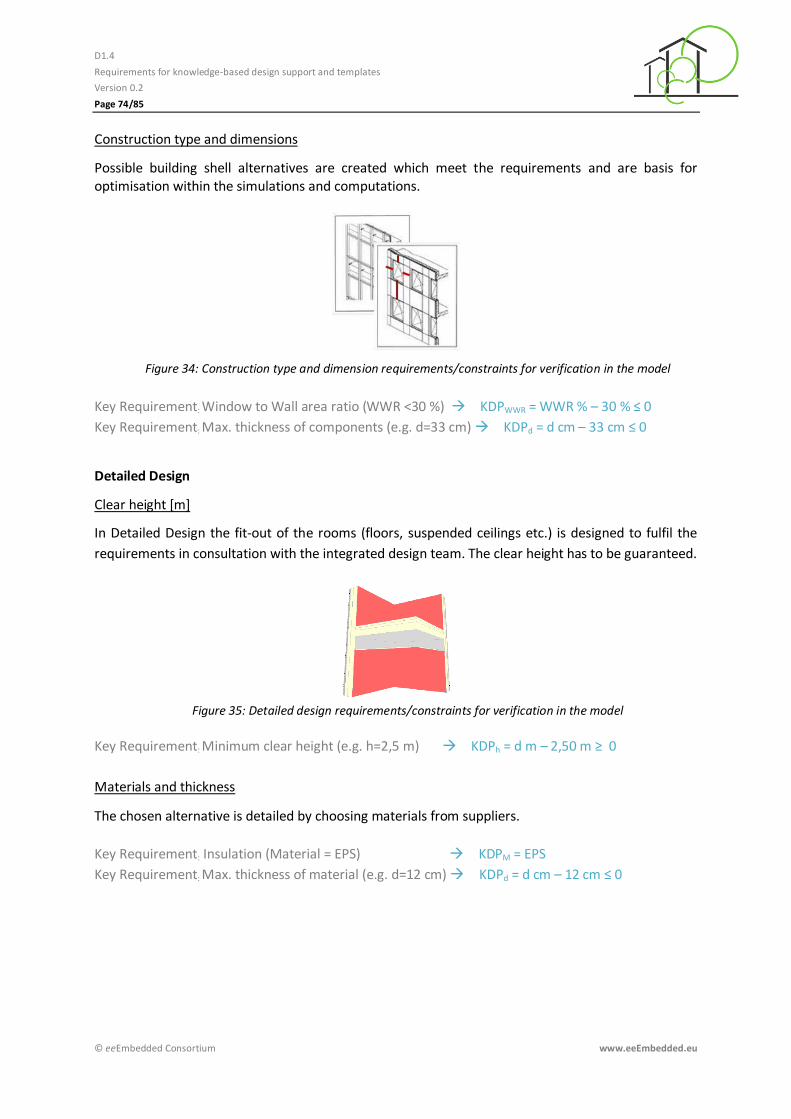
D1.4
Requirements for knowledge-based design support and templates
Version 0.2
Page 74/85
© eeEmbedded Consortium www.eeEmbedded.eu
Construction type and dimensions
Possible building shell alternatives are created which meet the requirements and are basis for optimisation within the simulations and computations.
Figure 34: Construction type and dimension requirements/constraints for verification in the model
Key Requirement: Window to Wall area ratio (WWR <30 %) KDPWWR = WWR % – 30 % ≤ 0
Key Requirement: Max. thickness of components (e.g. d=33 cm) KDPd = d cm – 33 cm ≤ 0
Detailed Design
Clear height [m]
In Detailed Design the fit-out of the rooms (floors, suspended ceilings etc.) is designed to fulfil the
requirements in consultation with the integrated design team. The clear height has to be guaranteed.
Figure 35: Detailed design requirements/constraints for verification in the model
Key Requirement: Minimum clear height (e.g. h=2,5 m) KDPh = d m – 2,50 m ≥ 0
Materials and thickness
The chosen alternative is detailed by choosing materials from suppliers.
Key Requirement: Insulation (Material = EPS) KDPM = EPS
Key Requirement: Max. thickness of material (e.g. d=12 cm) KDPd = d cm – 12 cm ≤ 0
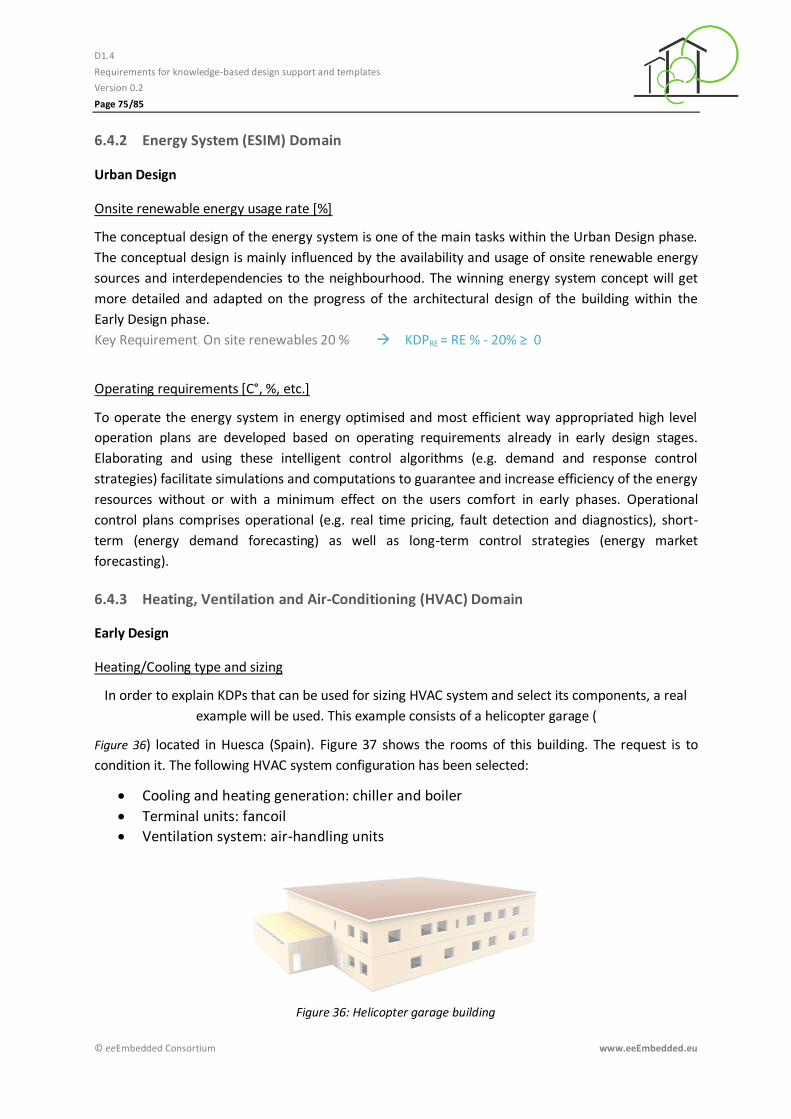
D1.4
Requirements for knowledge-based design support and templates
Version 0.2
Page 75/85
© eeEmbedded Consortium www.eeEmbedded.eu
6.4.2 Energy System (ESIM) Domain
Urban Design
Onsite renewable energy usage rate [%]
The conceptual design of the energy system is one of the main tasks within the Urban Design phase.
The conceptual design is mainly influenced by the availability and usage of onsite renewable energy
sources and interdependencies to the neighbourhood. The winning energy system concept will get
more detailed and adapted on the progress of the architectural design of the building within the
Early Design phase.
Key Requirement: On site renewables 20 % KDPRE = RE % - 20% ≥ 0
Operating requirements [C°, %, etc.]
To operate the energy system in energy optimised and most efficient way appropriated high level
operation plans are developed based on operating requirements already in early design stages.
Elaborating and using these intelligent control algorithms (e.g. demand and response control
strategies) facilitate simulations and computations to guarantee and increase efficiency of the energy
resources without or with a minimum effect on the users comfort in early phases. Operational
control plans comprises operational (e.g. real time pricing, fault detection and diagnostics), short-
term (energy demand forecasting) as well as long-term control strategies (energy market
forecasting).
6.4.3 Heating, Ventilation and Air-Conditioning (HVAC) Domain
Early Design
Heating/Cooling type and sizing
In order to explain KDPs that can be used for sizing HVAC system and select its components, a real
example will be used. This example consists of a helicopter garage (
Figure 36) located in Huesca (Spain). Figure 37 shows the rooms of this building. The request is to
condition it. The following HVAC system configuration has been selected:
Cooling and heating generation: chiller and boiler
Terminal units: fancoil
Ventilation system: air-handling units
Figure 36: Helicopter garage building
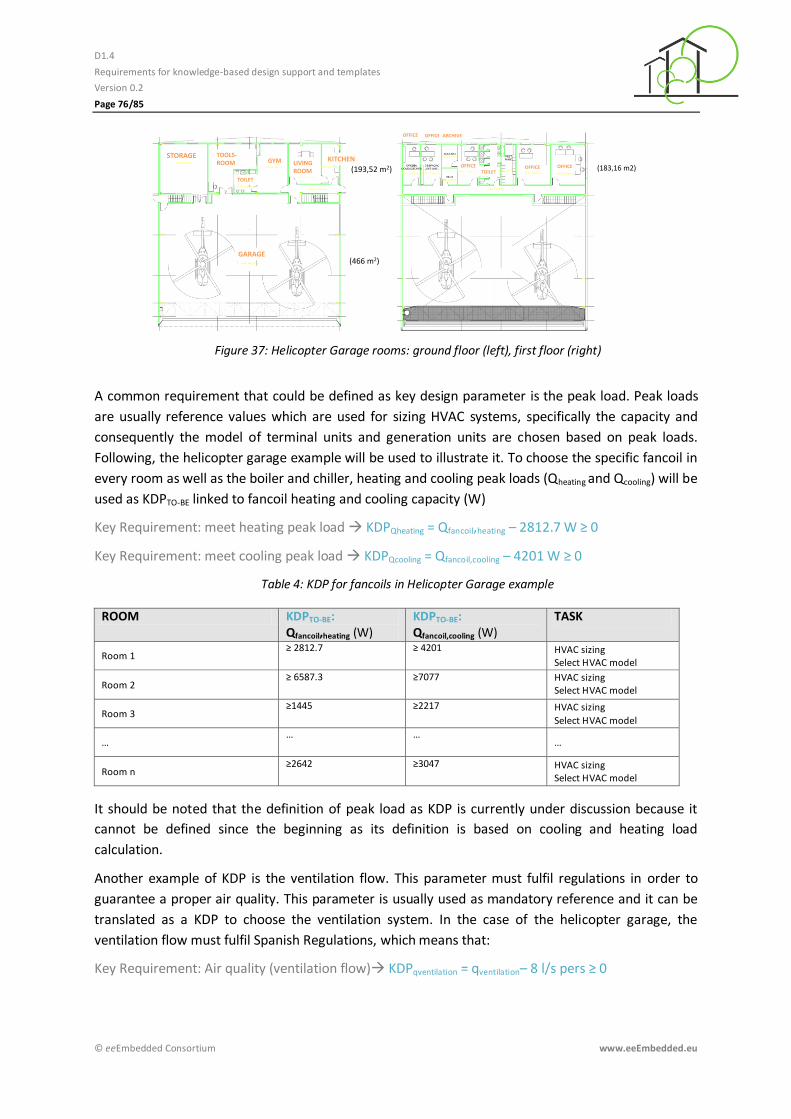
D1.4
Requirements for knowledge-based design support and templates
Version 0.2
Page 76/85
© eeEmbedded Consortium www.eeEmbedded.eu
Figure 37: Helicopter Garage rooms: ground floor (left), first floor (right)
A common requirement that could be defined as key design parameter is the peak load. Peak loads
are usually reference values which are used for sizing HVAC systems, specifically the capacity and
consequently the model of terminal units and generation units are chosen based on peak loads.
Following, the helicopter garage example will be used to illustrate it. To choose the specific fancoil in
every room as well as the boiler and chiller, heating and cooling peak loads (Qheating and Qcooling) will be
used as KDPTO-BE linked to fancoil heating and cooling capacity (W)
Key Requirement: meet heating peak load KDPQheating = Qfancoil,heating – 2812.7 W ≥ 0
Key Requirement: meet cooling peak load KDPQcooling = Qfancoil,cooling – 4201 W ≥ 0
Table 4: KDP for fancoils in Helicopter Garage example
ROOM KDPTO-BE: Qfancoil,heating (W)
KDPTO-BE: Qfancoil,cooling (W)
TASK
Room 1 ≥ 2812.7 ≥ 4201 HVAC sizing
Select HVAC model
Room 2 ≥ 6587.3 ≥7077 HVAC sizing
Select HVAC model
Room 3 ≥1445 ≥2217 HVAC sizing
Select HVAC model
… … …
…
Room n ≥2642 ≥3047 HVAC sizing
Select HVAC model
It should be noted that the definition of peak load as KDP is currently under discussion because it
cannot be defined since the beginning as its definition is based on cooling and heating load
calculation.
Another example of KDP is the ventilation flow. This parameter must fulfil regulations in order to
guarantee a proper air quality. This parameter is usually used as mandatory reference and it can be
translated as a KDP to choose the ventilation system. In the case of the helicopter garage, the
ventilation flow must fulfil Spanish Regulations, which means that:
Key Requirement: Air quality (ventilation flow) KDPqventilation = qventilation– 8 l/s pers ≥ 0
STORAGE
GARAGE
TOOLS-ROOM GYM KITCHEN
LIVINGROOM
(466 m2)
TOILET
(193,52 m2)
OFFICE OFFICE ARCHIVE
OFFICETOILET
OFFICE OFFICE (183,16 m2)
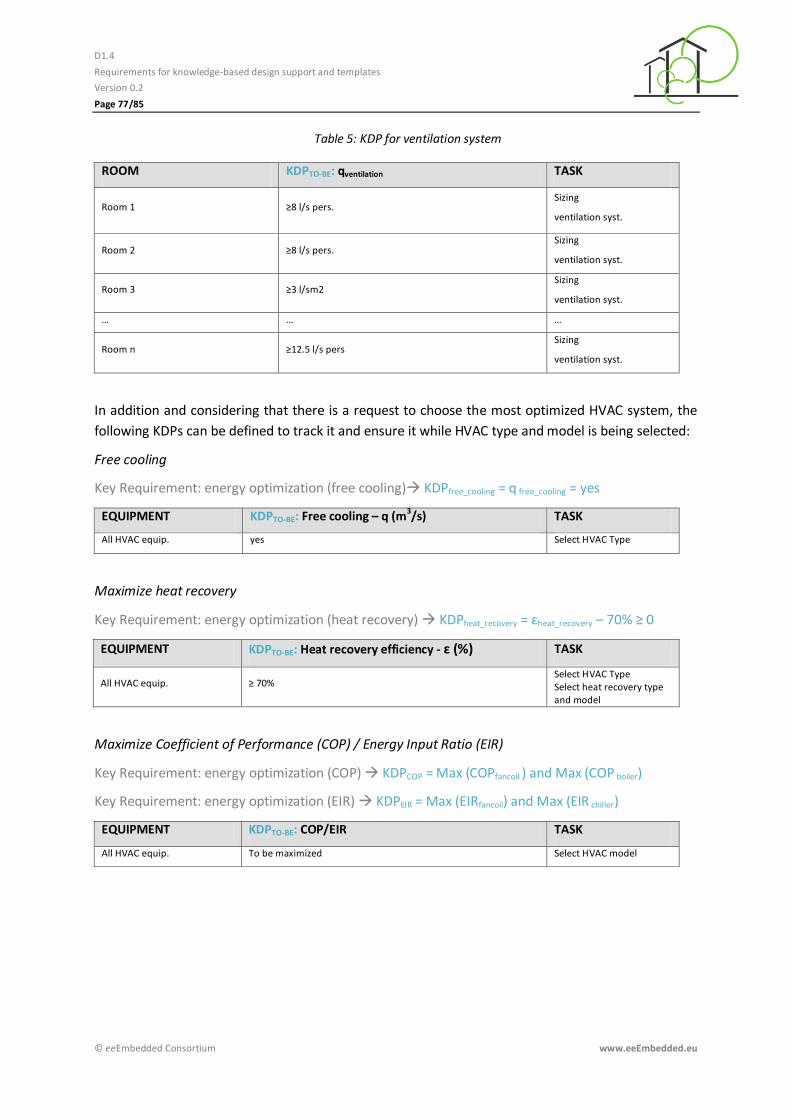
D1.4
Requirements for knowledge-based design support and templates
Version 0.2
Page 77/85
© eeEmbedded Consortium www.eeEmbedded.eu
Table 5: KDP for ventilation system
ROOM KDPTO-BE: qventilation TASK
Room 1 ≥8 l/s pers. Sizing
ventilation syst.
Room 2 ≥8 l/s pers. Sizing
ventilation syst.
Room 3 ≥3 l/sm2 Sizing
ventilation syst.
… … …
Room n ≥12.5 l/s pers Sizing
ventilation syst.
In addition and considering that there is a request to choose the most optimized HVAC system, the
following KDPs can be defined to track it and ensure it while HVAC type and model is being selected:
Free cooling
Key Requirement: energy optimization (free cooling) KDPfree_cooling = q free_cooling = yes
EQUIPMENT KDPTO-BE: Free cooling – q (m3/s) TASK
All HVAC equip. yes Select HVAC Type
Maximize heat recovery
Key Requirement: energy optimization (heat recovery) KDPheat_recovery = ɛheat_recovery – 70% ≥ 0
EQUIPMENT KDPTO-BE: Heat recovery efficiency - ɛ (%) TASK
All HVAC equip. ≥ 70% Select HVAC Type Select heat recovery type and model
Maximize Coefficient of Performance (COP) / Energy Input Ratio (EIR)
Key Requirement: energy optimization (COP) KDPCOP = Max (COPfancoil ) and Max (COP boiler)
Key Requirement: energy optimization (EIR) KDPEIR = Max (EIRfancoil) and Max (EIR chiller)
EQUIPMENT KDPTO-BE: COP/EIR TASK
All HVAC equip. To be maximized Select HVAC model
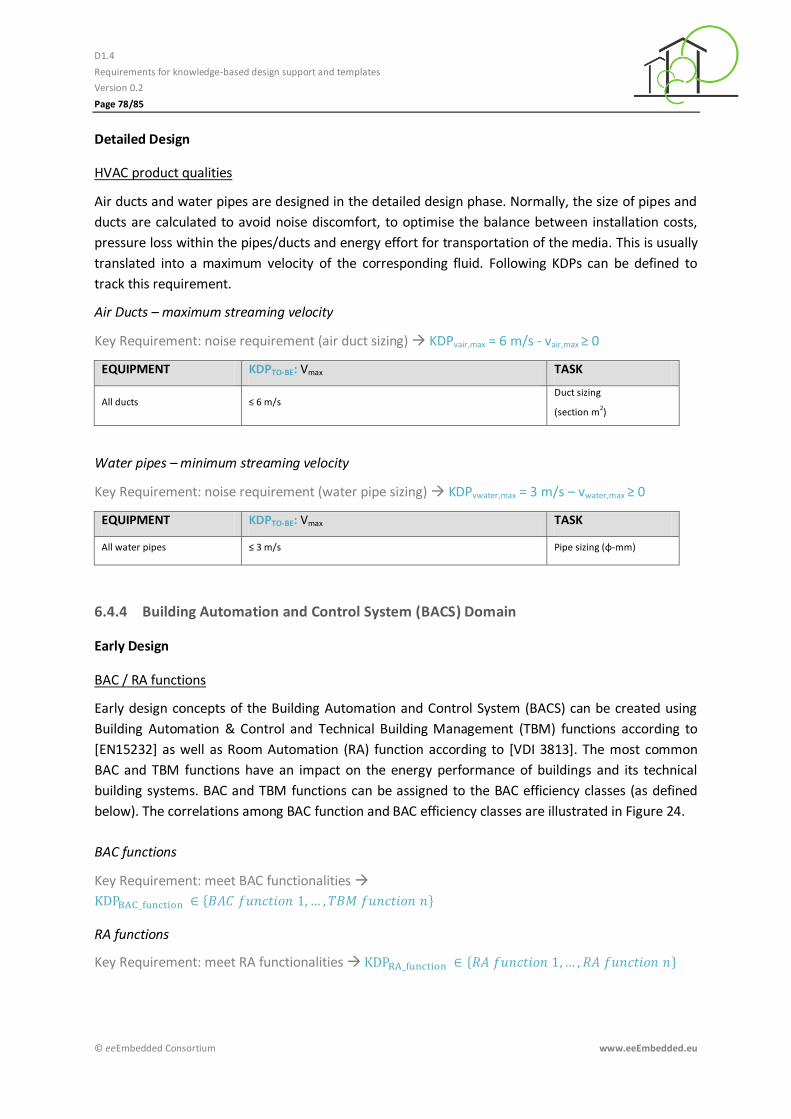
D1.4
Requirements for knowledge-based design support and templates
Version 0.2
Page 78/85
© eeEmbedded Consortium www.eeEmbedded.eu
Detailed Design
HVAC product qualities
Air ducts and water pipes are designed in the detailed design phase. Normally, the size of pipes and
ducts are calculated to avoid noise discomfort, to optimise the balance between installation costs,
pressure loss within the pipes/ducts and energy effort for transportation of the media. This is usually
translated into a maximum velocity of the corresponding fluid. Following KDPs can be defined to
track this requirement.
Air Ducts – maximum streaming velocity
Key Requirement: noise requirement (air duct sizing) KDPvair,max = 6 m/s - vair,max ≥ 0
EQUIPMENT KDPTO-BE: Vmax TASK
All ducts ≤ 6 m/s Duct sizing
(section m2)
Water pipes – minimum streaming velocity
Key Requirement: noise requirement (water pipe sizing) KDPvwater,max = 3 m/s – vwater,max ≥ 0
EQUIPMENT KDPTO-BE: Vmax TASK
All water pipes ≤ 3 m/s Pipe sizing (φ-mm)
6.4.4 Building Automation and Control System (BACS) Domain
Early Design
BAC / RA functions
Early design concepts of the Building Automation and Control System (BACS) can be created using
Building Automation & Control and Technical Building Management (TBM) functions according to
[EN15232] as well as Room Automation (RA) function according to [VDI 3813]. The most common
BAC and TBM functions have an impact on the energy performance of buildings and its technical
building systems. BAC and TBM functions can be assigned to the BAC efficiency classes (as defined
below). The correlations among BAC function and BAC efficiency classes are illustrated in Figure 24.
BAC functions
Key Requirement: meet BAC functionalities
{ }
RA functions
Key Requirement: meet RA functionalities { }
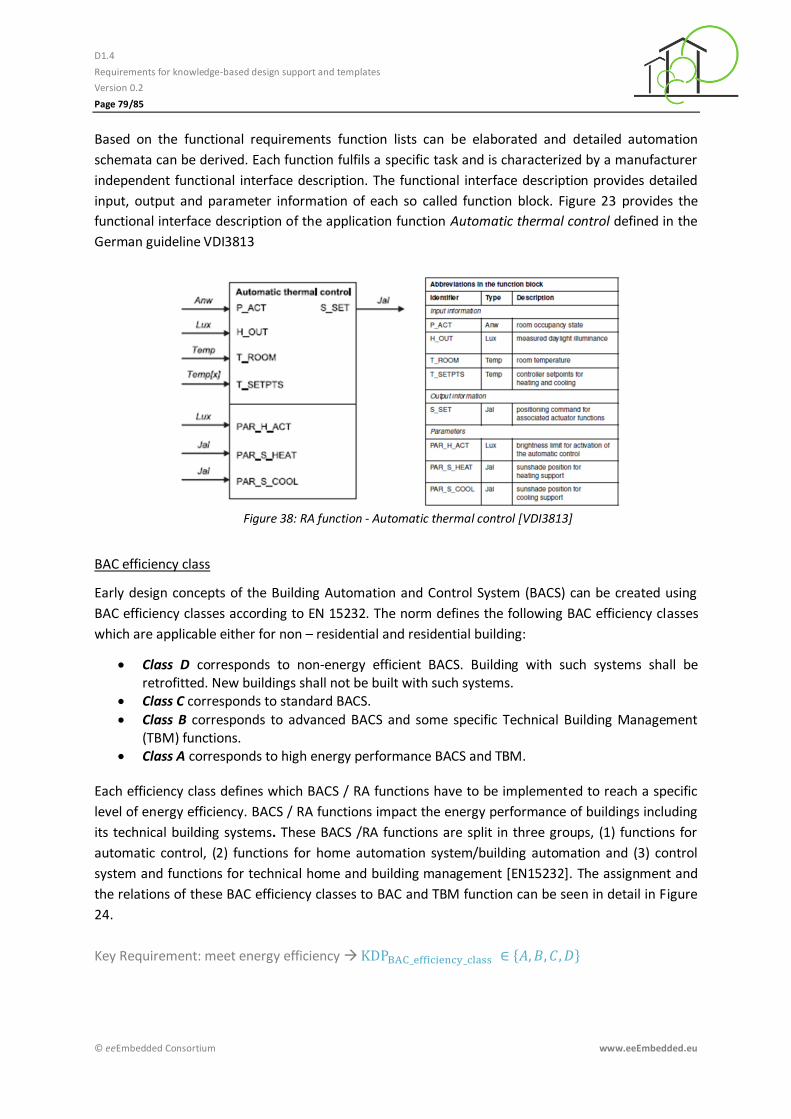
D1.4
Requirements for knowledge-based design support and templates
Version 0.2
Page 79/85
© eeEmbedded Consortium www.eeEmbedded.eu
Based on the functional requirements function lists can be elaborated and detailed automation
schemata can be derived. Each function fulfils a specific task and is characterized by a manufacturer
independent functional interface description. The functional interface description provides detailed
input, output and parameter information of each so called function block. Figure 23 provides the
functional interface description of the application function Automatic thermal control defined in the
German guideline VDI3813
Figure 38: RA function - Automatic thermal control [VDI3813]
BAC efficiency class
Early design concepts of the Building Automation and Control System (BACS) can be created using
BAC efficiency classes according to EN 15232. The norm defines the following BAC efficiency classes
which are applicable either for non – residential and residential building:
Class D corresponds to non-energy efficient BACS. Building with such systems shall be retrofitted. New buildings shall not be built with such systems.
Class C corresponds to standard BACS.
Class B corresponds to advanced BACS and some specific Technical Building Management (TBM) functions.
Class A corresponds to high energy performance BACS and TBM.
Each efficiency class defines which BACS / RA functions have to be implemented to reach a specific
level of energy efficiency. BACS / RA functions impact the energy performance of buildings including
its technical building systems. These BACS /RA functions are split in three groups, (1) functions for
automatic control, (2) functions for home automation system/building automation and (3) control
system and functions for technical home and building management [EN15232]. The assignment and
the relations of these BAC efficiency classes to BAC and TBM function can be seen in detail in Figure
24.
Key Requirement: meet energy efficiency { }
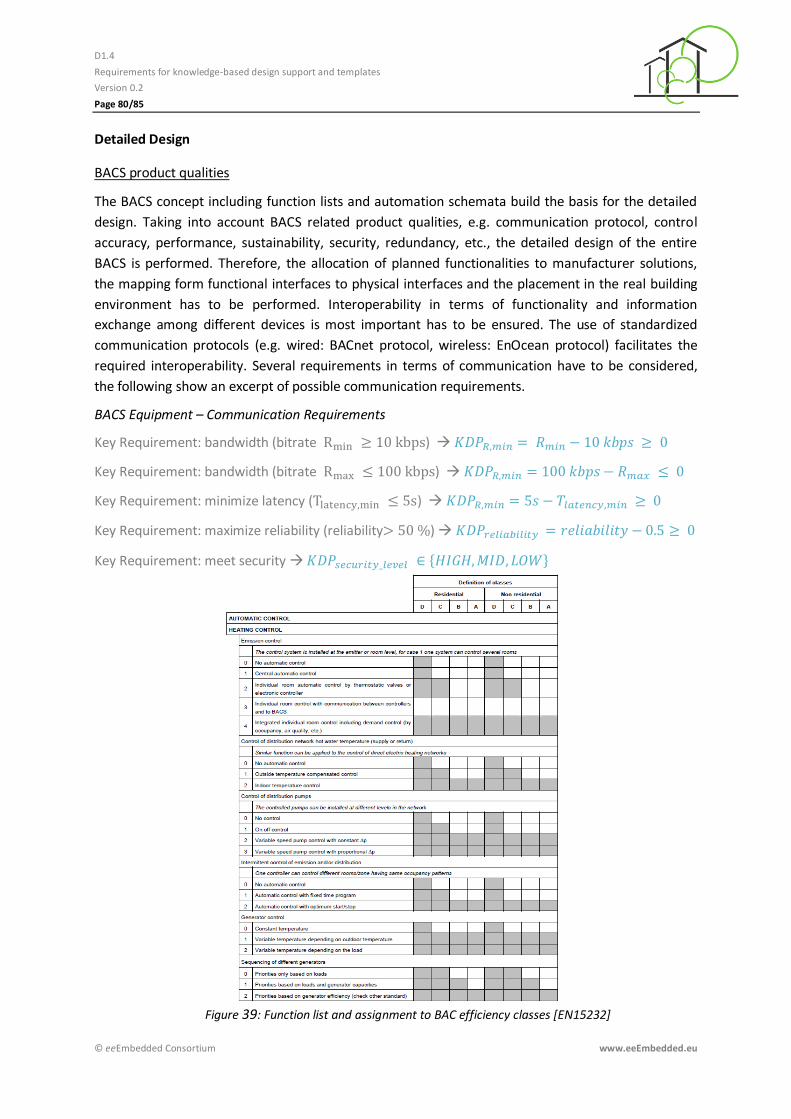
D1.4
Requirements for knowledge-based design support and templates
Version 0.2
Page 80/85
© eeEmbedded Consortium www.eeEmbedded.eu
Detailed Design
BACS product qualities
The BACS concept including function lists and automation schemata build the basis for the detailed
design. Taking into account BACS related product qualities, e.g. communication protocol, control
accuracy, performance, sustainability, security, redundancy, etc., the detailed design of the entire
BACS is performed. Therefore, the allocation of planned functionalities to manufacturer solutions,
the mapping form functional interfaces to physical interfaces and the placement in the real building
environment has to be performed. Interoperability in terms of functionality and information
exchange among different devices is most important has to be ensured. The use of standardized
communication protocols (e.g. wired: BACnet protocol, wireless: EnOcean protocol) facilitates the
required interoperability. Several requirements in terms of communication have to be considered,
the following show an excerpt of possible communication requirements.
BACS Equipment – Communication Requirements
Key Requirement: bandwidth (bitrate )
Key Requirement: bandwidth (bitrate )
Key Requirement: minimize latency ( )
Key Requirement: maximize reliability (reliability )
Key Requirement: meet security { }
Figure 39: Function list and assignment to BAC efficiency classes [EN15232]
D1.4
Requirements for knowledge-based design support and templates
Version 0.2
Page 81/85
© eeEmbedded Consortium www.eeEmbedded.eu
6.4.5 Facility Management (FM) Domain
Early Design
Maintenance Intervals - preventive maintenance, inspection, repair [p.a.]
Preventive maintenance (measures for preserving the desired status), inspection (measures for
determining and assessing the actual status) and repair (measures for restoring the desired status)
have a huge impact on energy efficiency, comfort, emissions and Life Cycle Costs. Therefore, the FM
domain specifies maintenance intervals as requirements which will consult the design team in
choosing construction and HVAC types. Maintenance requirements should be structured with
reference to the systems to be maintained.
Service lives: Design lives [a]
While maintenance is concerned with the continued preservation of working order, renewal is a
question of a replacement investment, which is made necessary because of old age, damage or
obsolescence due to technical progress. In this case the renewals are usually to be accounted for in
relation to all capital assets [VDI 2067]. The design life of an element or product is the length of time
that it may be expected to perform its required function. Based on the design life of the whole
building which is expected by the client, the FM domain specifies design lives for major building and
HVAC components [ISO 15686].
Key Requirement: Expected Building Life Time KDP= Total Gross Building Area KDP= Percent Cooled Floor Area KDP= Percent Heated Cooled Area KDP= Average percent building occupancy KDP= Occupancy date KDP= Dominant Building Function KDP= Number of above ground stories KDP= Equipment life cost factor KDP= Seasonal Operation KDP= Hours of operation list Detailed Design
Accessibility of components
All maintenance relevant equipment and accessories such as fans, valves, piping, etc. should be easily accessible. Inventory of items to be inspected and maintained
These are components of HVAC systems that are inventoried for service life and maintenance cost
data collection and reporting. Some examples include:
Air Distribution Equipment
Air Distribution Equipment Component
Cooling Equipment
Cooling Equipment Component Heat Rejection Equipment
Heat Rejection Equipment Component
D1.4
Requirements for knowledge-based design support and templates
Version 0.2
Page 82/85
© eeEmbedded Consortium www.eeEmbedded.eu
Pump Equipment
Pump Component
Heating Equipment
Heating Equipment Component
Building Control System Equipment Building Control System Component
Miscellaneous Equipment
Each system and component will contain different parameters.
Maintenance Intervals - preventive maintenance, inspection, repair [p.a.]
On the basis of the LCA/LCC analysis results in early design phase, the FM domain specifies
maintenance intervals as requirements which will consult the design team in choosing products (for
HVAC and BACS components). Maintenance requirements should be structured with reference to the
products to be maintained.
Key Requirement:: Annual HVAC Maintenance Costs
Key Design Parameters Description
Start Date Start date of this period of costs
End Date End date of this period of costs
Total Maintenance Costs Total (planned and unplanned) maintenance costs for all current HVAC systems
In House Costs Percentage Percentage of total HVAC maintenance performed by in-house employees
Contract Labor Costs Percentage
Percentage of total HVAC maintenance performed by contract labor
Source of Cost Data Source of cost data (If multiple sources apply, choose the most prominent.)
In House Labor Is Included In-house labor (including base rate, fringe benefits, WC, fixed OH) costs are included in total maintenance costs
Contract Labor Is Included Contract labor (including base rate, fringe benefits, WC, fixed OH, operating OH, profit) costs are included in total maintenance costs
Materials Supplies Parts Materials, supplies, and parts costs are included in total maintenance costs
Materials Supplies Parts Sales Tax
Sales tax on Materials, supplies, and parts costs are included in total maintenance costs
Equipment Equipment costs are included in total maintenance costs
Equipment Sales Tax Sales tax on Equipment costs are included in total maintenance costs
Service lives: Reference lives [a]
On the basis of the LCA/LCC analysis results in early design, the FM domain defines reference lives as
requirements/constraints for the Architecture and HVAC domain to identify products from
manufacturers/suppliers during detailed design.
D1.4
Requirements for knowledge-based design support and templates
Version 0.2
Page 83/85
© eeEmbedded Consortium www.eeEmbedded.eu
7 Conclusions
This deliverable report presents the concepts, procedures and software solutions for the holistic
multi-disciplinary Key Point Framework which forms the foundation for the suggested new design
methodology. The Key Point Structure has been further developed, based on the fundamental
structure and basis of work environments, the state of the art and its existing gaps as well as the
outputs of WP1 regarding the Key Point Methodology. The Key Point Structure consists of the
hierarchically categorized Key Point Groups Decision Value, Key Performance Indicator and Key
Design Parameter and their respective to-be/as-is values. The essence of the overall concept of the
eeE Key Point Framework is in the structured evaluation of design alternatives and their approval or
rejection with the help of the Key Points.
Therefor procedures to evaluate design alternatives and to evaluate requirements as well as to setup
Key Points have been discussed. All of the Key Point Groups have been specified to assist the eeE
design process. This led to the new development of a Key Point Workflow (UML), with reference to
the developed generic workflow (D1.2), as basis for Key Point components discussion. For the third
pillar, the software solution required S/W components based on the Key Point Workflow as well as
respective implementation plans have been developed. Additionally, practical examples for the three
Key Point Groups have been introduced and summarized in the new project related ee Sustainable
Value. Thus both, a sound basis for the further development in the WPs 3-7 as well as a theoretical
contribution towards an improved energy-efficient design process have been made.
Further fields of work including the Key Point Framework include:
In D2.3 “Holistic KPI based design methodology” a formalisation of the examples introduced in this deliverable is been made,
As part of D3.2 “Sustainability prognosis, quality and ROI methods” methods for aggregation of Key Points and prototypes of mathematical methods based on link model information as well as the ontology model for multi-criteria optimization will be developed,
A first idea of Key Point Ontology will be part of D5.1 “Interoperability and ontology framework”,
An implementation of the Key Point Ontology will be done in D5.2 “Interoperability System”
The eeE ontology for decomposition of Key Points will be further specified and developed in D6.5 “Optimization of multi-model criteria”.
D1.4
Requirements for knowledge-based design support and templates
Version 0.2
Page 84/85
© eeEmbedded Consortium www.eeEmbedded.eu
References
[Alwaera et al., 2010] H. ALwaera , D.J. Clements-Croomeb, Key performance indicators (KPIs) and priority setting in using
the multi-attribute approach for assessing sustainable intelligent buildings, Building and
Environment, Volume 45, Issue 4, April 2010, Pages 799–807, DOI:10.1016/j.buildenv.2009.08.019.
[Balaras et al., 2013] Balaras C., Dascalaki E., Guruz R., Katranuschkov, P. (2013): ISES D9+ (Additional Deliverable): Energy-related key performance indicators within ISES © ISES Consortium, Brussels. [eeE. 2015] eeEmbedded 2013-17, EU FP7 Project No. 609349. eeEmbedded [online],
http://www.eeEmbedded.eu.
[Geißler et al., 2014] Geißler, M.C., Guruz, R., van Woudenberg, W. (2014); eeEmbedded Deliverable D1.1: Vision and requirements for a KPI-based holistic multi-disciplinary design, © eeEmbedded Consortium, Brussels. [Gil et al., 2012] Jorge Gil, José Pinto Duarte, Tools for evaluation the sustainability of urban design: review,
Proceeding of the Institution of Civil Engineers-Urban design and planning, July 2012, DOI:
10.1680/udap.11.00048.
[Gray et al., 2006] Prof. Colin Gray and Dr. Salam Al Bizri, Development of QFD to support decision making during the briefing process, Joint International Conference on Computing and Decision Making in Civil and Building Engineering [Hopfe et al., 2006] Christina J. Hopfe, Christian Struck and Jan Hensen, Design optimisation during the different design stages, http://www.bwk.tue.nl/bps/hensen/publications/06_acdm_hopfe_struck.pdf, Proceedings of the 7th conference on adaptive computing in design and manufacture, 25-27th April, p. 275-278. [Ibáñez-Forés et al., 2014] V. Ibáñez-Forés, M.D. Bovea, V. Pérez-Belis, A holistic review of applied methodologies for assessing
and selecting the optimal technological alternative from a sustainability perspective, Journal of
Cleaner Production 70 (2014) 259-281, DOI: 10.1016/j.jclepro.2014.01.082.
[Ibn-Mohammed et al., 2013] T. Ibn-Mohammed, R. Grennough, S. Taylor, L.Ozawa-Meida, A. Acquaye, Operational vs. Embodied
Emissions in Buildings - A Review of Current Trends, Energy and Buildings (Impact Factor: 2.47).
11/2013, http://dx.doi.org/10.1016/j.enbuild.2013.07.026, DOI: 10.1016/j.enbuild.2013.07.026
[Jansson et al., 2013] Gustav Jansson, Jutta Schade, Thomas Olofsson, Requirements management for the design of energy
efficient buildings, Journal of Information Technology in Construction, Vol. 18 (2013), Pg321.
[Liu et al., 2013] R. Liu and R. R. A. Issa, BIM for facility management: Design for maintainability with BIM tools,
http://www.iaarc.org/publications/fulltext/isarc2013Paper191.pdf
D1.4
Requirements for knowledge-based design support and templates
Version 0.2
Page 85/85
© eeEmbedded Consortium www.eeEmbedded.eu
[Reinhart et al., 2013] Christoph F Reinhart, Timur Dogan, J Alstan Jakubiec, Tarek Rakha and Andrew Sang, UMI - An urban
simulation environment for building energy use, daylighting and walkability, Proceedings of BS2013:
13th Conference of International Building Performance Simulation Association, Chambéry, France,
August 26-28 - 476, http://www.ibpsa.org/proceedings/BS2013/p_1404.pdf
[Ritter et al., 2013] F. Ritter, Ph. Geyer & A. Borrmann, The design space exploration assistance method: constraints and objectives, http://www.cms.bgu.tum.de/publications/2013_Ritter_CONVR.pdf [Shao et al., 2014] Yunming Shao, Philipp Geyer, Werner Lang, Integrating requirement analysis and multi-objective optimization for office building energy retrofit strategies, http://dx.doi.org/10.1016/j.enbuild.2014.07.030, © 2014 Elsevier B.V. [Wang et al., 2013] Ying Wang, Xiangyu Wang, Jun Wang, Ping Yung, and Guo Jun, Engagement of Facilities Management
in Design Stage through BIM: Framework and a Case Study, Advances in Civil Engineering
Volume 2013 (2013), Article ID 189105, 8 pages,
http://www.hindawi.com/journals/ace/2013/189105/
[Wikipedia, 2015] [online] 14.12.2014 http://en.wikipedia.org/wiki/Software_framework
[Zellner et al., 2015] Zellner, R., Guruz, R., Mosch, M., Katranuschkov, P., Tøn, A. & Kaiser, J. (2015): eeEmbedded
Deliverable D1.5: System Architecture of the virtual holistic design lab and office © eeEmbedded
Consortium, Brussels.
[EN15232] DIN EN 15232 - Energy performance of buildings – Impact of Building Automation, Controls and
Building Management. German version FprEN 15232:2011.
[VDI3813] VDI 3813 – Part 2 2011. Building automation and control systems (BACS) - Room control functions (RA
functions). VDI, Beuth Verlag, Berlin.
[ISO16484] DIN EN ISO 16484 - Building automation and control systems (BACS) -- Part 3: Functions.
[eu.bac] eu.bac – Certifying Energy Efficiency of Building Automation and Control Systems, a first delivery and
during the lifetime – Part 4: Specification of Key Performance Indicators.